About one in five companies in the EU report to
Author : olivia-moreira | Published Date : 2025-06-23
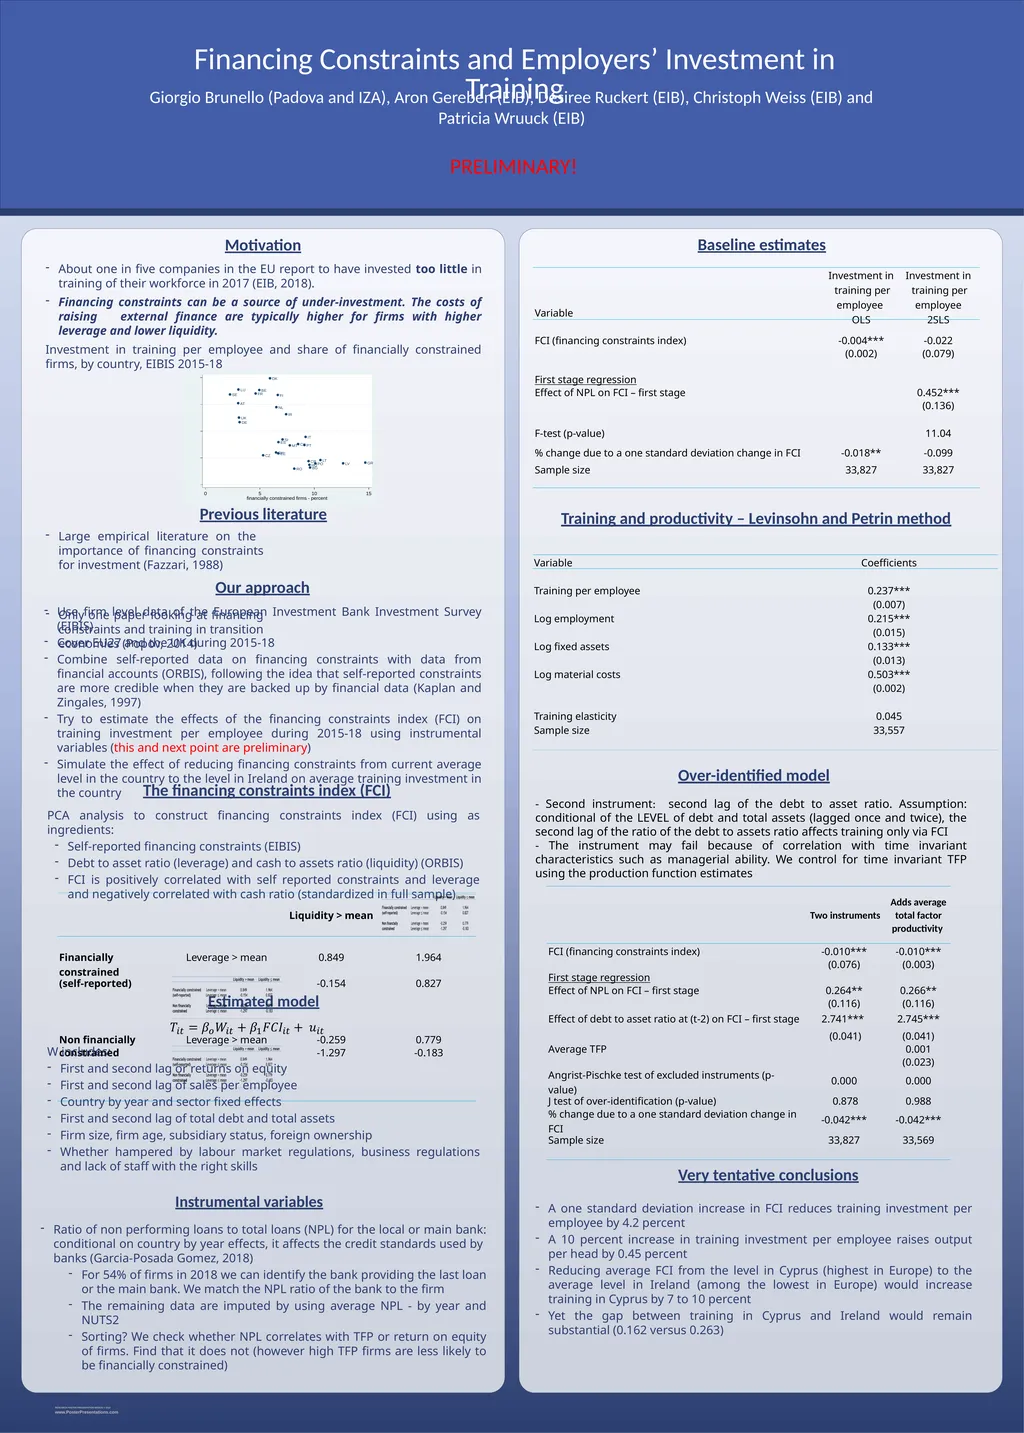
Description: About one in five companies in the EU report to have invested too little in training of their workforce in 2017 EIB 2018 Financing constraints can be a source of underinvestment The costs of raising external finance are typically
Presentation Embed Code
Download Presentation
Download
Presentation The PPT/PDF document
"About one in five companies in the EU report to" is the property of its rightful owner.
Permission is granted to download and print the materials on this website for personal, non-commercial use only,
and to display it on your personal computer provided you do not modify the materials and that you retain all
copyright notices contained in the materials. By downloading content from our website, you accept the terms of
this agreement.
Transcript:About one in five companies in the EU report to:
About one in five companies in the EU report to have invested too little in training of their workforce in 2017 (EIB, 2018). Financing constraints can be a source of under-investment. The costs of raising external finance are typically higher for firms with higher leverage and lower liquidity. Investment in training per employee and share of financially constrained firms, by country, EIBIS 2015-18 Previous literature Baseline estimates Very tentative conclusions Giorgio Brunello (Padova and IZA), Aron Gereben (EIB), Desiree Ruckert (EIB), Christoph Weiss (EIB) and Patricia Wruuck (EIB) Financing Constraints and Employers’ Investment in Training Motivation Large empirical literature on the importance of financing constraints for investment (Fazzari, 1988) Only one paper looking at financing constraints and training in transition economies (Popov, 2014) Our approach Use firm level data of the European Investment Bank Investment Survey (EIBIS) Cover EU27 and the UK during 2015-18 Combine self-reported data on financing constraints with data from financial accounts (ORBIS), following the idea that self-reported constraints are more credible when they are backed up by financial data (Kaplan and Zingales, 1997) Try to estimate the effects of the financing constraints index (FCI) on training investment per employee during 2015-18 using instrumental variables (this and next point are preliminary) Simulate the effect of reducing financing constraints from current average level in the country to the level in Ireland on average training investment in the country The financing constraints index (FCI) Estimated model PCA analysis to construct financing constraints index (FCI) using as ingredients: Self-reported financing constraints (EIBIS) Debt to asset ratio (leverage) and cash to assets ratio (liquidity) (ORBIS) FCI is positively correlated with self reported constraints and leverage and negatively correlated with cash ratio (standardized in full sample) Table 3. Average values of the financing constraints index FCI. By level of liquidity, solvency and self-reported financial constraints AC. 2015-18. Note: Firms are weighted with value added weights provided by EIBIS to obtain values that are representative of the business population. Number of observations: 33,827. W includes: First and second lag or returns on equity First and second lag of sales per employee Country by year and sector fixed effects First and second lag of total debt and total assets Firm size, firm age, subsidiary status, foreign ownership Whether hampered by labour market regulations, business regulations and lack of staff with the right skills Ratio of non performing loans to total loans (NPL) for the