
ACCCI Presentation: A New US Administration and
OM
Published · 14 slides · 0 views
1 / 1



Description
ACCCI Presentation: A New US Administration and Changing Global Coking Coal Market Dynamics May 2025 McCloskey Research Charles Dayton Associate Director, Research and Analysis cdaytonopisnet.com Agenda Tariffs and Why Theyre Good For
Related Topics
Share
Embed code
Download this presentation From Below
"ACCCI Presentation: A New US Administration and" is the property of its rightful owner. Permission is granted to download and print the materials on this website for personal, non-commercial use only, and to display it on your personal computer provided you do not modify the materials and that you retain all copyright notices contained in the materials. By downloading content from our website, you accept the terms of this agreement.
Presentation Transcript
01
ACCCI Presentation: A New US Administration and Changing Global Coking Coal Market Dynamics May 2025 McCloskey Research Charles Dayton – Associate Director, Research and Analysis
cdayton@opisnet.com<br>
cdayton@opisnet.com<br>
02
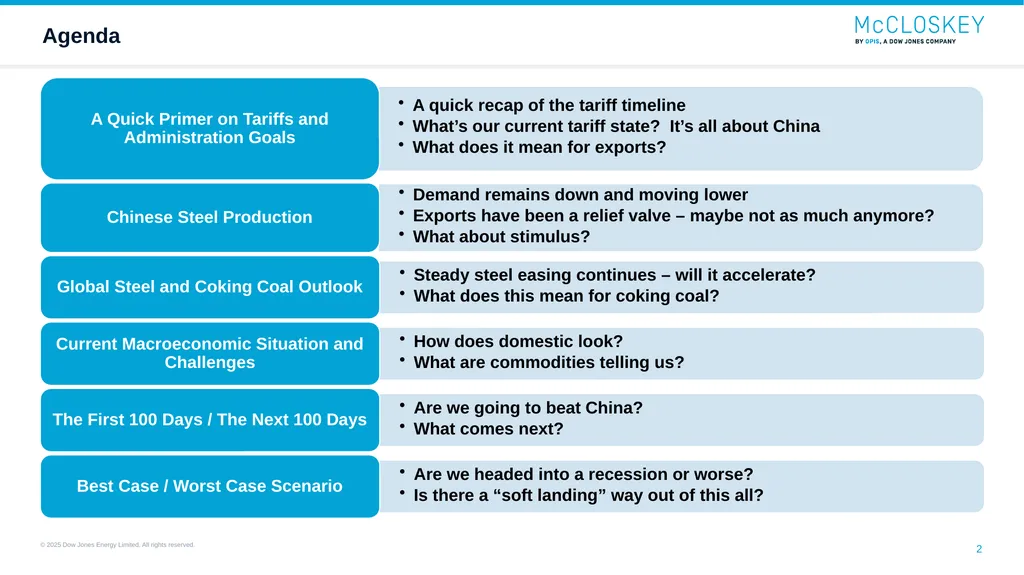
Agenda<br>
03
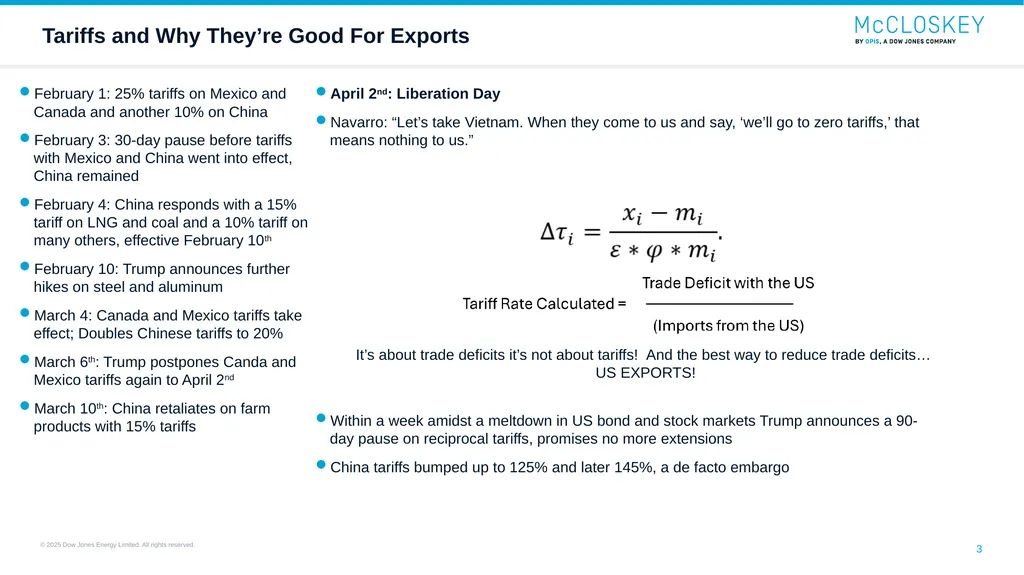
Tariffs and Why They’re Good For Exports February 1: 25% tariffs on Mexico and Canada and another 10% on China
February 3: 30-day pause before tariffs with Mexico and China went into effect, China remained
February 4: China responds with a 15% tariff on LNG and coal and a 10% tariff on many others, effective February 10th
February 10: Trump announces further hikes on steel and aluminum
March 4: Canada and Mexico tariffs take effect; Doubles Chinese tariffs to 20%
March 6th: Trump postpones Canda and Mexico tariffs again to April 2nd
March 10th: China retaliates on farm products with 15% tariffs April 2nd: Liberation Day
Navarro: “Let’s take Vietnam. When they come to us and say, ‘we’ll go to zero tariffs,’ that means nothing to us.” It’s about trade deficits it’s not about tariffs! And the best way to reduce trade deficits… US EXPORTS! Within a week amidst a meltdown in US bond and stock markets Trump announces a 90-day pause on reciprocal tariffs, promises no more extensions
China tariffs bumped up to 125% and later 145%, a de facto embargo<br>
February 3: 30-day pause before tariffs with Mexico and China went into effect, China remained
February 4: China responds with a 15% tariff on LNG and coal and a 10% tariff on many others, effective February 10th
February 10: Trump announces further hikes on steel and aluminum
March 4: Canada and Mexico tariffs take effect; Doubles Chinese tariffs to 20%
March 6th: Trump postpones Canda and Mexico tariffs again to April 2nd
March 10th: China retaliates on farm products with 15% tariffs April 2nd: Liberation Day
Navarro: “Let’s take Vietnam. When they come to us and say, ‘we’ll go to zero tariffs,’ that means nothing to us.” It’s about trade deficits it’s not about tariffs! And the best way to reduce trade deficits… US EXPORTS! Within a week amidst a meltdown in US bond and stock markets Trump announces a 90-day pause on reciprocal tariffs, promises no more extensions
China tariffs bumped up to 125% and later 145%, a de facto embargo<br>
04
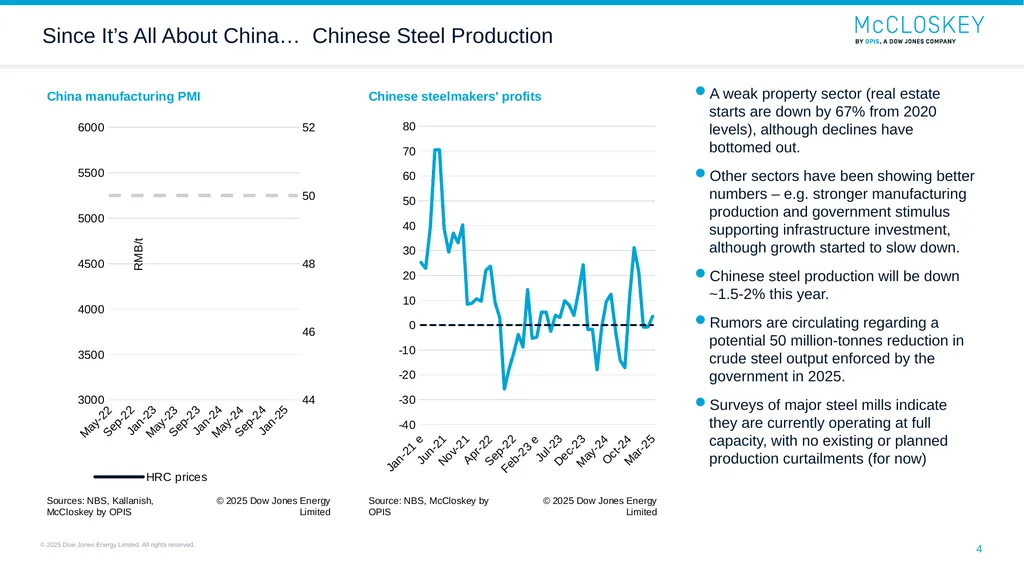
Since It’s All About China… Chinese Steel Production A weak property sector (real estate starts are down by 67% from 2020 levels), although declines have bottomed out.
Other sectors have been showing better numbers – e.g. stronger manufacturing production and government stimulus supporting infrastructure investment, although growth started to slow down.
Chinese steel production will be down ~1.5-2% this year.
Rumors are circulating regarding a potential 50 million-tonnes reduction in crude steel output enforced by the government in 2025.
Surveys of major steel mills indicate they are currently operating at full capacity, with no existing or planned production curtailments (for now)<br>
Other sectors have been showing better numbers – e.g. stronger manufacturing production and government stimulus supporting infrastructure investment, although growth started to slow down.
Chinese steel production will be down ~1.5-2% this year.
Rumors are circulating regarding a potential 50 million-tonnes reduction in crude steel output enforced by the government in 2025.
Surveys of major steel mills indicate they are currently operating at full capacity, with no existing or planned production curtailments (for now)<br>
05
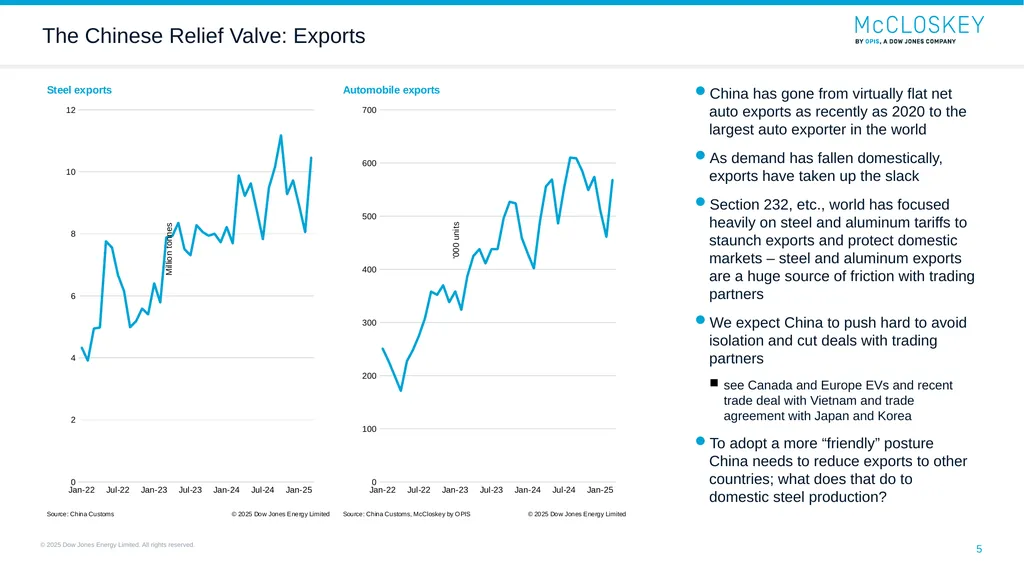
The Chinese Relief Valve: Exports China has gone from virtually flat net auto exports as recently as 2020 to the largest auto exporter in the world
As demand has fallen domestically, exports have taken up the slack
Section 232, etc., world has focused heavily on steel and aluminum tariffs to staunch exports and protect domestic markets – steel and aluminum exports are a huge source of friction with trading partners
We expect China to push hard to avoid isolation and cut deals with trading partners
see Canada and Europe EVs and recent trade deal with Vietnam and trade agreement with Japan and Korea
To adopt a more “friendly” posture China needs to reduce exports to other countries; what does that do to domestic steel production?<br>
As demand has fallen domestically, exports have taken up the slack
Section 232, etc., world has focused heavily on steel and aluminum tariffs to staunch exports and protect domestic markets – steel and aluminum exports are a huge source of friction with trading partners
We expect China to push hard to avoid isolation and cut deals with trading partners
see Canada and Europe EVs and recent trade deal with Vietnam and trade agreement with Japan and Korea
To adopt a more “friendly” posture China needs to reduce exports to other countries; what does that do to domestic steel production?<br>
06
Our Coking Coal Supply and Demand Outlook We are still oversupplied
Mine issues / temporary idlings have helped
Low global steel output has cut against idlings
Idled mines are coming back though – Leer South next
A lot of marginal production in the US for seaborne markets
The best cure for low prices is… Low prices Source: McCloskey by OPIS, a Dow Jones Company © 2025 Dow Jones Energy Limited Source: McCloskey by OPIS, a Dow Jones Company © 2025 Dow Jones Energy Limited<br>
Mine issues / temporary idlings have helped
Low global steel output has cut against idlings
Idled mines are coming back though – Leer South next
A lot of marginal production in the US for seaborne markets
The best cure for low prices is… Low prices Source: McCloskey by OPIS, a Dow Jones Company © 2025 Dow Jones Energy Limited Source: McCloskey by OPIS, a Dow Jones Company © 2025 Dow Jones Energy Limited<br>
07
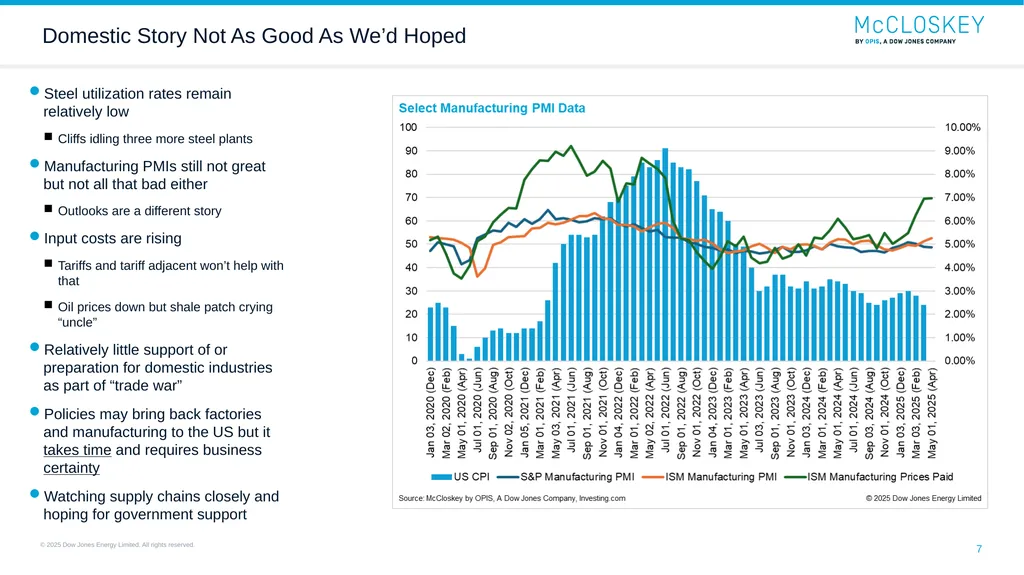
Domestic Story Not As Good As We’d Hoped Steel utilization rates remain relatively low
Cliffs idling three more steel plants
Manufacturing PMIs still not great but not all that bad either
Outlooks are a different story
Input costs are rising
Tariffs and tariff adjacent won’t help with that
Oil prices down but shale patch crying “uncle”
Relatively little support of or preparation for domestic industries as part of “trade war”
Policies may bring back factories and manufacturing to the US but it takes time and requires business certainty
Watching supply chains closely and hoping for government support<br>
Cliffs idling three more steel plants
Manufacturing PMIs still not great but not all that bad either
Outlooks are a different story
Input costs are rising
Tariffs and tariff adjacent won’t help with that
Oil prices down but shale patch crying “uncle”
Relatively little support of or preparation for domestic industries as part of “trade war”
Policies may bring back factories and manufacturing to the US but it takes time and requires business certainty
Watching supply chains closely and hoping for government support<br>
08
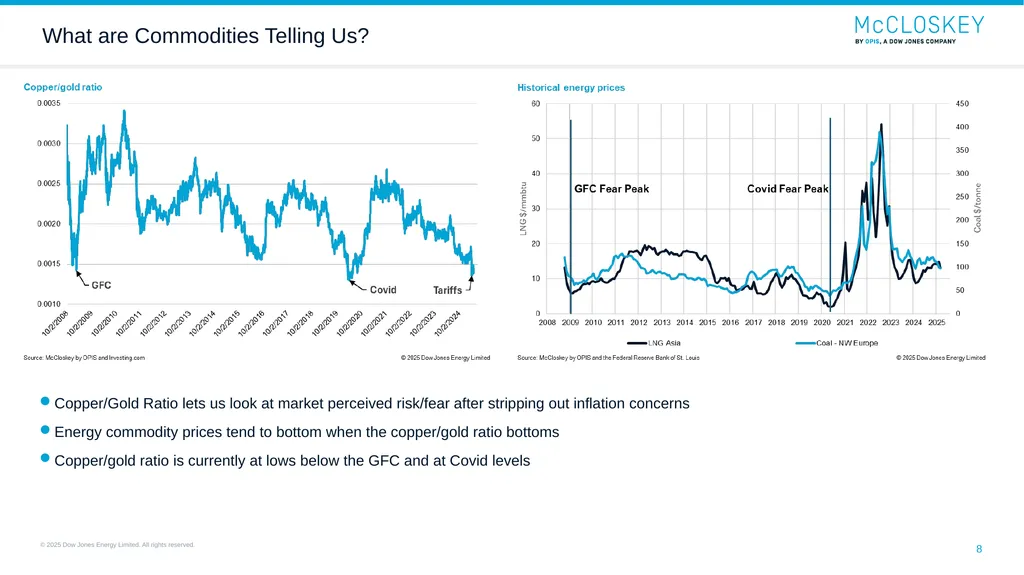
What are Commodities Telling Us? Copper/Gold Ratio lets us look at market perceived risk/fear after stripping out inflation concerns
Energy commodity prices tend to bottom when the copper/gold ratio bottoms
Copper/gold ratio is currently at lows below the GFC and at Covid levels<br>
Energy commodity prices tend to bottom when the copper/gold ratio bottoms
Copper/gold ratio is currently at lows below the GFC and at Covid levels<br>
09
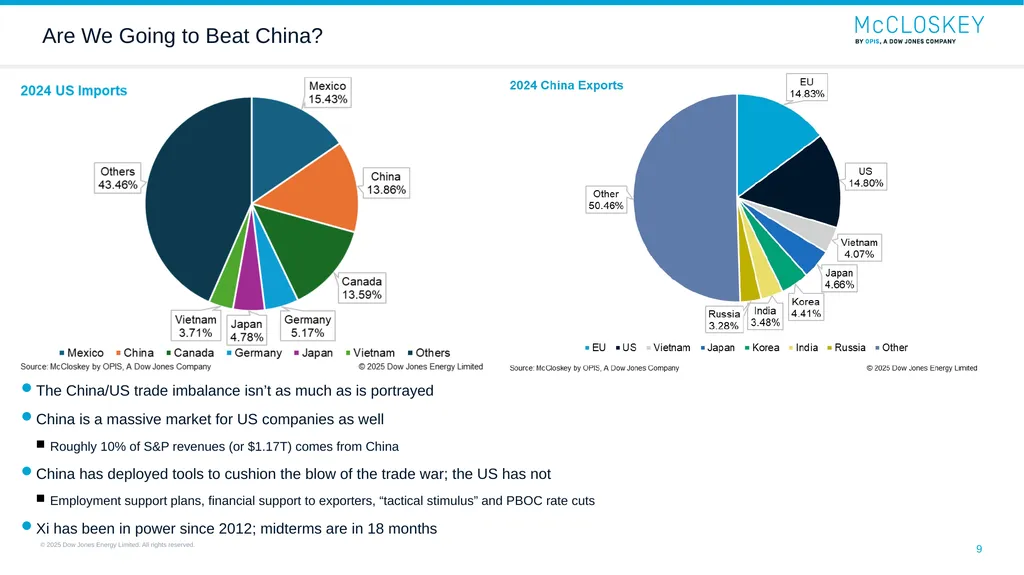
Are We Going to Beat China? The China/US trade imbalance isn’t as much as is portrayed
China is a massive market for US companies as well
Roughly 10% of S&P revenues (or $1.17T) comes from China
China has deployed tools to cushion the blow of the trade war; the US has not
Employment support plans, financial support to exporters, “tactical stimulus” and PBOC rate cuts
Xi has been in power since 2012; midterms are in 18 months<br>
China is a massive market for US companies as well
Roughly 10% of S&P revenues (or $1.17T) comes from China
China has deployed tools to cushion the blow of the trade war; the US has not
Employment support plans, financial support to exporters, “tactical stimulus” and PBOC rate cuts
Xi has been in power since 2012; midterms are in 18 months<br>
10
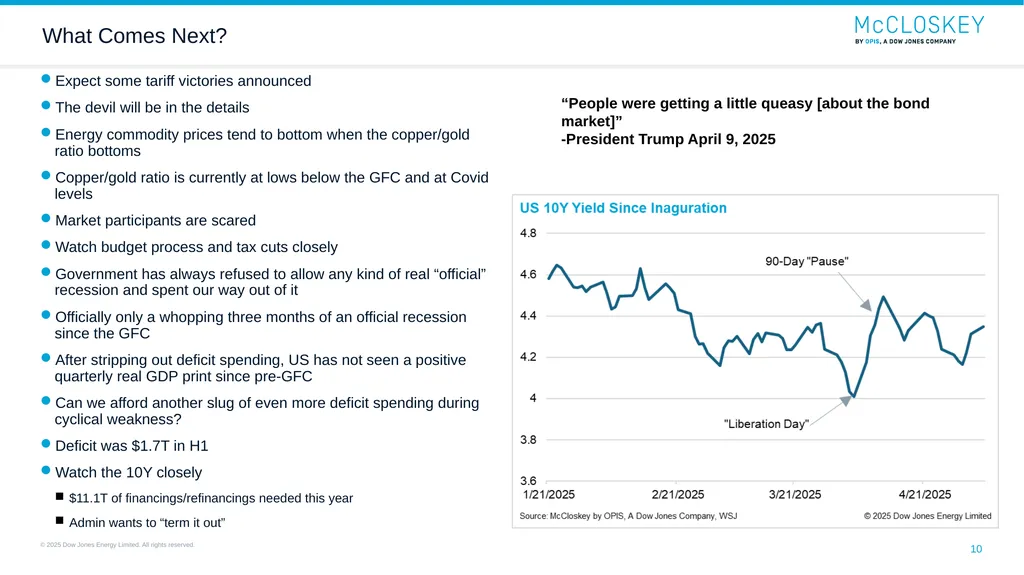
Expect some tariff victories announced
The devil will be in the details
Energy commodity prices tend to bottom when the copper/gold ratio bottoms
Copper/gold ratio is currently at lows below the GFC and at Covid levels
Market participants are scared
Watch budget process and tax cuts closely
Government has always refused to allow any kind of real “official” recession and spent our way out of it
Officially only a whopping three months of an official recession since the GFC
After stripping out deficit spending, US has not seen a positive quarterly real GDP print since pre-GFC
Can we afford another slug of even more deficit spending during cyclical weakness?
Deficit was $1.7T in H1
Watch the 10Y closely
$11.1T of financings/refinancings needed this year
Admin wants to “term it out” What Comes Next? “People were getting a little queasy [about the bond market]”
-President Trump April 9, 2025<br>
The devil will be in the details
Energy commodity prices tend to bottom when the copper/gold ratio bottoms
Copper/gold ratio is currently at lows below the GFC and at Covid levels
Market participants are scared
Watch budget process and tax cuts closely
Government has always refused to allow any kind of real “official” recession and spent our way out of it
Officially only a whopping three months of an official recession since the GFC
After stripping out deficit spending, US has not seen a positive quarterly real GDP print since pre-GFC
Can we afford another slug of even more deficit spending during cyclical weakness?
Deficit was $1.7T in H1
Watch the 10Y closely
$11.1T of financings/refinancings needed this year
Admin wants to “term it out” What Comes Next? “People were getting a little queasy [about the bond market]”
-President Trump April 9, 2025<br>
11
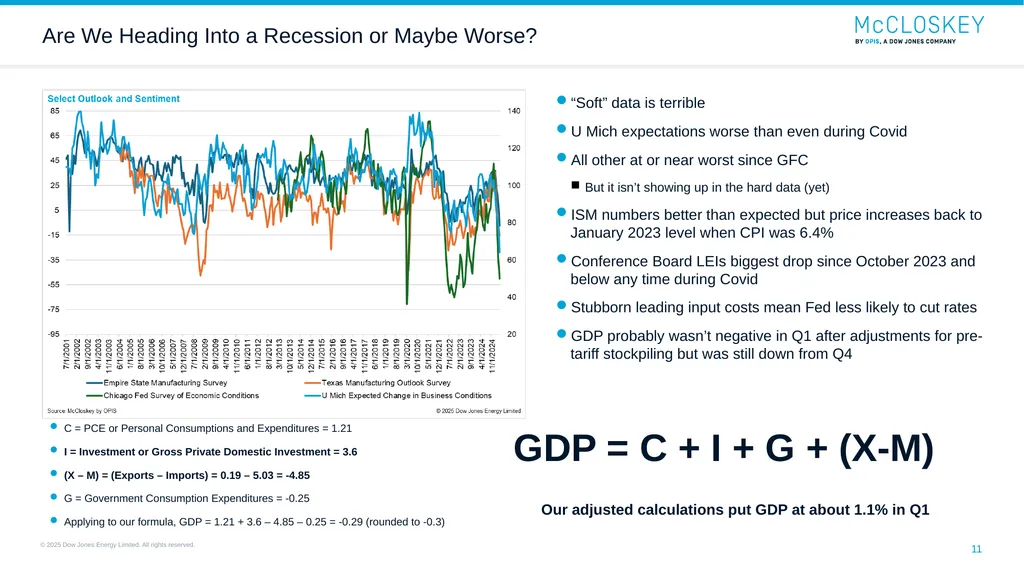
Are We Heading Into a Recession or Maybe Worse? “Soft” data is terrible
U Mich expectations worse than even during Covid
All other at or near worst since GFC
But it isn’t showing up in the hard data (yet)
ISM numbers better than expected but price increases back to January 2023 level when CPI was 6.4%
Conference Board LEIs biggest drop since October 2023 and below any time during Covid
Stubborn leading input costs mean Fed less likely to cut rates
GDP probably wasn’t negative in Q1 after adjustments for pre-tariff stockpiling but was still down from Q4 C = PCE or Personal Consumptions and Expenditures = 1.21
I = Investment or Gross Private Domestic Investment = 3.6
(X – M) = (Exports – Imports) = 0.19 – 5.03 = -4.85
G = Government Consumption Expenditures = -0.25
Applying to our formula, GDP = 1.21 + 3.6 – 4.85 – 0.25 = -0.29 (rounded to -0.3) GDP = C + I + G + (X-M) Our adjusted calculations put GDP at about 1.1% in Q1<br>
U Mich expectations worse than even during Covid
All other at or near worst since GFC
But it isn’t showing up in the hard data (yet)
ISM numbers better than expected but price increases back to January 2023 level when CPI was 6.4%
Conference Board LEIs biggest drop since October 2023 and below any time during Covid
Stubborn leading input costs mean Fed less likely to cut rates
GDP probably wasn’t negative in Q1 after adjustments for pre-tariff stockpiling but was still down from Q4 C = PCE or Personal Consumptions and Expenditures = 1.21
I = Investment or Gross Private Domestic Investment = 3.6
(X – M) = (Exports – Imports) = 0.19 – 5.03 = -4.85
G = Government Consumption Expenditures = -0.25
Applying to our formula, GDP = 1.21 + 3.6 – 4.85 – 0.25 = -0.29 (rounded to -0.3) GDP = C + I + G + (X-M) Our adjusted calculations put GDP at about 1.1% in Q1<br>
12
The goal of tariffs is less of a trade deficit rather than lower “tariffs”
The best way to accomplish this is with a foreign country taking in more US imports
Most imports are too expensive (an iPhone is 2.5 months of average wages in Vietnam) but energy isn’t
These tariff goals are a huge opportunity for many US exports
China steel production probably continues to decline
Not only because of less domestic demand but because China is trying to strike its own trade deals to push back against the US and steel dumping is a real sore spot
Mostly because of China we are oversupplied right now on coking coal even with multiple unexpected mine outages
A lot of the marginal tons are now here in the US to get oversupply fixed
Longer-term we still look undersupplied
Commodities are telling us things are rough right now – watch the copper/gold ratio
“Beating” China looks unlikely – China in much better shape in the fight than we might think
Treasuries and debt matter again
Mood is dour but data still not terrible
GDP was probably better than headline numbers and positive
Spending still a huge issue we will have to confront eventually (maybe sooner than we expect)
Input costs remain quite high – going to be difficult for Fed to cut unless employment falters Summary Source: McCloskey by OPIS, A Dow Jones Company, World Steel Association<br>
The best way to accomplish this is with a foreign country taking in more US imports
Most imports are too expensive (an iPhone is 2.5 months of average wages in Vietnam) but energy isn’t
These tariff goals are a huge opportunity for many US exports
China steel production probably continues to decline
Not only because of less domestic demand but because China is trying to strike its own trade deals to push back against the US and steel dumping is a real sore spot
Mostly because of China we are oversupplied right now on coking coal even with multiple unexpected mine outages
A lot of the marginal tons are now here in the US to get oversupply fixed
Longer-term we still look undersupplied
Commodities are telling us things are rough right now – watch the copper/gold ratio
“Beating” China looks unlikely – China in much better shape in the fight than we might think
Treasuries and debt matter again
Mood is dour but data still not terrible
GDP was probably better than headline numbers and positive
Spending still a huge issue we will have to confront eventually (maybe sooner than we expect)
Input costs remain quite high – going to be difficult for Fed to cut unless employment falters Summary Source: McCloskey by OPIS, A Dow Jones Company, World Steel Association<br>
13
Strengthen your company position and better plan growth strategies in the global economy with coal, metals and mining data from McCloskey by OPIS Robust price discovery
Independent reporting of market news
Insightful and reliable analysis
Advisory support from our industry experts Coal, Metals & Mining Pricing, Analysis & News 13 These services help you to understand how supply and demand are evolving, by quality and end-use sector, enhancing your trading, procurement, and selling strategies. Key Products:
Energy Markets & Research
Steel Raw Materials Markets & Research
North America Markets
Greater China Markets
APAC and Africa Markets
MineSpans: Metallurgical Coal
Coal Value-Chain Emissions Database<br>
Independent reporting of market news
Insightful and reliable analysis
Advisory support from our industry experts Coal, Metals & Mining Pricing, Analysis & News 13 These services help you to understand how supply and demand are evolving, by quality and end-use sector, enhancing your trading, procurement, and selling strategies. Key Products:
Energy Markets & Research
Steel Raw Materials Markets & Research
North America Markets
Greater China Markets
APAC and Africa Markets
MineSpans: Metallurgical Coal
Coal Value-Chain Emissions Database<br>