Addressing missing participant data in systematic
Description: Addressing missing participant data in systematic reviews: Part I Dichotomous outcomes Elie Akl, Shanil Ebrahim, Bradley Johnston, Pablo Alonso, Matthias Briel, Gordon Guyatt Disclosures No conflicts of interest to disclose This work was
Related Topics
Download Presentation
"Addressing missing participant data in systematic" is the property of its rightful owner. Permission is granted to download and print the materials on this website for personal, non-commercial use only, and to display it on your personal computer provided you do not modify the materials and that you retain all copyright notices contained in the materials. By downloading content from our website, you accept the terms of this agreement.
Presentation Transcript
slide1. Addressing missing participant data in systematic reviews: Part I – Dichotomous outcomes Elie Akl, Shanil Ebrahim,
Bradley Johnston, Pablo Alonso, Matthias Briel, Gordon Guyatt<br>
slide2. Disclosures No conflicts of interest to disclose
This work was funded by the Cochrane Methods Innovation Fund<br>
slide3. Objective To describe how to use an innovative approach to addressing missing participant data for dichotomous outcomes in systematic reviews of randomized trials<br>
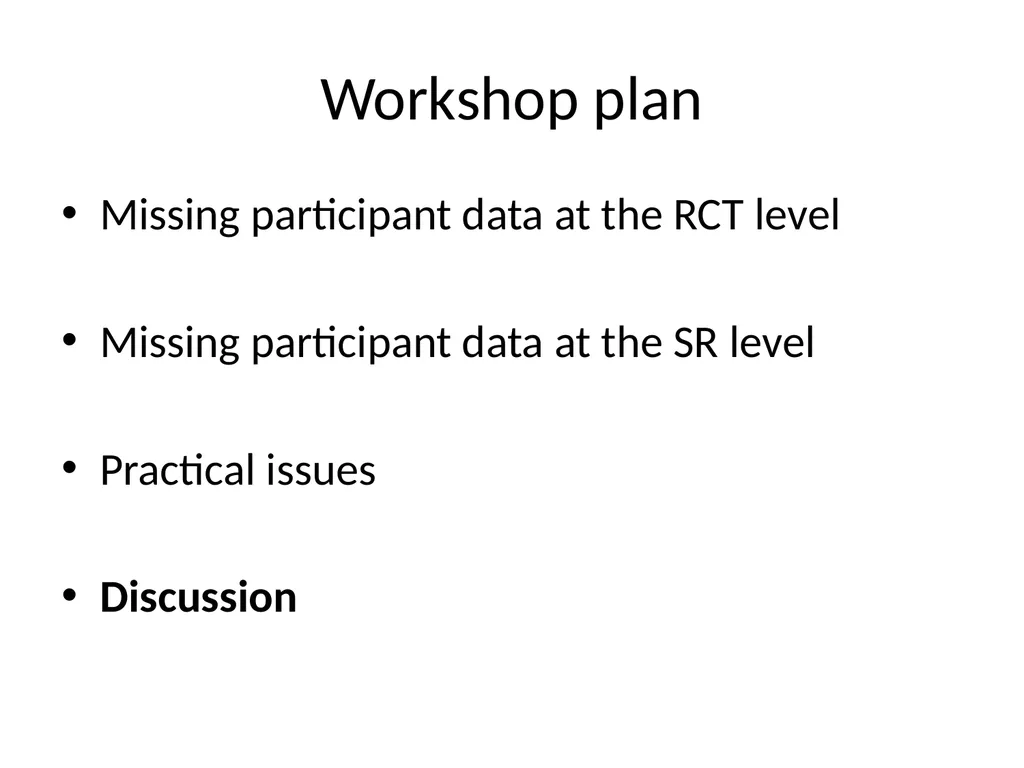
slide4. Workshop plan Missing participant data at the RCT level
Missing participant data at the SR level
Practical issues
Discussion<br>
slide5. Workshop plan Missing participant data at the RCT level
Missing participant data at the SR level
Practical issues
Discussion<br>
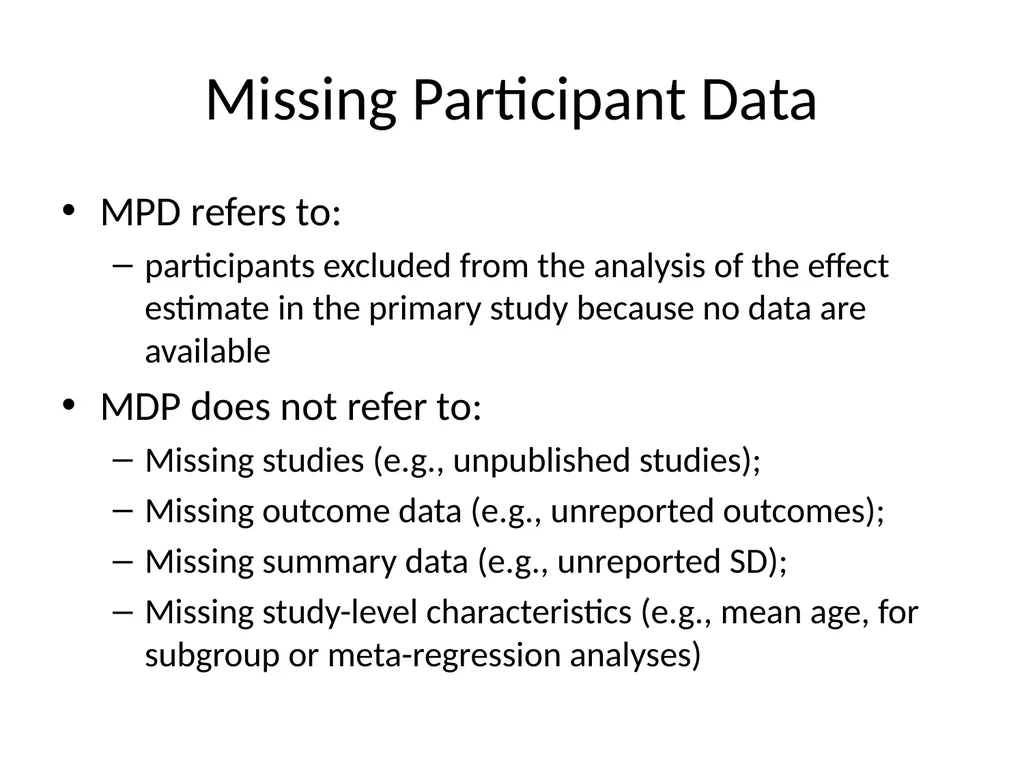
slide6. Missing Participant Data MPD refers to:
participants excluded from the analysis of the effect estimate in the primary study because no data are available
MDP does not refer to:
Missing studies (e.g., unpublished studies);
Missing outcome data (e.g., unreported outcomes);
Missing summary data (e.g., unreported SD);
Missing study-level characteristics (e.g., mean age, for subgroup or meta-regression analyses)<br>
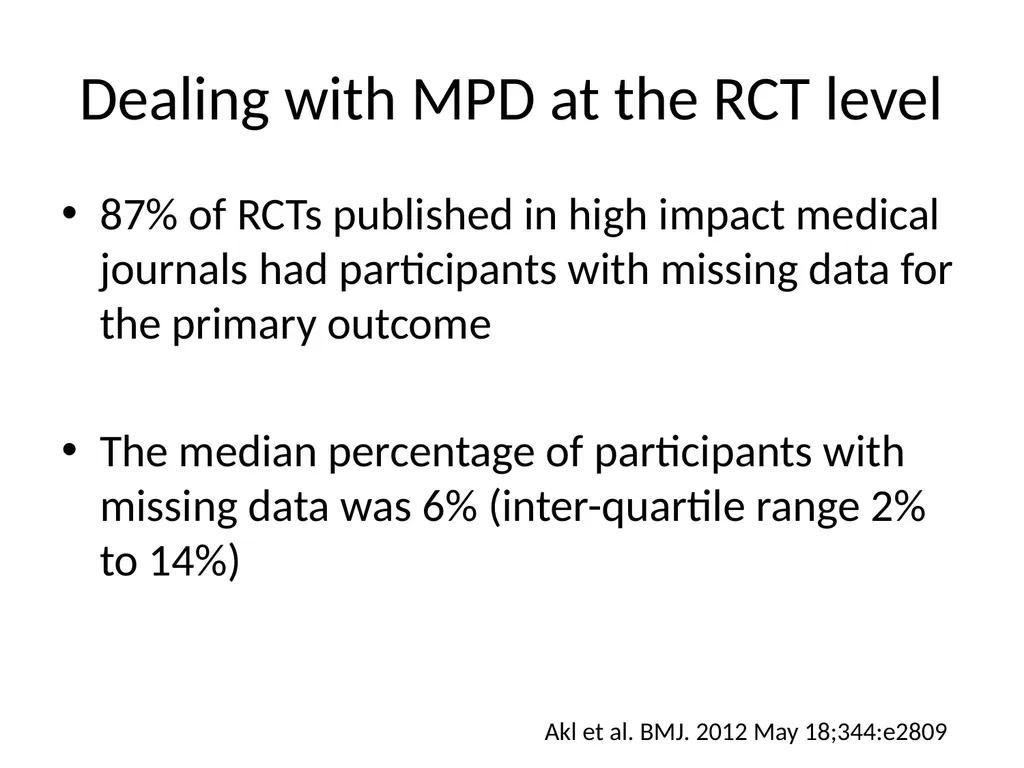
slide7. Dealing with MPD at the RCT level 87% of RCTs published in high impact medical journals had participants with missing data for the primary outcome
The median percentage of participants with missing data was 6% (inter-quartile range 2% to 14%) Akl et al. BMJ. 2012 May 18;344:e2809<br>
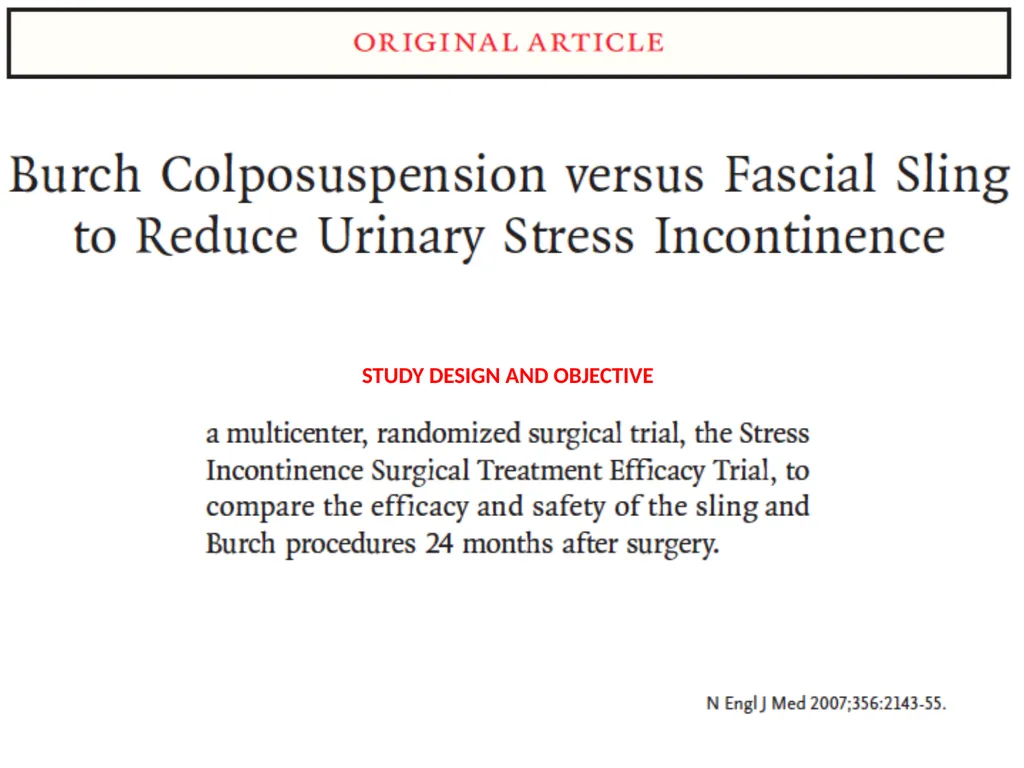
slide8. STUDY DESIGN AND OBJECTIVE<br>
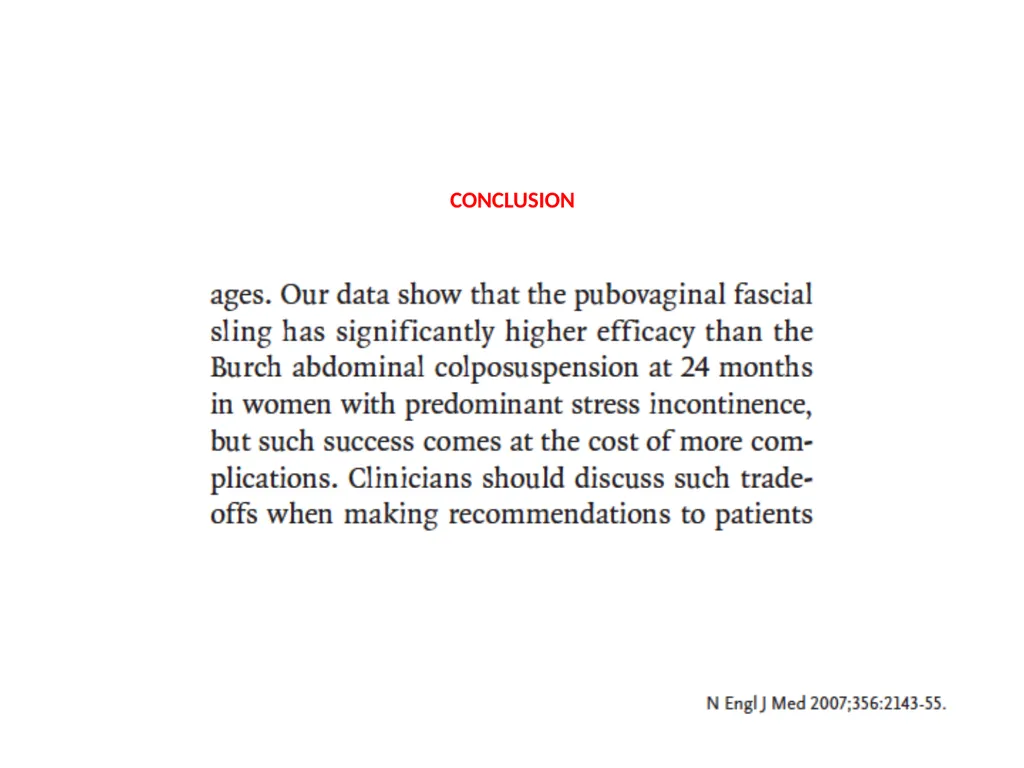
slide11. CONCLUSION<br>
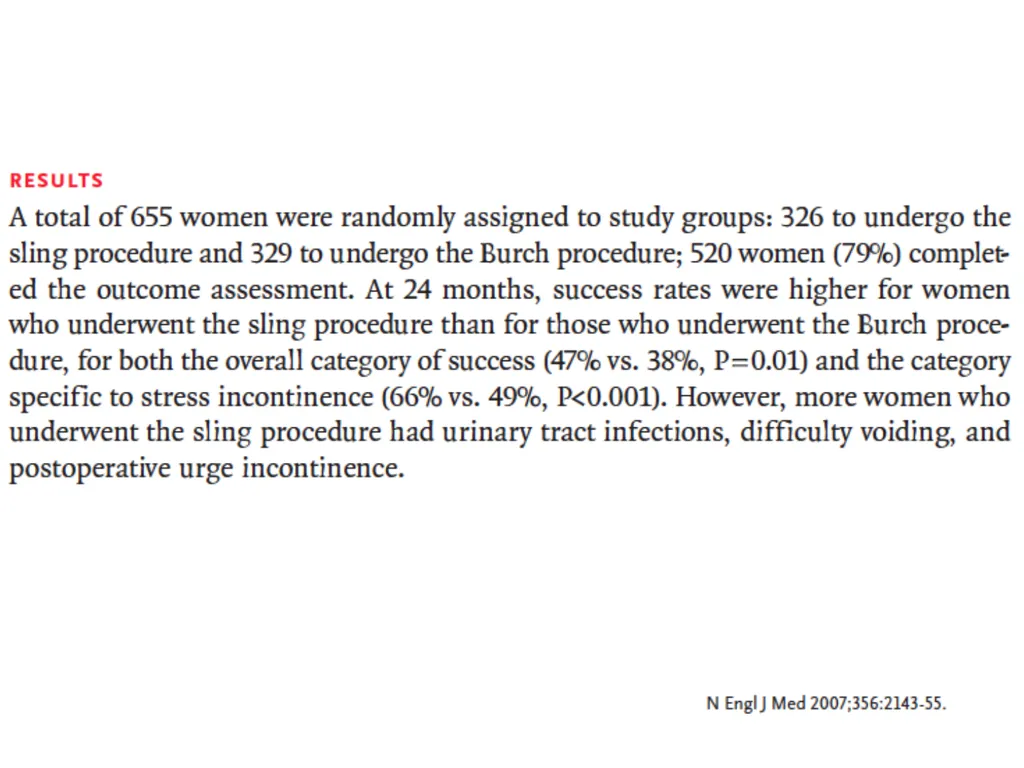
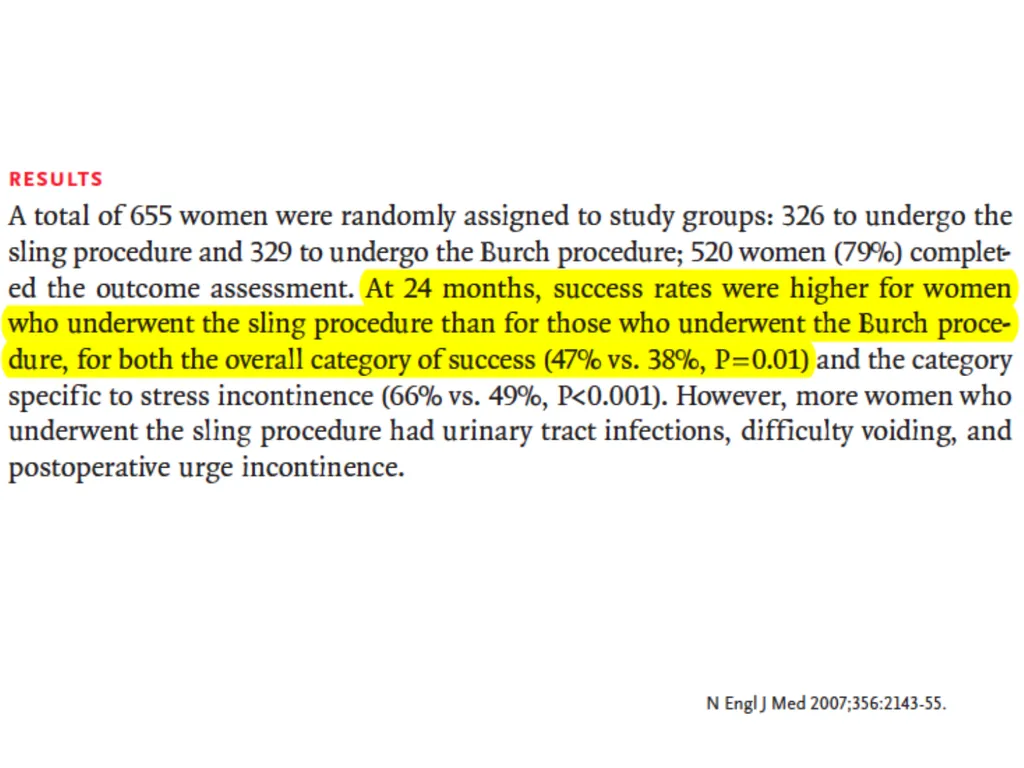
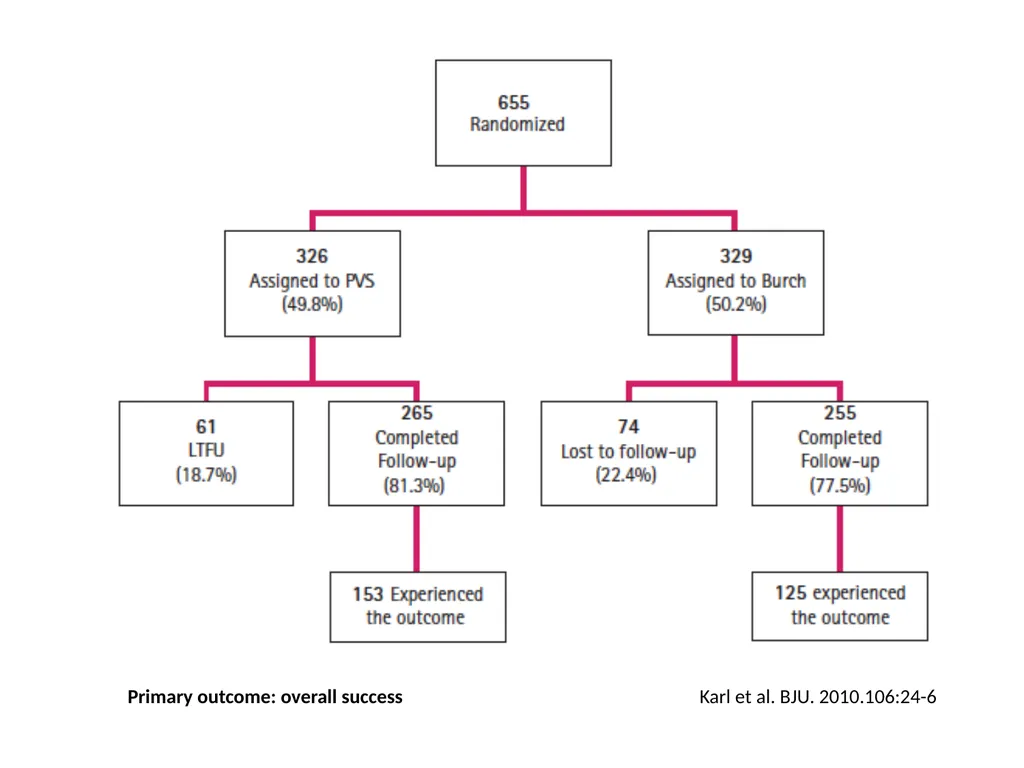
slide13. Karl et al. BJU. 2010.106:24-6 Primary outcome: overall success<br>
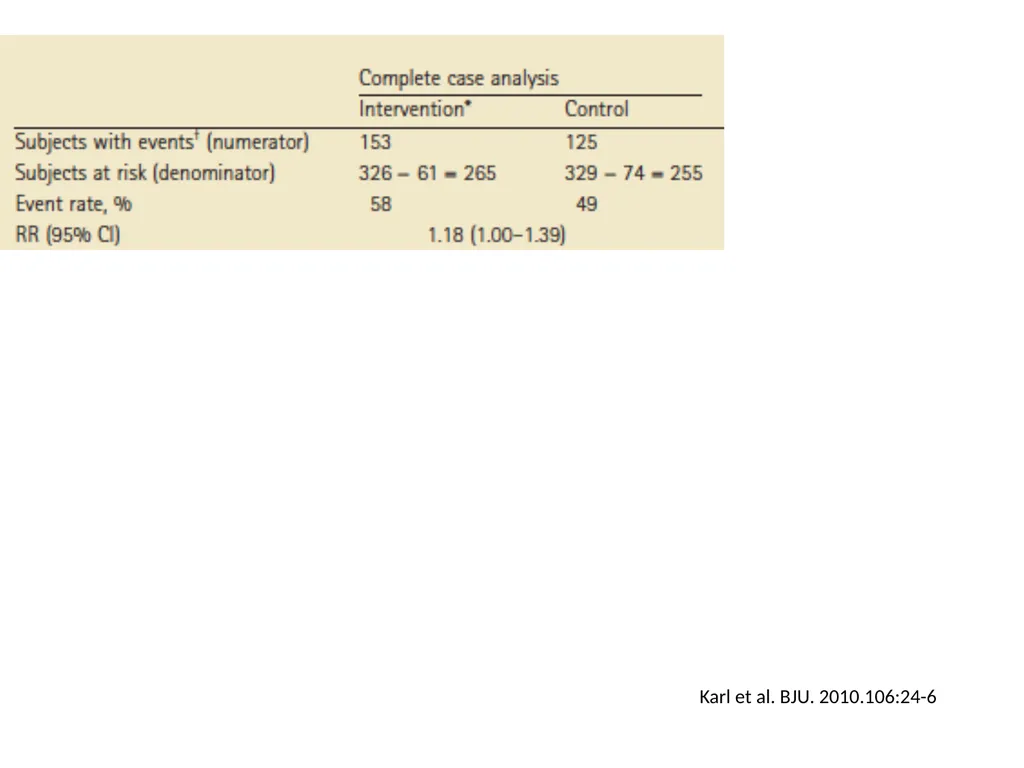
slide14. Dealing with MPD at the RCT level Complete case analysis
Make assumptions about the outcomes of participants with missing data:
None suffered the outcome
All suffered the outcome
Best case scenario
Worst case scenario<br>
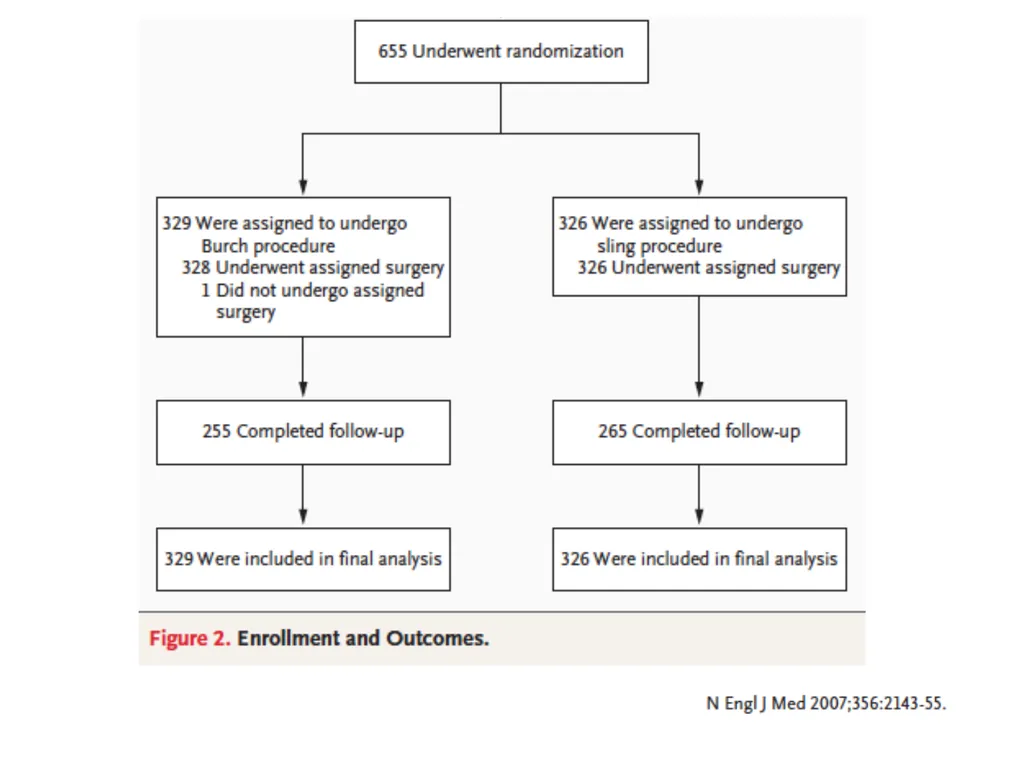
slide15. Karl et al. BJU. 2010.106:24-6<br>
slide16. Karl et al. BJU. 2010.106:24-6<br>
slide17. Karl et al. BJU. 2010.106:24-6<br>
slide18. Dealing with MPD at the RCT level However, these assumptions are not plausible
More plausible assumptions: based on RIMPD/FU
event incidence among those with MPD (not followed-up) relative to the event incidence among those followed up
RIMPD/FU = 2: event incidence among those with MPD is double the event incidence among those followed up Akl et al. BMJ. 2012 May 18;344:e2809<br>
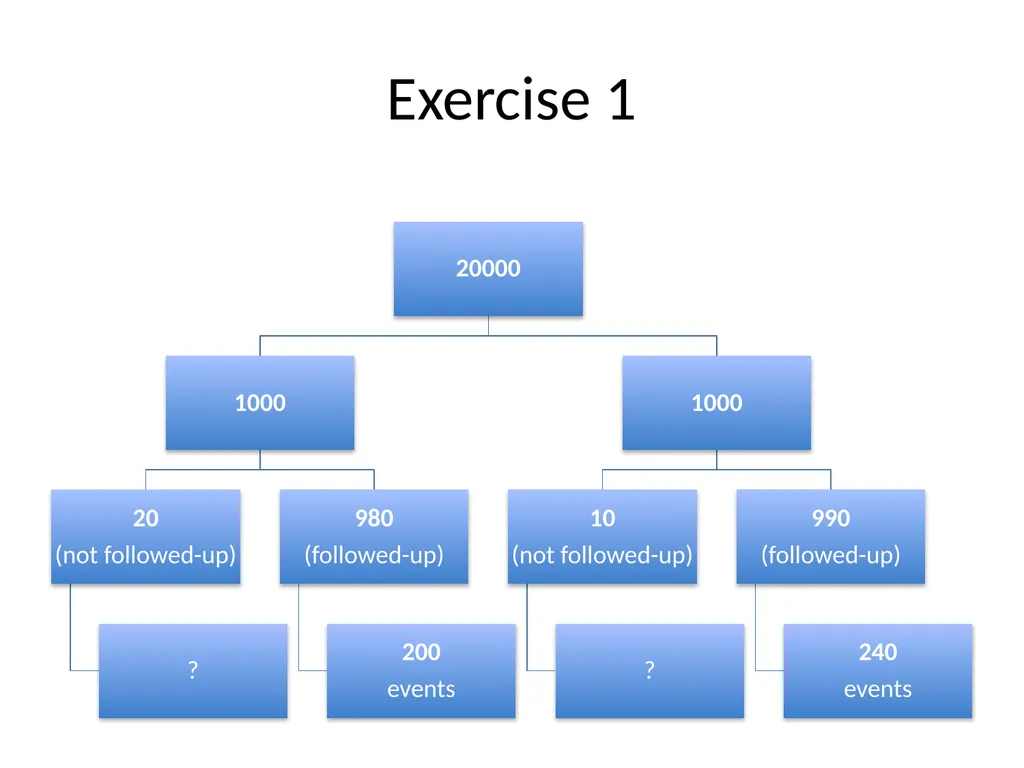
slide19. Exercise 1<br>
slide20. Exercise 1 solution<br>
slide21. Dealing with MPD at the RCT level What are the advantages and disadvantages of:
Complete case analysis
Assuming none suffered the outcome
Assuming all suffered the outcome
Assuming best case scenario
Assuming worst case scenario
RIMPD/FU approach<br>
slide22. Workshop plan Missing participant data at the RCT level
Missing participant data at the SR level
Practical issues
Discussion<br>
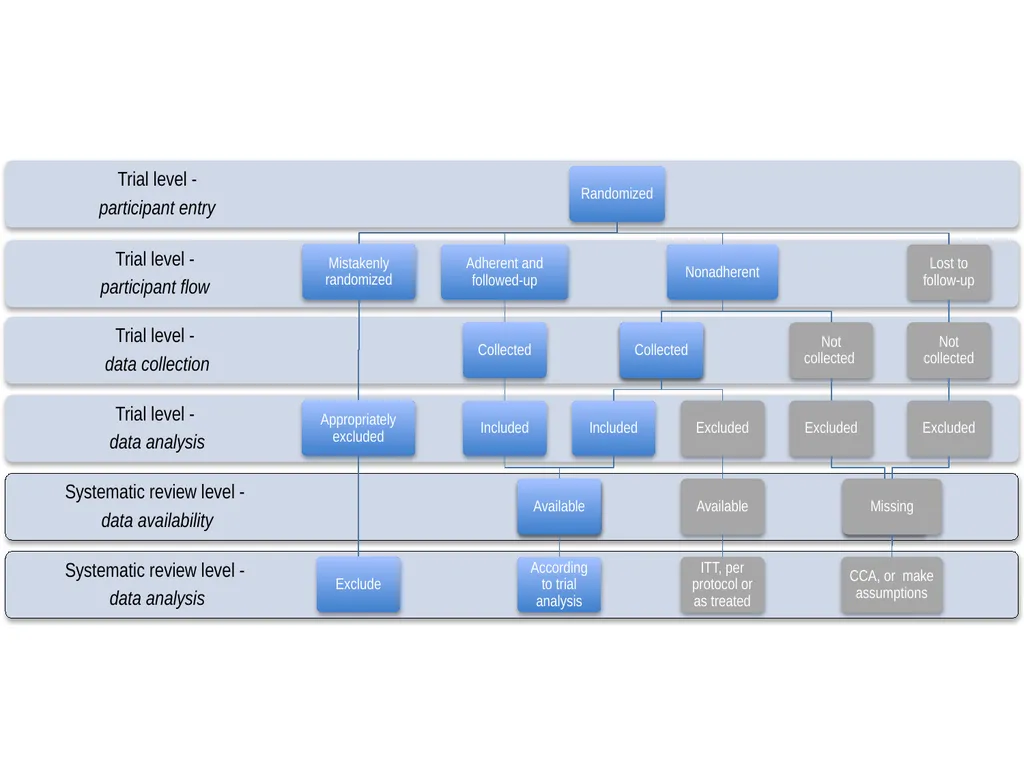
slide23. Dealing with MPD at the SR level What are the issues that systematic review authors need to deal with in relation to MPD?<br>
slide24. Dealing with MPD at the SR level We will discuss how systematic reviewer authors need to:
Deal with MPD when producing the pooled effect estimate for the primary analysis
Assess risk of bias associated with MPD and the extent to which introduces confidence in results (quality of evidence)<br>
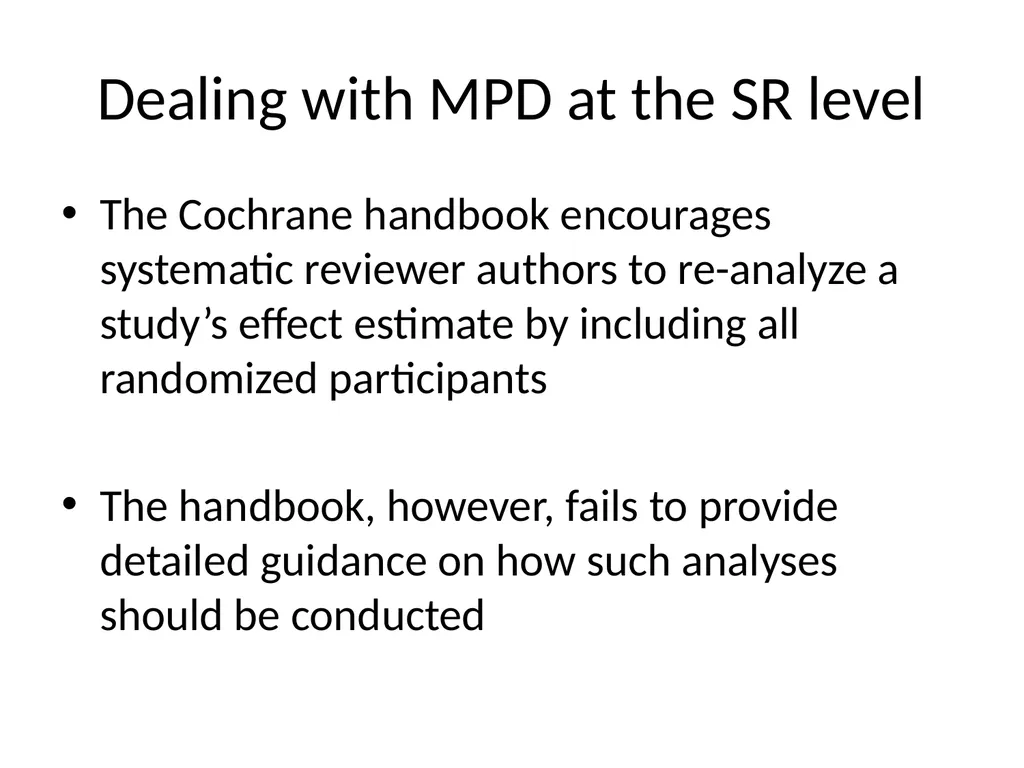
slide26. Dealing with MPD at the SR level The Cochrane handbook encourages systematic reviewer authors to re-analyze a study’s effect estimate by including all randomized participants
The handbook, however, fails to provide detailed guidance on how such analyses should be conducted<br>
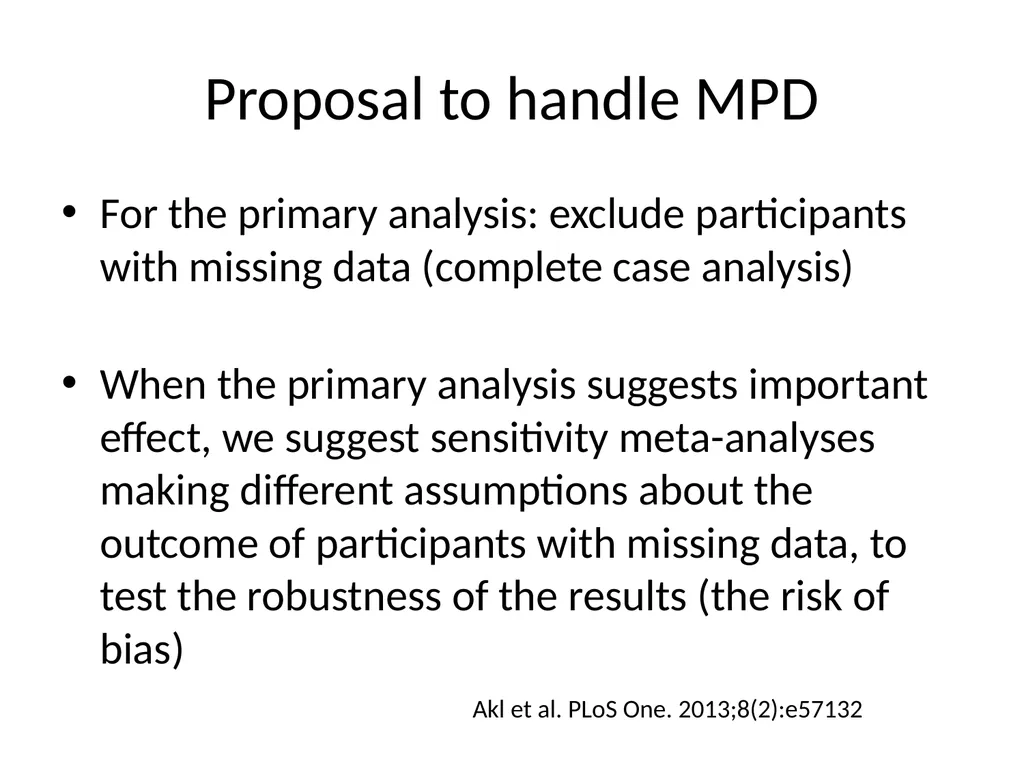
slide27. Proposal to handle MPD For the primary analysis: exclude participants with missing data (complete case analysis)
When the primary analysis suggests important effect, we suggest sensitivity meta-analyses making different assumptions about the outcome of participants with missing data, to test the robustness of the results (the risk of bias) Akl et al. PLoS One. 2013;8(2):e57132<br>
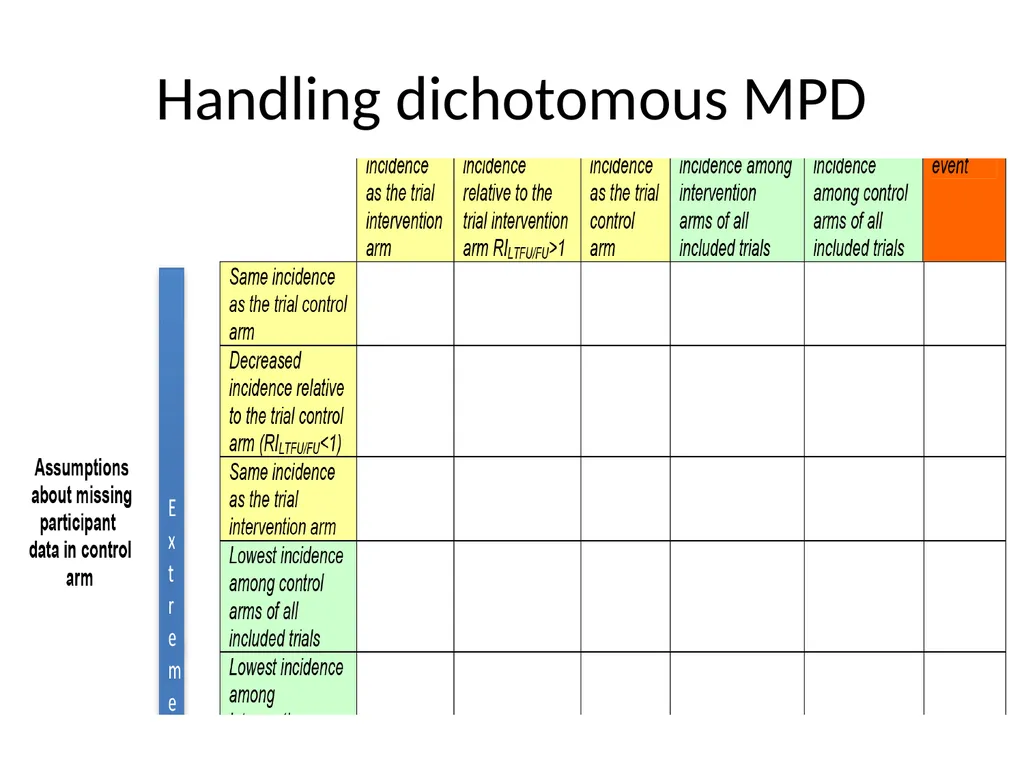
slide28. Handling dichotomous MPD<br>
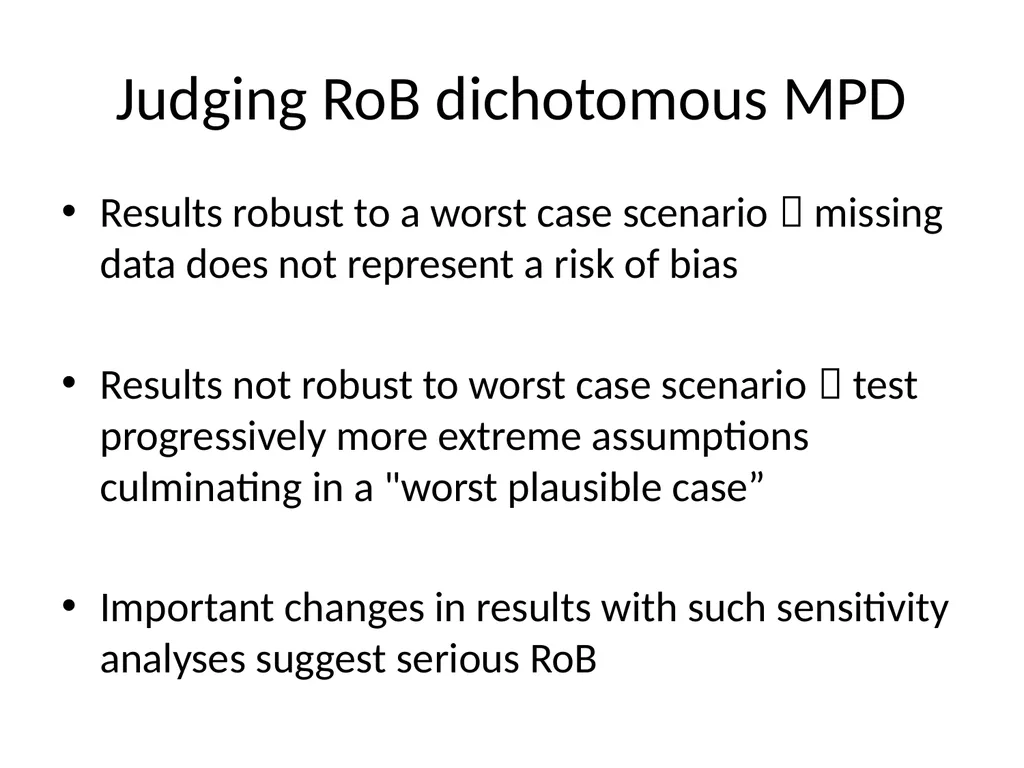
slide29. Judging RoB dichotomous MPD Results robust to a worst case scenario missing data does not represent a risk of bias
Results not robust to worst case scenario test progressively more extreme assumptions culminating in a "worst plausible case”
Important changes in results with such sensitivity analyses suggest serious RoB<br>
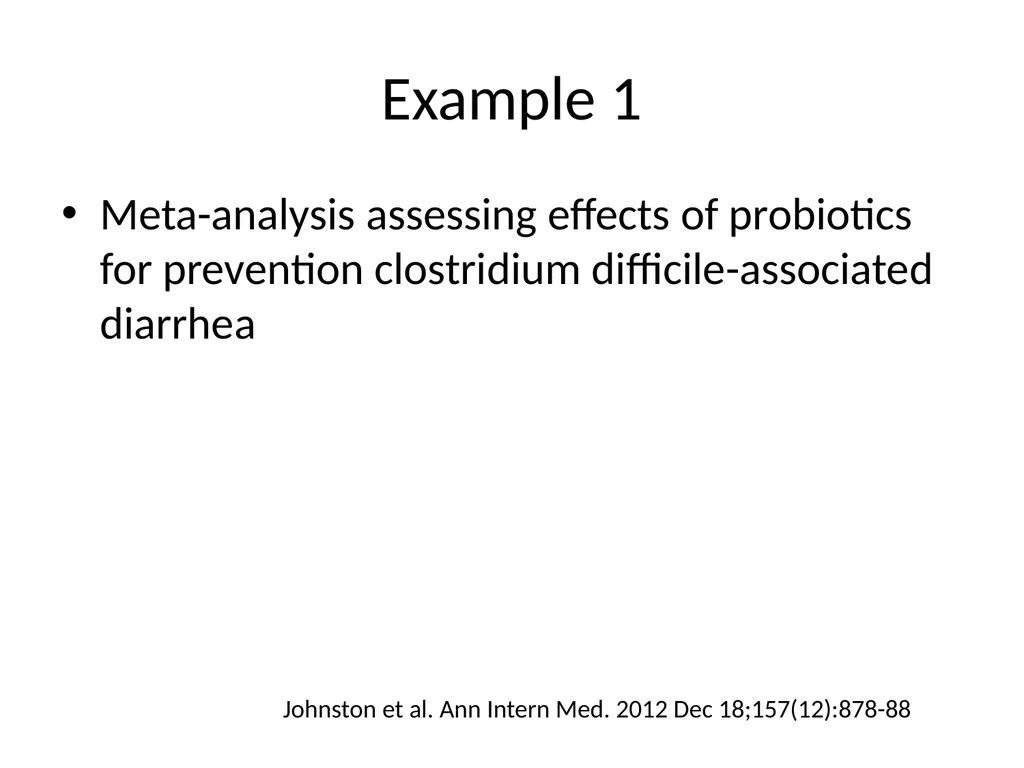
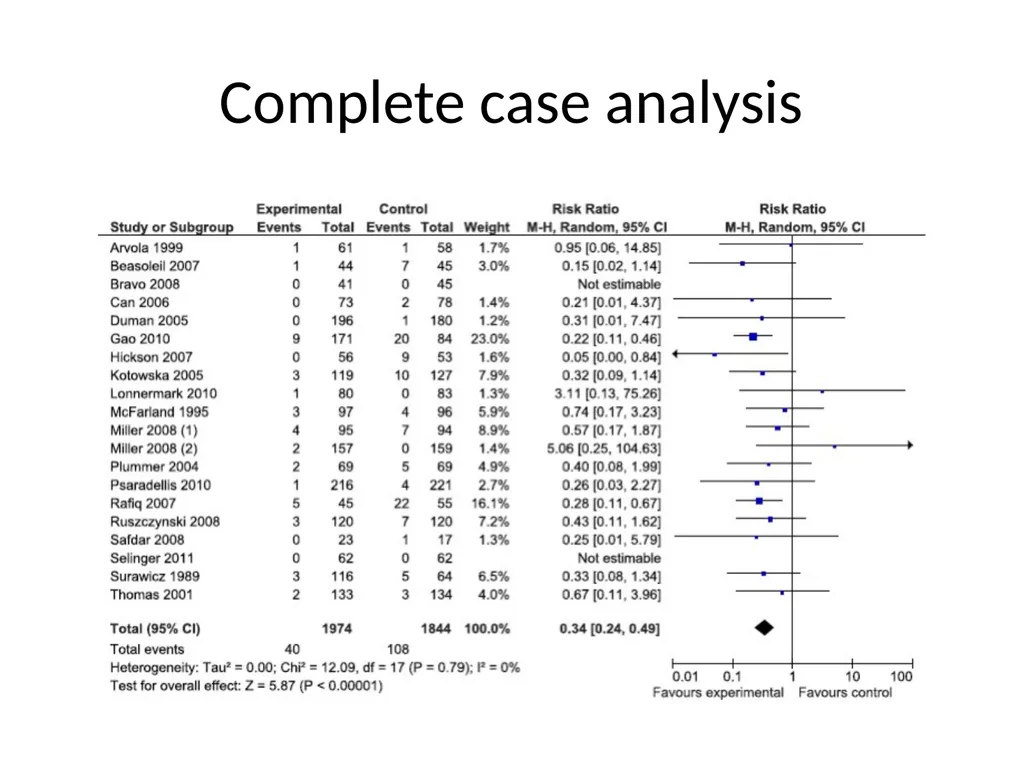
slide30. Example 1 Meta-analysis assessing effects of probiotics for prevention clostridium difficile-associated diarrhea Johnston et al. Ann Intern Med. 2012 Dec 18;157(12):878-88<br>
slide31. Complete case analysis<br>
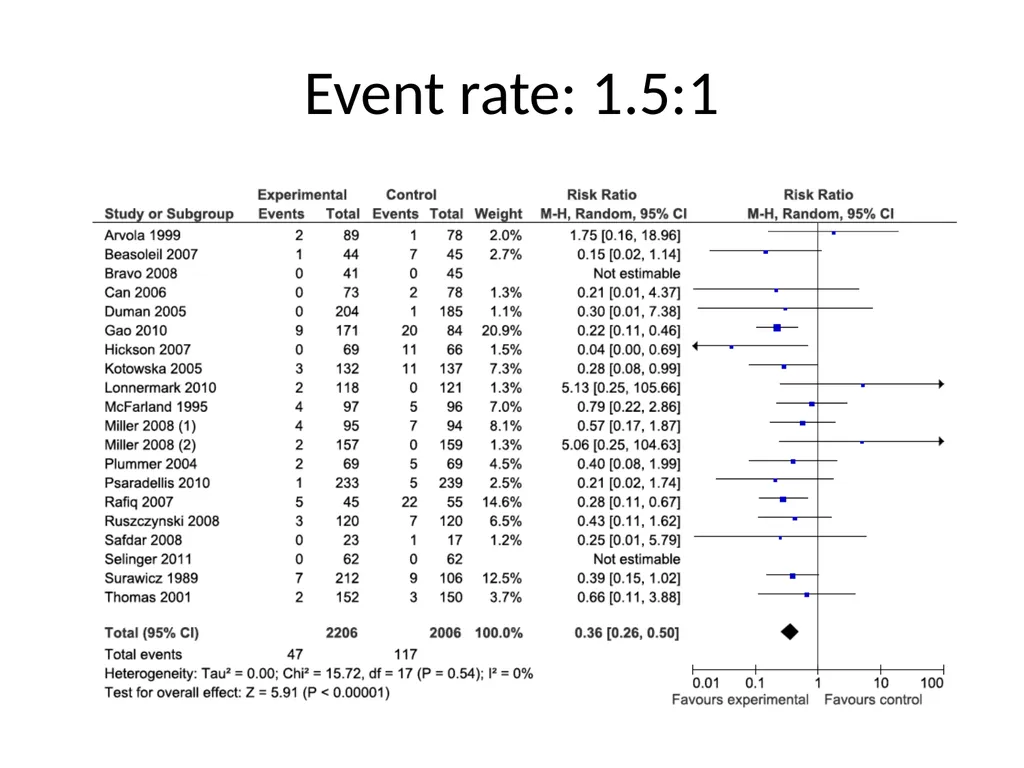
slide32. Event rate: 1.5:1<br>
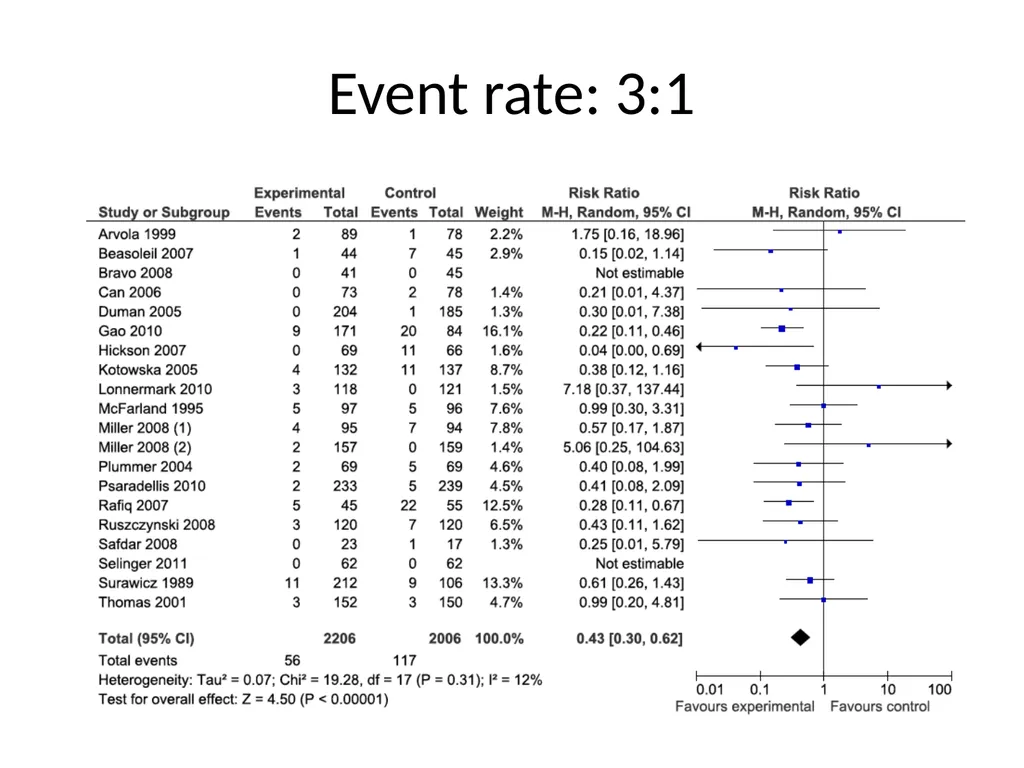
slide33. Event rate: 3:1<br>
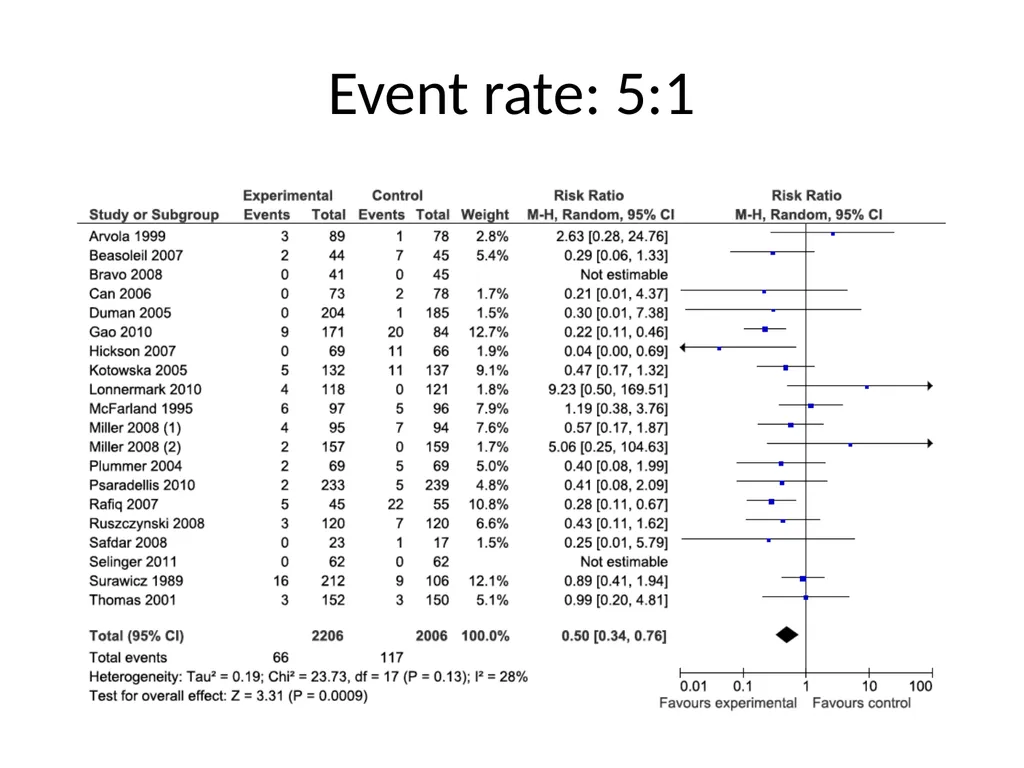
slide34. Event rate: 5:1<br>
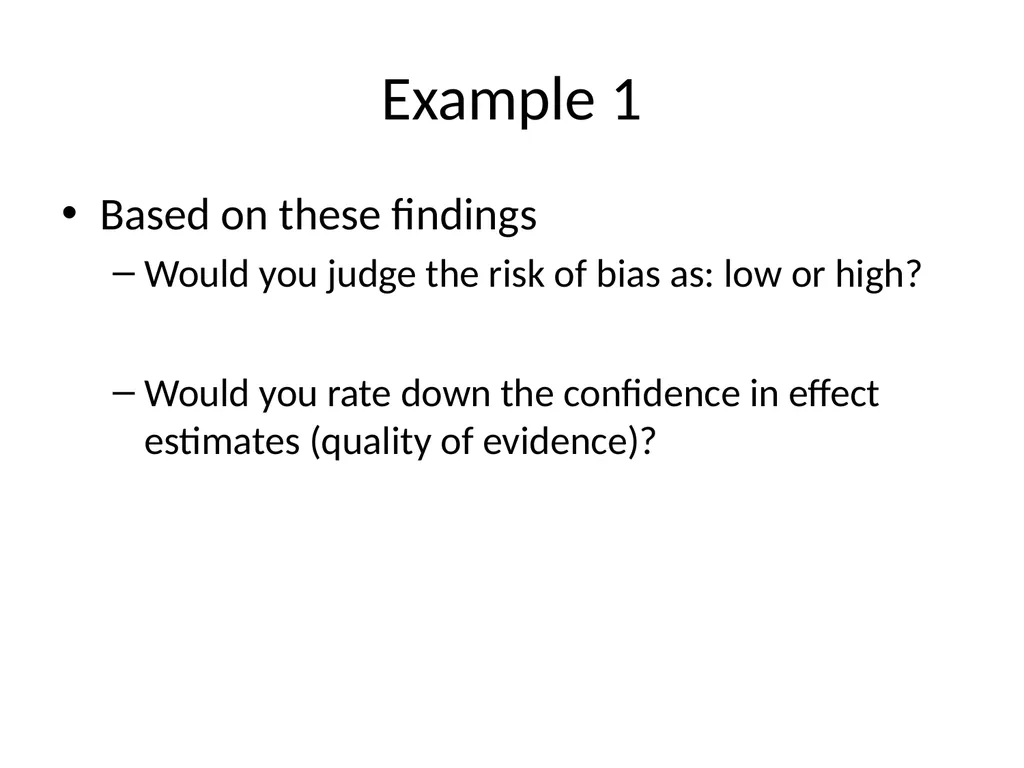
slide35. Example 1 Based on these findings
Would you judge the risk of bias as: low or high?
Would you rate down the confidence in effect estimates (quality of evidence)?<br>
slide36. Example 2 Meta-analysis comparing oral direct factor Xa inhibitors to low-molecular-weight heparin for thromboprophylaxis in patients undergoing total hip or knee replacement
The primary analysis:
complete case analysis
factor Xa inhibitors reduced the incidence of symptomatic deep venous OR 0.46 (0.30-0.70) Neumann et al. Ann Intern Med. 2012 May 15;156(10)<br>
slide37. Example 2 Two sensitivity analyses based on extreme but plausible assumptions :
RILTFU/FU 2 and 3 for the intervention arm and 1 for control arm.
The effect estimates did not change appreciably: OR 0.54 (0.37-0.80), 0.59 (0.40-0.87) respectively Neumann et al. Ann Intern Med. 2012 May 15;156(10)<br>
slide38. Example 2 The results would lose statistically significance, OR 0.84 (0.59-1.20), when we assumed:
the lowest incidence among intervention arms of all included trials for those with missing data in the control group
the highest incidence among control arms of all included trials for those with missing data in the intervention group Neumann et al. Ann Intern Med. 2012 May 15;156(10)<br>
slide39. Example 2 Based on these findings
Would you judge the risk of bias as: low or high?
Would you rate down the confidence in effect estimates (quality of evidence)?<br>
slide40. Workshop plan Missing participant data at the RCT level
Missing participant data at the SR level
Practical issues
Discussion<br>
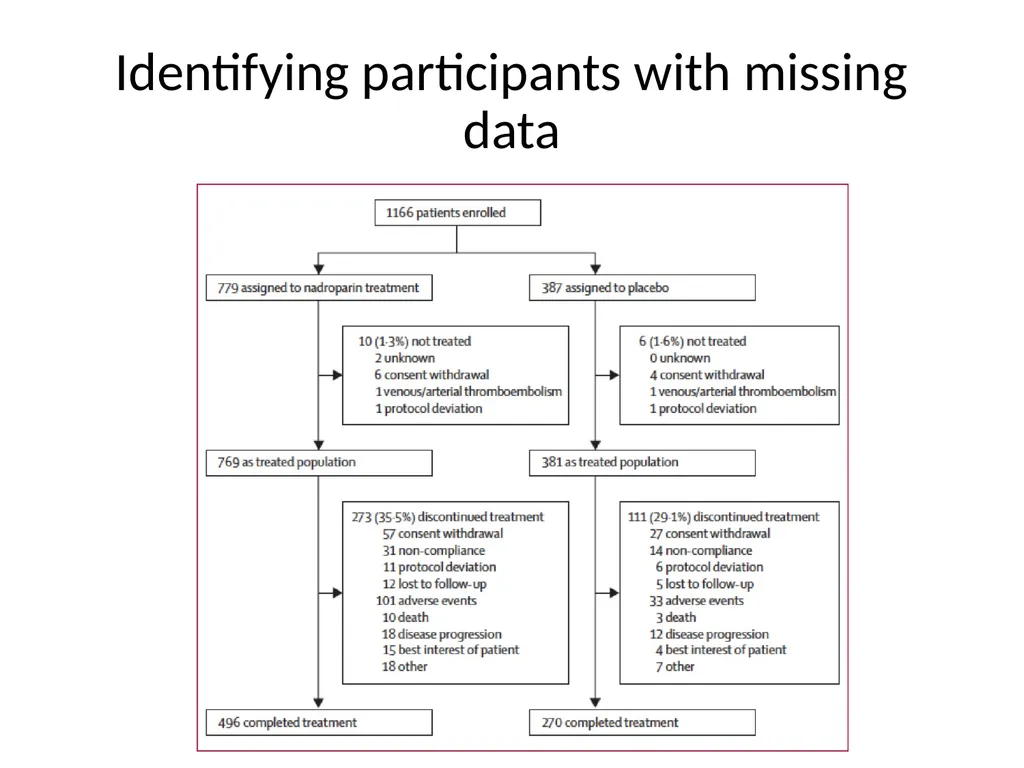
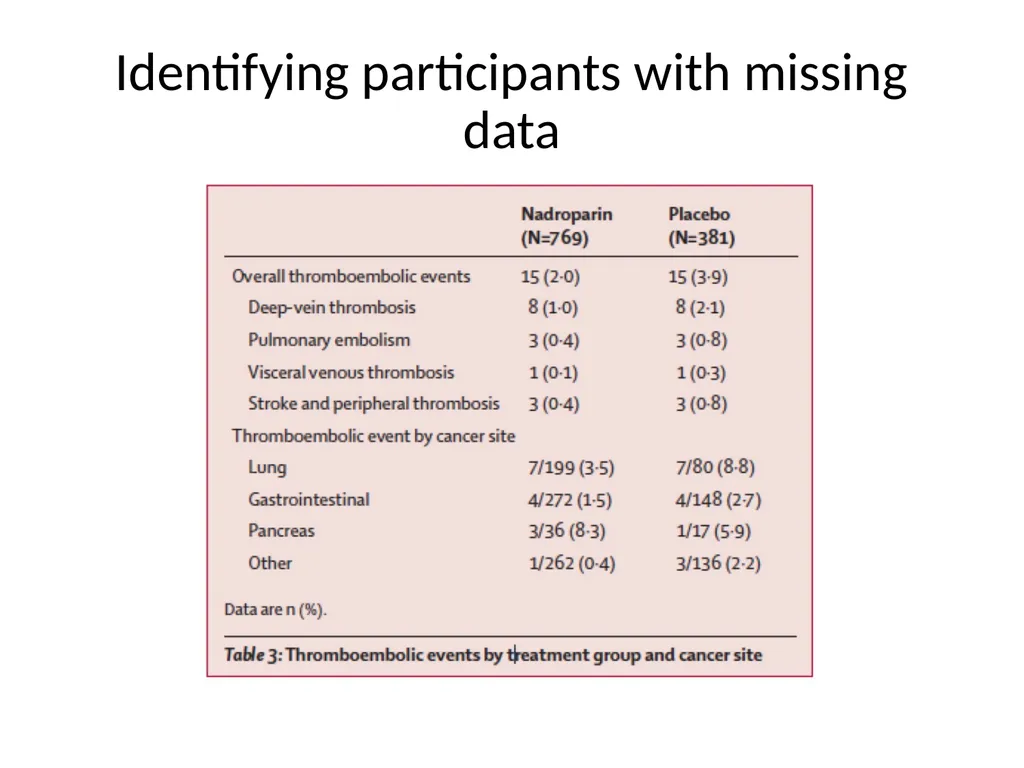
slide41. Practical issues Identifying in the RCT report, which participants were actually followed up, and which participants having data missing
Automatic integration of MPD in the analysis<br>
slide42. Identifying participants with missing data<br>
slide43. Identifying participants with missing data<br>
slide44. Using the Excel sheet<br>
slide45. Workshop plan Missing participant data at the RCT level
Missing participant data at the SR level
Practical issues
Discussion<br>
slide46. Discussion Is the proposed approach reasonable?
Is the proposed approach feasible?<br>
slide47. Thank you!<br>
slide48. Intervention arm | Control arm<br>
slide49. Dealing with MPD<br>
slide50. Dealing with MPD<br>
slide51. Dealing with MPD<br>
slide52. Missing Participant Data in trials When considering RCTs with statistically significant effect estimates:
58% of RCTs lose statistical significance when applying a worse case scenario
up to 33% of RCTs lose statistical significance when applying plausible assumptions about the outcome of participants for whom data are missing Akl et al. BMJ. 2012 May 18;344:e2809<br>
slide53. Dealing with MPD at the SR level<br>

Bradley Johnston, Pablo Alonso, Matthias Briel, Gordon Guyatt<br>
slide2. Disclosures No conflicts of interest to disclose
This work was funded by the Cochrane Methods Innovation Fund<br>
slide3. Objective To describe how to use an innovative approach to addressing missing participant data for dichotomous outcomes in systematic reviews of randomized trials<br>
slide4. Workshop plan Missing participant data at the RCT level
Missing participant data at the SR level
Practical issues
Discussion<br>
slide5. Workshop plan Missing participant data at the RCT level
Missing participant data at the SR level
Practical issues
Discussion<br>
slide6. Missing Participant Data MPD refers to:
participants excluded from the analysis of the effect estimate in the primary study because no data are available
MDP does not refer to:
Missing studies (e.g., unpublished studies);
Missing outcome data (e.g., unreported outcomes);
Missing summary data (e.g., unreported SD);
Missing study-level characteristics (e.g., mean age, for subgroup or meta-regression analyses)<br>
slide7. Dealing with MPD at the RCT level 87% of RCTs published in high impact medical journals had participants with missing data for the primary outcome
The median percentage of participants with missing data was 6% (inter-quartile range 2% to 14%) Akl et al. BMJ. 2012 May 18;344:e2809<br>
slide8. STUDY DESIGN AND OBJECTIVE<br>
slide11. CONCLUSION<br>
slide13. Karl et al. BJU. 2010.106:24-6 Primary outcome: overall success<br>
slide14. Dealing with MPD at the RCT level Complete case analysis
Make assumptions about the outcomes of participants with missing data:
None suffered the outcome
All suffered the outcome
Best case scenario
Worst case scenario<br>
slide15. Karl et al. BJU. 2010.106:24-6<br>
slide16. Karl et al. BJU. 2010.106:24-6<br>
slide17. Karl et al. BJU. 2010.106:24-6<br>
slide18. Dealing with MPD at the RCT level However, these assumptions are not plausible
More plausible assumptions: based on RIMPD/FU
event incidence among those with MPD (not followed-up) relative to the event incidence among those followed up
RIMPD/FU = 2: event incidence among those with MPD is double the event incidence among those followed up Akl et al. BMJ. 2012 May 18;344:e2809<br>
slide19. Exercise 1<br>
slide20. Exercise 1 solution<br>
slide21. Dealing with MPD at the RCT level What are the advantages and disadvantages of:
Complete case analysis
Assuming none suffered the outcome
Assuming all suffered the outcome
Assuming best case scenario
Assuming worst case scenario
RIMPD/FU approach<br>
slide22. Workshop plan Missing participant data at the RCT level
Missing participant data at the SR level
Practical issues
Discussion<br>
slide23. Dealing with MPD at the SR level What are the issues that systematic review authors need to deal with in relation to MPD?<br>
slide24. Dealing with MPD at the SR level We will discuss how systematic reviewer authors need to:
Deal with MPD when producing the pooled effect estimate for the primary analysis
Assess risk of bias associated with MPD and the extent to which introduces confidence in results (quality of evidence)<br>
slide26. Dealing with MPD at the SR level The Cochrane handbook encourages systematic reviewer authors to re-analyze a study’s effect estimate by including all randomized participants
The handbook, however, fails to provide detailed guidance on how such analyses should be conducted<br>
slide27. Proposal to handle MPD For the primary analysis: exclude participants with missing data (complete case analysis)
When the primary analysis suggests important effect, we suggest sensitivity meta-analyses making different assumptions about the outcome of participants with missing data, to test the robustness of the results (the risk of bias) Akl et al. PLoS One. 2013;8(2):e57132<br>
slide28. Handling dichotomous MPD<br>
slide29. Judging RoB dichotomous MPD Results robust to a worst case scenario missing data does not represent a risk of bias
Results not robust to worst case scenario test progressively more extreme assumptions culminating in a "worst plausible case”
Important changes in results with such sensitivity analyses suggest serious RoB<br>
slide30. Example 1 Meta-analysis assessing effects of probiotics for prevention clostridium difficile-associated diarrhea Johnston et al. Ann Intern Med. 2012 Dec 18;157(12):878-88<br>
slide31. Complete case analysis<br>
slide32. Event rate: 1.5:1<br>
slide33. Event rate: 3:1<br>
slide34. Event rate: 5:1<br>
slide35. Example 1 Based on these findings
Would you judge the risk of bias as: low or high?
Would you rate down the confidence in effect estimates (quality of evidence)?<br>
slide36. Example 2 Meta-analysis comparing oral direct factor Xa inhibitors to low-molecular-weight heparin for thromboprophylaxis in patients undergoing total hip or knee replacement
The primary analysis:
complete case analysis
factor Xa inhibitors reduced the incidence of symptomatic deep venous OR 0.46 (0.30-0.70) Neumann et al. Ann Intern Med. 2012 May 15;156(10)<br>
slide37. Example 2 Two sensitivity analyses based on extreme but plausible assumptions :
RILTFU/FU 2 and 3 for the intervention arm and 1 for control arm.
The effect estimates did not change appreciably: OR 0.54 (0.37-0.80), 0.59 (0.40-0.87) respectively Neumann et al. Ann Intern Med. 2012 May 15;156(10)<br>
slide38. Example 2 The results would lose statistically significance, OR 0.84 (0.59-1.20), when we assumed:
the lowest incidence among intervention arms of all included trials for those with missing data in the control group
the highest incidence among control arms of all included trials for those with missing data in the intervention group Neumann et al. Ann Intern Med. 2012 May 15;156(10)<br>
slide39. Example 2 Based on these findings
Would you judge the risk of bias as: low or high?
Would you rate down the confidence in effect estimates (quality of evidence)?<br>
slide40. Workshop plan Missing participant data at the RCT level
Missing participant data at the SR level
Practical issues
Discussion<br>
slide41. Practical issues Identifying in the RCT report, which participants were actually followed up, and which participants having data missing
Automatic integration of MPD in the analysis<br>
slide42. Identifying participants with missing data<br>
slide43. Identifying participants with missing data<br>
slide44. Using the Excel sheet<br>
slide45. Workshop plan Missing participant data at the RCT level
Missing participant data at the SR level
Practical issues
Discussion<br>
slide46. Discussion Is the proposed approach reasonable?
Is the proposed approach feasible?<br>
slide47. Thank you!<br>
slide48. Intervention arm | Control arm<br>
slide49. Dealing with MPD<br>
slide50. Dealing with MPD<br>
slide51. Dealing with MPD<br>
slide52. Missing Participant Data in trials When considering RCTs with statistically significant effect estimates:
58% of RCTs lose statistical significance when applying a worse case scenario
up to 33% of RCTs lose statistical significance when applying plausible assumptions about the outcome of participants for whom data are missing Akl et al. BMJ. 2012 May 18;344:e2809<br>
slide53. Dealing with MPD at the SR level<br>