
Aidan Tuohy Sr. Project Engineer NWPCC Flexibility




Description: Aidan Tuohy Sr. Project Engineer NWPCC Flexibility Metric Roundtable April 2013 Metrics and Methods to Assess Power System Flexibility Contents Strategic and flexible planning project (P40.019) Work to date Current work Flexibility
Related Topics
Download Presentation
"Aidan Tuohy Sr. Project Engineer NWPCC Flexibility" is the property of its rightful owner. Permission is granted to download and print the materials on this website for personal, non-commercial use only, and to display it on your personal computer provided you do not modify the materials and that you retain all copyright notices contained in the materials. By downloading content from our website, you accept the terms of this agreement.
Presentation Transcript
slide1. Aidan Tuohy
Sr. Project Engineer
NWPCC Flexibility Metric Roundtable April 2013 Metrics and Methods to Assess Power System Flexibility<br>
slide2. Contents Strategic and flexible planning project (P40.019)
Work to date
Current work
Flexibility assessment metrics
System flexibility metrics
Refinements required<br>
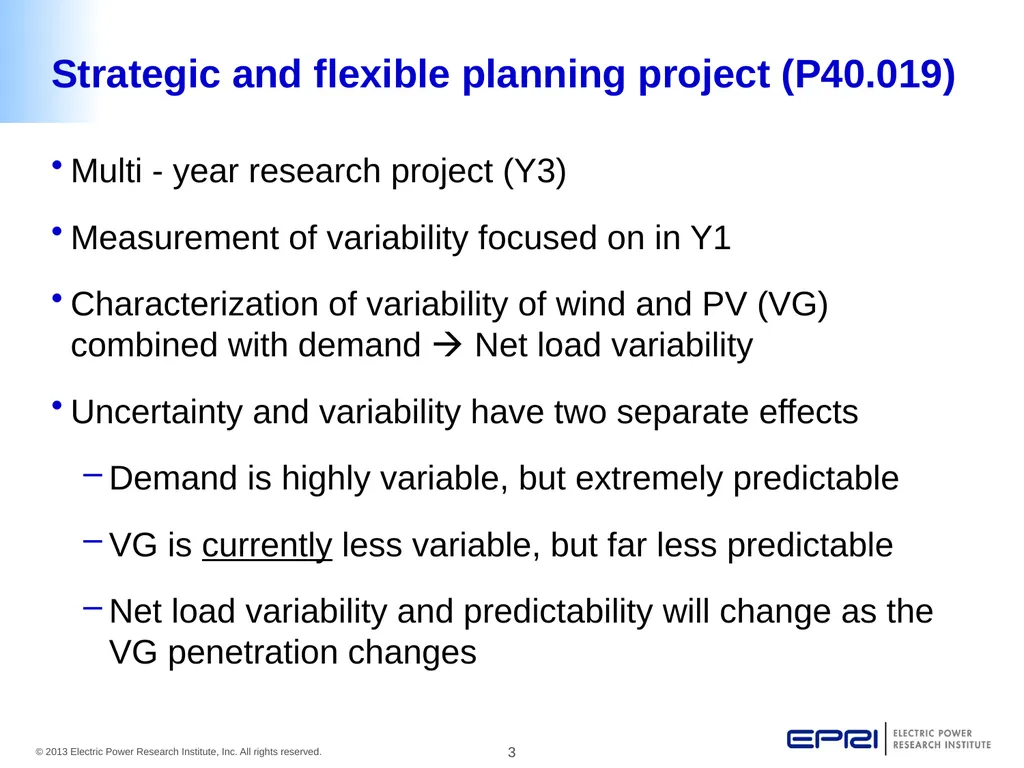
slide3. Strategic and flexible planning project (P40.019) Multi - year research project (Y3)
Measurement of variability focused on in Y1
Characterization of variability of wind and PV (VG) combined with demand Net load variability
Uncertainty and variability have two separate effects
Demand is highly variable, but extremely predictable
VG is currently less variable, but far less predictable
Net load variability and predictability will change as the VG penetration changes<br>
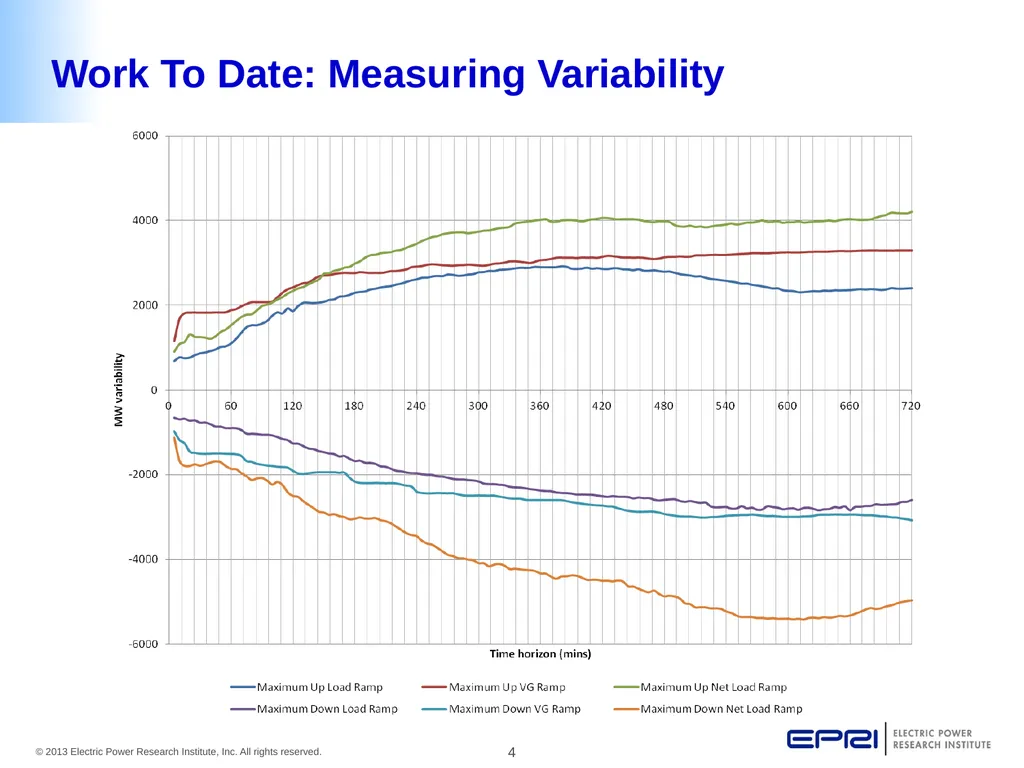
slide4. Work To Date: Measuring Variability<br>
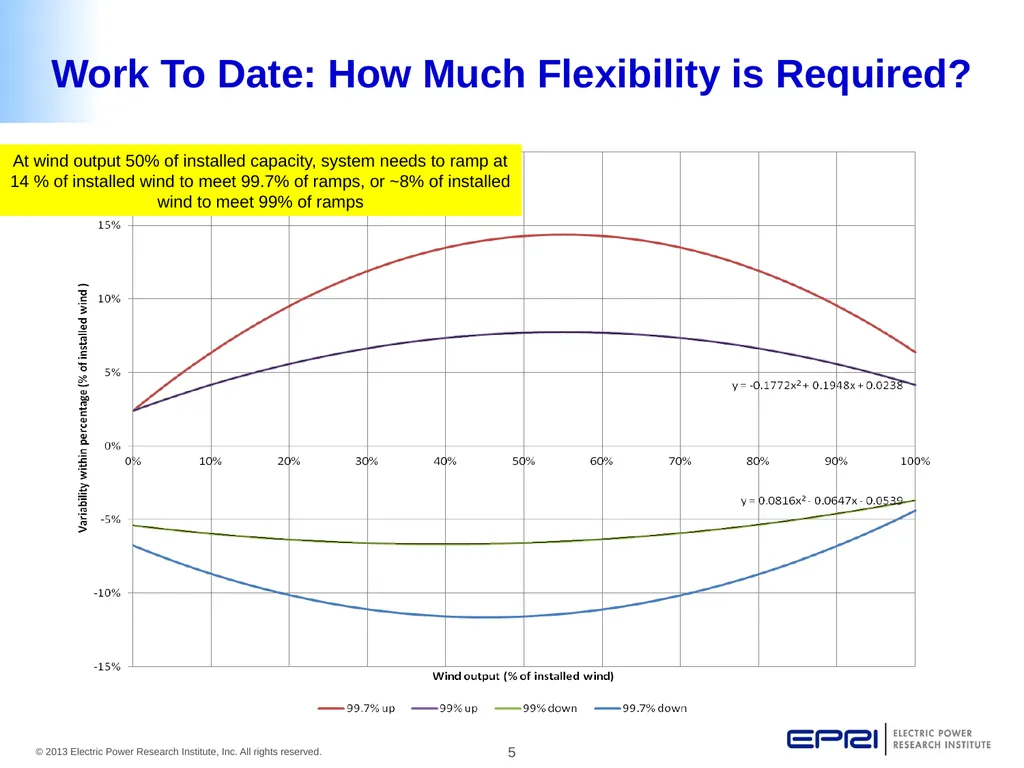
slide5. Work To Date: How Much Flexibility is Required? At wind output 50% of installed capacity, system needs to ramp at 14 % of installed wind to meet 99.7% of ramps, or ~8% of installed wind to meet 99% of ramps<br>
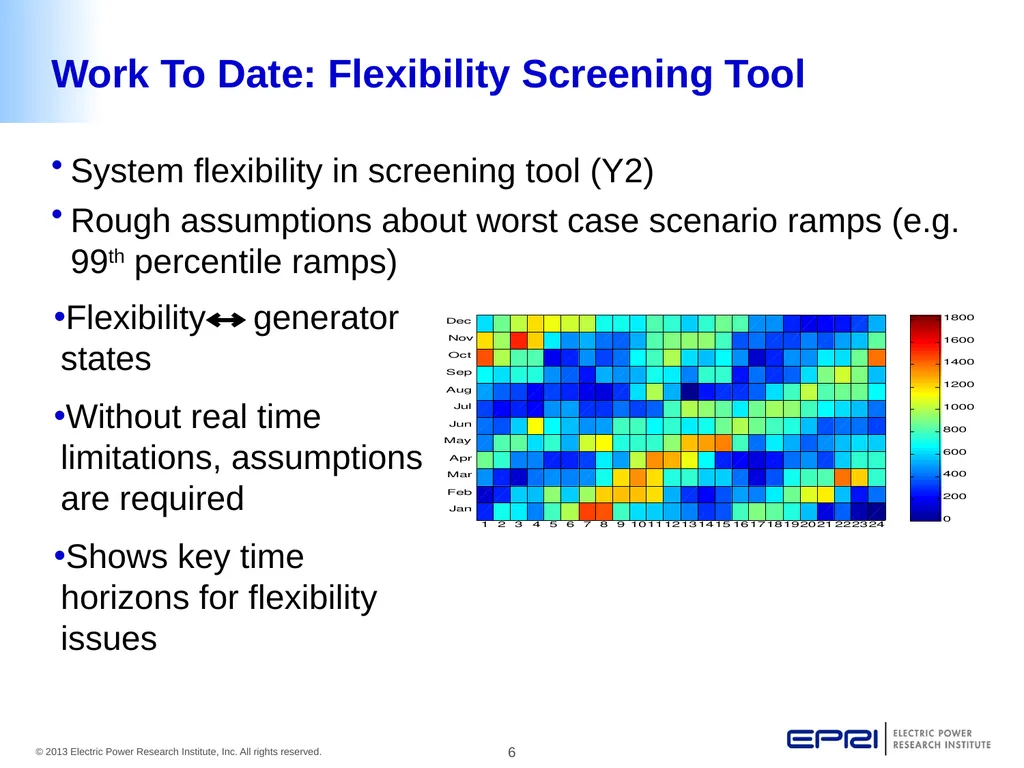
slide6. Work To Date: Flexibility Screening Tool System flexibility in screening tool (Y2)
Rough assumptions about worst case scenario ramps (e.g. 99th percentile ramps) Flexibility generator states
Without real time limitations, assumptions are required
Shows key time horizons for flexibility issues<br>
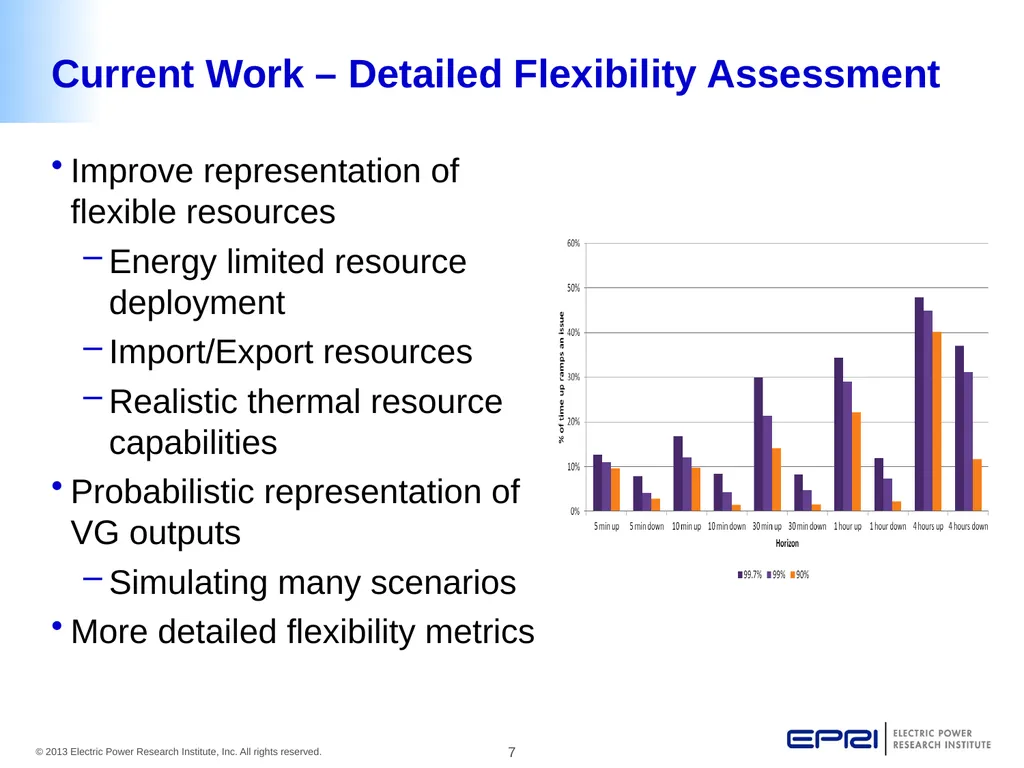
slide7. Current Work – Detailed Flexibility Assessment Improve representation of flexible resources
Energy limited resource deployment
Import/Export resources
Realistic thermal resource capabilities
Probabilistic representation of VG outputs
Simulating many scenarios
More detailed flexibility metrics<br>
slide8. Flexibility Metrics<br>
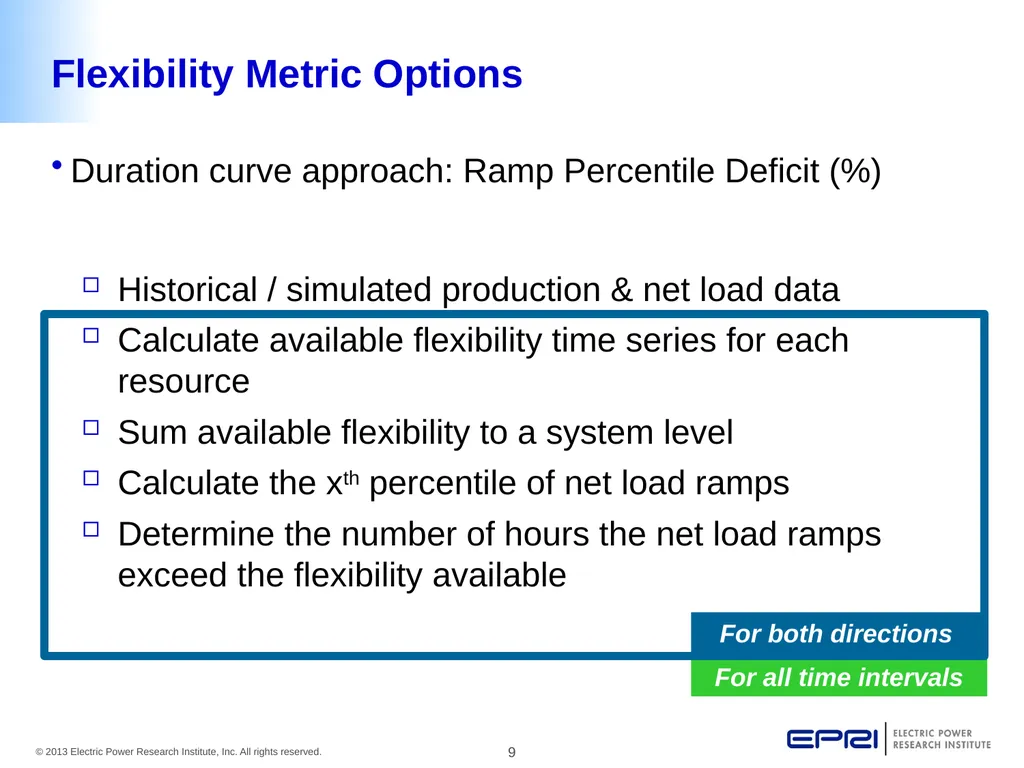
slide9. Flexibility Metric Options Duration curve approach: Ramp Percentile Deficit (%) Historical / simulated production & net load data
Calculate available flexibility time series for each resource
Sum available flexibility to a system level
Calculate the xth percentile of net load ramps
Determine the number of hours the net load ramps exceed the flexibility available For all time intervals For both directions<br>
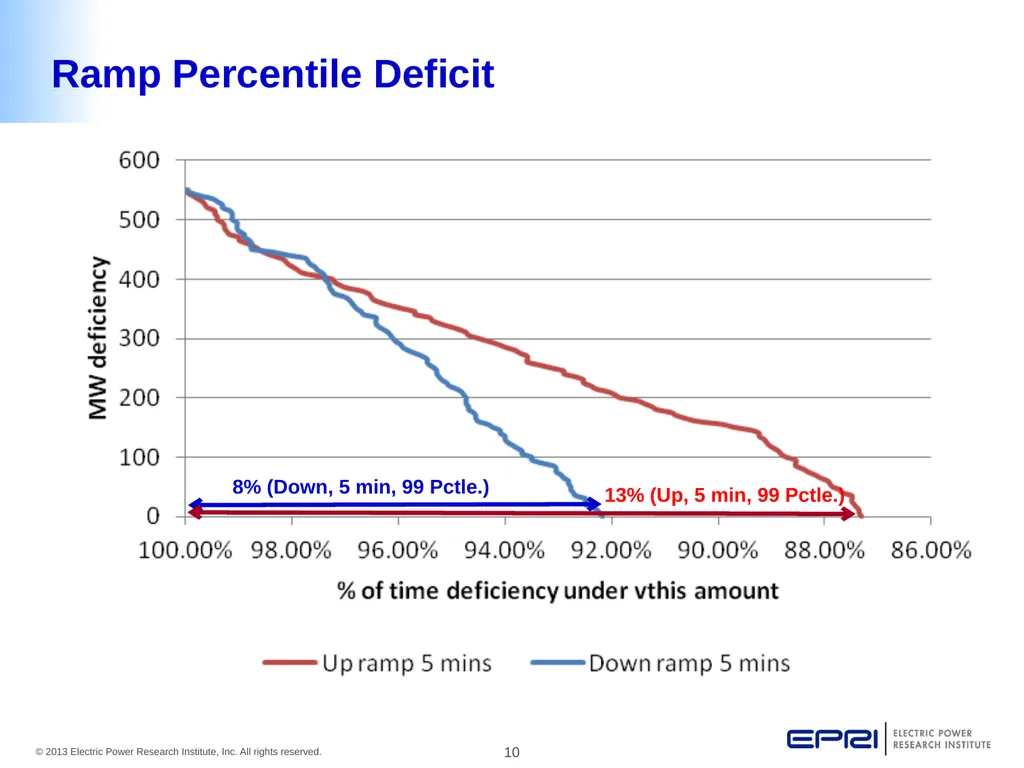
slide10. Ramp Percentile Deficit 8% (Down, 5 min, 99 Pctle.) 13% (Up, 5 min, 99 Pctle.)<br>
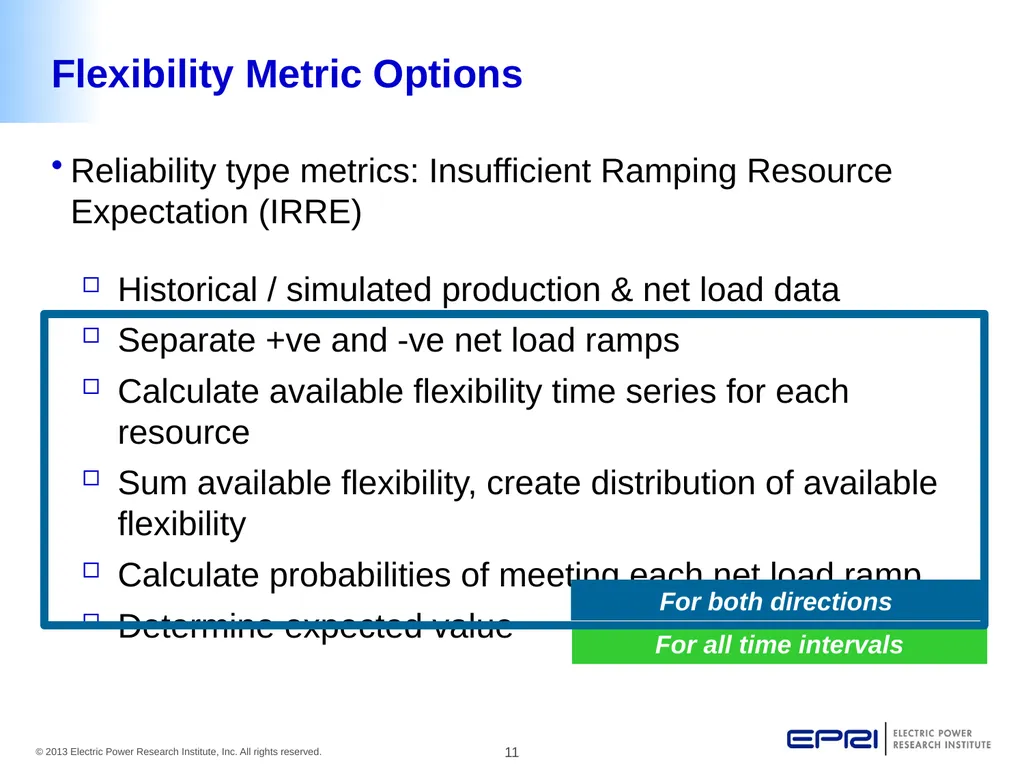
slide11. Flexibility Metric Options Reliability type metrics: Insufficient Ramping Resource Expectation (IRRE) Historical / simulated production & net load data
Separate +ve and -ve net load ramps
Calculate available flexibility time series for each resource
Sum available flexibility, create distribution of available flexibility
Calculate probabilities of meeting each net load ramp
Determine expected value For all time intervals For both directions<br>
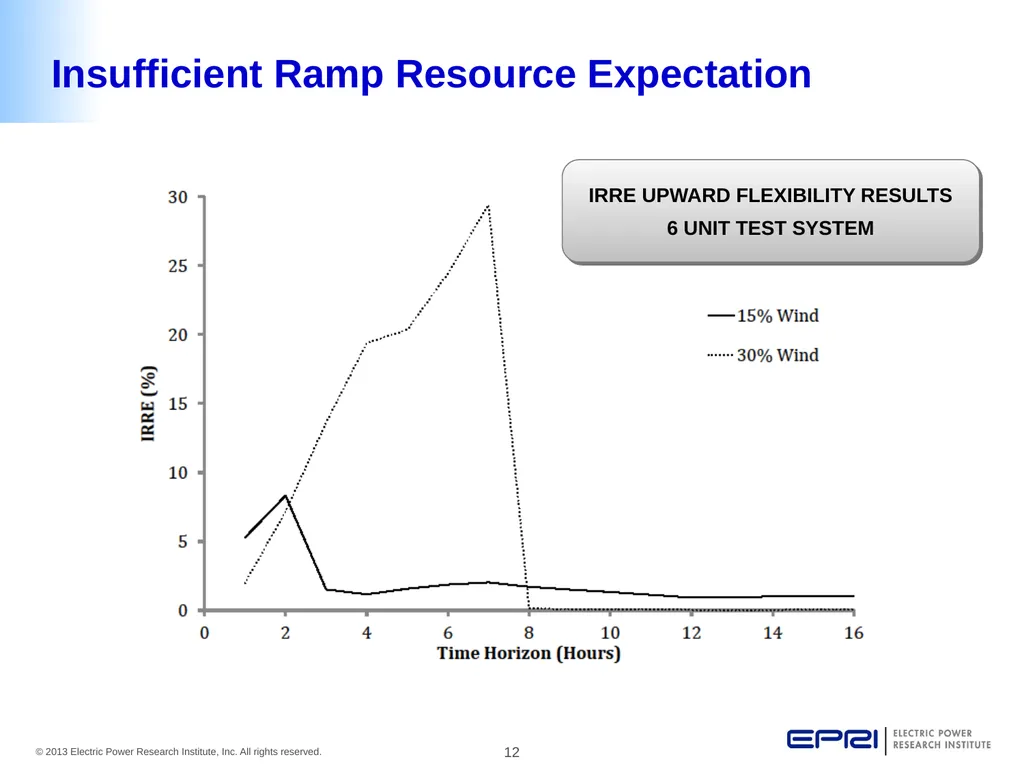
slide12. Insufficient Ramp Resource Expectation IRRE UPWARD FLEXIBILITY RESULTS
6 UNIT TEST SYSTEM<br>
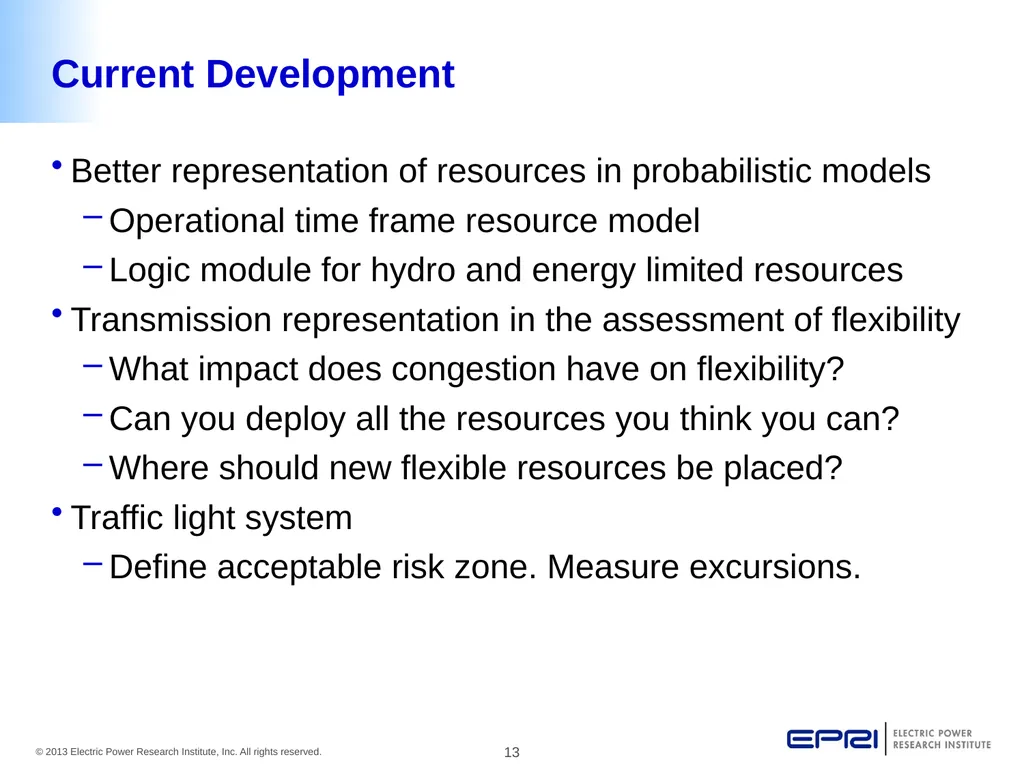
slide13. Current Development Better representation of resources in probabilistic models
Operational time frame resource model
Logic module for hydro and energy limited resources
Transmission representation in the assessment of flexibility
What impact does congestion have on flexibility?
Can you deploy all the resources you think you can?
Where should new flexible resources be placed?
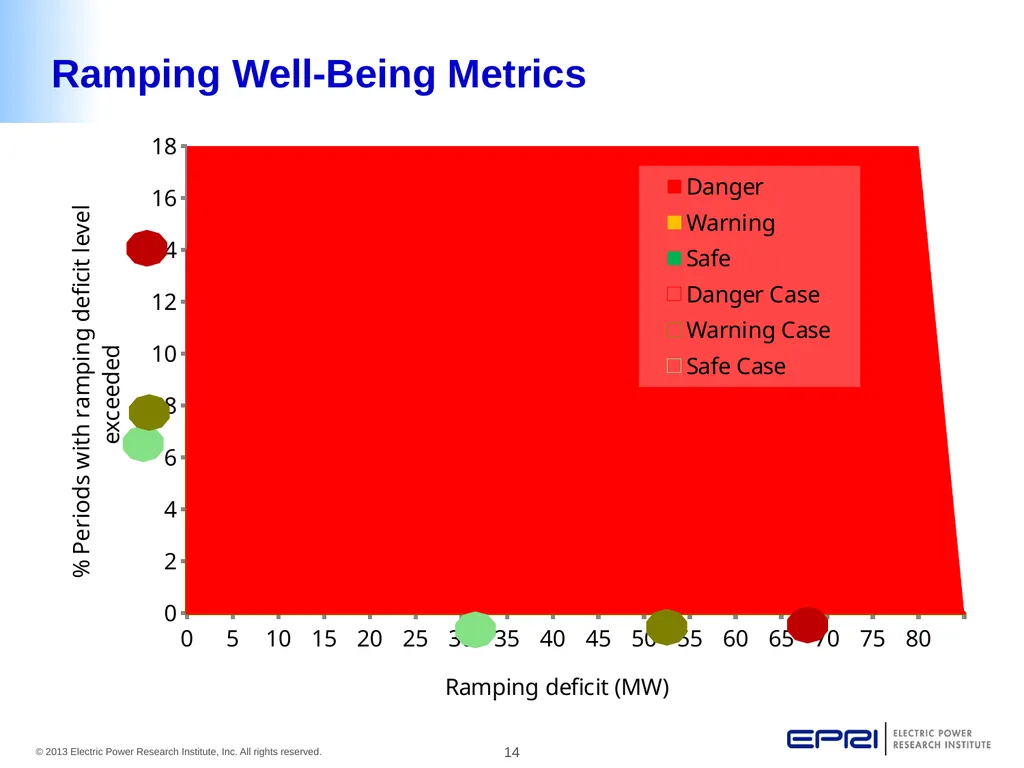
Traffic light system
Define acceptable risk zone. Measure excursions.<br>
slide14. Ramping Well-Being Metrics<br>
slide15. Together…Shaping the Future of Electricity<br>
NWPCC Flexibility Metric Roundtable April 2013 Metrics and Methods to Assess Power System Flexibility<br>
slide2. Contents Strategic and flexible planning project (P40.019)
Work to date
Current work
Flexibility assessment metrics
System flexibility metrics
Refinements required<br>
slide3. Strategic and flexible planning project (P40.019) Multi - year research project (Y3)
Measurement of variability focused on in Y1
Characterization of variability of wind and PV (VG) combined with demand Net load variability
Uncertainty and variability have two separate effects
Demand is highly variable, but extremely predictable
VG is currently less variable, but far less predictable
Net load variability and predictability will change as the VG penetration changes<br>
slide4. Work To Date: Measuring Variability<br>
slide5. Work To Date: How Much Flexibility is Required? At wind output 50% of installed capacity, system needs to ramp at 14 % of installed wind to meet 99.7% of ramps, or ~8% of installed wind to meet 99% of ramps<br>
slide6. Work To Date: Flexibility Screening Tool System flexibility in screening tool (Y2)
Rough assumptions about worst case scenario ramps (e.g. 99th percentile ramps) Flexibility generator states
Without real time limitations, assumptions are required
Shows key time horizons for flexibility issues<br>
slide7. Current Work – Detailed Flexibility Assessment Improve representation of flexible resources
Energy limited resource deployment
Import/Export resources
Realistic thermal resource capabilities
Probabilistic representation of VG outputs
Simulating many scenarios
More detailed flexibility metrics<br>
slide8. Flexibility Metrics<br>
slide9. Flexibility Metric Options Duration curve approach: Ramp Percentile Deficit (%) Historical / simulated production & net load data
Calculate available flexibility time series for each resource
Sum available flexibility to a system level
Calculate the xth percentile of net load ramps
Determine the number of hours the net load ramps exceed the flexibility available For all time intervals For both directions<br>
slide10. Ramp Percentile Deficit 8% (Down, 5 min, 99 Pctle.) 13% (Up, 5 min, 99 Pctle.)<br>
slide11. Flexibility Metric Options Reliability type metrics: Insufficient Ramping Resource Expectation (IRRE) Historical / simulated production & net load data
Separate +ve and -ve net load ramps
Calculate available flexibility time series for each resource
Sum available flexibility, create distribution of available flexibility
Calculate probabilities of meeting each net load ramp
Determine expected value For all time intervals For both directions<br>
slide12. Insufficient Ramp Resource Expectation IRRE UPWARD FLEXIBILITY RESULTS
6 UNIT TEST SYSTEM<br>
slide13. Current Development Better representation of resources in probabilistic models
Operational time frame resource model
Logic module for hydro and energy limited resources
Transmission representation in the assessment of flexibility
What impact does congestion have on flexibility?
Can you deploy all the resources you think you can?
Where should new flexible resources be placed?
Traffic light system
Define acceptable risk zone. Measure excursions.<br>
slide14. Ramping Well-Being Metrics<br>
slide15. Together…Shaping the Future of Electricity<br>