
Analysis of Clustered and Longitudinal Data Module
Description: Analysis of Clustered and Longitudinal Data Module 2 Vocabulary Slam and an Introduction to Linear Mixed Models (LMMs) Agenda Vocabulary Slam We begin this module by defining clustered and longitudinal data, and address other terms used
Related Topics
Download Presentation
"Analysis of Clustered and Longitudinal Data Module" is the property of its rightful owner. Permission is granted to download and print the materials on this website for personal, non-commercial use only, and to display it on your personal computer provided you do not modify the materials and that you retain all copyright notices contained in the materials. By downloading content from our website, you accept the terms of this agreement.
Presentation Transcript
slide1. Analysis of Clustered and Longitudinal Data Module 2
Vocabulary Slam and an Introduction to Linear Mixed Models (LMMs)<br>
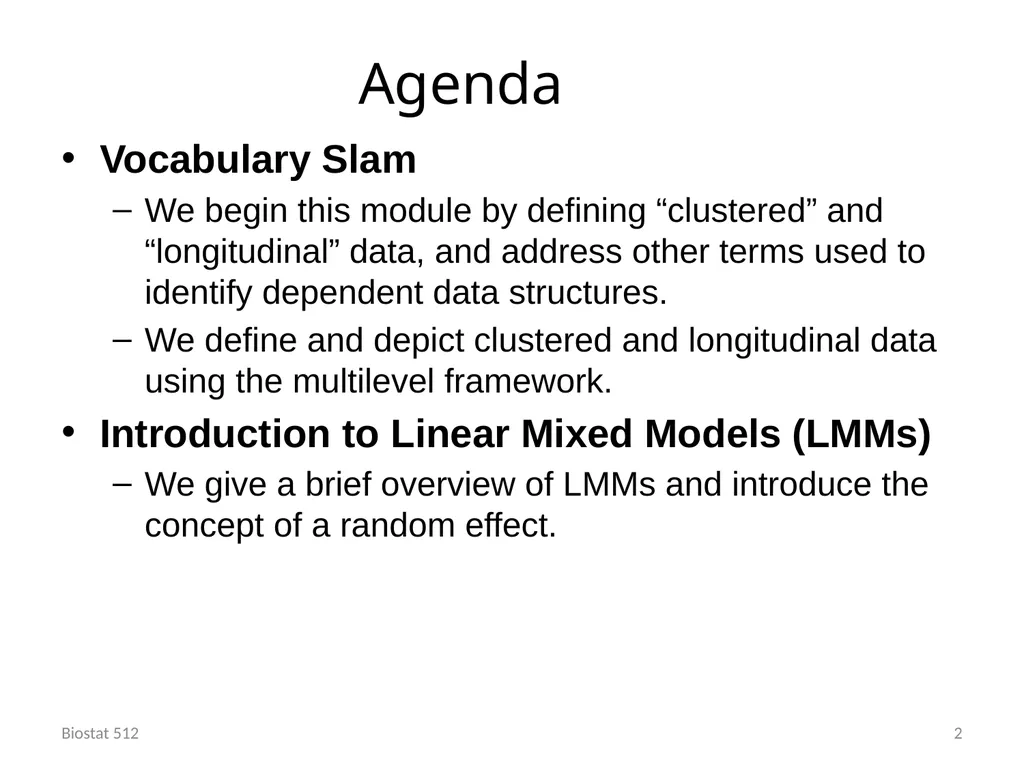
slide2. Agenda Vocabulary Slam
We begin this module by defining “clustered” and “longitudinal” data, and address other terms used to identify dependent data structures.
We define and depict clustered and longitudinal data using the multilevel framework.
Introduction to Linear Mixed Models (LMMs)
We give a brief overview of LMMs and introduce the concept of a random effect. Biostat 512 2<br>
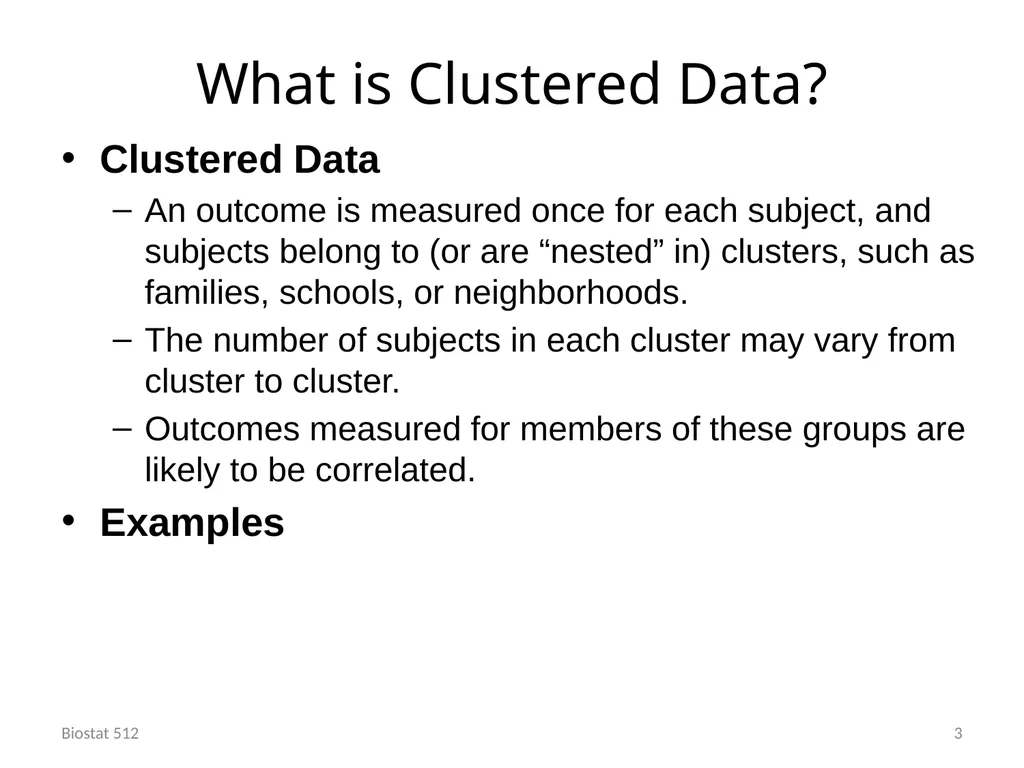
slide3. What is Clustered Data? Clustered Data
An outcome is measured once for each subject, and subjects belong to (or are “nested” in) clusters, such as families, schools, or neighborhoods.
The number of subjects in each cluster may vary from cluster to cluster.
Outcomes measured for members of these groups are likely to be correlated.
Examples Biostat 512 3<br>
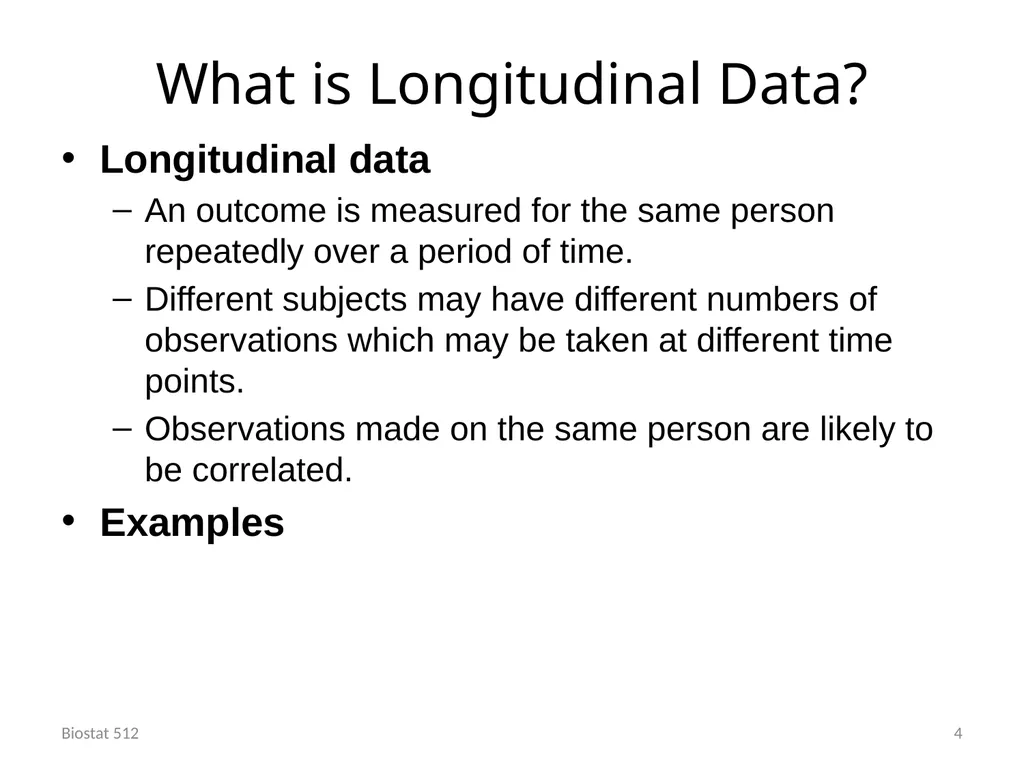
slide4. What is Longitudinal Data? Longitudinal data
An outcome is measured for the same person repeatedly over a period of time.
Different subjects may have different numbers of observations which may be taken at different time points.
Observations made on the same person are likely to be correlated.
Examples Biostat 512 4<br>
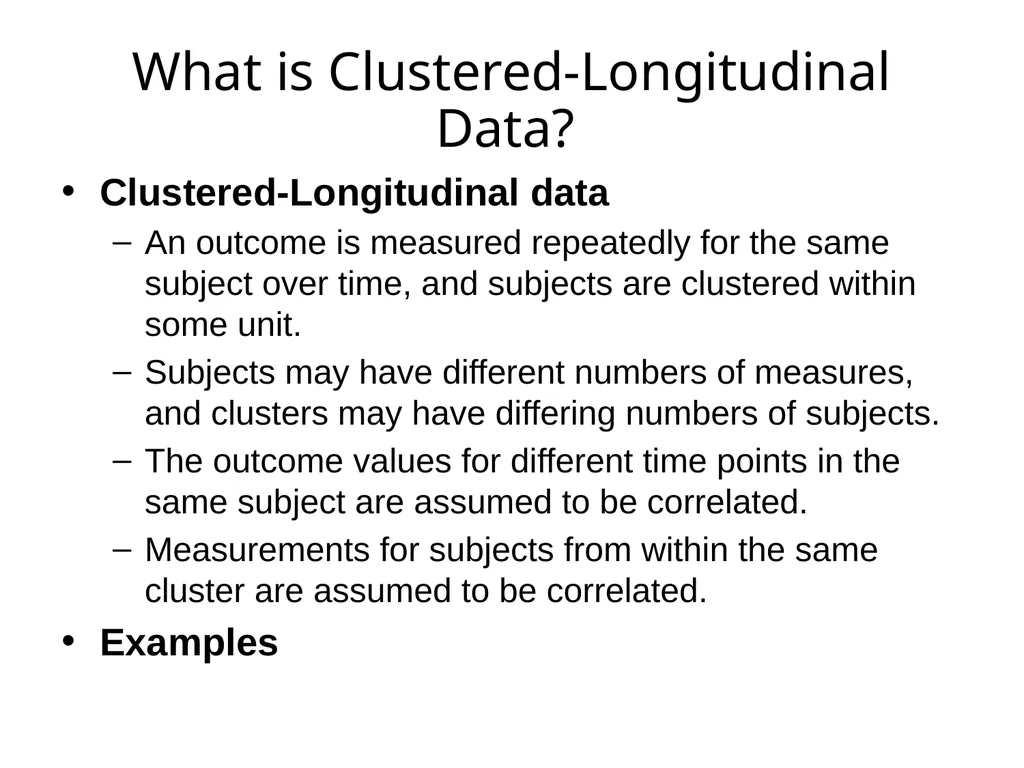
slide5. What is Clustered-Longitudinal Data? Clustered-Longitudinal data
An outcome is measured repeatedly for the same subject over time, and subjects are clustered within some unit.
Subjects may have different numbers of measures, and clusters may have differing numbers of subjects.
The outcome values for different time points in the same subject are assumed to be correlated.
Measurements for subjects from within the same cluster are assumed to be correlated.
Examples<br>
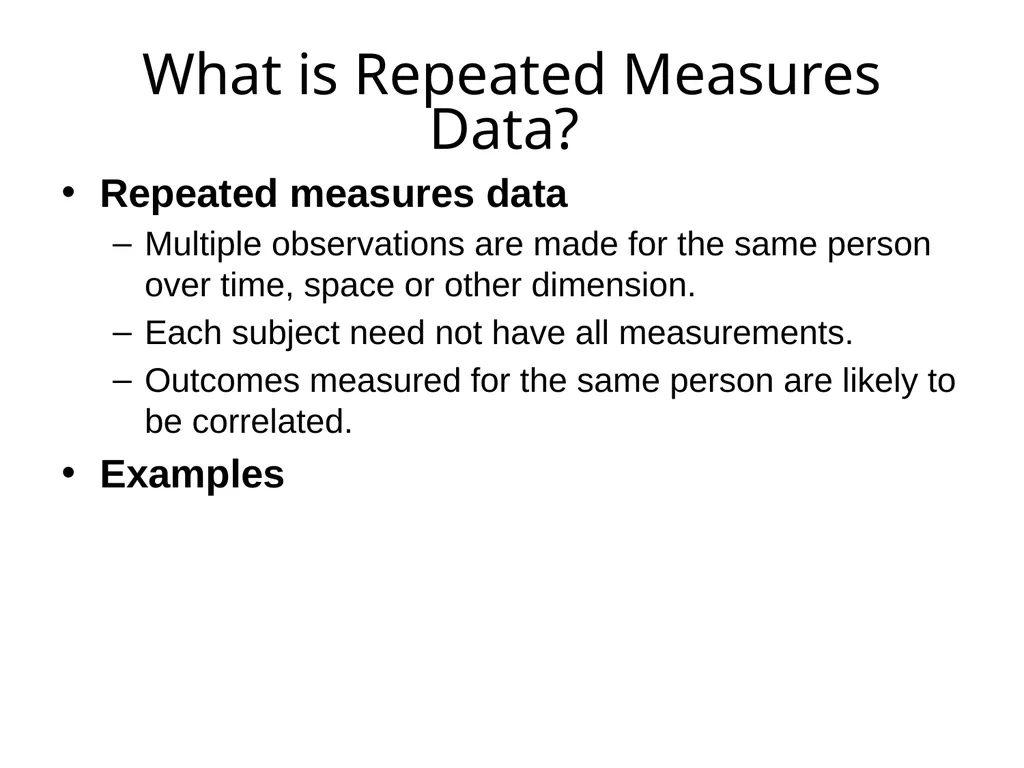
slide6. What is Repeated Measures Data? Repeated measures data
Multiple observations are made for the same person over time, space or other dimension.
Each subject need not have all measurements.
Outcomes measured for the same person are likely to be correlated.
Examples<br>
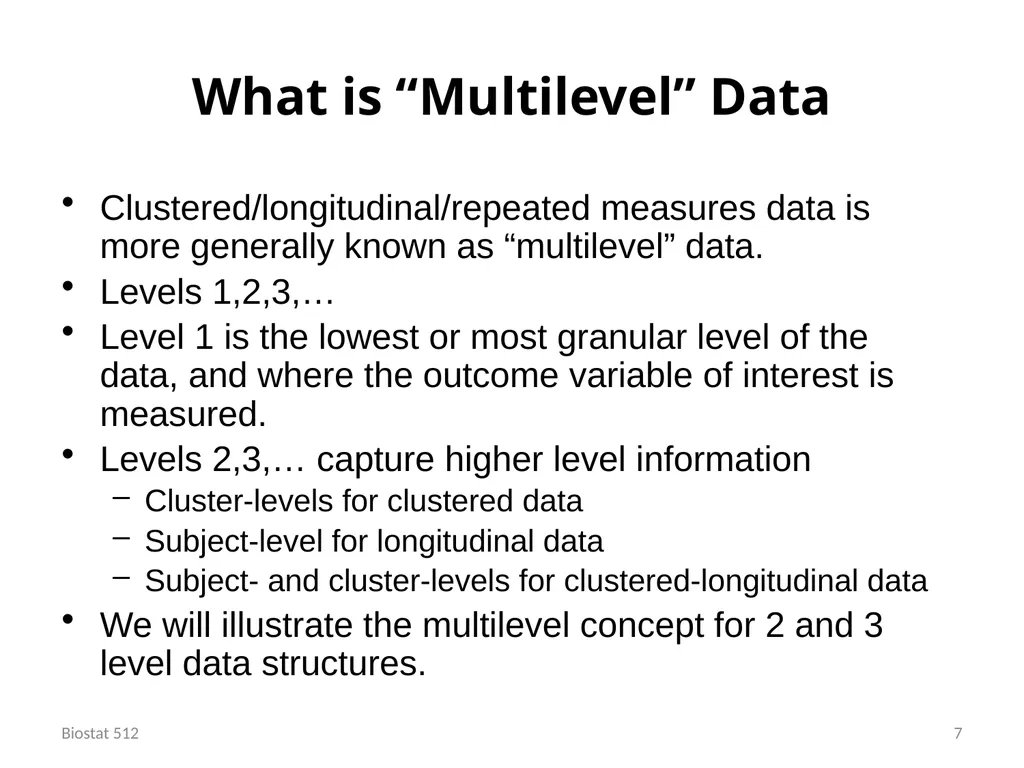
slide7. What is “Multilevel” Data 7 Biostat 512 Clustered/longitudinal/repeated measures data is more generally known as “multilevel” data.
Levels 1,2,3,…
Level 1 is the lowest or most granular level of the data, and where the outcome variable of interest is measured.
Levels 2,3,… capture higher level information
Cluster-levels for clustered data
Subject-level for longitudinal data
Subject- and cluster-levels for clustered-longitudinal data
We will illustrate the multilevel concept for 2 and 3 level data structures.<br>
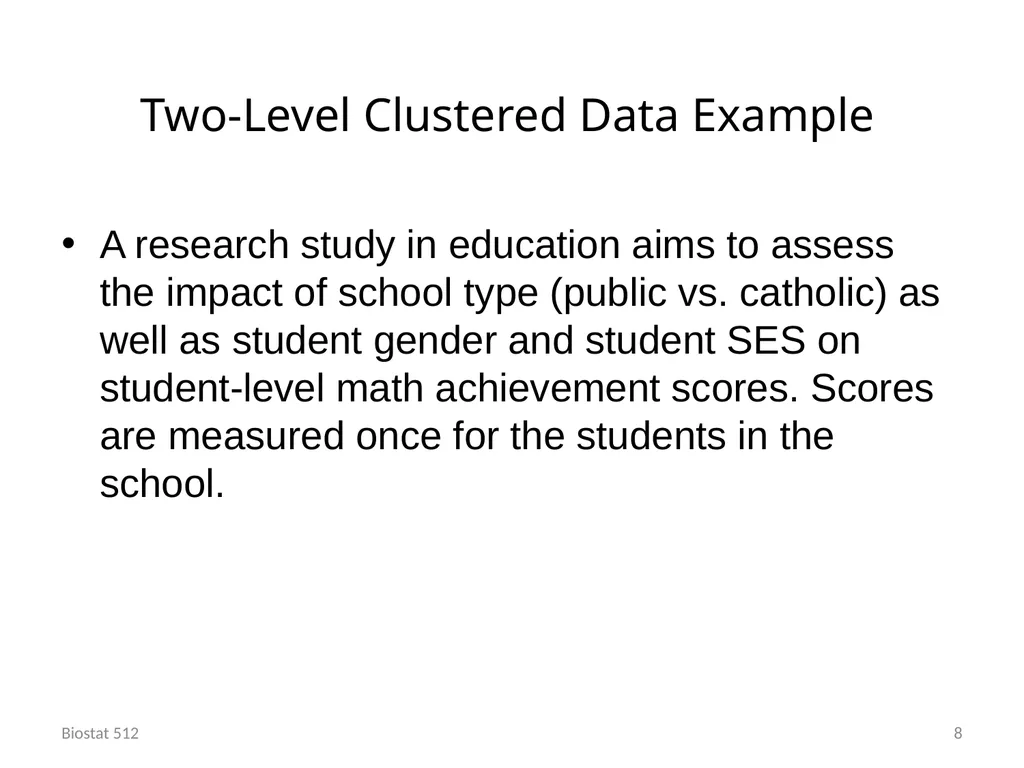
slide8. Two-Level Clustered Data Example Biostat 512 8 A research study in education aims to assess the impact of school type (public vs. catholic) as well as student gender and student SES on student-level math achievement scores. Scores are measured once for the students in the school.<br>
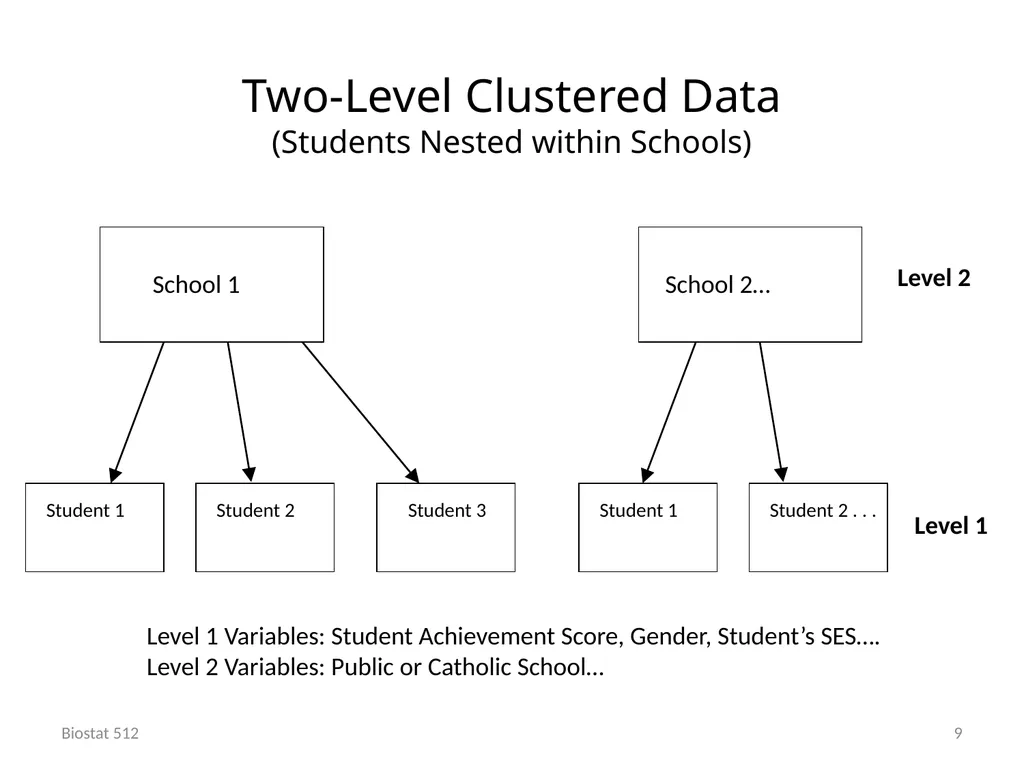
slide9. Two-Level Clustered Data (Students Nested within Schools) Biostat 512 9 Level 2 Level 1 Level 1 Variables: Student Achievement Score, Gender, Student’s SES….
Level 2 Variables: Public or Catholic School…<br>
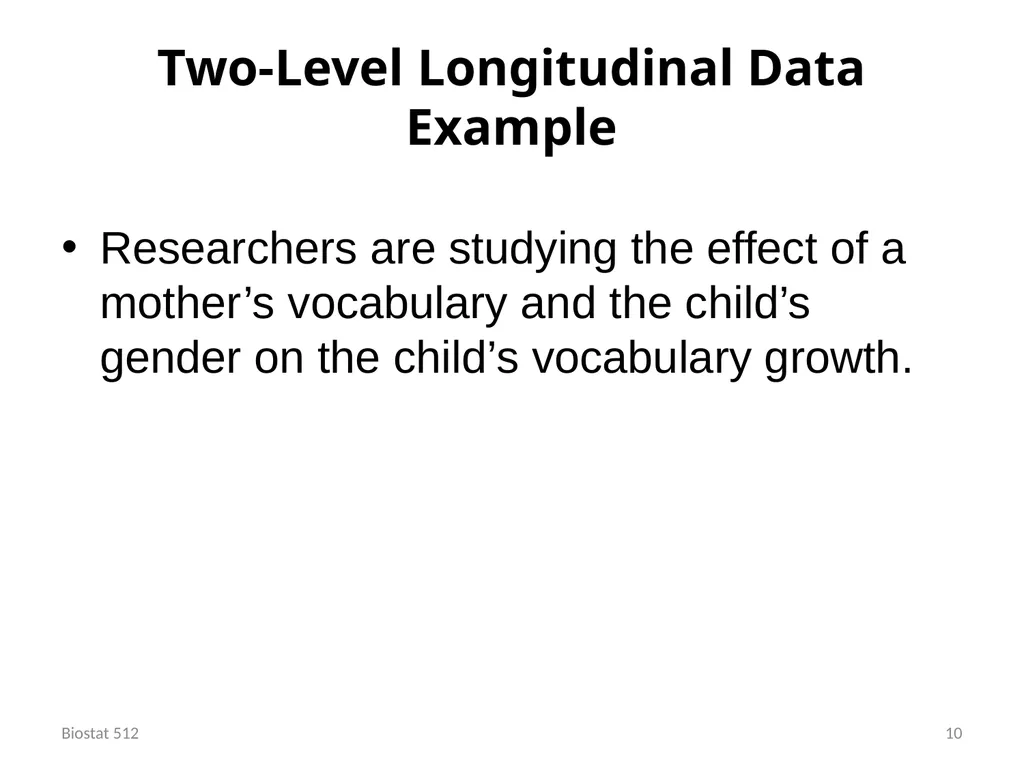
slide10. Two-Level Longitudinal Data Example Researchers are studying the effect of a mother’s vocabulary and the child’s gender on the child’s vocabulary growth. 10 Biostat 512<br>
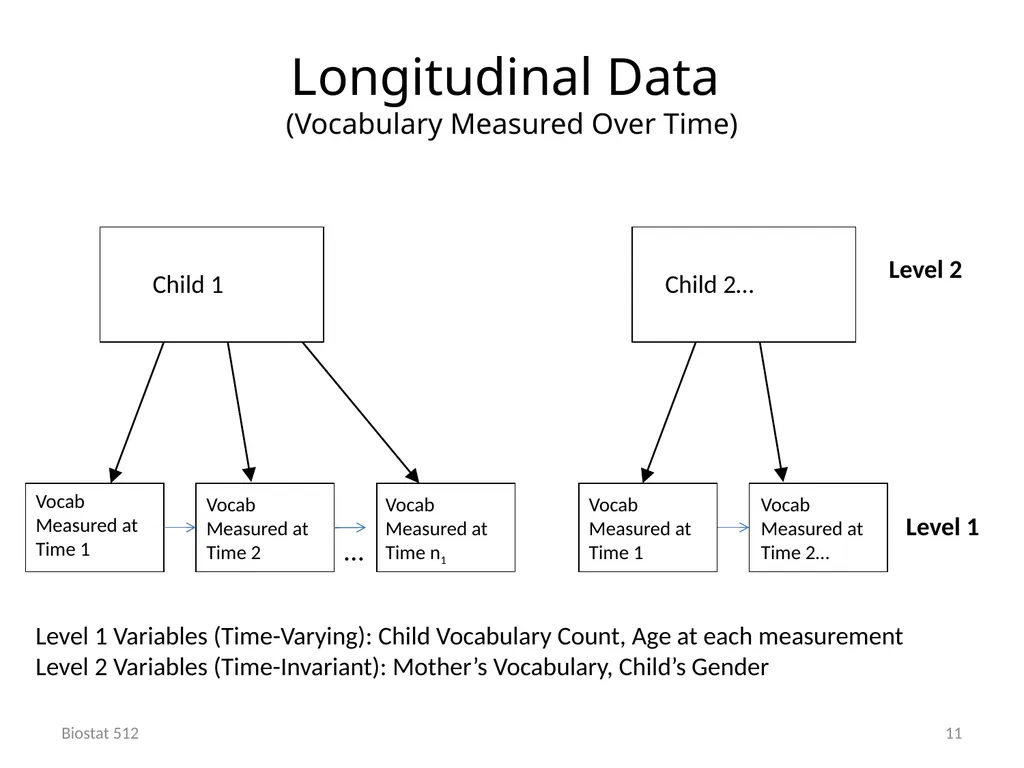
slide11. Longitudinal Data (Vocabulary Measured Over Time) Biostat 512 11 Level 2 Level 1 Level 1 Variables (Time-Varying): Child Vocabulary Count, Age at each measurement
Level 2 Variables (Time-Invariant): Mother’s Vocabulary, Child’s Gender<br>
slide12. Two-Level Repeated Measures Example Researchers are studying the effect of two different treatments on nucleotide bonding in three regions of the brain in rats. Measurements are taken from the same three regions of the brain of each rat, after each of the two different treatments. 12 Biostat 512<br>
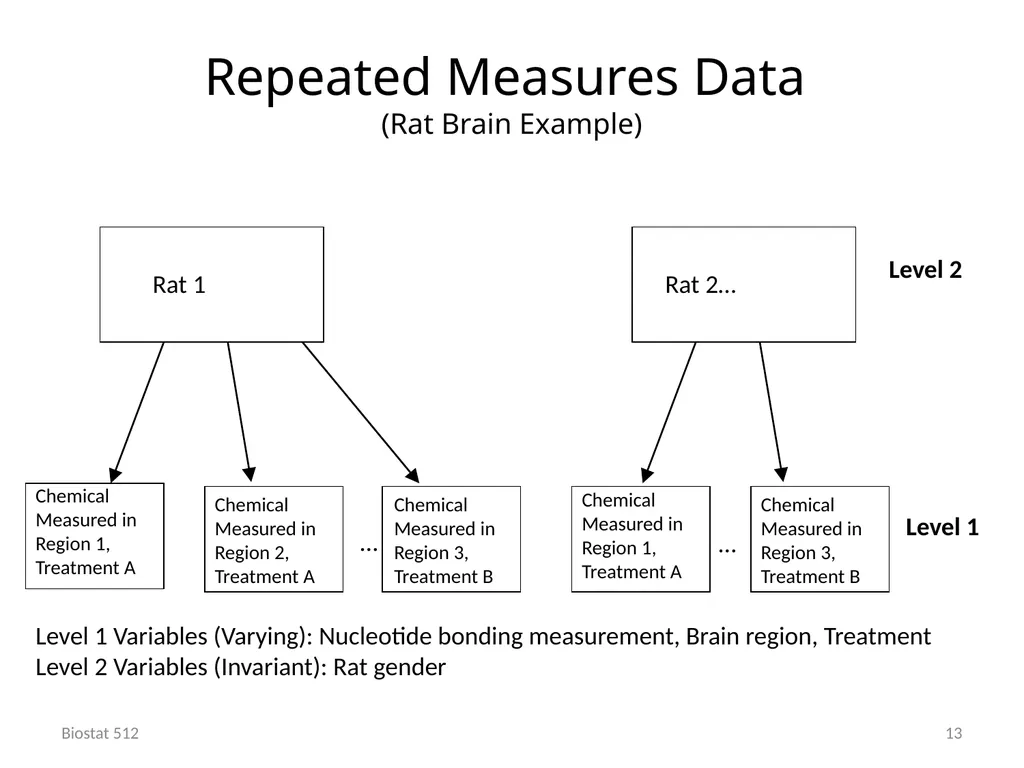
slide13. Repeated Measures Data (Rat Brain Example) Biostat 512 13 Level 2 Level 1 Level 1 Variables (Varying): Nucleotide bonding measurement, Brain region, Treatment
Level 2 Variables (Invariant): Rat gender … …<br>
slide14. Three-Level Clustered Data Example Biostat 512 14 A research study in education aims to assess the impact of school, classroom, and student-level variables on student achievement.<br>
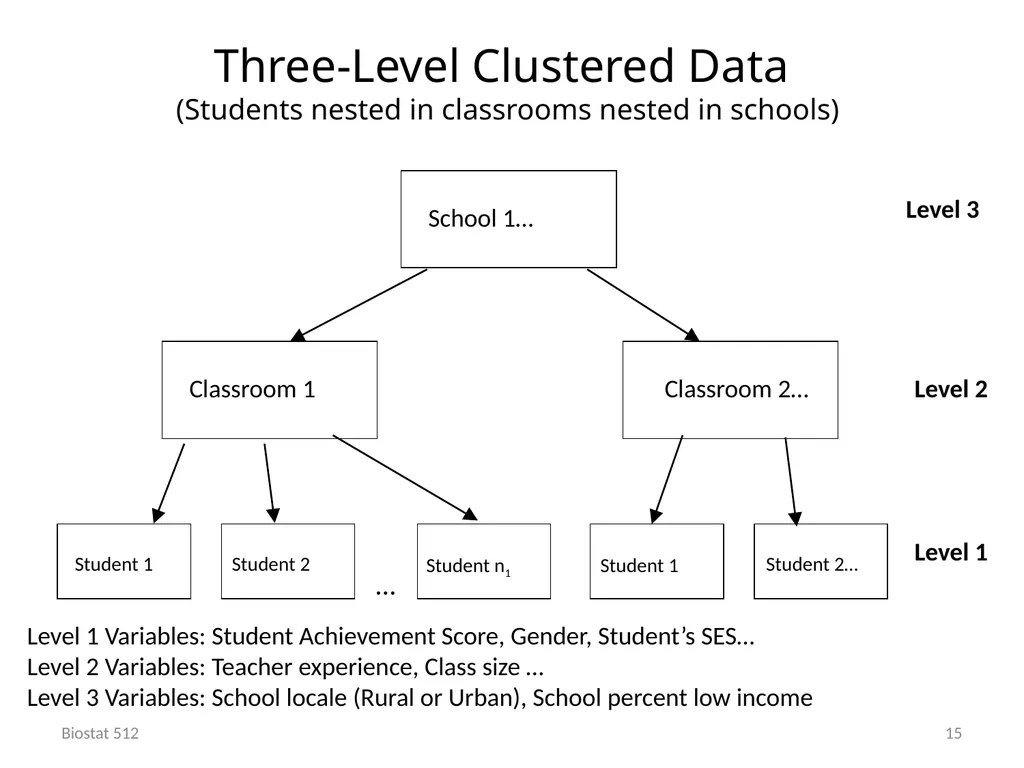
slide15. Three-Level Clustered Data (Students nested in classrooms nested in schools) Biostat 512 15 Level 3 Level 1 Level 1 Variables: Student Achievement Score, Gender, Student’s SES…
Level 2 Variables: Teacher experience, Class size …
Level 3 Variables: School locale (Rural or Urban), School percent low income Student 2 Student n1 Classroom 1 Student 1 Classroom 2… … Student 2… Student 1 Level 2 School 1…<br>
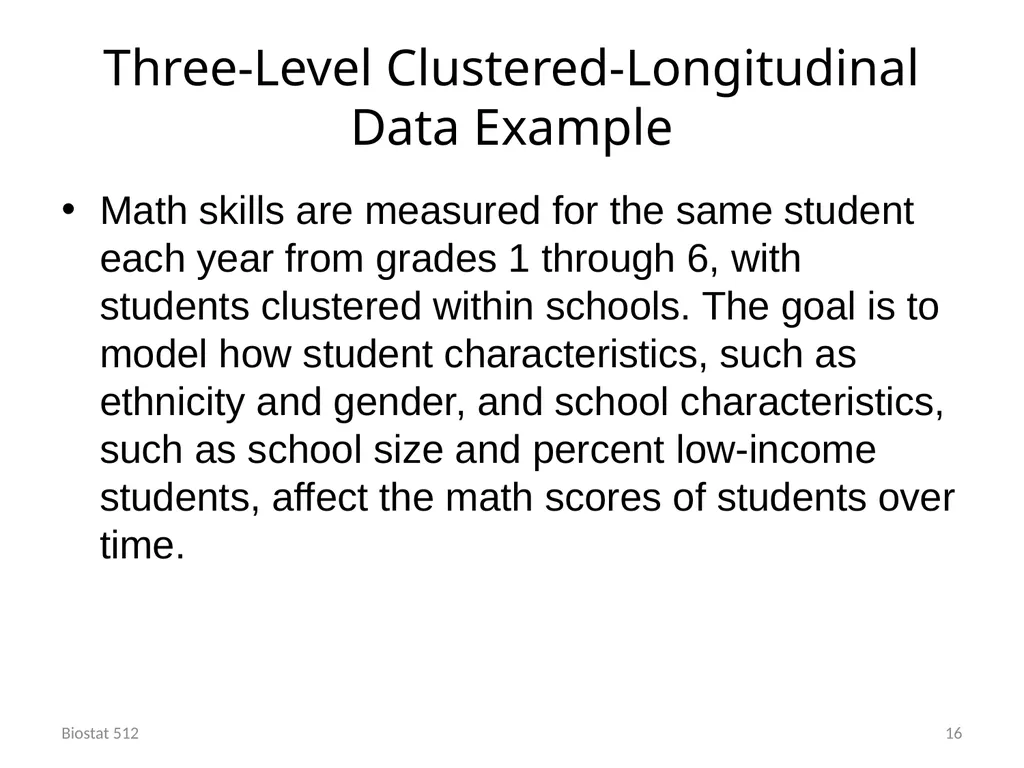
slide16. Three-Level Clustered-Longitudinal Data Example Math skills are measured for the same student each year from grades 1 through 6, with students clustered within schools. The goal is to model how student characteristics, such as ethnicity and gender, and school characteristics, such as school size and percent low-income students, affect the math scores of students over time. 16 Biostat 512<br>
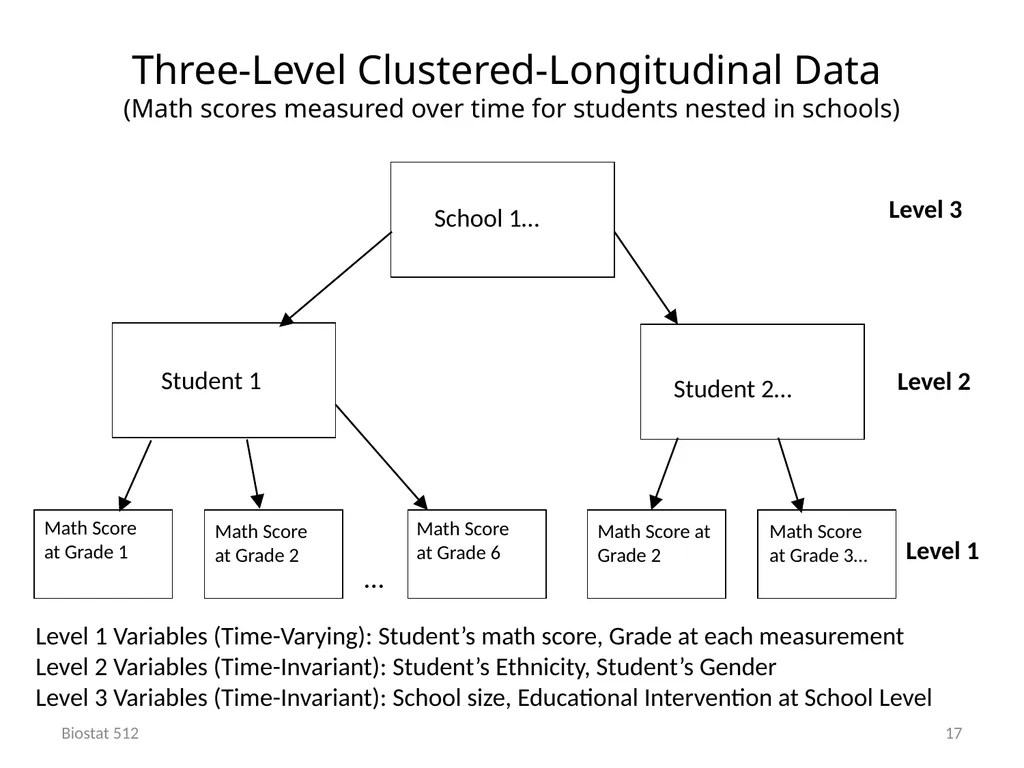
slide17. Three-Level Clustered-Longitudinal Data (Math scores measured over time for students nested in schools) Biostat 512 17 Level 2 Level 1 Level 1 Variables (Time-Varying): Student’s math score, Grade at each measurement
Level 2 Variables (Time-Invariant): Student’s Ethnicity, Student’s Gender
Level 3 Variables (Time-Invariant): School size, Educational Intervention at School Level School 1… Level 3<br>
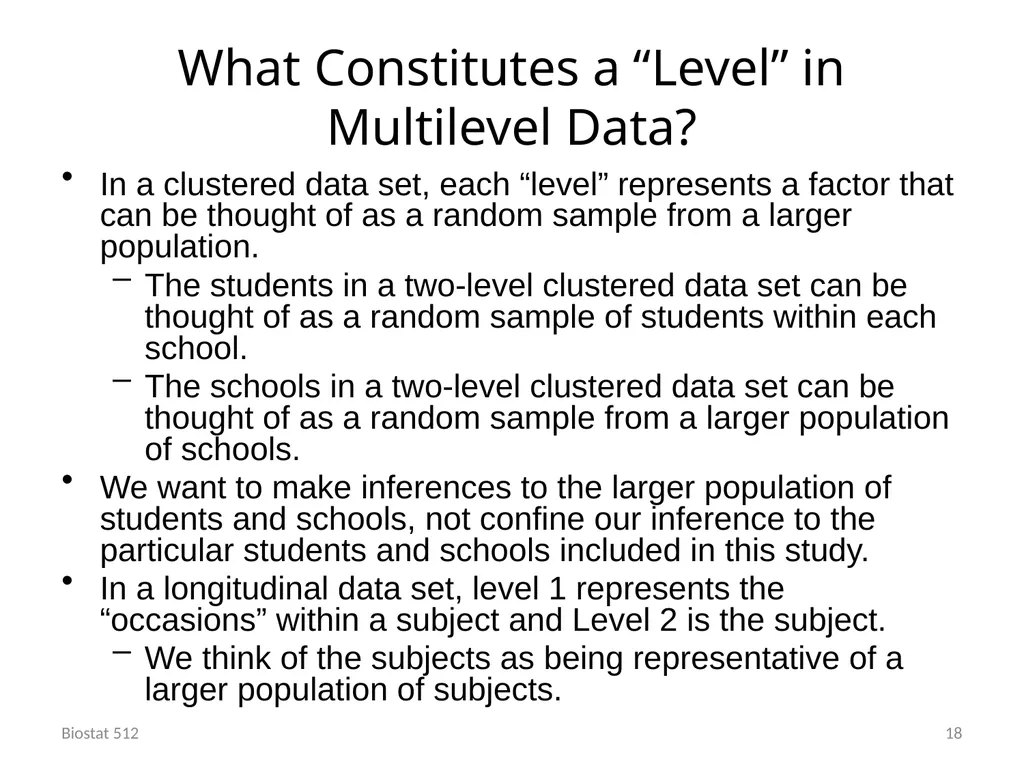
slide18. What Constitutes a “Level” in Multilevel Data? In a clustered data set, each “level” represents a factor that can be thought of as a random sample from a larger population.
The students in a two-level clustered data set can be thought of as a random sample of students within each school.
The schools in a two-level clustered data set can be thought of as a random sample from a larger population of schools.
We want to make inferences to the larger population of students and schools, not confine our inference to the particular students and schools included in this study.
In a longitudinal data set, level 1 represents the “occasions” within a subject and Level 2 is the subject.
We think of the subjects as being representative of a larger population of subjects. Biostat 512 18<br>
slide19. What is Not a “Level” Factors such as Treatment or Gender are not considered to be Levels of data, because they cannot be thought of as a random sample from a larger population.
We wish to make inferences only about the specific values of Treatment or Gender that are included in our study…not to a larger population of treatments or genders. Biostat 512 19<br>
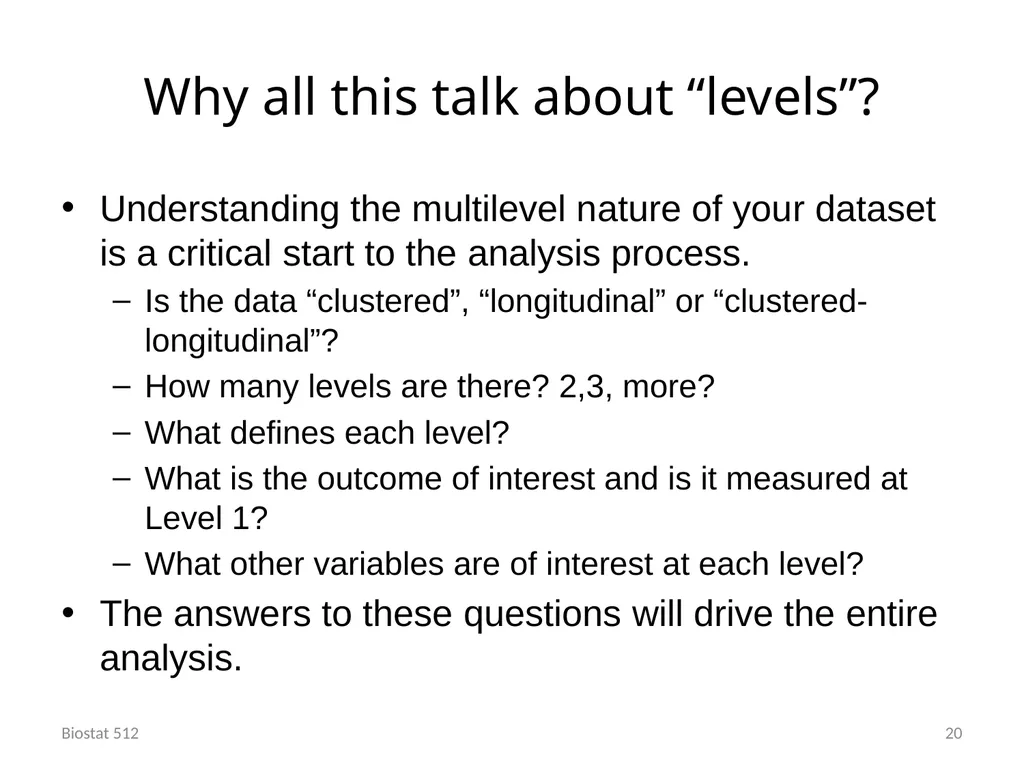
slide20. Why all this talk about “levels”? Understanding the multilevel nature of your dataset is a critical start to the analysis process.
Is the data “clustered”, “longitudinal” or “clustered-longitudinal”?
How many levels are there? 2,3, more?
What defines each level?
What is the outcome of interest and is it measured at Level 1?
What other variables are of interest at each level?
The answers to these questions will drive the entire analysis. Biostat 512 20<br>
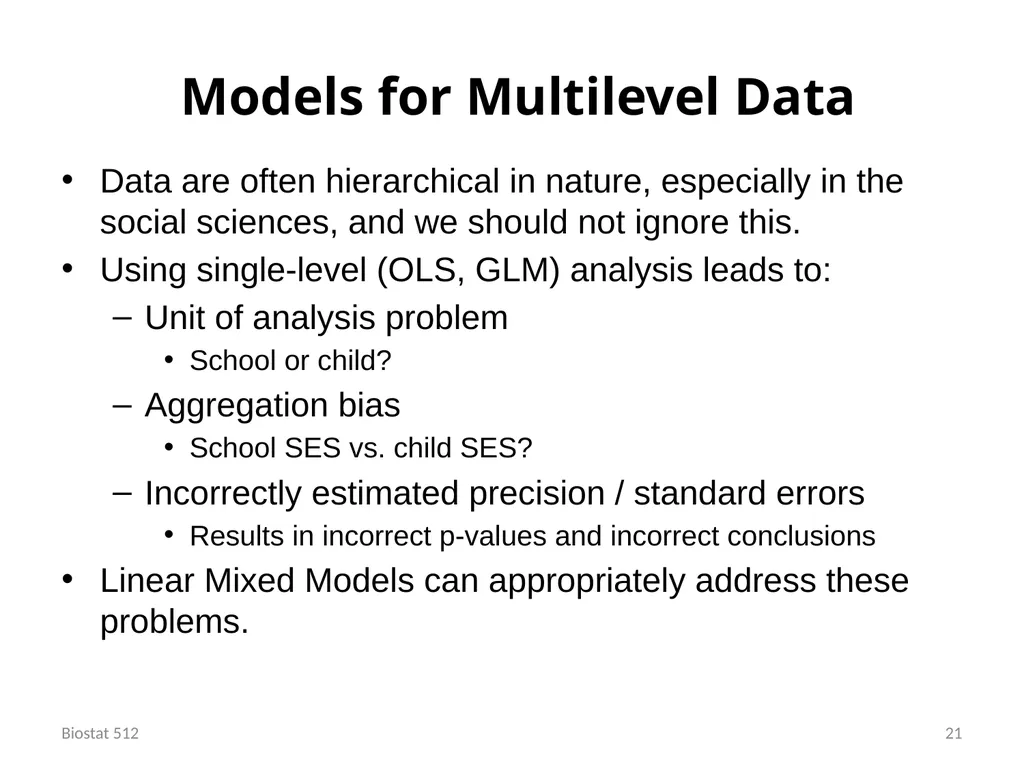
slide21. Models for Multilevel Data Data are often hierarchical in nature, especially in the social sciences, and we should not ignore this.
Using single-level (OLS, GLM) analysis leads to:
Unit of analysis problem
School or child?
Aggregation bias
School SES vs. child SES?
Incorrectly estimated precision / standard errors
Results in incorrect p-values and incorrect conclusions
Linear Mixed Models can appropriately address these problems. Biostat 512 21<br>
slide22. What are Linear Mixed Models? (LMMs) LMMs are:
Also known as multilevel models, hierarchical models, random effects models, mixed models
For a continuous outcome variable, Y
Linear in the parameters (β’s)
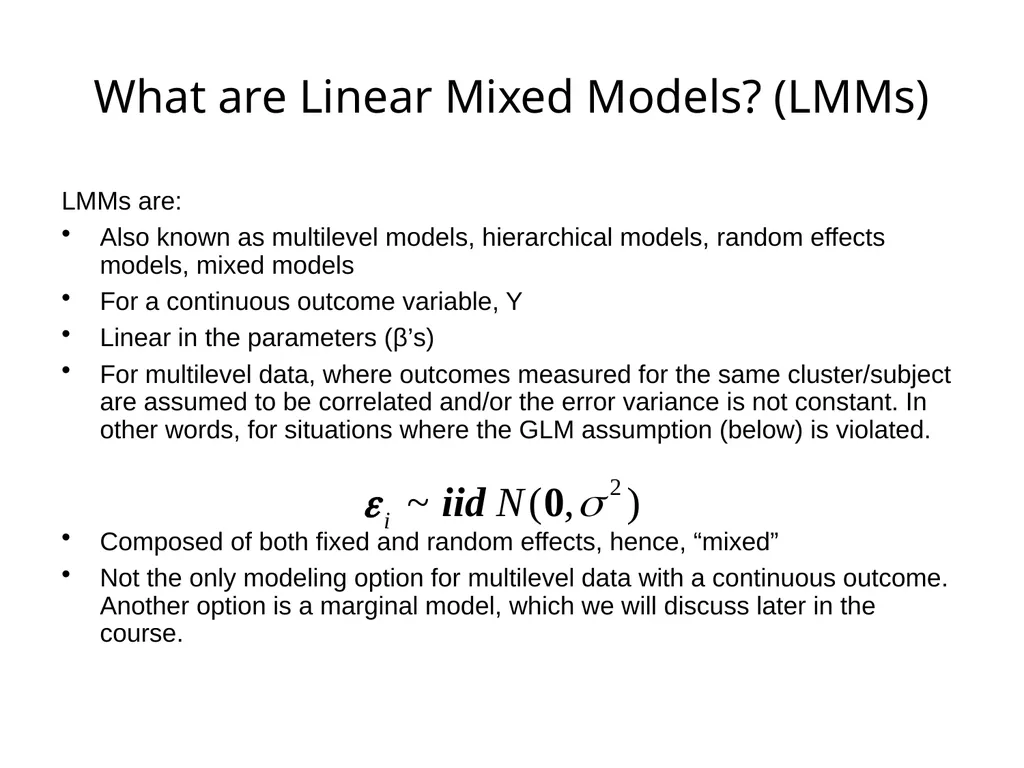
For multilevel data, where outcomes measured for the same cluster/subject are assumed to be correlated and/or the error variance is not constant. In other words, for situations where the GLM assumption (below) is violated.
Composed of both fixed and random effects, hence, “mixed”
Not the only modeling option for multilevel data with a continuous outcome. Another option is a marginal model, which we will discuss later in the course.<br>
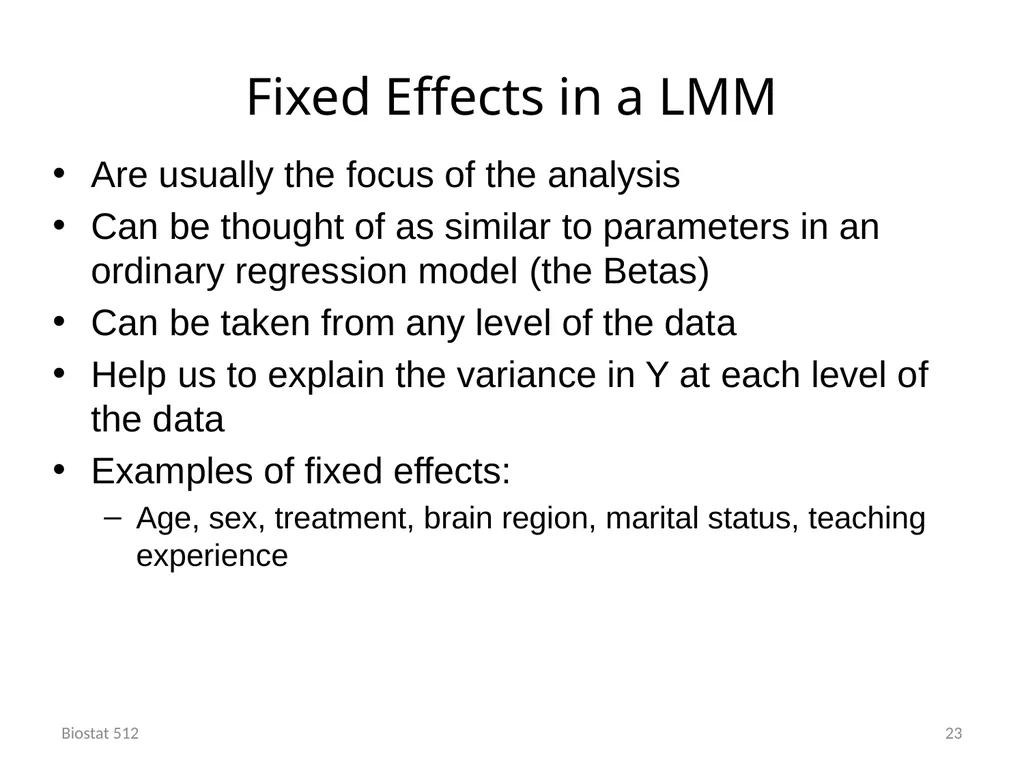
slide23. Fixed Effects in a LMM Are usually the focus of the analysis
Can be thought of as similar to parameters in an ordinary regression model (the Betas)
Can be taken from any level of the data
Help us to explain the variance in Y at each level of the data
Examples of fixed effects:
Age, sex, treatment, brain region, marital status, teaching experience Biostat 512 23<br>
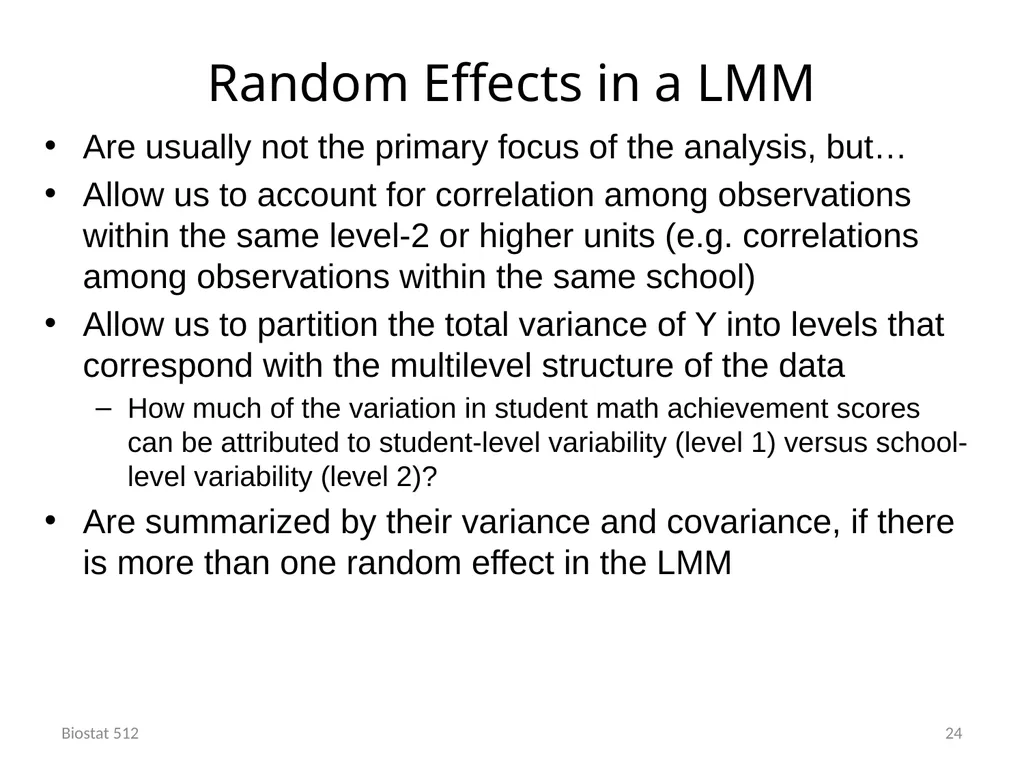
slide24. Random Effects in a LMM Are usually not the primary focus of the analysis, but…
Allow us to account for correlation among observations within the same level-2 or higher units (e.g. correlations among observations within the same school)
Allow us to partition the total variance of Y into levels that correspond with the multilevel structure of the data
How much of the variation in student math achievement scores can be attributed to student-level variability (level 1) versus school-level variability (level 2)?
Are summarized by their variance and covariance, if there is more than one random effect in the LMM Biostat 512 24<br>
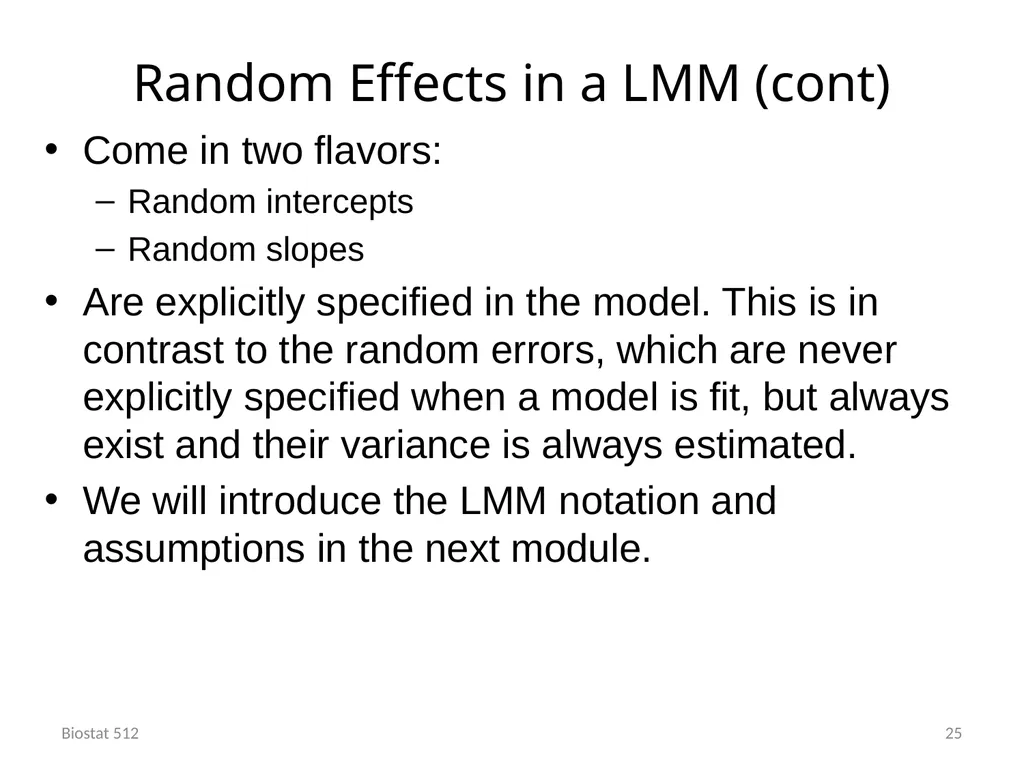
slide25. Random Effects in a LMM (cont) Come in two flavors:
Random intercepts
Random slopes
Are explicitly specified in the model. This is in contrast to the random errors, which are never explicitly specified when a model is fit, but always exist and their variance is always estimated.
We will introduce the LMM notation and assumptions in the next module. Biostat 512 25<br>
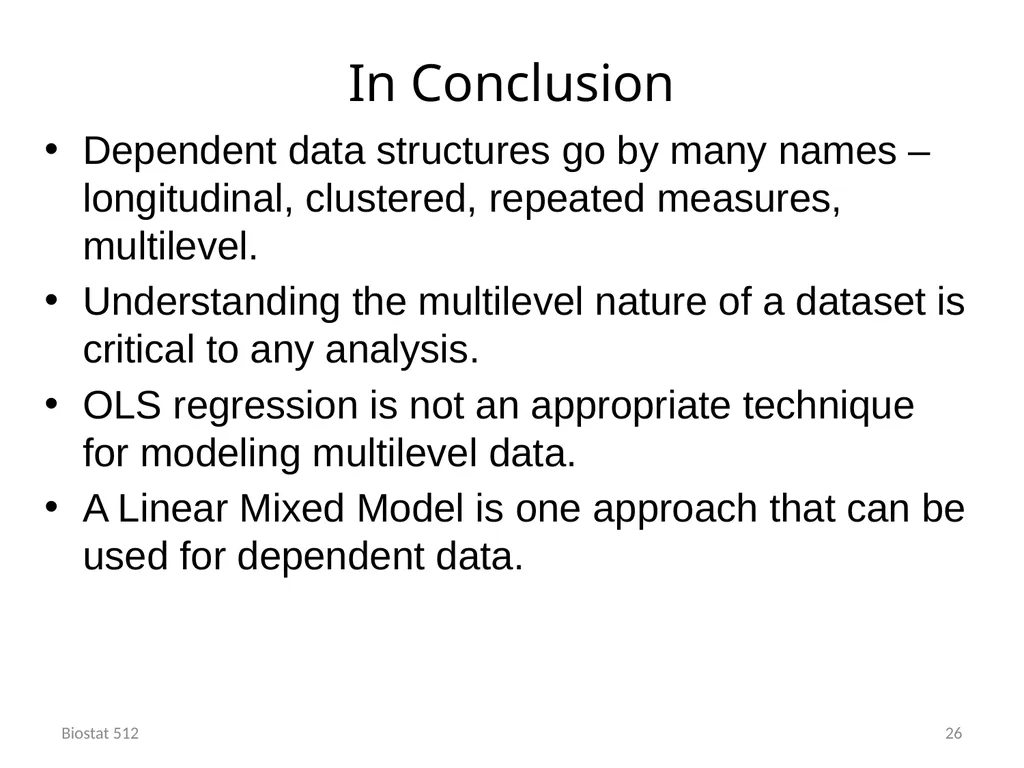
slide26. In Conclusion Dependent data structures go by many names – longitudinal, clustered, repeated measures, multilevel.
Understanding the multilevel nature of a dataset is critical to any analysis.
OLS regression is not an appropriate technique for modeling multilevel data.
A Linear Mixed Model is one approach that can be used for dependent data. Biostat 512 26<br>
Vocabulary Slam and an Introduction to Linear Mixed Models (LMMs)<br>
slide2. Agenda Vocabulary Slam
We begin this module by defining “clustered” and “longitudinal” data, and address other terms used to identify dependent data structures.
We define and depict clustered and longitudinal data using the multilevel framework.
Introduction to Linear Mixed Models (LMMs)
We give a brief overview of LMMs and introduce the concept of a random effect. Biostat 512 2<br>
slide3. What is Clustered Data? Clustered Data
An outcome is measured once for each subject, and subjects belong to (or are “nested” in) clusters, such as families, schools, or neighborhoods.
The number of subjects in each cluster may vary from cluster to cluster.
Outcomes measured for members of these groups are likely to be correlated.
Examples Biostat 512 3<br>
slide4. What is Longitudinal Data? Longitudinal data
An outcome is measured for the same person repeatedly over a period of time.
Different subjects may have different numbers of observations which may be taken at different time points.
Observations made on the same person are likely to be correlated.
Examples Biostat 512 4<br>
slide5. What is Clustered-Longitudinal Data? Clustered-Longitudinal data
An outcome is measured repeatedly for the same subject over time, and subjects are clustered within some unit.
Subjects may have different numbers of measures, and clusters may have differing numbers of subjects.
The outcome values for different time points in the same subject are assumed to be correlated.
Measurements for subjects from within the same cluster are assumed to be correlated.
Examples<br>
slide6. What is Repeated Measures Data? Repeated measures data
Multiple observations are made for the same person over time, space or other dimension.
Each subject need not have all measurements.
Outcomes measured for the same person are likely to be correlated.
Examples<br>
slide7. What is “Multilevel” Data 7 Biostat 512 Clustered/longitudinal/repeated measures data is more generally known as “multilevel” data.
Levels 1,2,3,…
Level 1 is the lowest or most granular level of the data, and where the outcome variable of interest is measured.
Levels 2,3,… capture higher level information
Cluster-levels for clustered data
Subject-level for longitudinal data
Subject- and cluster-levels for clustered-longitudinal data
We will illustrate the multilevel concept for 2 and 3 level data structures.<br>
slide8. Two-Level Clustered Data Example Biostat 512 8 A research study in education aims to assess the impact of school type (public vs. catholic) as well as student gender and student SES on student-level math achievement scores. Scores are measured once for the students in the school.<br>
slide9. Two-Level Clustered Data (Students Nested within Schools) Biostat 512 9 Level 2 Level 1 Level 1 Variables: Student Achievement Score, Gender, Student’s SES….
Level 2 Variables: Public or Catholic School…<br>
slide10. Two-Level Longitudinal Data Example Researchers are studying the effect of a mother’s vocabulary and the child’s gender on the child’s vocabulary growth. 10 Biostat 512<br>
slide11. Longitudinal Data (Vocabulary Measured Over Time) Biostat 512 11 Level 2 Level 1 Level 1 Variables (Time-Varying): Child Vocabulary Count, Age at each measurement
Level 2 Variables (Time-Invariant): Mother’s Vocabulary, Child’s Gender<br>
slide12. Two-Level Repeated Measures Example Researchers are studying the effect of two different treatments on nucleotide bonding in three regions of the brain in rats. Measurements are taken from the same three regions of the brain of each rat, after each of the two different treatments. 12 Biostat 512<br>
slide13. Repeated Measures Data (Rat Brain Example) Biostat 512 13 Level 2 Level 1 Level 1 Variables (Varying): Nucleotide bonding measurement, Brain region, Treatment
Level 2 Variables (Invariant): Rat gender … …<br>
slide14. Three-Level Clustered Data Example Biostat 512 14 A research study in education aims to assess the impact of school, classroom, and student-level variables on student achievement.<br>
slide15. Three-Level Clustered Data (Students nested in classrooms nested in schools) Biostat 512 15 Level 3 Level 1 Level 1 Variables: Student Achievement Score, Gender, Student’s SES…
Level 2 Variables: Teacher experience, Class size …
Level 3 Variables: School locale (Rural or Urban), School percent low income Student 2 Student n1 Classroom 1 Student 1 Classroom 2… … Student 2… Student 1 Level 2 School 1…<br>
slide16. Three-Level Clustered-Longitudinal Data Example Math skills are measured for the same student each year from grades 1 through 6, with students clustered within schools. The goal is to model how student characteristics, such as ethnicity and gender, and school characteristics, such as school size and percent low-income students, affect the math scores of students over time. 16 Biostat 512<br>
slide17. Three-Level Clustered-Longitudinal Data (Math scores measured over time for students nested in schools) Biostat 512 17 Level 2 Level 1 Level 1 Variables (Time-Varying): Student’s math score, Grade at each measurement
Level 2 Variables (Time-Invariant): Student’s Ethnicity, Student’s Gender
Level 3 Variables (Time-Invariant): School size, Educational Intervention at School Level School 1… Level 3<br>
slide18. What Constitutes a “Level” in Multilevel Data? In a clustered data set, each “level” represents a factor that can be thought of as a random sample from a larger population.
The students in a two-level clustered data set can be thought of as a random sample of students within each school.
The schools in a two-level clustered data set can be thought of as a random sample from a larger population of schools.
We want to make inferences to the larger population of students and schools, not confine our inference to the particular students and schools included in this study.
In a longitudinal data set, level 1 represents the “occasions” within a subject and Level 2 is the subject.
We think of the subjects as being representative of a larger population of subjects. Biostat 512 18<br>
slide19. What is Not a “Level” Factors such as Treatment or Gender are not considered to be Levels of data, because they cannot be thought of as a random sample from a larger population.
We wish to make inferences only about the specific values of Treatment or Gender that are included in our study…not to a larger population of treatments or genders. Biostat 512 19<br>
slide20. Why all this talk about “levels”? Understanding the multilevel nature of your dataset is a critical start to the analysis process.
Is the data “clustered”, “longitudinal” or “clustered-longitudinal”?
How many levels are there? 2,3, more?
What defines each level?
What is the outcome of interest and is it measured at Level 1?
What other variables are of interest at each level?
The answers to these questions will drive the entire analysis. Biostat 512 20<br>
slide21. Models for Multilevel Data Data are often hierarchical in nature, especially in the social sciences, and we should not ignore this.
Using single-level (OLS, GLM) analysis leads to:
Unit of analysis problem
School or child?
Aggregation bias
School SES vs. child SES?
Incorrectly estimated precision / standard errors
Results in incorrect p-values and incorrect conclusions
Linear Mixed Models can appropriately address these problems. Biostat 512 21<br>
slide22. What are Linear Mixed Models? (LMMs) LMMs are:
Also known as multilevel models, hierarchical models, random effects models, mixed models
For a continuous outcome variable, Y
Linear in the parameters (β’s)
For multilevel data, where outcomes measured for the same cluster/subject are assumed to be correlated and/or the error variance is not constant. In other words, for situations where the GLM assumption (below) is violated.
Composed of both fixed and random effects, hence, “mixed”
Not the only modeling option for multilevel data with a continuous outcome. Another option is a marginal model, which we will discuss later in the course.<br>
slide23. Fixed Effects in a LMM Are usually the focus of the analysis
Can be thought of as similar to parameters in an ordinary regression model (the Betas)
Can be taken from any level of the data
Help us to explain the variance in Y at each level of the data
Examples of fixed effects:
Age, sex, treatment, brain region, marital status, teaching experience Biostat 512 23<br>
slide24. Random Effects in a LMM Are usually not the primary focus of the analysis, but…
Allow us to account for correlation among observations within the same level-2 or higher units (e.g. correlations among observations within the same school)
Allow us to partition the total variance of Y into levels that correspond with the multilevel structure of the data
How much of the variation in student math achievement scores can be attributed to student-level variability (level 1) versus school-level variability (level 2)?
Are summarized by their variance and covariance, if there is more than one random effect in the LMM Biostat 512 24<br>
slide25. Random Effects in a LMM (cont) Come in two flavors:
Random intercepts
Random slopes
Are explicitly specified in the model. This is in contrast to the random errors, which are never explicitly specified when a model is fit, but always exist and their variance is always estimated.
We will introduce the LMM notation and assumptions in the next module. Biostat 512 25<br>
slide26. In Conclusion Dependent data structures go by many names – longitudinal, clustered, repeated measures, multilevel.
Understanding the multilevel nature of a dataset is critical to any analysis.
OLS regression is not an appropriate technique for modeling multilevel data.
A Linear Mixed Model is one approach that can be used for dependent data. Biostat 512 26<br>