ANIMAL GENETICS BREEDING UNIT I Biostatistics Computer Application Lecture 7 Chi-square Test of Significance Dr K G Mandal Department of Animal Genetics Breeding Bihar Veterinary College, Patna Bihar Animal Sciences University,
"ANIMAL GENETICS & BREEDING UNIT – I Biostatistics" is the property of its rightful owner. Permission is granted to
download and print the materials on this website for personal, non-commercial use only, and to display it
on your personal computer provided you do not modify the materials and that you retain all copyright
notices contained in the materials. By downloading content from our website, you accept the terms of this
agreement.
Presentation Transcript
01
ANIMAL GENETICS & BREEDING UNIT – I Biostatistics & Computer Application Lecture – 7
Chi-square Test of Significance
Dr K G Mandal Department of Animal Genetics & Breeding Bihar Veterinary College, Patna Bihar Animal Sciences University, Patna<br>
02
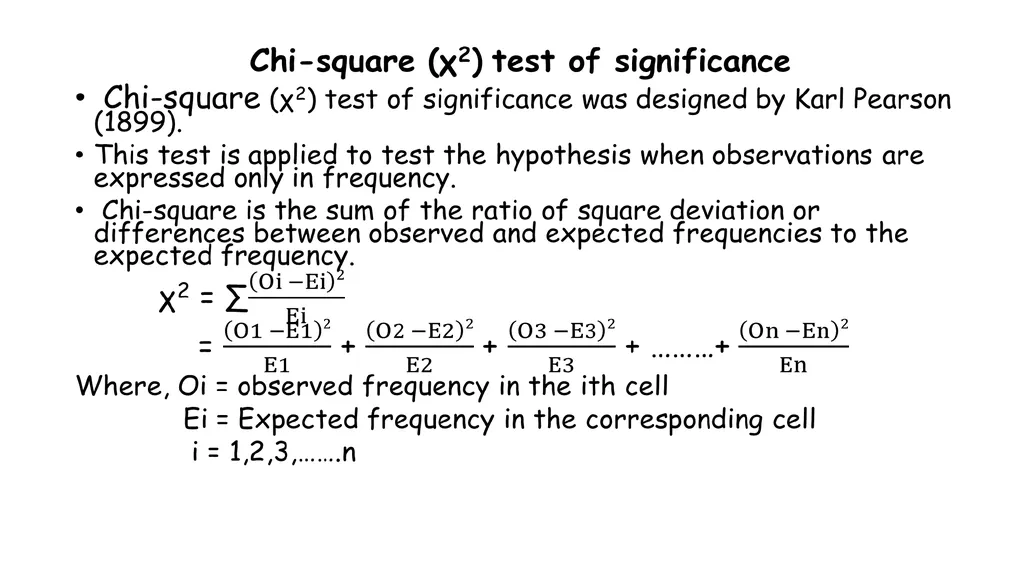
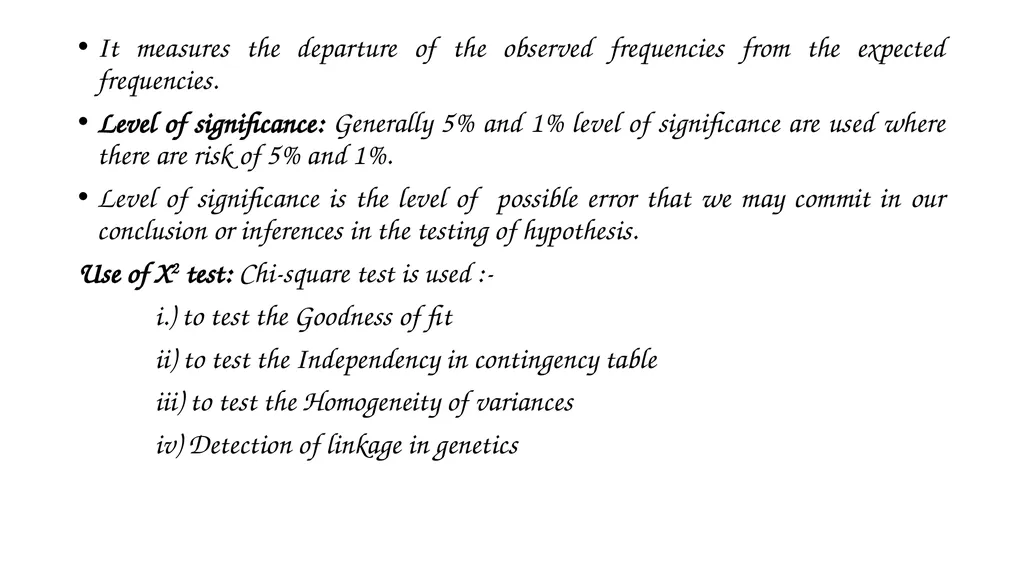
It measures the departure of the observed frequencies from the expected frequencies.
Level of significance: Generally 5% and 1% level of significance are used where there are risk of 5% and 1%.
Level of significance is the level of possible error that we may commit in our conclusion or inferences in the testing of hypothesis.
Use of X2 test: Chi-square test is used :-
i.) to test the Goodness of fit
ii) to test the Independency in contingency table
iii) to test the Homogeneity of variances
iv) Detection of linkage in genetics<br>
03
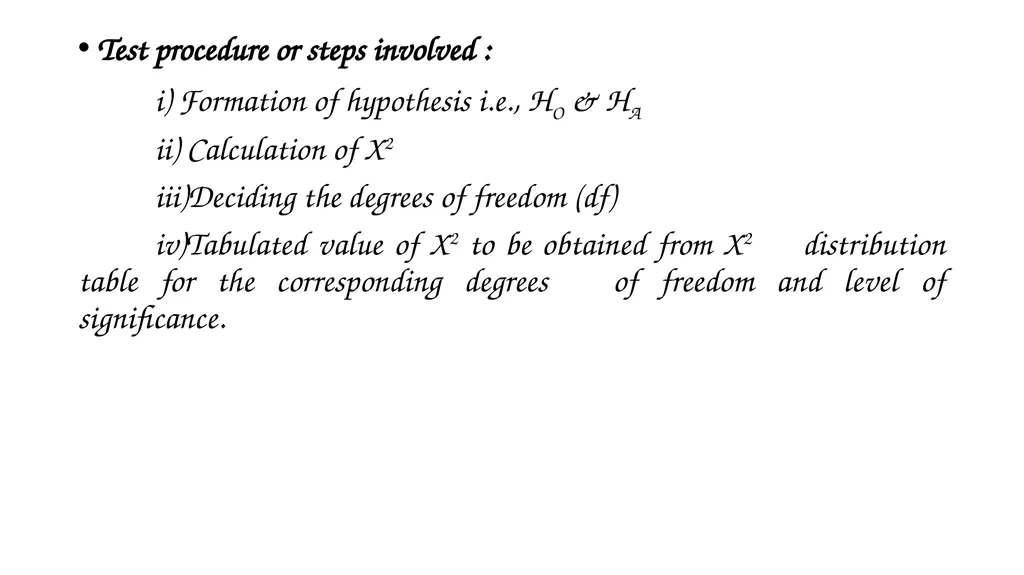
Test procedure or steps involved :
i) Formation of hypothesis i.e., HO & HA
ii) Calculation of X2
iii)Deciding the degrees of freedom (df)
iv)Tabulated value of X2 to be obtained from X2 distribution table for the corresponding degrees of freedom and level of significance.<br>
04
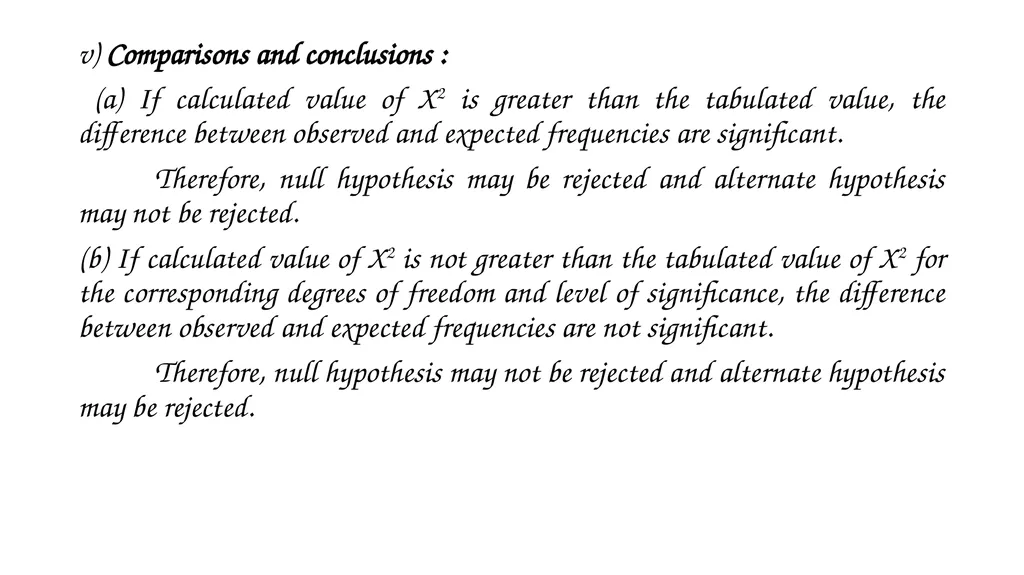
v) Comparisons and conclusions :
(a) If calculated value of X2 is greater than the tabulated value, the difference between observed and expected frequencies are significant.
Therefore, null hypothesis may be rejected and alternate hypothesis may not be rejected.
(b) If calculated value of X2 is not greater than the tabulated value of X2 for the corresponding degrees of freedom and level of significance, the difference between observed and expected frequencies are not significant.
Therefore, null hypothesis may not be rejected and alternate hypothesis may be rejected.<br>
05
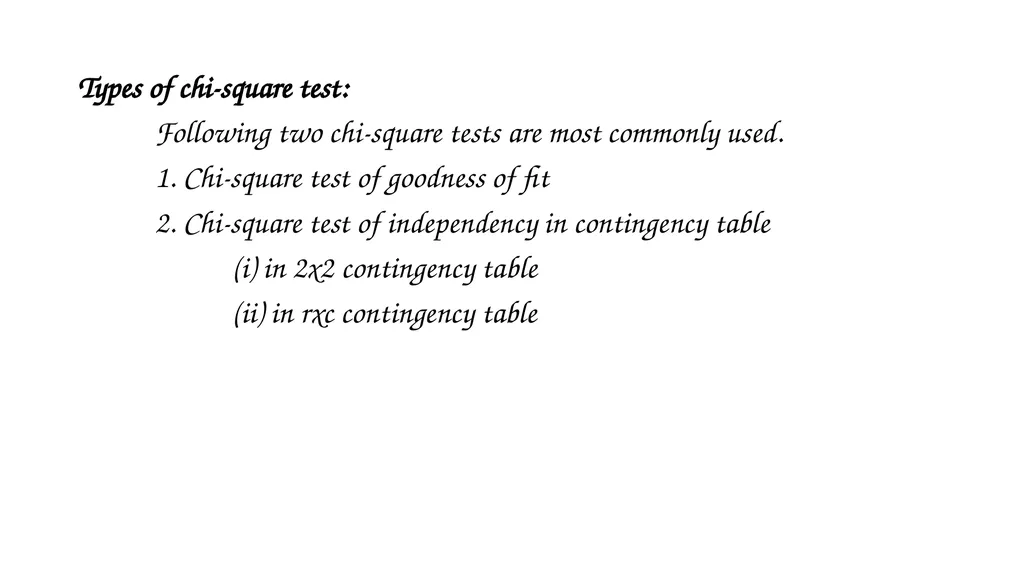
Types of chi-square test:
Following two chi-square tests are most commonly used.
1. Chi-square test of goodness of fit
2. Chi-square test of independency in contingency table
(i) in 2x2 contingency table
(ii) in rxc contingency table<br>
06
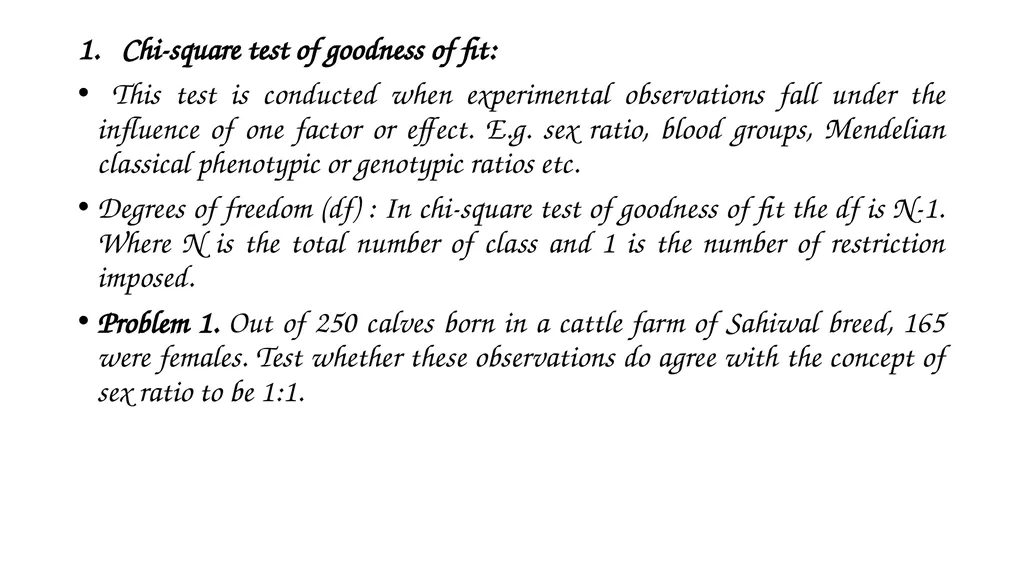
Chi-square test of goodness of fit:
This test is conducted when experimental observations fall under the influence of one factor or effect. E.g. sex ratio, blood groups, Mendelian classical phenotypic or genotypic ratios etc.
Degrees of freedom (df) : In chi-square test of goodness of fit the df is N-1. Where N is the total number of class and 1 is the number of restriction imposed.
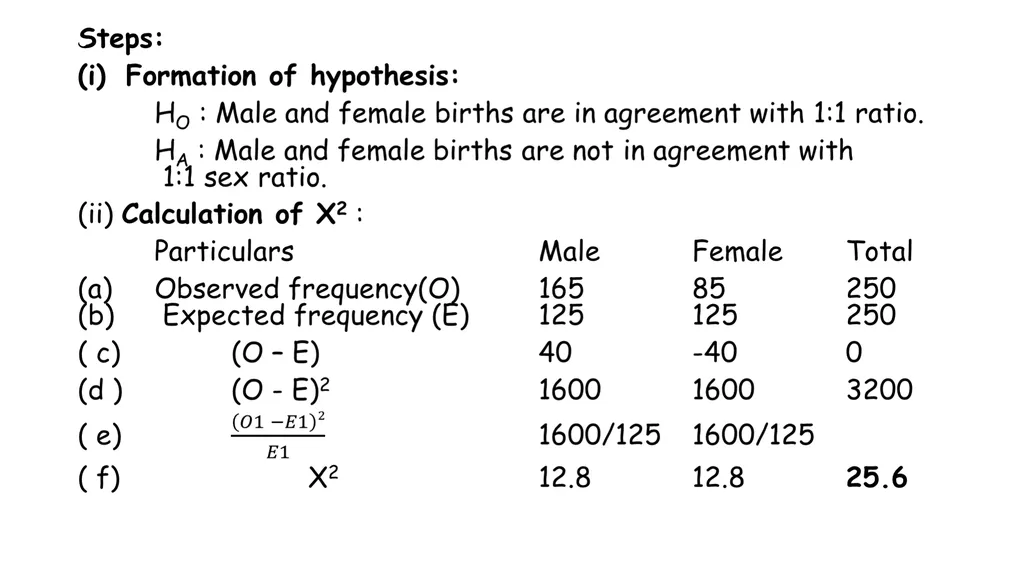
Problem 1. Out of 250 calves born in a cattle farm of Sahiwal breed, 165 were females. Test whether these observations do agree with the concept of sex ratio to be 1:1.<br>
07
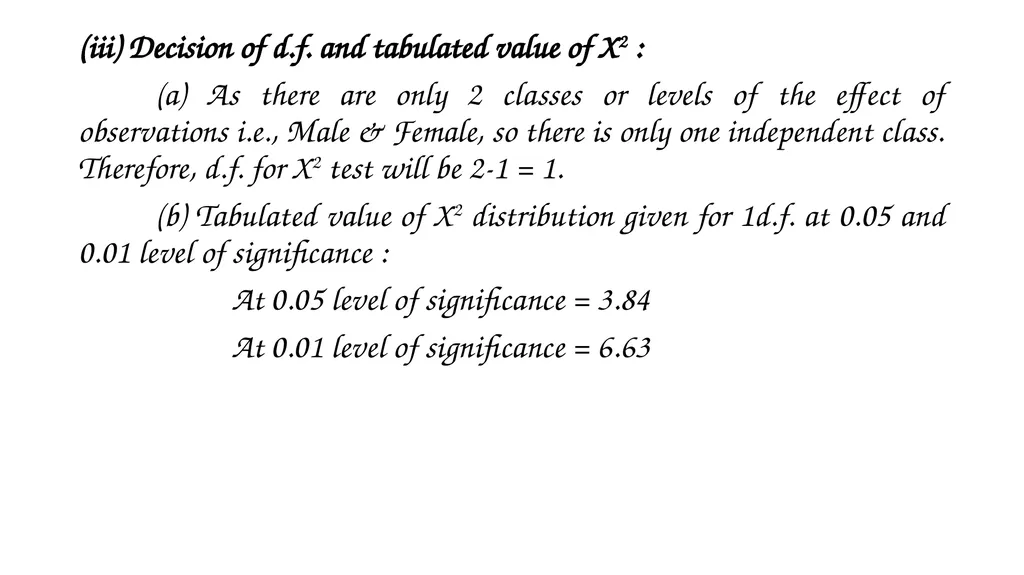
(iii) Decision of d.f. and tabulated value of X2 :
(a) As there are only 2 classes or levels of the effect of observations i.e., Male & Female, so there is only one independent class. Therefore, d.f. for X2 test will be 2-1 = 1.
(b) Tabulated value of X2 distribution given for 1d.f. at 0.05 and 0.01 level of significance :
At 0.05 level of significance = 3.84
At 0.01 level of significance = 6.63<br>
08
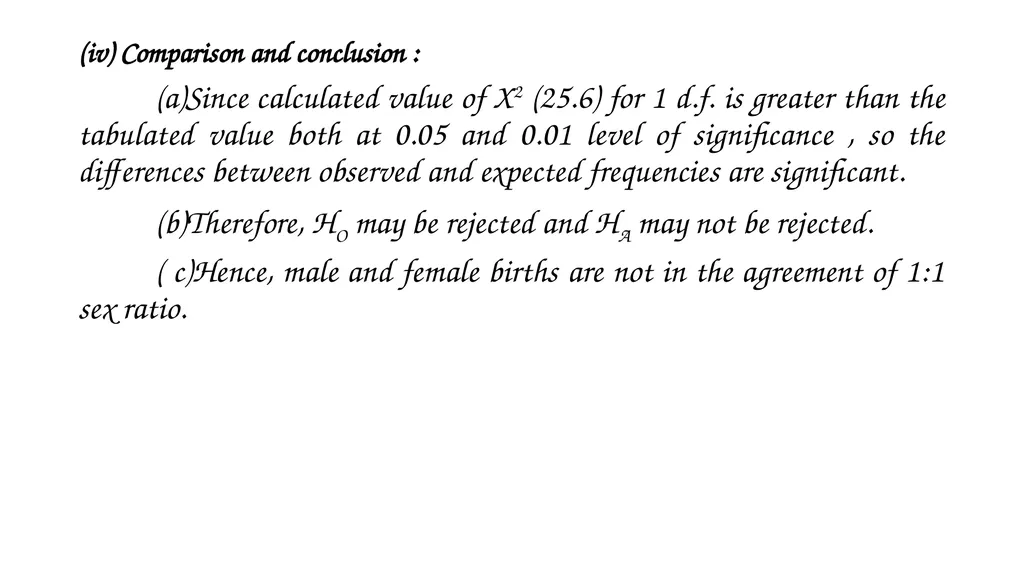
(iv) Comparison and conclusion :
(a)Since calculated value of X2 (25.6) for 1 d.f. is greater than the tabulated value both at 0.05 and 0.01 level of significance , so the differences between observed and expected frequencies are significant.
(b)Therefore, HO may be rejected and HA may not be rejected.
( c)Hence, male and female births are not in the agreement of 1:1 sex ratio.<br>
09
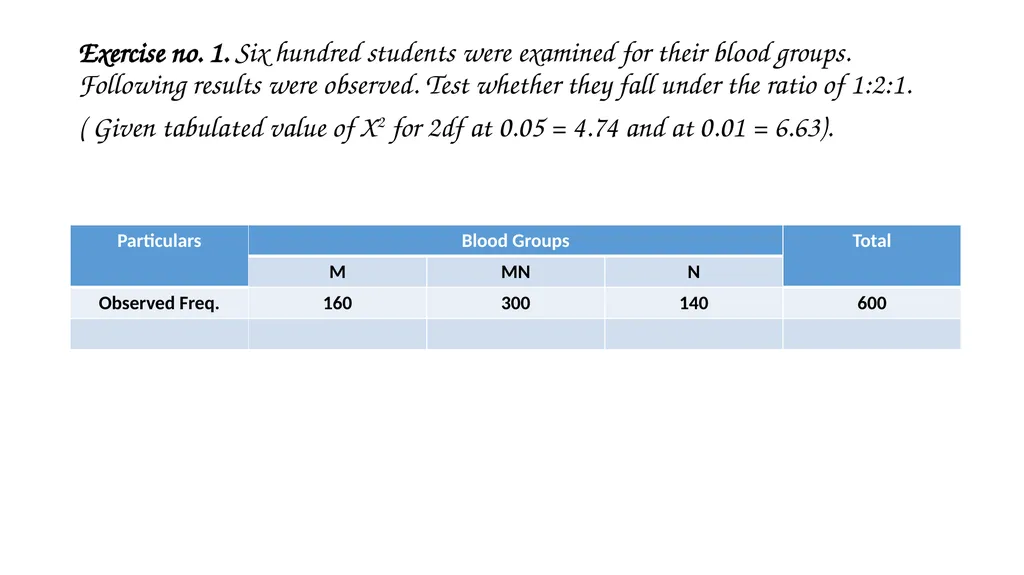
Exercise no. 1. Six hundred students were examined for their blood groups. Following results were observed. Test whether they fall under the ratio of 1:2:1.
( Given tabulated value of X2 for 2df at 0.05 = 4.74 and at 0.01 = 6.63).<br>
10
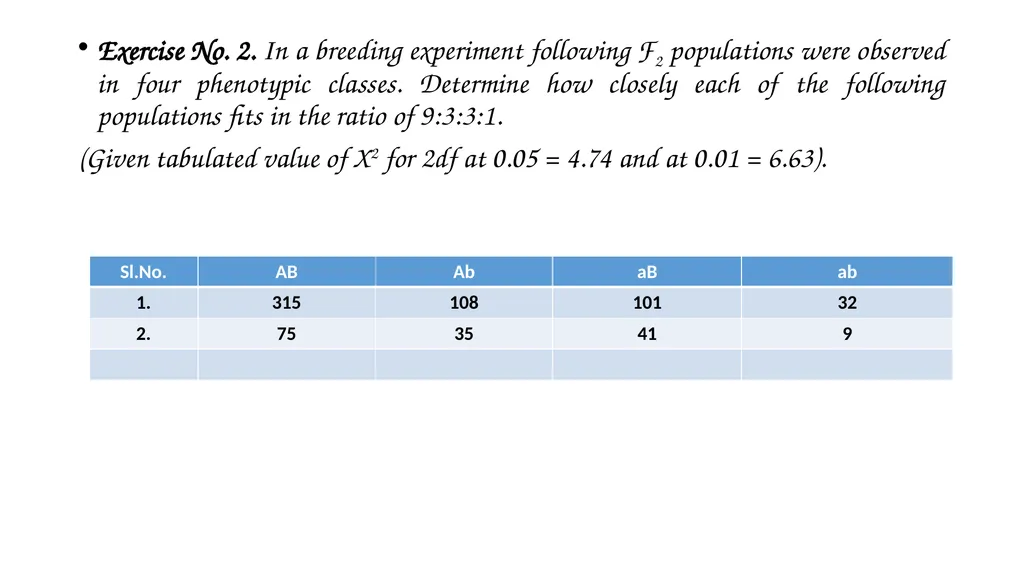
Exercise No. 2. In a breeding experiment following F2 populations were observed in four phenotypic classes. Determine how closely each of the following populations fits in the ratio of 9:3:3:1.
(Given tabulated value of X2 for 2df at 0.05 = 4.74 and at 0.01 = 6.63).<br>
11
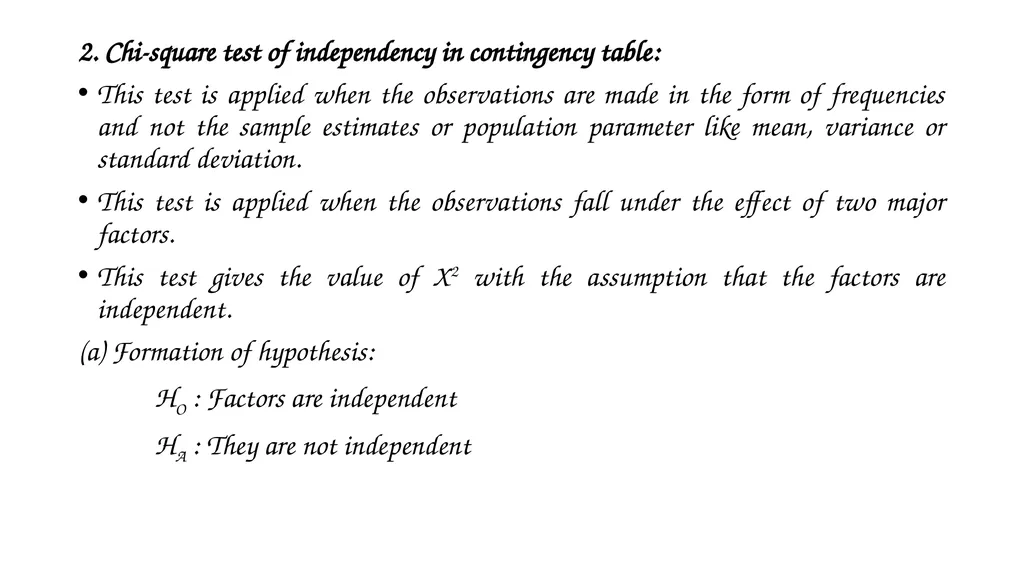
2. Chi-square test of independency in contingency table:
This test is applied when the observations are made in the form of frequencies and not the sample estimates or population parameter like mean, variance or standard deviation.
This test is applied when the observations fall under the effect of two major factors.
This test gives the value of X2 with the assumption that the factors are independent.
(a) Formation of hypothesis:
HO : Factors are independent
HA : They are not independent<br>
12
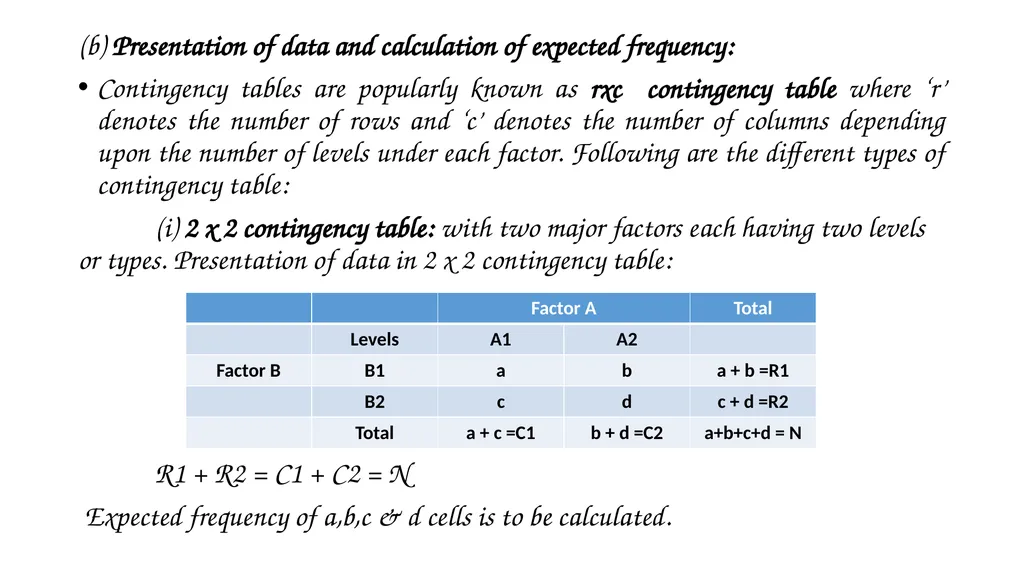
(b) Presentation of data and calculation of expected frequency:
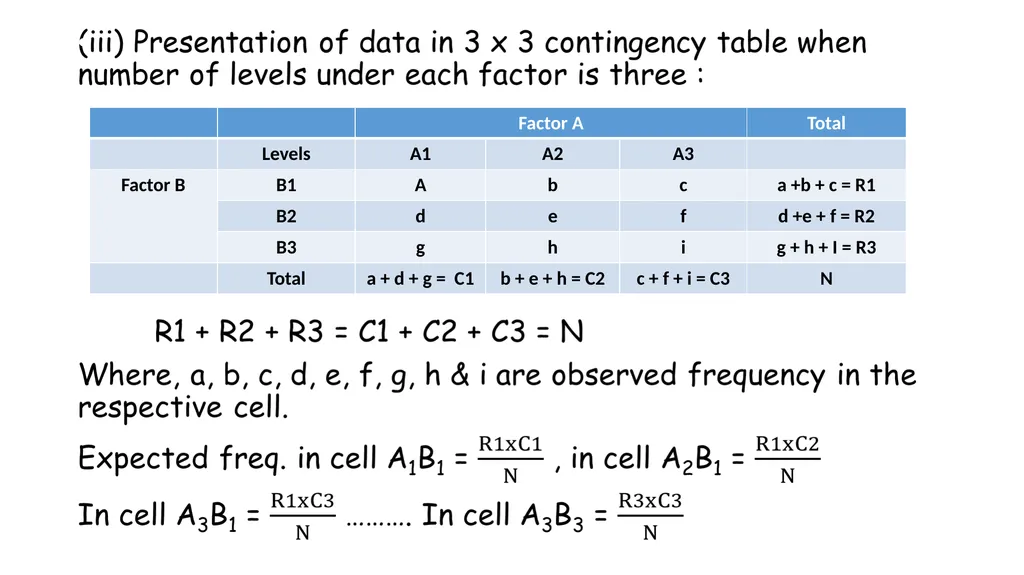
Contingency tables are popularly known as rxc contingency table where ‘r’ denotes the number of rows and ‘c’ denotes the number of columns depending upon the number of levels under each factor. Following are the different types of contingency table:
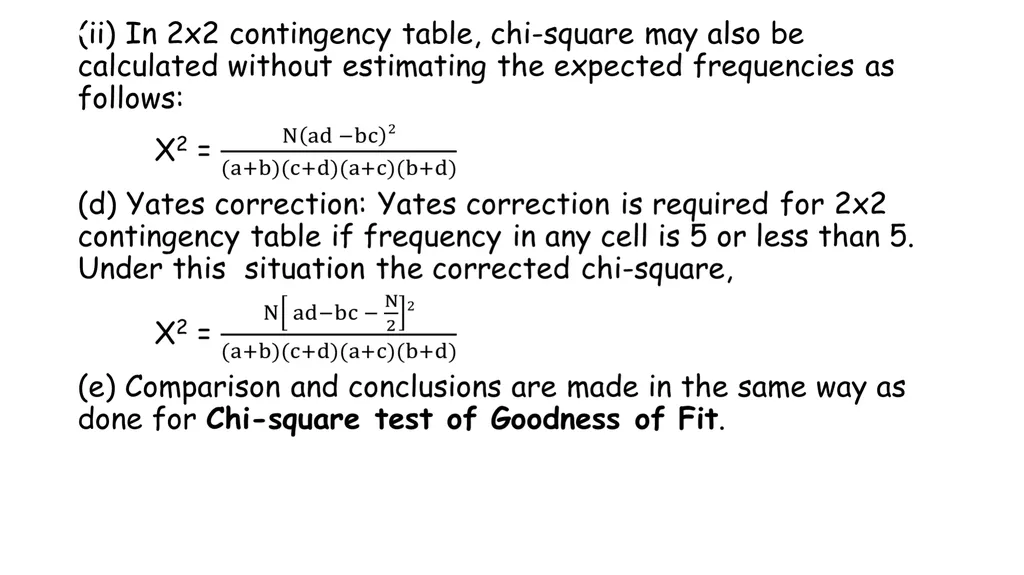
(i) 2 x 2 contingency table: with two major factors each having two levels or types. Presentation of data in 2 x 2 contingency table:
R1 + R2 = C1 + C2 = N
Expected frequency of a,b,c & d cells is to be calculated.<br>
13
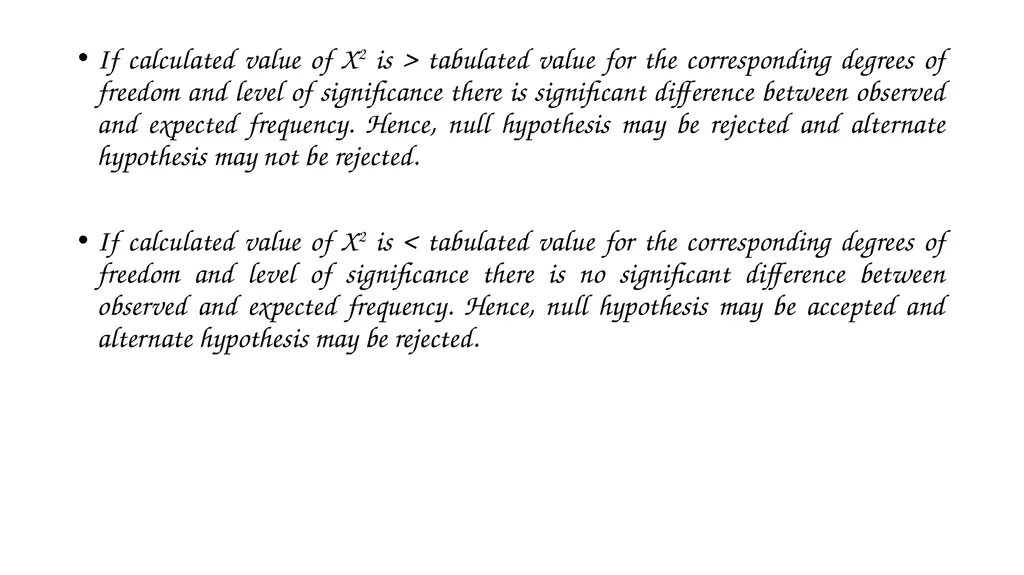
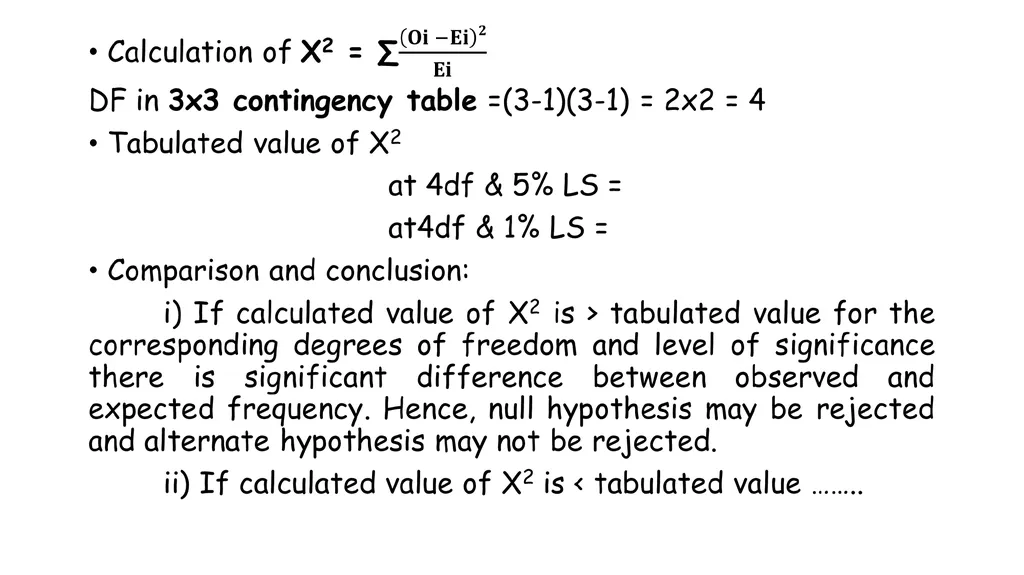
If calculated value of X2 is > tabulated value for the corresponding degrees of freedom and level of significance there is significant difference between observed and expected frequency. Hence, null hypothesis may be rejected and alternate hypothesis may not be rejected.
If calculated value of X2 is < tabulated value for the corresponding degrees of freedom and level of significance there is no significant difference between observed and expected frequency. Hence, null hypothesis may be accepted and alternate hypothesis may be rejected.<br>
14
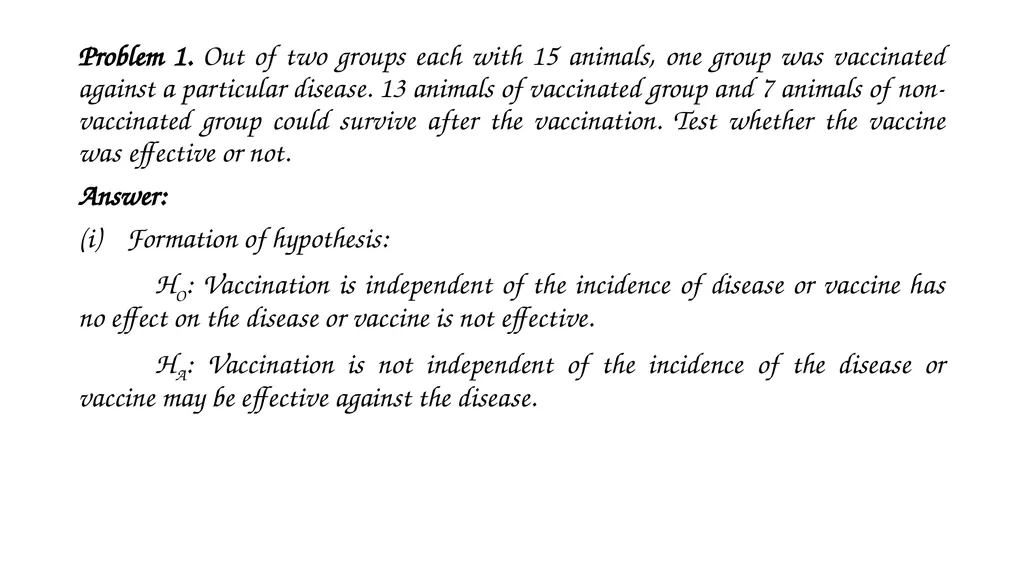
Problem 1. Out of two groups each with 15 animals, one group was vaccinated against a particular disease. 13 animals of vaccinated group and 7 animals of non-vaccinated group could survive after the vaccination. Test whether the vaccine was effective or not.
Answer:
Formation of hypothesis:
HO: Vaccination is independent of the incidence of disease or vaccine has no effect on the disease or vaccine is not effective.
HA: Vaccination is not independent of the incidence of the disease or vaccine may be effective against the disease.<br>
15
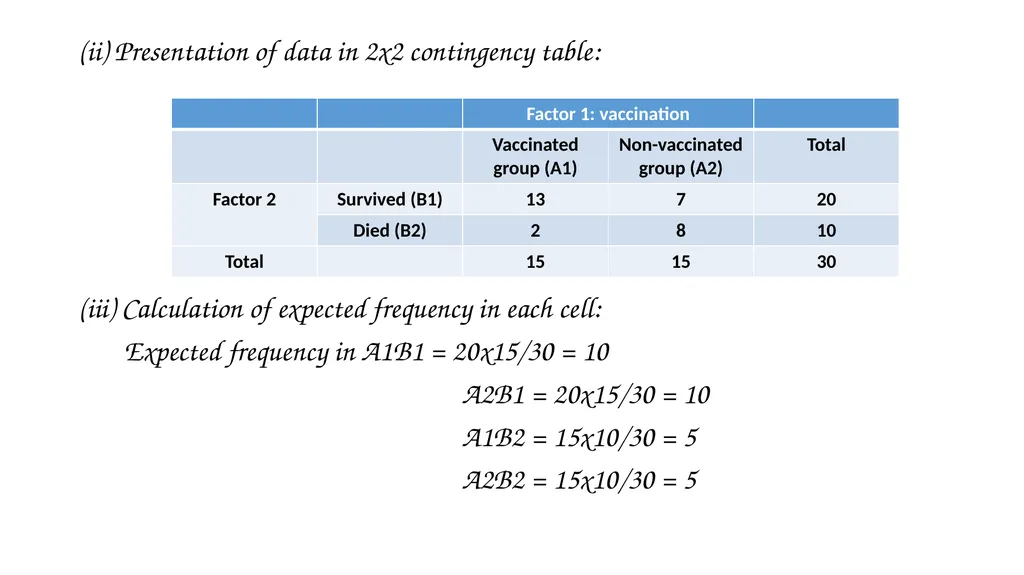
(ii) Presentation of data in 2x2 contingency table:
(iii) Calculation of expected frequency in each cell:
Expected frequency in A1B1 = 20x15/30 = 10
A2B1 = 20x15/30 = 10
A1B2 = 15x10/30 = 5
A2B2 = 15x10/30 = 5<br>
16
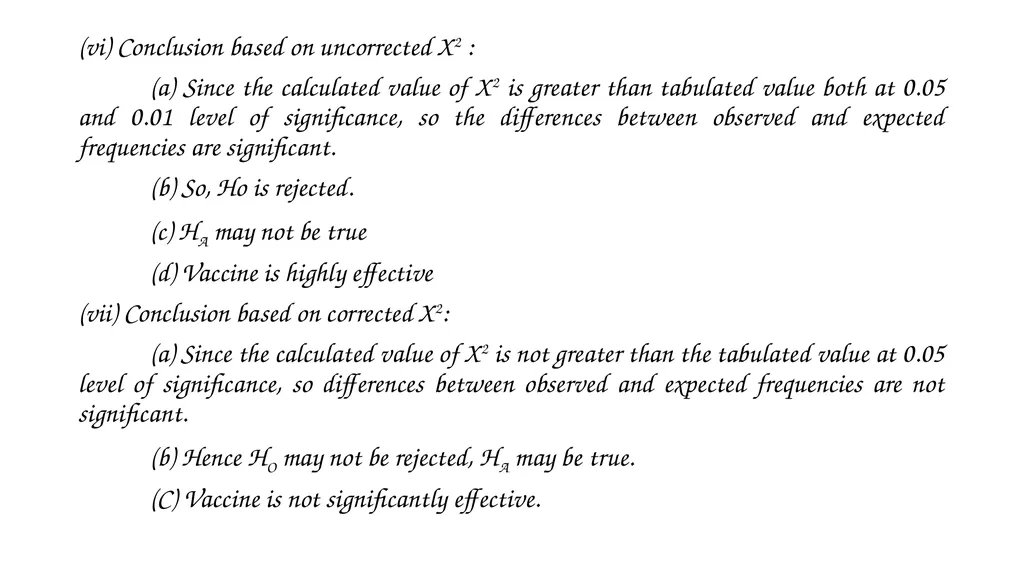
(vi) Conclusion based on uncorrected X2 :
(a) Since the calculated value of X2 is greater than tabulated value both at 0.05 and 0.01 level of significance, so the differences between observed and expected frequencies are significant.
(b) So, Ho is rejected.
(c) HA may not be true
(d) Vaccine is highly effective
(vii) Conclusion based on corrected X2:
(a) Since the calculated value of X2 is not greater than the tabulated value at 0.05 level of significance, so differences between observed and expected frequencies are not significant.
(b) Hence HO may not be rejected, HA may be true.
(C) Vaccine is not significantly effective.<br>
17
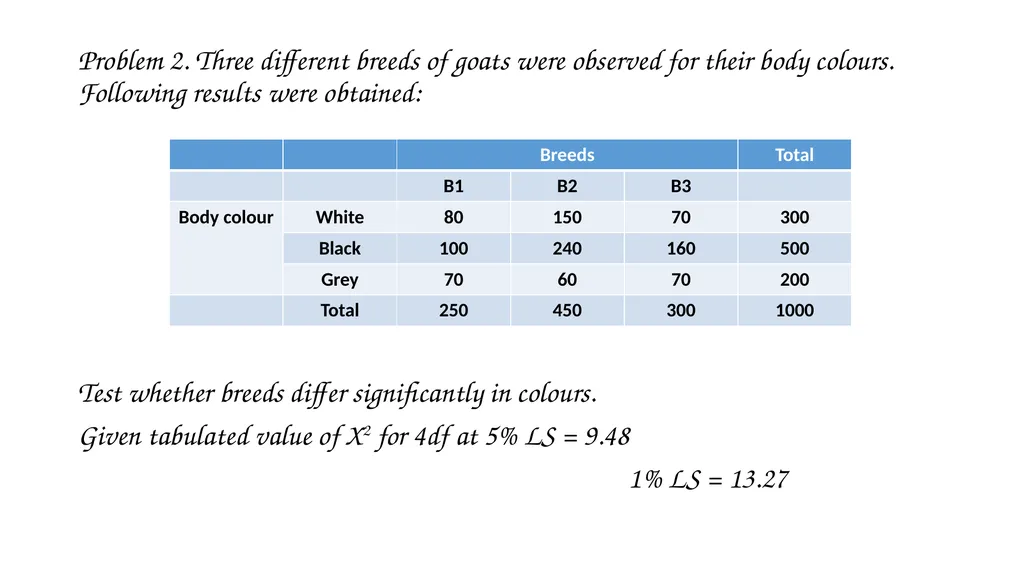
Problem 2. Three different breeds of goats were observed for their body colours. Following results were obtained:
Test whether breeds differ significantly in colours.
Given tabulated value of X2 for 4df at 5% LS = 9.48
1% LS = 13.27<br>