ANNUAL REPORT-2018 Promoting Sustainable Development and Integration Global growth continued to recover but pace of improvement is slowing 2 GDP Growth ( change) Source:IMF-WEO (April 2019) Global production and trade growth loses momentum
Related Topics
Share
Embed code
Download this presentation From Below
"ANNUAL REPORT-2018 Promoting Sustainable" is the property of its rightful owner. Permission is granted to
download and print the materials on this website for personal, non-commercial use only, and to display it
on your personal computer provided you do not modify the materials and that you retain all copyright
notices contained in the materials. By downloading content from our website, you accept the terms of this
agreement.
Presentation Transcript
01
ANNUAL REPORT-2018 Promoting Sustainable Development and Integration<br>
02
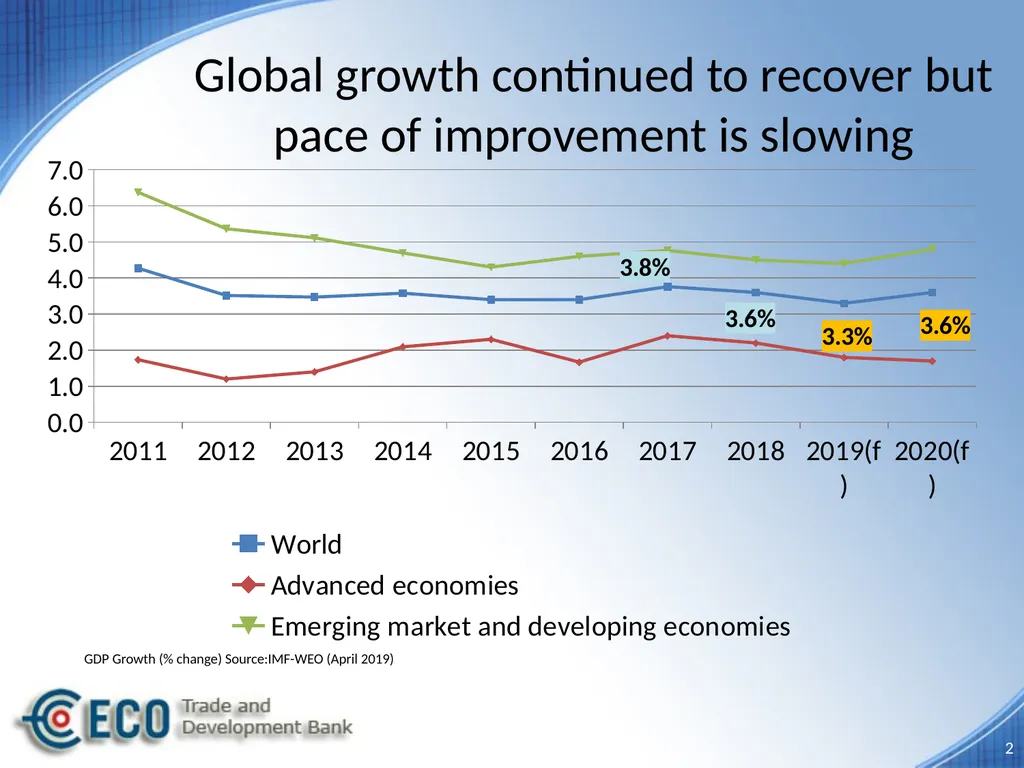
Global growth continued to recover but pace of improvement is slowing 2 GDP Growth (% change) Source:IMF-WEO (April 2019)<br>
03
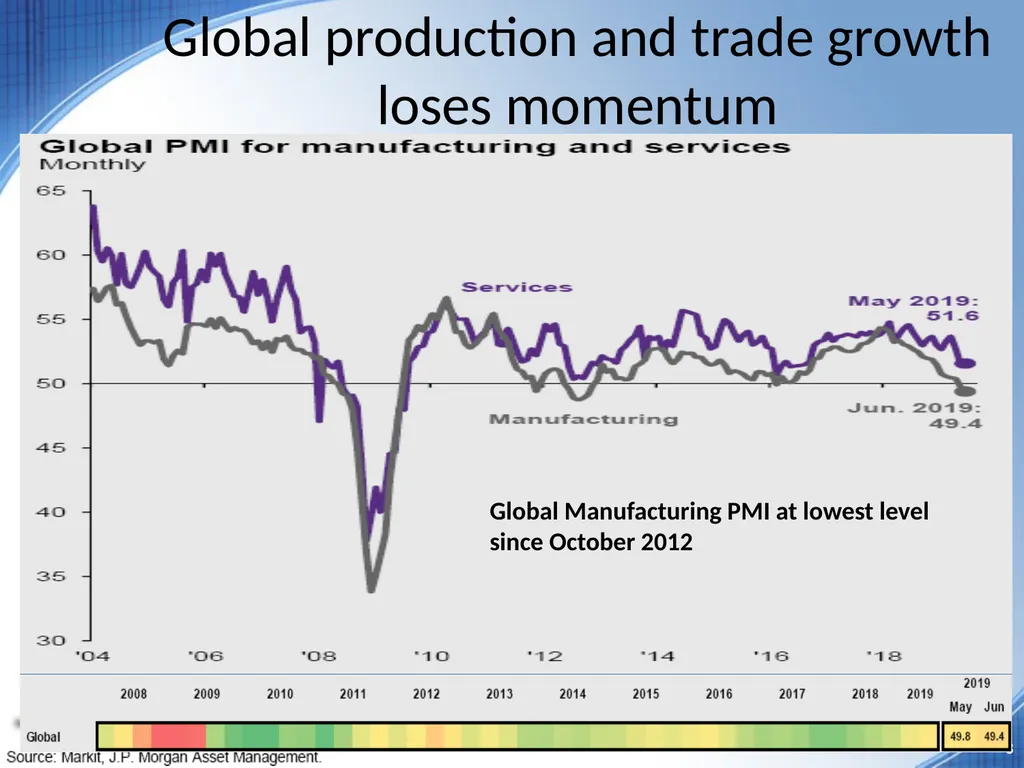
Global production and trade growth loses momentum 3 Global Manufacturing PMI at lowest level since October 2012<br>
04
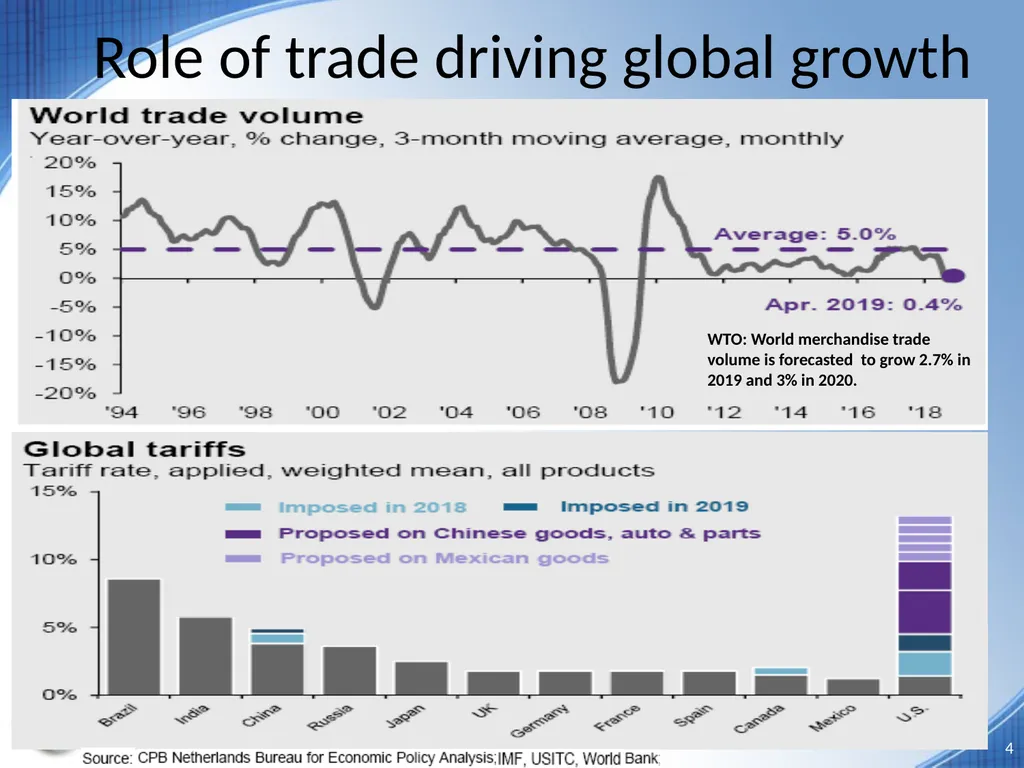
Role of trade driving global growth 4 WTO: World merchandise trade volume is forecasted to grow 2.7% in 2019 and 3% in 2020.<br>
05
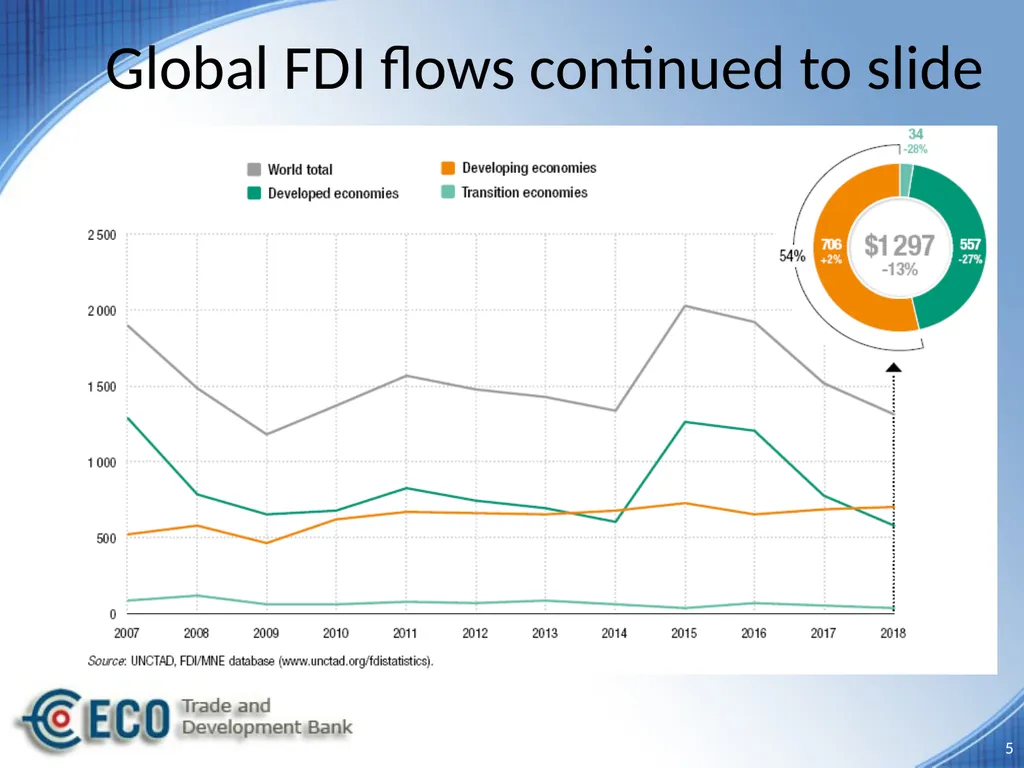
Global FDI flows continued to slide 5<br>
06
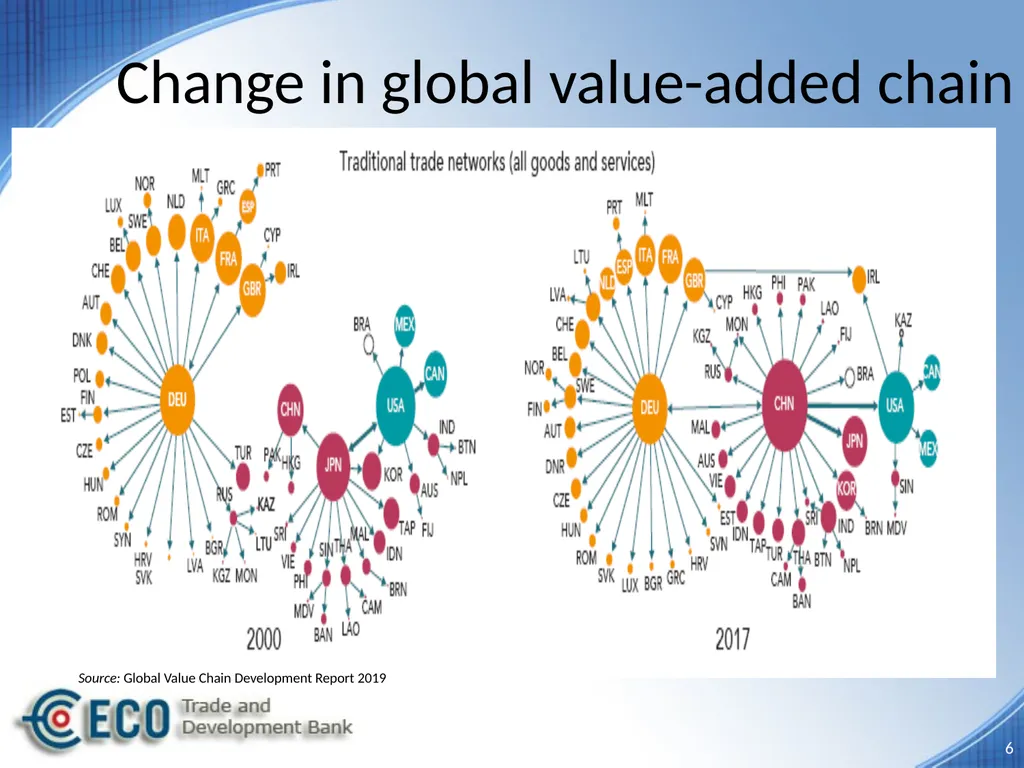
Change in global value-added chain 6 Source: Global Value Chain Development Report 2019<br>
07
Risks on the sustainable global recovery Protectionism trends in global trade
Geopolitical tensions
Normalization in monetary policies of advanced economies
Debt levels are rising in many advanced economies, and emerging markets
Higher borrowing costs
Increase in commodity prices
Weak productivity trends, technological innovation, big data and artificial intelligence,
Regulations on cyber-security, compliance, AML procedures, crypto-assets, payment systems including across borders, etc. 7<br>
08
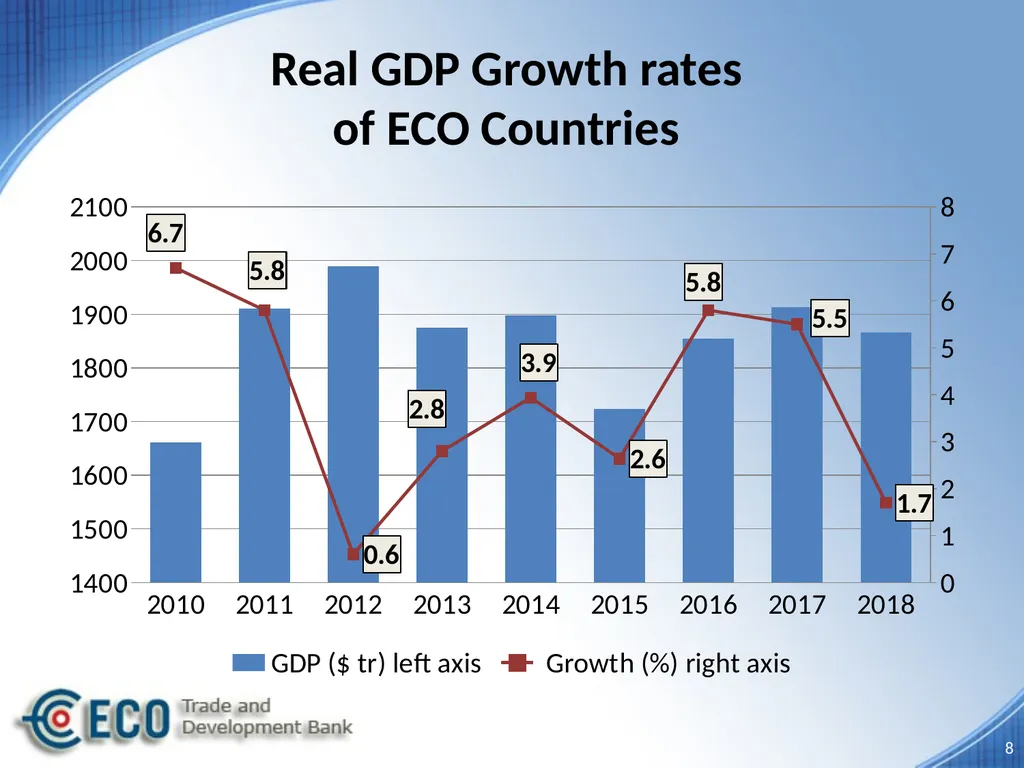
Real GDP Growth rates of ECO Countries 8<br>
09
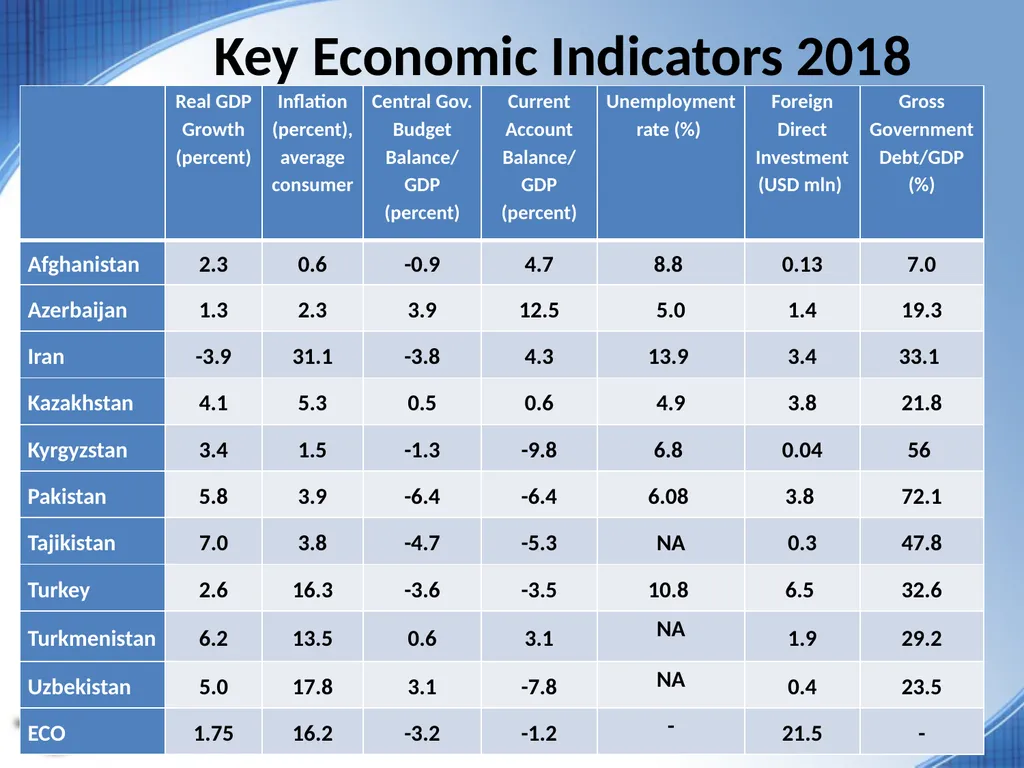
Key Economic Indicators 2018<br>
10
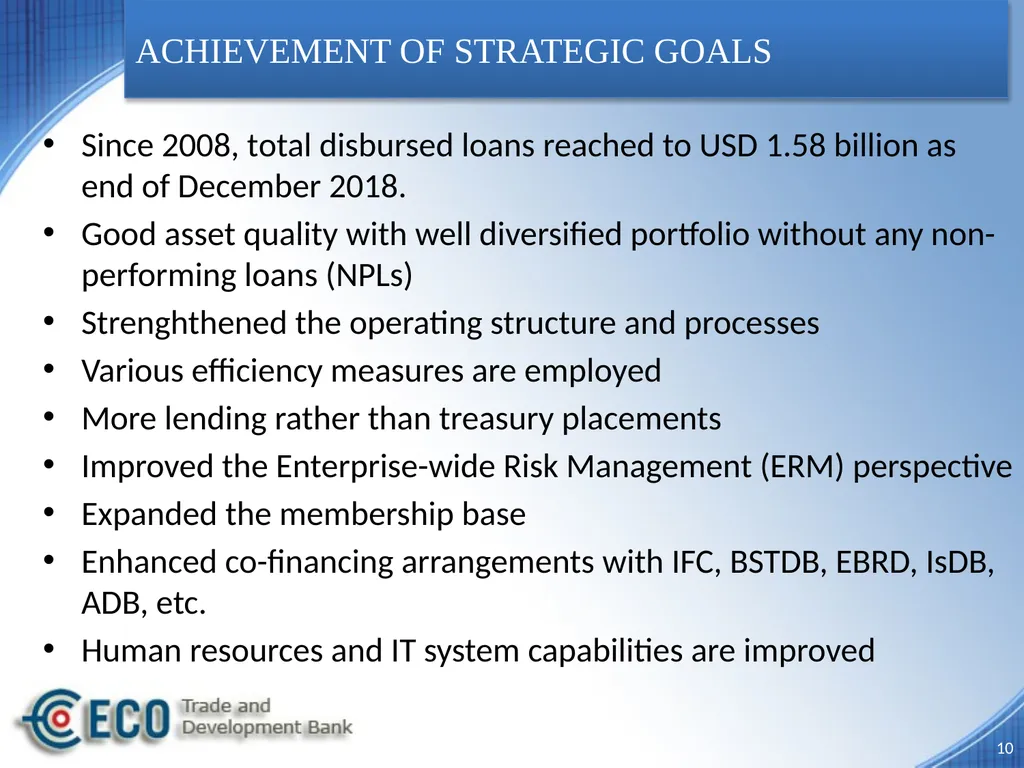
10 ACHIEVEMENT OF STRATEGIC GOALS Since 2008, total disbursed loans reached to USD 1.58 billion as end of December 2018.
Good asset quality with well diversified portfolio without any non-performing loans (NPLs)
Strenghthened the operating structure and processes
Various efficiency measures are employed
More lending rather than treasury placements
Improved the Enterprise-wide Risk Management (ERM) perspective
Expanded the membership base
Enhanced co-financing arrangements with IFC, BSTDB, EBRD, IsDB, ADB, etc.
Human resources and IT system capabilities are improved<br>
11
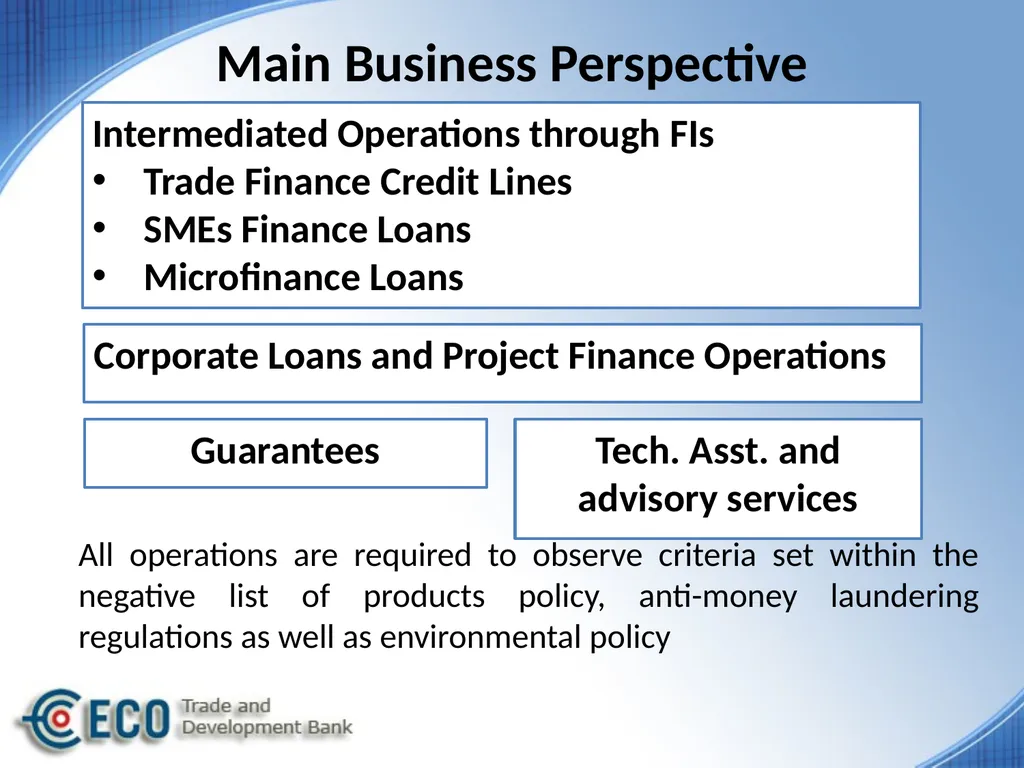
Main Business Perspective All operations are required to observe criteria set within the negative list of products policy, anti-money laundering regulations as well as environmental policy Guarantees Tech. Asst. and advisory services Intermediated Operations through FIs
Trade Finance Credit Lines
SMEs Finance Loans
Microfinance Loans Corporate Loans and Project Finance Operations<br>
12
Total Loan disbursements by country 2008-2018 (thousand USD) The Bank has successfully launched its credit operation in Azerbaijan and looking for opportunities in Afghanistan and Kyrgyzstan as well.<br>
13
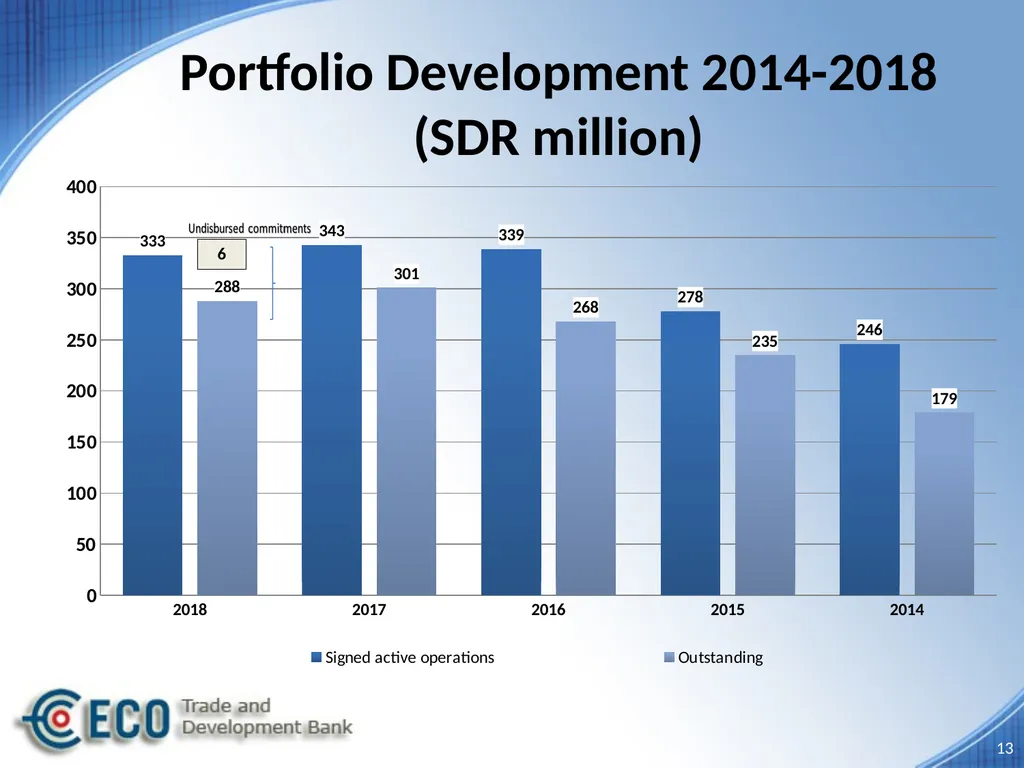
Portfolio Development 2014-2018 (SDR million) 13<br>
Challenges of the ETDB Sustaining a high quality loan portfolio
Enhancing cooperation with the banks in the member states
Access to corresponding banking services
Enhancing the capital resources
Encouraging new members (Kazakhstan, Tajikistan, Turkmenistan and Uzbekistan) 15<br>