01
Assessing the Correlation between Chlorophyll a Levels
in Biofilm and the Water Column
Madison Tate
Faculty Advisor(s): Dr. Kelli Z. Hunsucker, Dept. of Ocean Engineering and Marine Science, Florida Institute of Technology Introduction Biofilm accumulation on ship hulls increases drag and fuel consumption. Despite continuing advancements in antifouling coatings, there is limited research on how environmental parameters influence biofilm development. Understanding how in situ variables can influence biofilm development can lead to better management strategies for preventing and removing growth on ship hulls. I would like to thank both Dr. Kelli Z. Hunsucker as well as Dr. Austin L. Fox for helping plan and carry out this project. I would also like to thank ORCA for providing water quality parameters to perform the analysis. This work was done on an ONR funded research platform. Determine the biofilm characteristics (percent cover, thickness, and chlorophyll concentration) in a flow channel after 8 days of growth
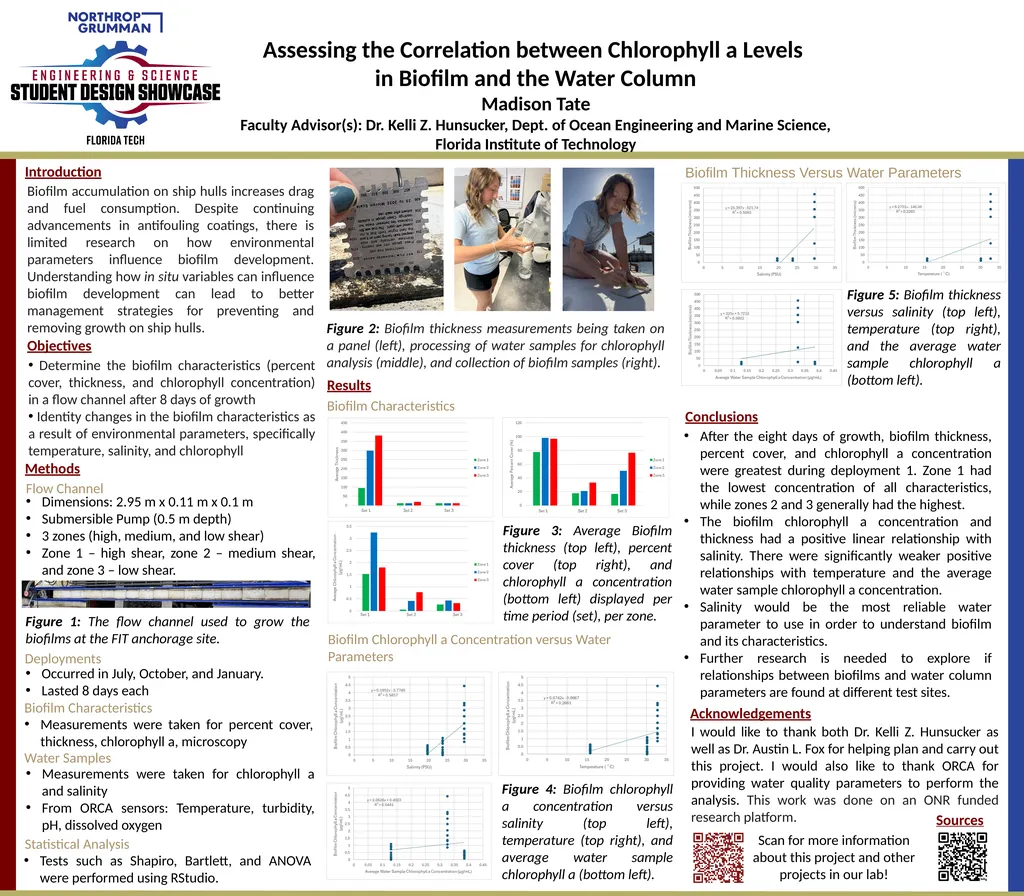
Identity changes in the biofilm characteristics as a result of environmental parameters, specifically temperature, salinity, and chlorophyll Objectives Conclusions Figure 1: The flow channel used to grow the biofilms at the FIT anchorage site. Acknowledgements Results Biofilm Characteristics Figure 3: Average Biofilm thickness (top left), percent cover (top right), and chlorophyll a concentration (bottom left) displayed per time period (set), per zone. Biofilm Chlorophyll a Concentration versus Water Parameters Biofilm Thickness Versus Water Parameters Figure 4: Biofilm chlorophyll a concentration versus salinity (top left), temperature (top right), and average water sample chlorophyll a (bottom left). Methods Figure 5: Biofilm thickness versus salinity (top left), temperature (top right), and the average water sample chlorophyll a (bottom left). After the eight days of growth, biofilm thickness, percent cover, and chlorophyll a concentration were greatest during deployment 1. Zone 1 had the lowest concentration of all characteristics, while zones 2 and 3 generally had the highest.
The biofilm chlorophyll a concentration and thickness had a positive linear relationship with salinity. There were significantly weaker positive relationships with temperature and the average water sample chlorophyll a concentration.
Salinity would be the most reliable water parameter to use in order to understand biofilm and its characteristics.
Further research is needed to explore if relationships between biofilms and water column parameters are found at different test sites. Scan for more information about this project and other projects in our lab! Flow Channel Dimensions: 2.95 m x 0.11 m x 0.1 m
Submersible Pump (0.5 m depth)
3 zones (high, medium, and low shear)
Zone 1 – high shear, zone 2 – medium shear, and zone 3 – low shear. Deployments Occurred in July, October, and January.
Lasted 8 days each Biofilm Characteristics Statistical Analysis Tests such as Shapiro, Bartlett, and ANOVA were performed using RStudio. Measurements were taken for percent cover, thickness, chlorophyll a, microscopy Water Samples Measurements were taken for chlorophyll a and salinity
From ORCA sensors: Temperature, turbidity, pH, dissolved oxygen Figure 2: Biofilm thickness measurements being taken on a panel (left), processing of water samples for chlorophyll analysis (middle), and collection of biofilm samples (right). Sources<br>