
Avani Kapur Vikram Srinivas Accountability
MS
Published · 23 slides · 0 views
1 / 1



Description
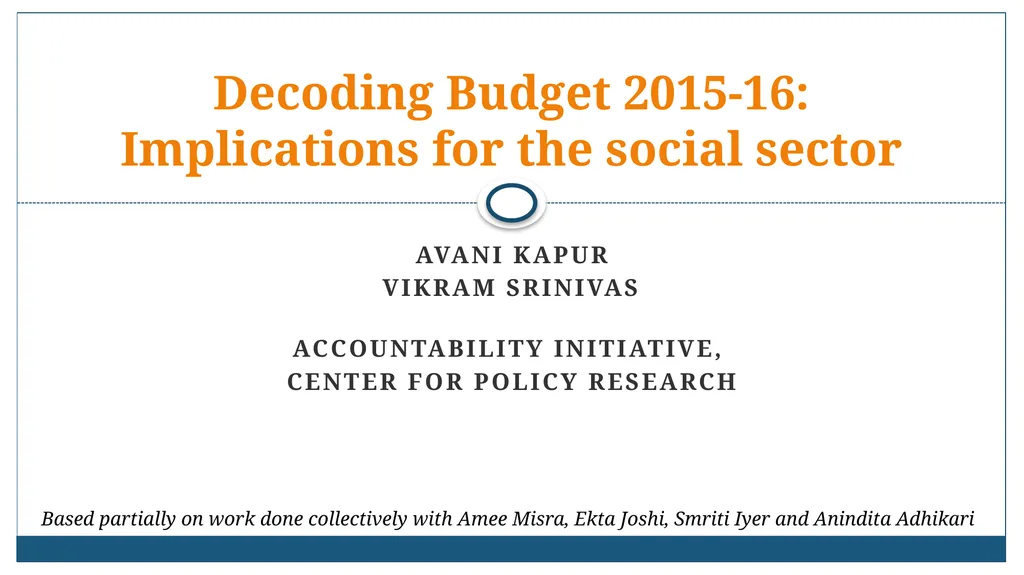
Avani Kapur Vikram Srinivas Accountability Initiative, Center for Policy Research Decoding Budget 2015-16: Implications for the social sector Based partially on work done collectively with Amee Misra, Ekta Joshi, Smriti Iyer and Anindita
Related Topics
Share
Embed code
Download this presentation From Below
"Avani Kapur Vikram Srinivas Accountability" is the property of its rightful owner. Permission is granted to download and print the materials on this website for personal, non-commercial use only, and to display it on your personal computer provided you do not modify the materials and that you retain all copyright notices contained in the materials. By downloading content from our website, you accept the terms of this agreement.
Presentation Transcript
01
Avani Kapur
Vikram Srinivas
Accountability Initiative,
Center for Policy Research Decoding Budget 2015-16: Implications for the social sector Based partially on work done collectively with Amee Misra, Ekta Joshi, Smriti Iyer and Anindita Adhikari<br>
Vikram Srinivas
Accountability Initiative,
Center for Policy Research Decoding Budget 2015-16: Implications for the social sector Based partially on work done collectively with Amee Misra, Ekta Joshi, Smriti Iyer and Anindita Adhikari<br>
02
Outline Key recommendations of the 14th FC (relevant from the Budget perspective)
Implications on the social sector (current allocations and review of past scheme performances)
Thoughts on challenges and next steps<br>
Implications on the social sector (current allocations and review of past scheme performances)
Thoughts on challenges and next steps<br>
03
Major takeaways Fourteenth Finance Commission (FFC) recommendations have devolved significant “untied” funds from Center to States
Center has responded by cutting allocations in social sector schemes<br>
Center has responded by cutting allocations in social sector schemes<br>
04
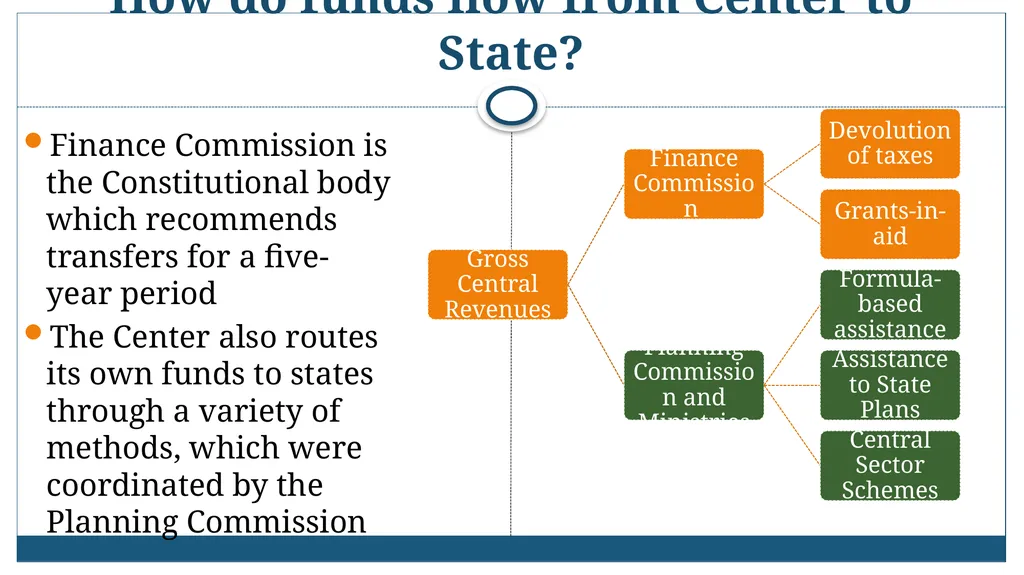
How do funds flow from Center to State? Finance Commission is the Constitutional body which recommends transfers for a five-year period
The Center also routes its own funds to states through a variety of methods, which were coordinated by the Planning Commission<br>
The Center also routes its own funds to states through a variety of methods, which were coordinated by the Planning Commission<br>
05
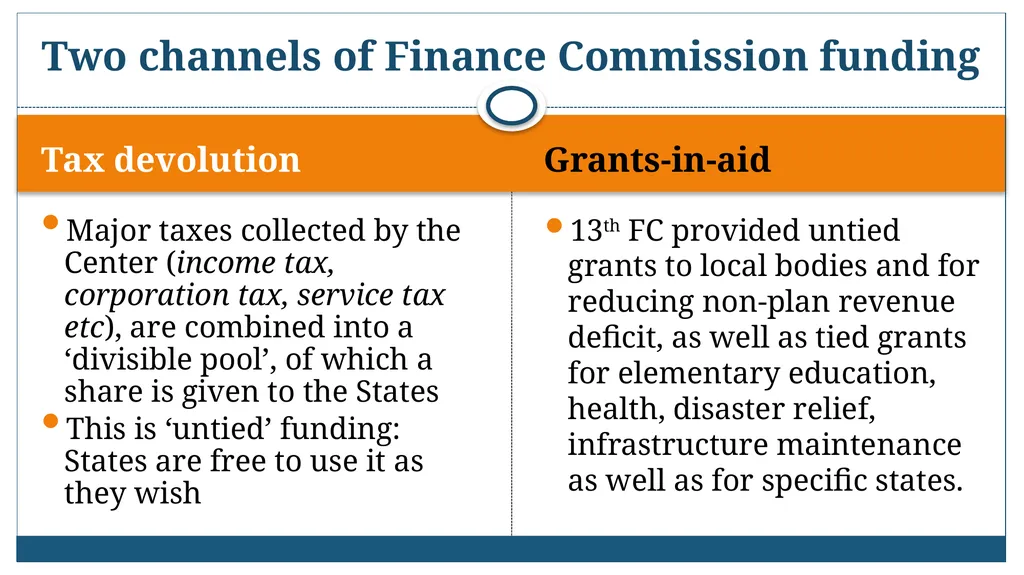
Tax devolution Grants-in-aid Major taxes collected by the Center (income tax, corporation tax, service tax etc), are combined into a ‘divisible pool’, of which a share is given to the States
This is ‘untied’ funding: States are free to use it as they wish 13th FC provided untied grants to local bodies and for reducing non-plan revenue deficit, as well as tied grants for elementary education, health, disaster relief, infrastructure maintenance as well as for specific states. Two channels of Finance Commission funding<br>
This is ‘untied’ funding: States are free to use it as they wish 13th FC provided untied grants to local bodies and for reducing non-plan revenue deficit, as well as tied grants for elementary education, health, disaster relief, infrastructure maintenance as well as for specific states. Two channels of Finance Commission funding<br>
06
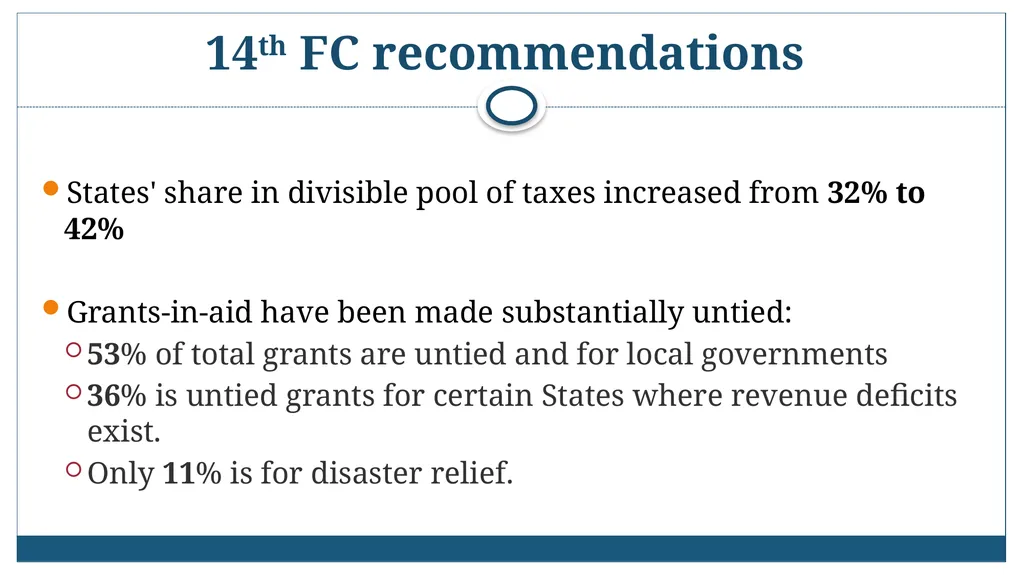
14th FC recommendations States' share in divisible pool of taxes increased from 32% to 42%
Grants-in-aid have been made substantially untied:
53% of total grants are untied and for local governments
36% is untied grants for certain States where revenue deficits exist.
Only 11% is for disaster relief.<br>
Grants-in-aid have been made substantially untied:
53% of total grants are untied and for local governments
36% is untied grants for certain States where revenue deficits exist.
Only 11% is for disaster relief.<br>
07
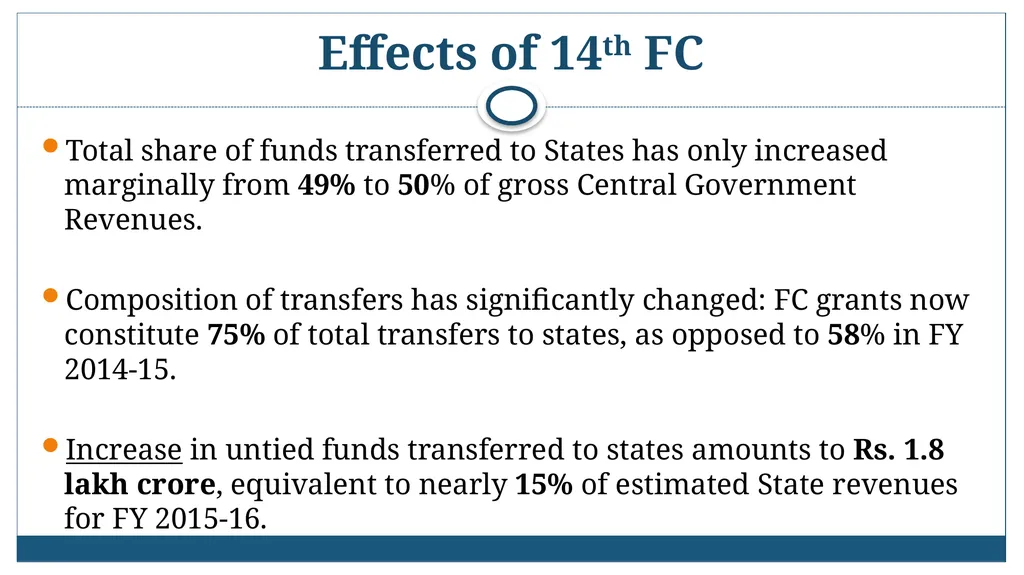
Effects of 14th FC Total share of funds transferred to States has only increased marginally from 49% to 50% of gross Central Government Revenues.
Composition of transfers has significantly changed: FC grants now constitute 75% of total transfers to states, as opposed to 58% in FY 2014-15.
Increase in untied funds transferred to states amounts to Rs. 1.8 lakh crore, equivalent to nearly 15% of estimated State revenues for FY 2015-16.<br>
Composition of transfers has significantly changed: FC grants now constitute 75% of total transfers to states, as opposed to 58% in FY 2014-15.
Increase in untied funds transferred to states amounts to Rs. 1.8 lakh crore, equivalent to nearly 15% of estimated State revenues for FY 2015-16.<br>
08
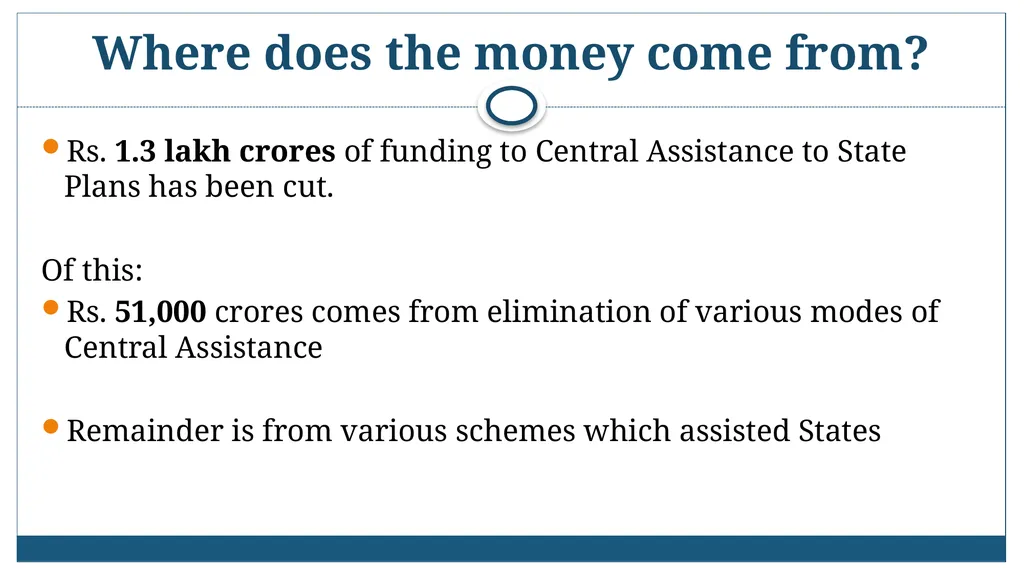
Where does the money come from? Rs. 1.3 lakh crores of funding to Central Assistance to State Plans has been cut.
Of this:
Rs. 51,000 crores comes from elimination of various modes of Central Assistance
Remainder is from various schemes which assisted States<br>
Of this:
Rs. 51,000 crores comes from elimination of various modes of Central Assistance
Remainder is from various schemes which assisted States<br>
09
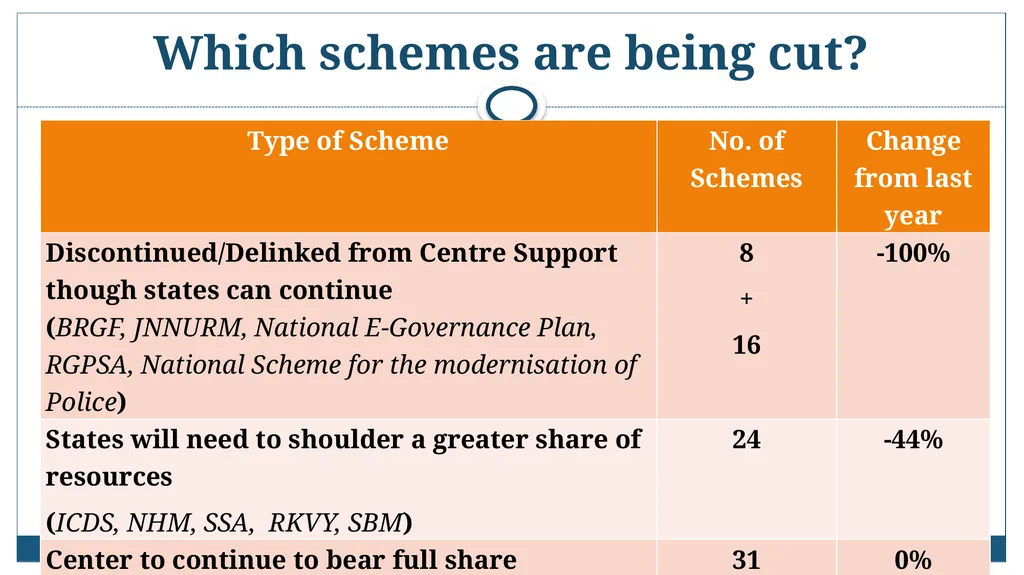
Which schemes are being cut?<br>
10
WHAT WE KNOW AND WHAT WE HOPE TO FIND OUT SOON IMPLICATIONS FOR THE SOCIAL SECTOR<br>
11
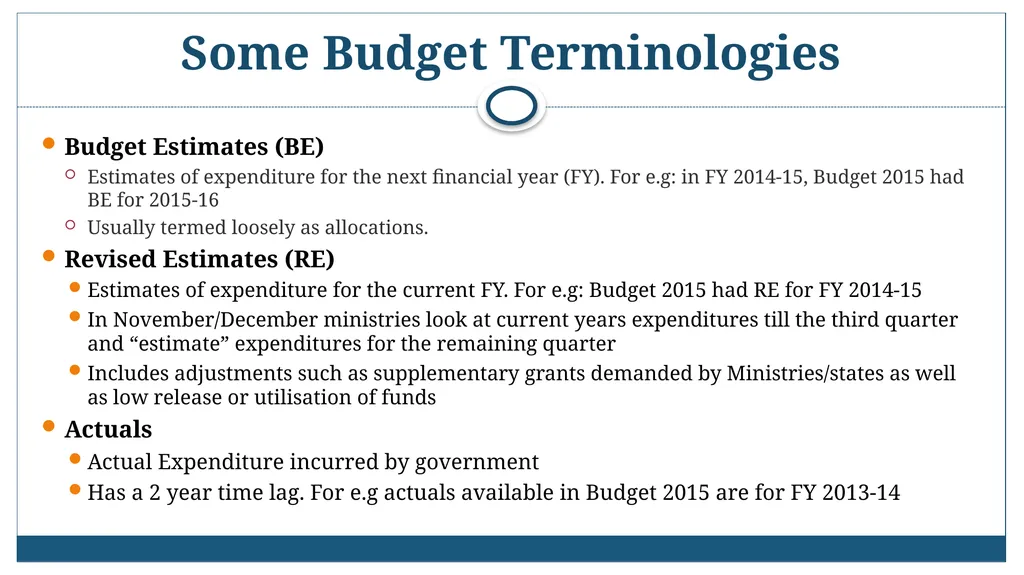
Some Budget Terminologies Budget Estimates (BE)
Estimates of expenditure for the next financial year (FY). For e.g: in FY 2014-15, Budget 2015 had BE for 2015-16
Usually termed loosely as allocations.
Revised Estimates (RE)
Estimates of expenditure for the current FY. For e.g: Budget 2015 had RE for FY 2014-15
In November/December ministries look at current years expenditures till the third quarter and “estimate” expenditures for the remaining quarter
Includes adjustments such as supplementary grants demanded by Ministries/states as well as low release or utilisation of funds
Actuals
Actual Expenditure incurred by government
Has a 2 year time lag. For e.g actuals available in Budget 2015 are for FY 2013-14<br>
Estimates of expenditure for the next financial year (FY). For e.g: in FY 2014-15, Budget 2015 had BE for 2015-16
Usually termed loosely as allocations.
Revised Estimates (RE)
Estimates of expenditure for the current FY. For e.g: Budget 2015 had RE for FY 2014-15
In November/December ministries look at current years expenditures till the third quarter and “estimate” expenditures for the remaining quarter
Includes adjustments such as supplementary grants demanded by Ministries/states as well as low release or utilisation of funds
Actuals
Actual Expenditure incurred by government
Has a 2 year time lag. For e.g actuals available in Budget 2015 are for FY 2013-14<br>
12
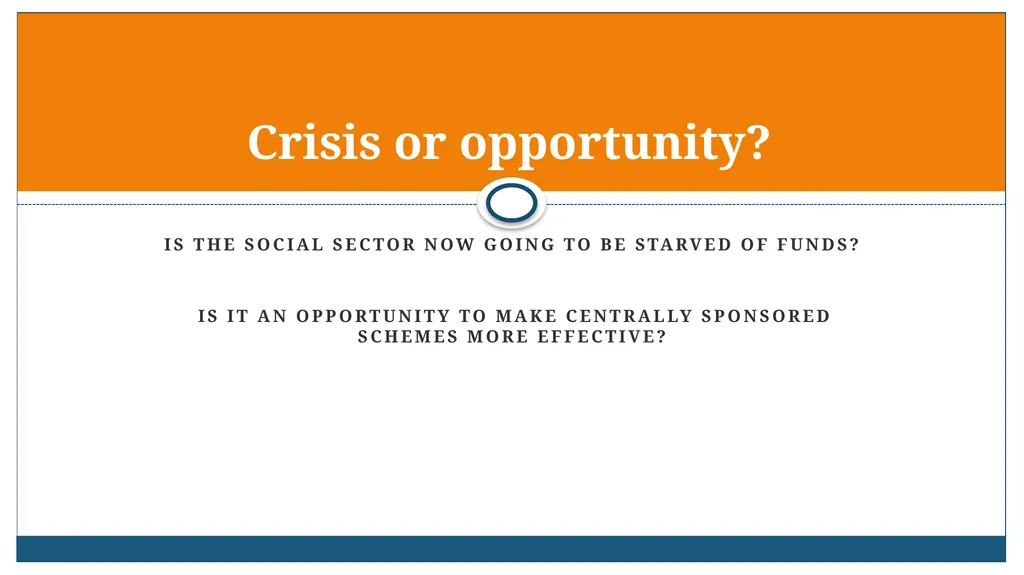
Is the social sector now going to be starved of funds?
Is it an opportunity to make Centrally sponsored schemes more effective? Crisis or opportunity?<br>
Is it an opportunity to make Centrally sponsored schemes more effective? Crisis or opportunity?<br>
13
Impact on schemes and ministries Figures in Rs. crore<br>
14
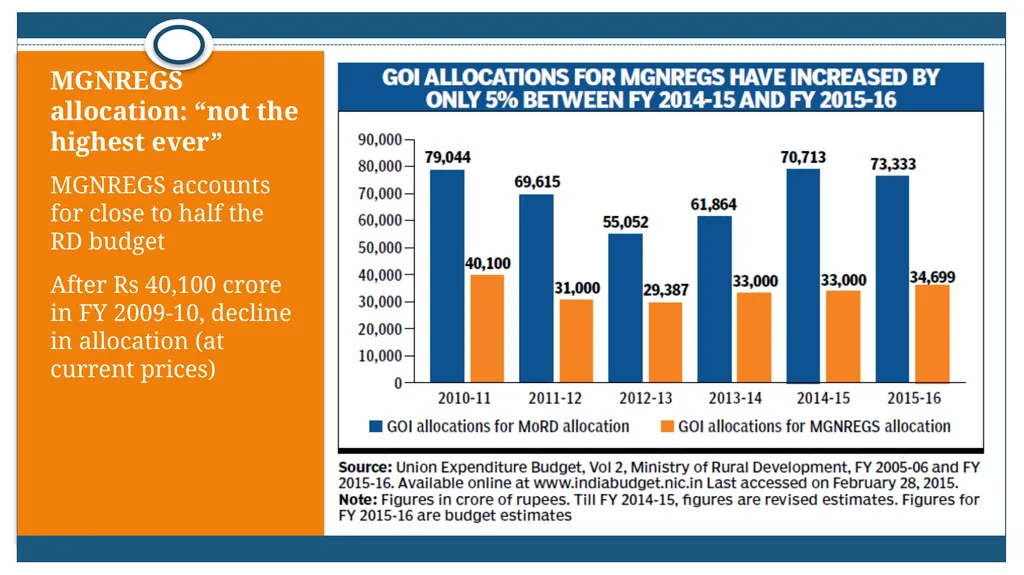
MGNREGS allocation: “not the highest ever” MGNREGS accounts for close to half the RD budget
After Rs 40,100 crore in FY 2009-10, decline in allocation (at current prices)<br>
After Rs 40,100 crore in FY 2009-10, decline in allocation (at current prices)<br>
15
Expenditure has exceeded allocations since FY 2011-12 Increase in allocations between 2013-14 and 2014-15 was 3% and between 2014-15 and 2015-16 has been 5% but spending as a proportion of funds available has increased from 87% to 92% over the last three years
Expenditure + pending liabilities exceed allocations
Mounting pending liabilities since 2011-12, highest at Rs. 5,500 crore in 2013-14
Wage liabilities already Rs. 2500+ crore in 2014-15<br>
Expenditure + pending liabilities exceed allocations
Mounting pending liabilities since 2011-12, highest at Rs. 5,500 crore in 2013-14
Wage liabilities already Rs. 2500+ crore in 2014-15<br>
16
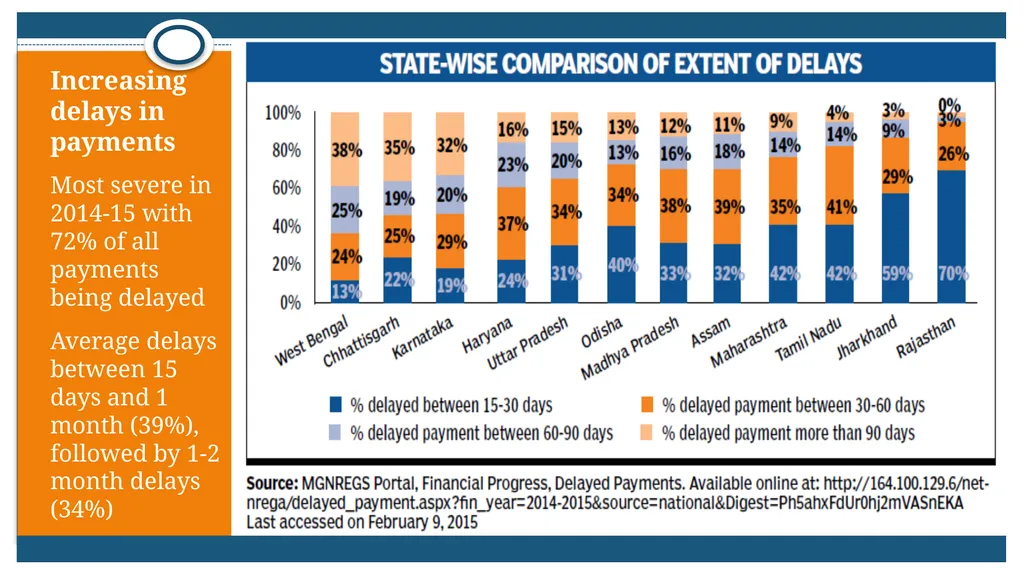
Increasing delays in payments Most severe in 2014-15 with 72% of all payments being delayed
Average delays between 15 days and 1 month (39%), followed by 1-2 month delays (34%)<br>
Average delays between 15 days and 1 month (39%), followed by 1-2 month delays (34%)<br>
17
Allocations aren’t the whole story Historically, significant variations between BE, RE and Actuals
Budget allocations are often never spent, and sometimes not even released by the Center to States
Example: 11th Five Year Plan MoHFW released only 67% of its allocations
Only 51% of funds allocated for SBM in 2013-14 were released by GOI<br>
Budget allocations are often never spent, and sometimes not even released by the Center to States
Example: 11th Five Year Plan MoHFW released only 67% of its allocations
Only 51% of funds allocated for SBM in 2013-14 were released by GOI<br>
18
Fund release is not smooth Funds are often released towards the end of the financial year; making it difficult for States to spend the money
Only 15% of SBM allocations released in the first two quarters of FY 2014-15.
36% of SBM allocations were released in the last quarter of FY 2013-14: 30% in fact released in the last month!
Conditions attached to fund release mean that allocations are often delayed further till States can prove compliance
For example: Utilisation Certificates, States putting their own share etc
Further delays to last mile delivery
Only 34% schools had got the school development grant for buying basic school supplies like dusters, chalk etc half-way through the FY 2013-14<br>
Only 15% of SBM allocations released in the first two quarters of FY 2014-15.
36% of SBM allocations were released in the last quarter of FY 2013-14: 30% in fact released in the last month!
Conditions attached to fund release mean that allocations are often delayed further till States can prove compliance
For example: Utilisation Certificates, States putting their own share etc
Further delays to last mile delivery
Only 34% schools had got the school development grant for buying basic school supplies like dusters, chalk etc half-way through the FY 2013-14<br>
19
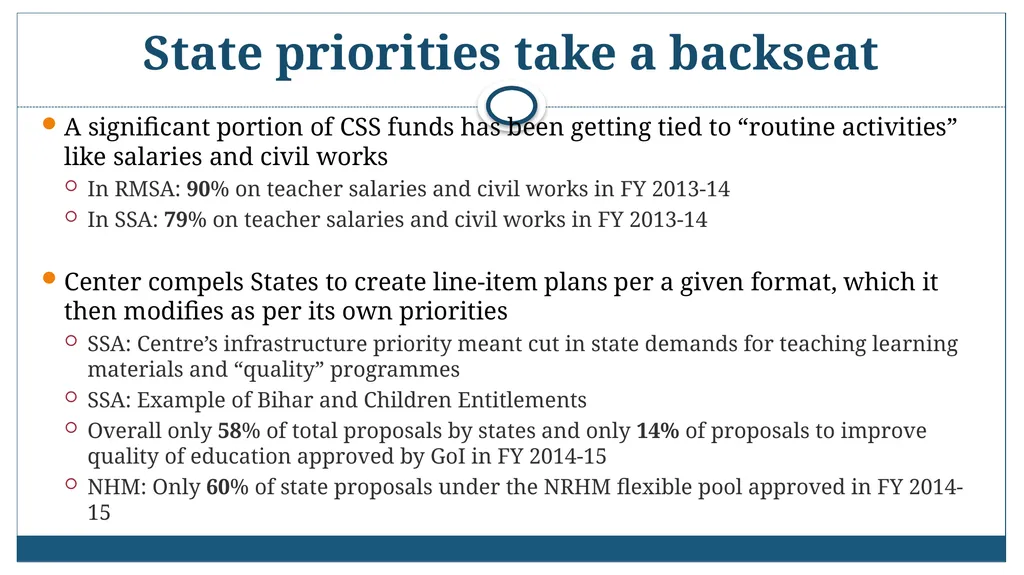
State priorities take a backseat A significant portion of CSS funds has been getting tied to “routine activities” like salaries and civil works
In RMSA: 90% on teacher salaries and civil works in FY 2013-14
In SSA: 79% on teacher salaries and civil works in FY 2013-14
Center compels States to create line-item plans per a given format, which it then modifies as per its own priorities
SSA: Centre’s infrastructure priority meant cut in state demands for teaching learning materials and “quality” programmes
SSA: Example of Bihar and Children Entitlements
Overall only 58% of total proposals by states and only 14% of proposals to improve quality of education approved by GoI in FY 2014-15
NHM: Only 60% of state proposals under the NRHM flexible pool approved in FY 2014-15<br>
In RMSA: 90% on teacher salaries and civil works in FY 2013-14
In SSA: 79% on teacher salaries and civil works in FY 2013-14
Center compels States to create line-item plans per a given format, which it then modifies as per its own priorities
SSA: Centre’s infrastructure priority meant cut in state demands for teaching learning materials and “quality” programmes
SSA: Example of Bihar and Children Entitlements
Overall only 58% of total proposals by states and only 14% of proposals to improve quality of education approved by GoI in FY 2014-15
NHM: Only 60% of state proposals under the NRHM flexible pool approved in FY 2014-15<br>
20
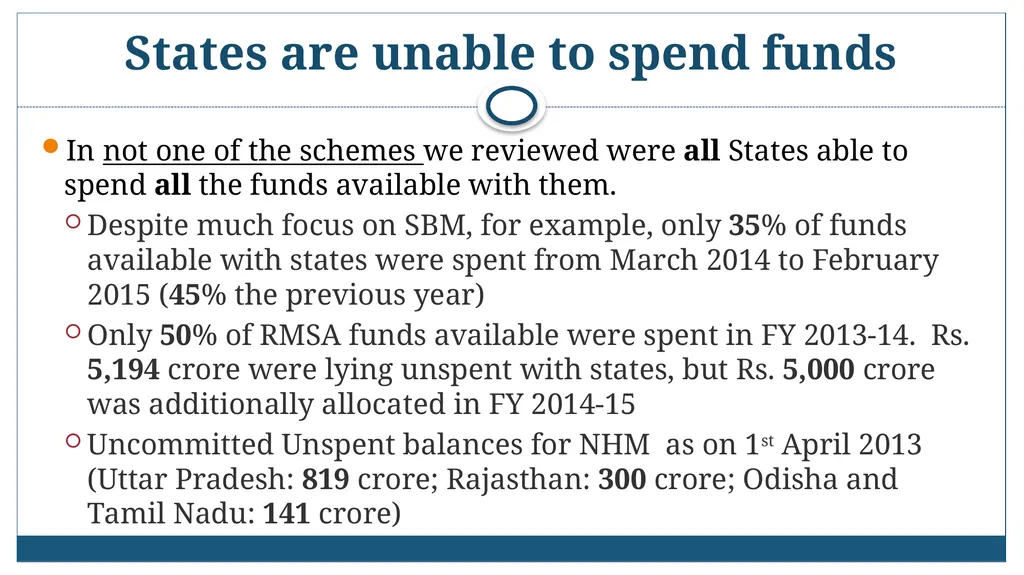
States are unable to spend funds In not one of the schemes we reviewed were all States able to spend all the funds available with them.
Despite much focus on SBM, for example, only 35% of funds available with states were spent from March 2014 to February 2015 (45% the previous year)
Only 50% of RMSA funds available were spent in FY 2013-14. Rs. 5,194 crore were lying unspent with states, but Rs. 5,000 crore was additionally allocated in FY 2014-15
Uncommitted Unspent balances for NHM as on 1st April 2013 (Uttar Pradesh: 819 crore; Rajasthan: 300 crore; Odisha and Tamil Nadu: 141 crore)<br>
Despite much focus on SBM, for example, only 35% of funds available with states were spent from March 2014 to February 2015 (45% the previous year)
Only 50% of RMSA funds available were spent in FY 2013-14. Rs. 5,194 crore were lying unspent with states, but Rs. 5,000 crore was additionally allocated in FY 2014-15
Uncommitted Unspent balances for NHM as on 1st April 2013 (Uttar Pradesh: 819 crore; Rajasthan: 300 crore; Odisha and Tamil Nadu: 141 crore)<br>
21
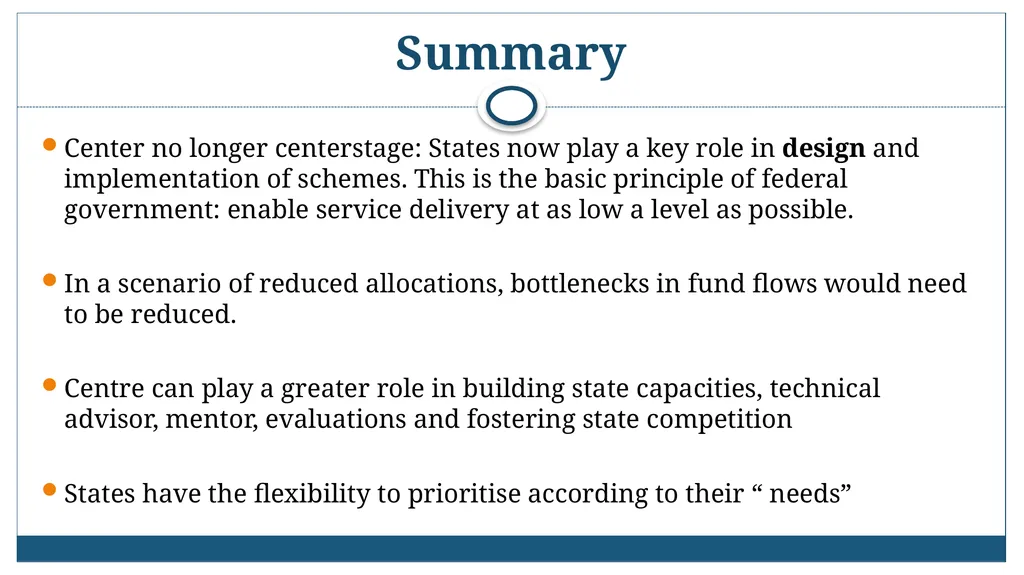
Summary Center no longer centerstage: States now play a key role in design and implementation of schemes. This is the basic principle of federal government: enable service delivery at as low a level as possible.
In a scenario of reduced allocations, bottlenecks in fund flows would need to be reduced.
Centre can play a greater role in building state capacities, technical advisor, mentor, evaluations and fostering state competition
States have the flexibility to prioritise according to their “ needs”<br>
In a scenario of reduced allocations, bottlenecks in fund flows would need to be reduced.
Centre can play a greater role in building state capacities, technical advisor, mentor, evaluations and fostering state competition
States have the flexibility to prioritise according to their “ needs”<br>
22
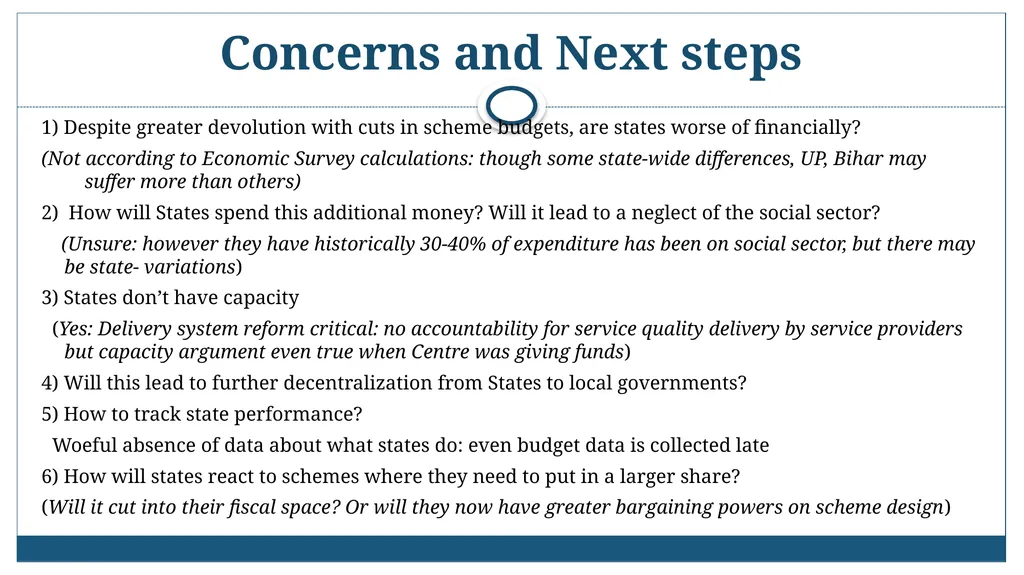
Concerns and Next steps 1) Despite greater devolution with cuts in scheme budgets, are states worse of financially?
(Not according to Economic Survey calculations: though some state-wide differences, UP, Bihar may suffer more than others)
2) How will States spend this additional money? Will it lead to a neglect of the social sector?
(Unsure: however they have historically 30-40% of expenditure has been on social sector, but there may be state- variations)
3) States don’t have capacity
(Yes: Delivery system reform critical: no accountability for service quality delivery by service providers but capacity argument even true when Centre was giving funds)
4) Will this lead to further decentralization from States to local governments?
5) How to track state performance?
Woeful absence of data about what states do: even budget data is collected late
6) How will states react to schemes where they need to put in a larger share?
(Will it cut into their fiscal space? Or will they now have greater bargaining powers on scheme design)<br>
(Not according to Economic Survey calculations: though some state-wide differences, UP, Bihar may suffer more than others)
2) How will States spend this additional money? Will it lead to a neglect of the social sector?
(Unsure: however they have historically 30-40% of expenditure has been on social sector, but there may be state- variations)
3) States don’t have capacity
(Yes: Delivery system reform critical: no accountability for service quality delivery by service providers but capacity argument even true when Centre was giving funds)
4) Will this lead to further decentralization from States to local governments?
5) How to track state performance?
Woeful absence of data about what states do: even budget data is collected late
6) How will states react to schemes where they need to put in a larger share?
(Will it cut into their fiscal space? Or will they now have greater bargaining powers on scheme design)<br>
23
Thank you
For more details on specific schemes please see
www.accountabilityindia.in/expenditure_track For answers to these questions..we will just need to wait and watch!<br>
For more details on specific schemes please see
www.accountabilityindia.in/expenditure_track For answers to these questions..we will just need to wait and watch!<br>