
Azerbaijan: Pathways for Decarbonization in a






Description: Azerbaijan: Pathways for Decarbonization in a Global Context Maksym Chepeliev, Andrea Liverani, Arvind Nair, and Dominique van der Mensbrugghe Center for Global Trade Analysis, Purdue University The World Bank 30th International
Related Topics
Download Presentation
"Azerbaijan: Pathways for Decarbonization in a" is the property of its rightful owner. Permission is granted to download and print the materials on this website for personal, non-commercial use only, and to display it on your personal computer provided you do not modify the materials and that you retain all copyright notices contained in the materials. By downloading content from our website, you accept the terms of this agreement.
Presentation Transcript
slide1. Azerbaijan: Pathways for Decarbonization in a Global Context Maksym Chepeliev,* Andrea Liverani,** Arvind Nair,**
and Dominique van der Mensbrugghe*
*Center for Global Trade Analysis, Purdue University
** The World Bank
30th International Input-Output Association Conference
July 1-5, 2024
Santiago, Chile<br>
slide2. Azerbaijan hydrocarbon-fueled economy has contributed to rapid growth during early 2000s, but has shown its limits
GDP growth has substantially slowed down during the last decade, while country’s diversification efforts have not been successful.
Fossil fuel subsidies remain large and are distorting the economy.
Mitigation efforts around the world can substantially reduce Azerbaijan’s resource rents, through declining global fossil fuel demand and prices
Carbon border adjustment measures can further adversely impact country’s economy: lack of decarbonization efforts is not an option
What policy solutions can country implement to reduce emissions, increase competitiveness and boost the economy?
A set of policies and measures including FF subsidy reform, carbon pricing and alternative revenue recycling options are considered to answer this question. Introduction 2<br>
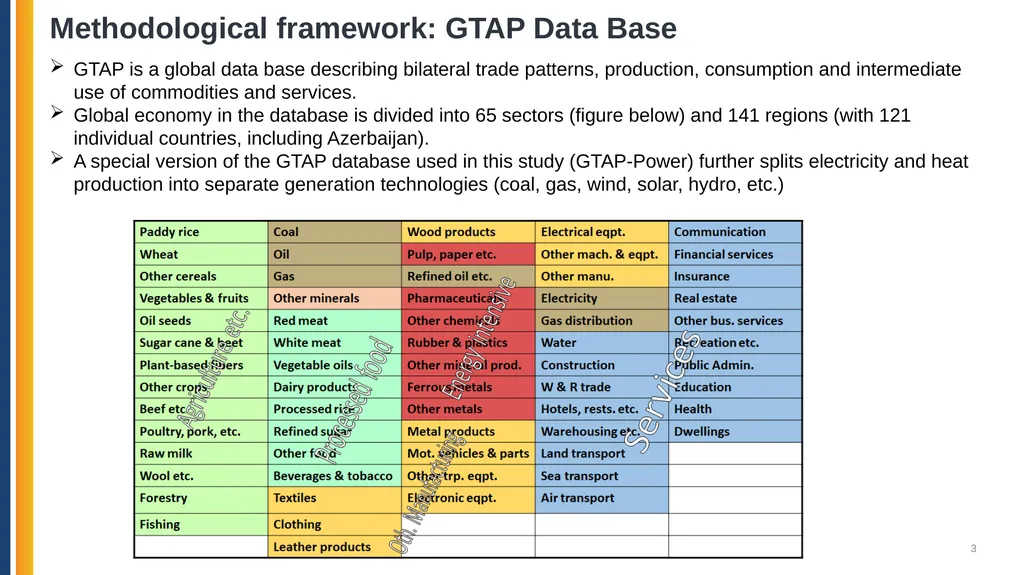
slide3. Methodological framework: GTAP Data Base 3 GTAP is a global data base describing bilateral trade patterns, production, consumption and intermediate use of commodities and services.
Global economy in the database is divided into 65 sectors (figure below) and 141 regions (with 121 individual countries, including Azerbaijan).
A special version of the GTAP database used in this study (GTAP-Power) further splits electricity and heat production into separate generation technologies (coal, gas, wind, solar, hydro, etc.)<br>
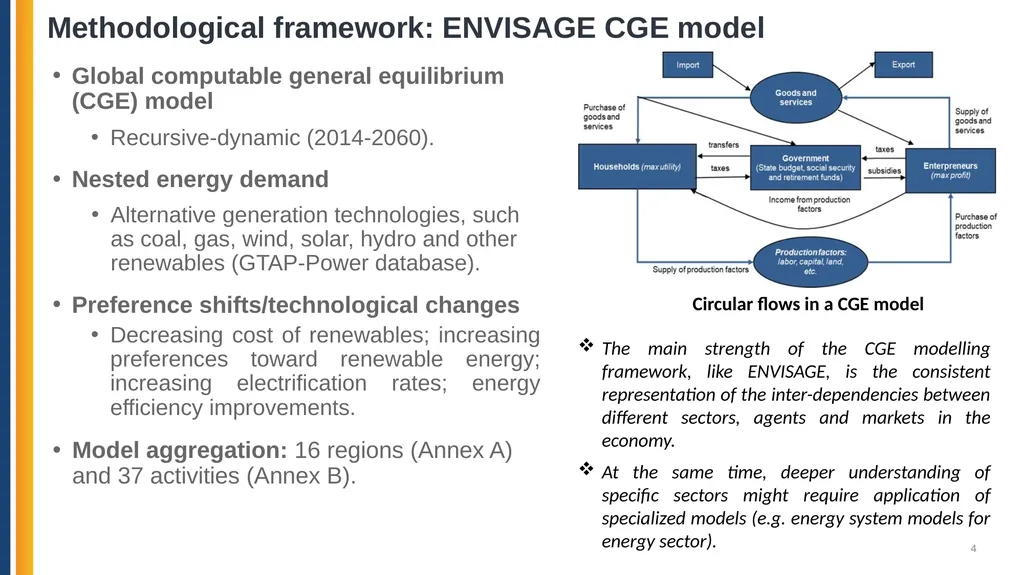
slide4. Methodological framework: ENVISAGE CGE model 4 Global computable general equilibrium (CGE) model
Recursive-dynamic (2014-2060).
Nested energy demand
Alternative generation technologies, such as coal, gas, wind, solar, hydro and other renewables (GTAP-Power database).
Preference shifts/technological changes
Decreasing cost of renewables; increasing preferences toward renewable energy; increasing electrification rates; energy efficiency improvements.
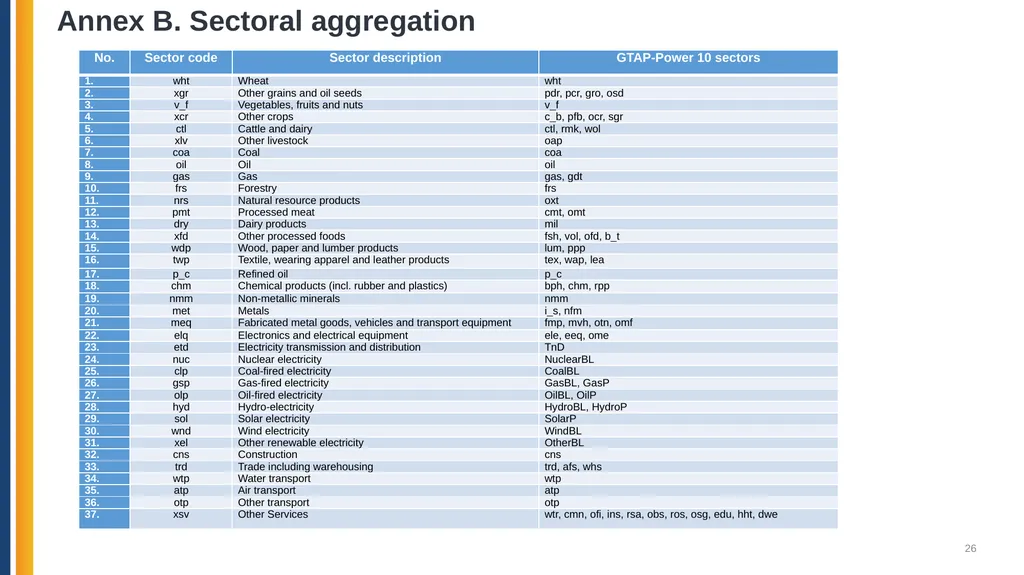
Model aggregation: 16 regions (Annex A) and 37 activities (Annex B). The main strength of the CGE modelling framework, like ENVISAGE, is the consistent representation of the inter-dependencies between different sectors, agents and markets in the economy.
At the same time, deeper understanding of specific sectors might require application of specialized models (e.g. energy system models for energy sector). Circular flows in a CGE model<br>
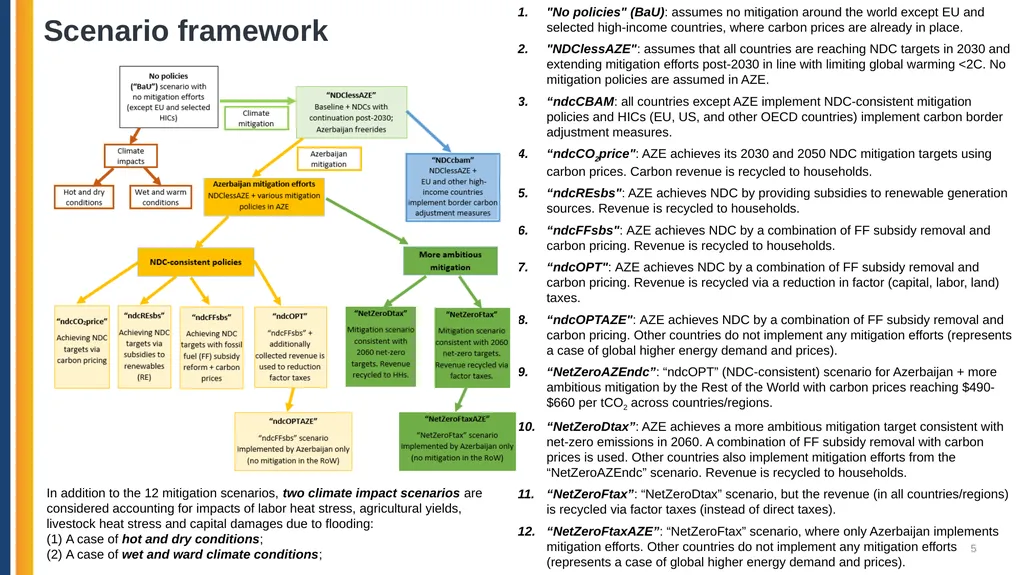
slide5. Scenario framework 5 "No policies" (BaU): assumes no mitigation around the world except EU and selected high-income countries, where carbon prices are already in place.
"NDClessAZE": assumes that all countries are reaching NDC targets in 2030 and extending mitigation efforts post-2030 in line with limiting global warming <2C. No mitigation policies are assumed in AZE.
“ndcCBAM: all countries except AZE implement NDC-consistent mitigation policies and HICs (EU, US, and other OECD countries) implement carbon border adjustment measures.
“ndcCO2price": AZE achieves its 2030 and 2050 NDC mitigation targets using carbon prices. Carbon revenue is recycled to households.
“ndcREsbs": AZE achieves NDC by providing subsidies to renewable generation sources. Revenue is recycled to households.
“ndcFFsbs": AZE achieves NDC by a combination of FF subsidy removal and carbon pricing. Revenue is recycled to households.
“ndcOPT": AZE achieves NDC by a combination of FF subsidy removal and carbon pricing. Revenue is recycled via a reduction in factor (capital, labor, land) taxes.
“ndcOPTAZE": AZE achieves NDC by a combination of FF subsidy removal and carbon pricing. Other countries do not implement any mitigation efforts (represents a case of global higher energy demand and prices).
“NetZeroAZEndc”: “ndcOPT” (NDC-consistent) scenario for Azerbaijan + more ambitious mitigation by the Rest of the World with carbon prices reaching $490-$660 per tCO2 across countries/regions.
“NetZeroDtax”: AZE achieves a more ambitious mitigation target consistent with net-zero emissions in 2060. A combination of FF subsidy removal with carbon prices is used. Other countries also implement mitigation efforts from the “NetZeroAZEndc” scenario. Revenue is recycled to households.
“NetZeroFtax”: “NetZeroDtax” scenario, but the revenue (in all countries/regions) is recycled via factor taxes (instead of direct taxes).
“NetZeroFtaxAZE”: “NetZeroFtax” scenario, where only Azerbaijan implements mitigation efforts. Other countries do not implement any mitigation efforts (represents a case of global higher energy demand and prices). In addition to the 12 mitigation scenarios, two climate impact scenarios are considered accounting for impacts of labor heat stress, agricultural yields, livestock heat stress and capital damages due to flooding:
A case of hot and dry conditions;
A case of wet and ward climate conditions;<br>
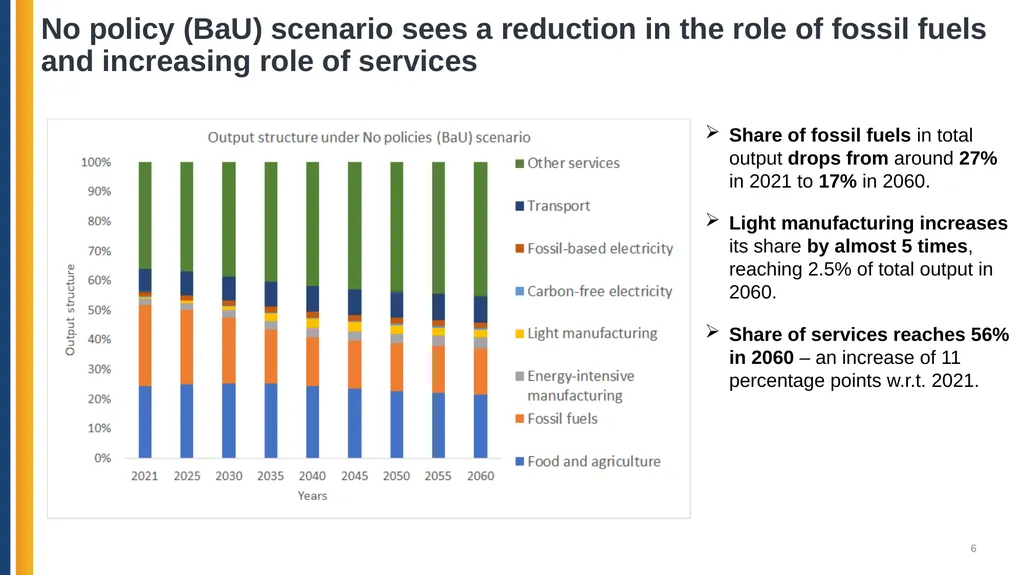
slide6. No policy (BaU) scenario sees a reduction in the role of fossil fuels and increasing role of services 6 Share of fossil fuels in total output drops from around 27% in 2021 to 17% in 2060.
Light manufacturing increases its share by almost 5 times, reaching 2.5% of total output in 2060.
Share of services reaches 56% in 2060 – an increase of 11 percentage points w.r.t. 2021.<br>
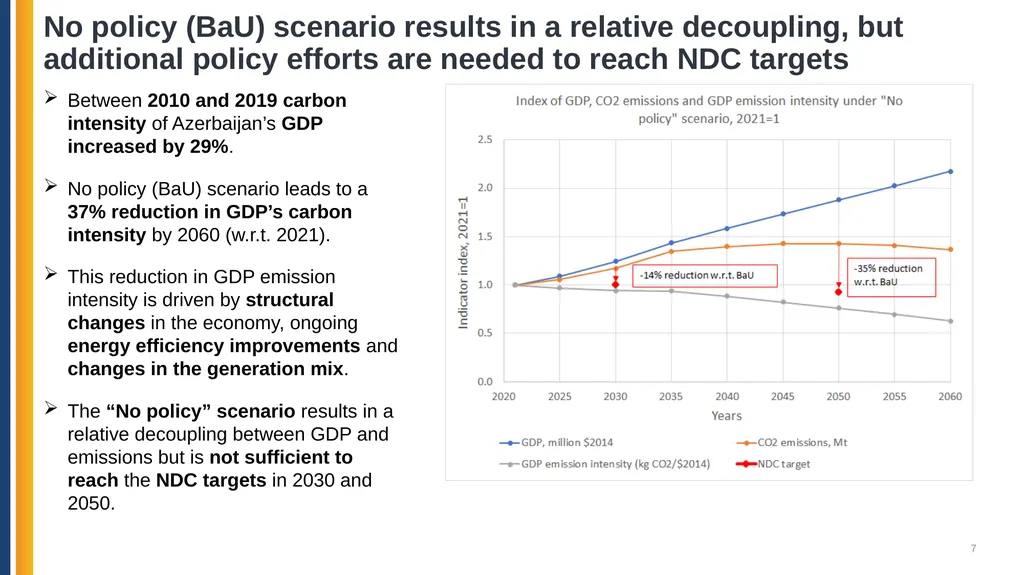
slide7. No policy (BaU) scenario results in a relative decoupling, but additional policy efforts are needed to reach NDC targets 7 Between 2010 and 2019 carbon intensity of Azerbaijan’s GDP increased by 29%.
No policy (BaU) scenario leads to a 37% reduction in GDP’s carbon intensity by 2060 (w.r.t. 2021).
This reduction in GDP emission intensity is driven by structural changes in the economy, ongoing energy efficiency improvements and changes in the generation mix.
The “No policy” scenario results in a relative decoupling between GDP and emissions but is not sufficient to reach the NDC targets in 2030 and 2050.<br>
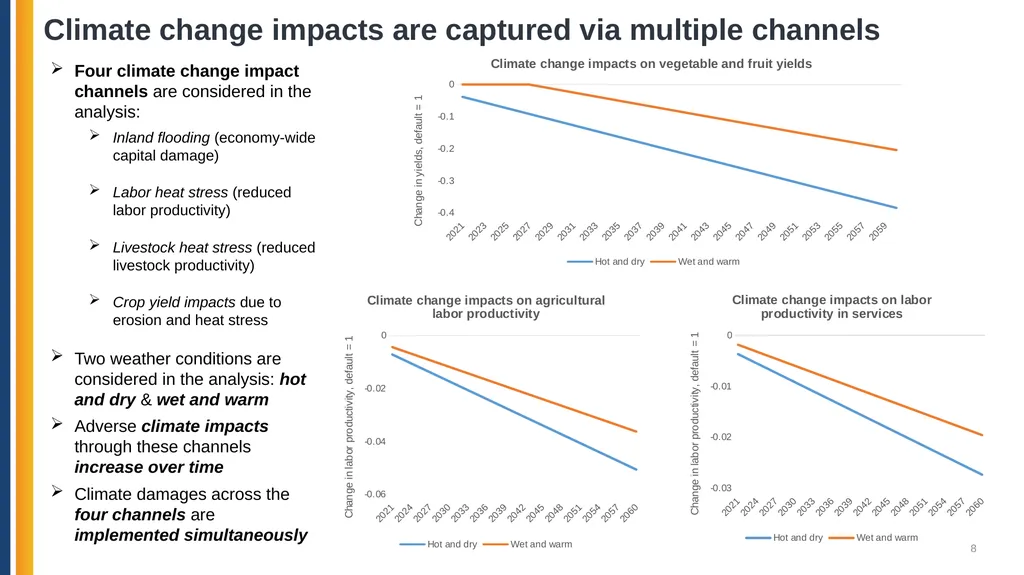
slide8. Climate change impacts are captured via multiple channels 8 Four climate change impact channels are considered in the analysis:
Inland flooding (economy-wide capital damage)
Labor heat stress (reduced labor productivity)
Livestock heat stress (reduced livestock productivity)
Crop yield impacts due to erosion and heat stress
Two weather conditions are considered in the analysis: hot and dry & wet and warm
Adverse climate impacts through these channels increase over time
Climate damages across the four channels are implemented simultaneously<br>
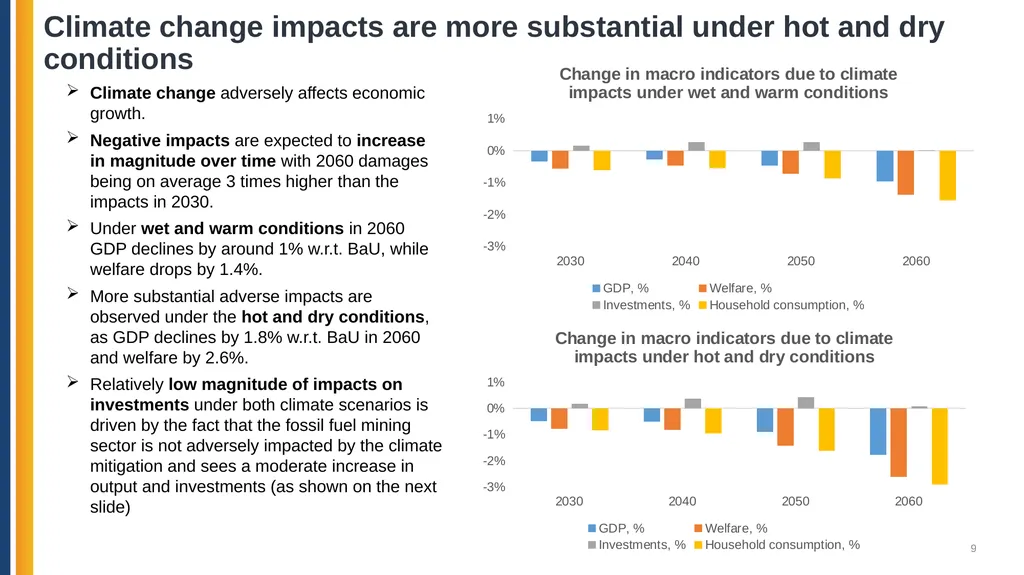
slide9. Climate change impacts are more substantial under hot and dry conditions 9 Climate change adversely affects economic growth.
Negative impacts are expected to increase in magnitude over time with 2060 damages being on average 3 times higher than the impacts in 2030.
Under wet and warm conditions in 2060 GDP declines by around 1% w.r.t. BaU, while welfare drops by 1.4%.
More substantial adverse impacts are observed under the hot and dry conditions, as GDP declines by 1.8% w.r.t. BaU in 2060 and welfare by 2.6%.
Relatively low magnitude of impacts on investments under both climate scenarios is driven by the fact that the fossil fuel mining sector is not adversely impacted by the climate mitigation and sees a moderate increase in output and investments (as shown on the next slide)<br>
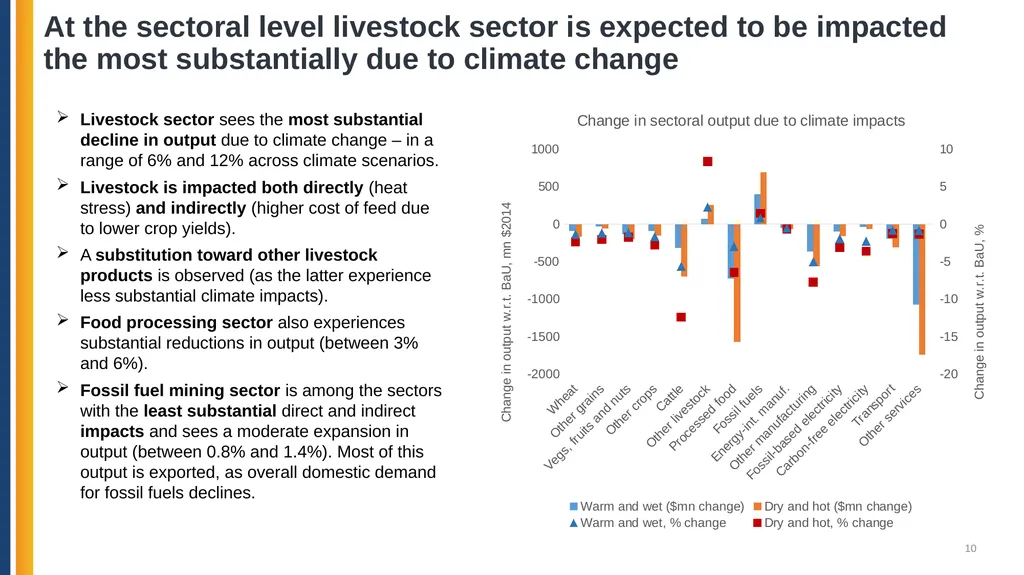
slide10. At the sectoral level livestock sector is expected to be impacted the most substantially due to climate change 10 Livestock sector sees the most substantial decline in output due to climate change – in a range of 6% and 12% across climate scenarios.
Livestock is impacted both directly (heat stress) and indirectly (higher cost of feed due to lower crop yields).
A substitution toward other livestock products is observed (as the latter experience less substantial climate impacts).
Food processing sector also experiences substantial reductions in output (between 3% and 6%).
Fossil fuel mining sector is among the sectors with the least substantial direct and indirect impacts and sees a moderate expansion in output (between 0.8% and 1.4%). Most of this output is exported, as overall domestic demand for fossil fuels declines.<br>
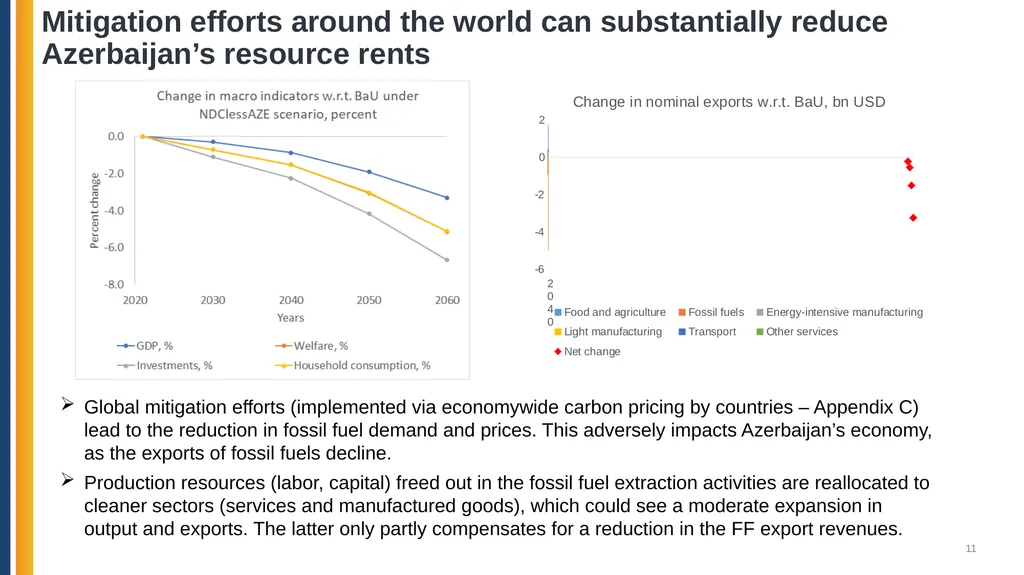
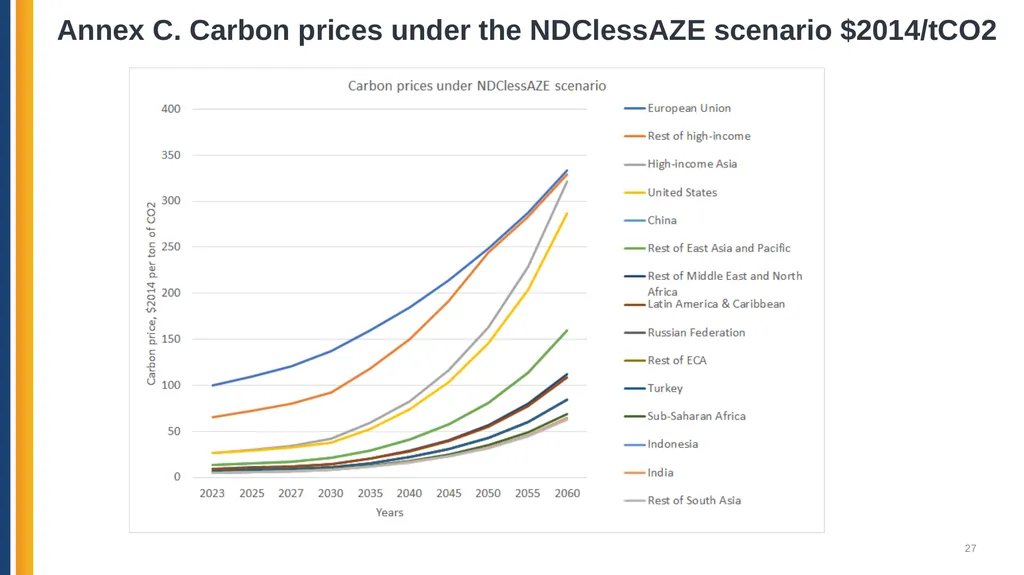
slide11. Mitigation efforts around the world can substantially reduce Azerbaijan’s resource rents 11 Global mitigation efforts (implemented via economywide carbon pricing by countries – Appendix C) lead to the reduction in fossil fuel demand and prices. This adversely impacts Azerbaijan’s economy, as the exports of fossil fuels decline.
Production resources (labor, capital) freed out in the fossil fuel extraction activities are reallocated to cleaner sectors (services and manufactured goods), which could see a moderate expansion in output and exports. The latter only partly compensates for a reduction in the FF export revenues.<br>
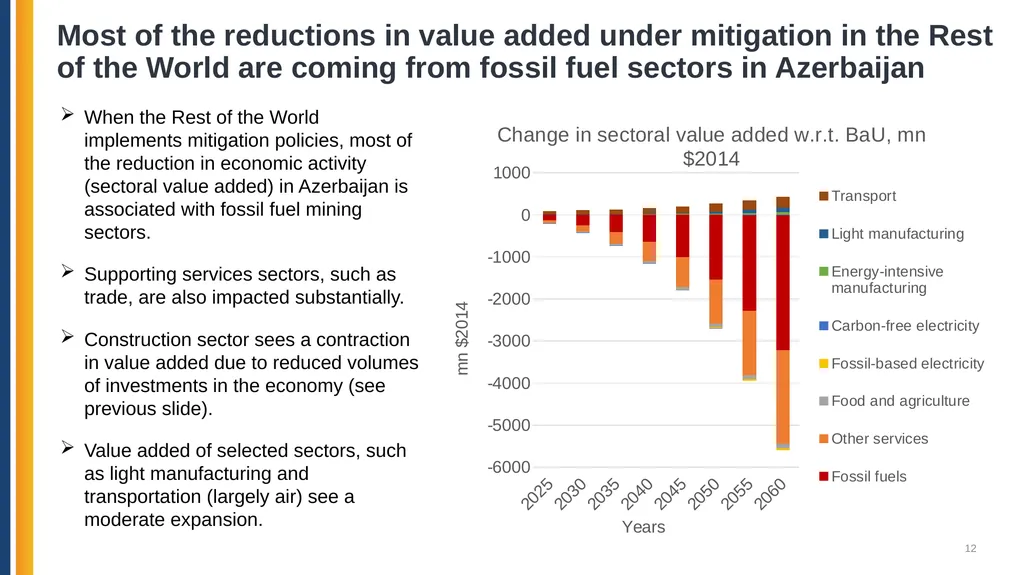
slide12. Most of the reductions in value added under mitigation in the Rest of the World are coming from fossil fuel sectors in Azerbaijan 12 When the Rest of the World implements mitigation policies, most of the reduction in economic activity (sectoral value added) in Azerbaijan is associated with fossil fuel mining sectors.
Supporting services sectors, such as trade, are also impacted substantially.
Construction sector sees a contraction in value added due to reduced volumes of investments in the economy (see previous slide).
Value added of selected sectors, such as light manufacturing and transportation (largely air) see a moderate expansion.<br>
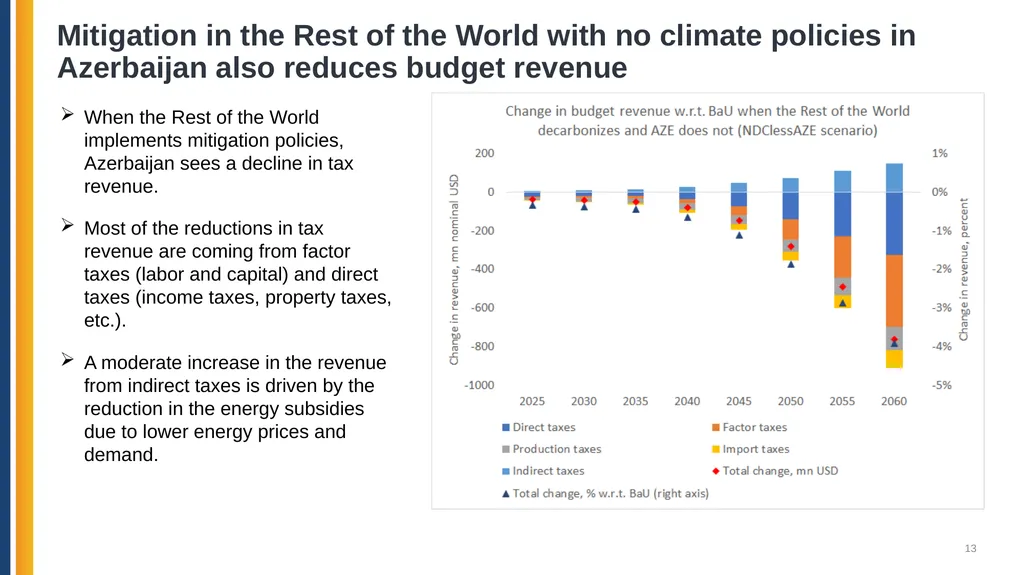
slide13. Mitigation in the Rest of the World with no climate policies in Azerbaijan also reduces budget revenue 13 When the Rest of the World implements mitigation policies, Azerbaijan sees a decline in tax revenue.
Most of the reductions in tax revenue are coming from factor taxes (labor and capital) and direct taxes (income taxes, property taxes, etc.).
A moderate increase in the revenue from indirect taxes is driven by the reduction in the energy subsidies due to lower energy prices and demand.<br>
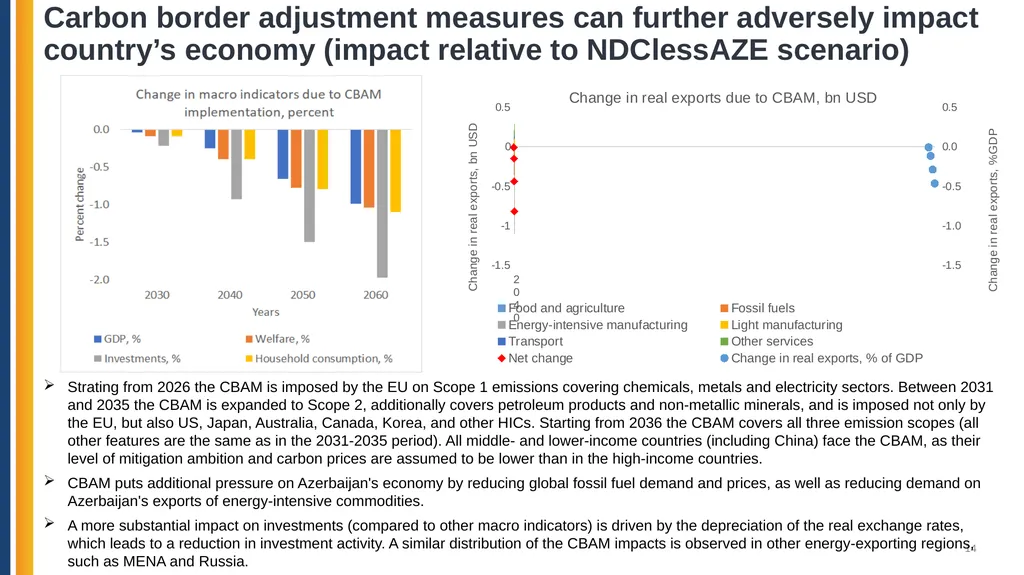
slide14. Carbon border adjustment measures can further adversely impact country’s economy (impact relative to NDClessAZE scenario) 14 Strating from 2026 the CBAM is imposed by the EU on Scope 1 emissions covering chemicals, metals and electricity sectors. Between 2031 and 2035 the CBAM is expanded to Scope 2, additionally covers petroleum products and non-metallic minerals, and is imposed not only by the EU, but also US, Japan, Australia, Canada, Korea, and other HICs. Starting from 2036 the CBAM covers all three emission scopes (all other features are the same as in the 2031-2035 period). All middle- and lower-income countries (including China) face the CBAM, as their level of mitigation ambition and carbon prices are assumed to be lower than in the high-income countries.
CBAM puts additional pressure on Azerbaijan's economy by reducing global fossil fuel demand and prices, as well as reducing demand on Azerbaijan's exports of energy-intensive commodities.
A more substantial impact on investments (compared to other macro indicators) is driven by the depreciation of the real exchange rates, which leads to a reduction in investment activity. A similar distribution of the CBAM impacts is observed in other energy-exporting regions, such as MENA and Russia.<br>
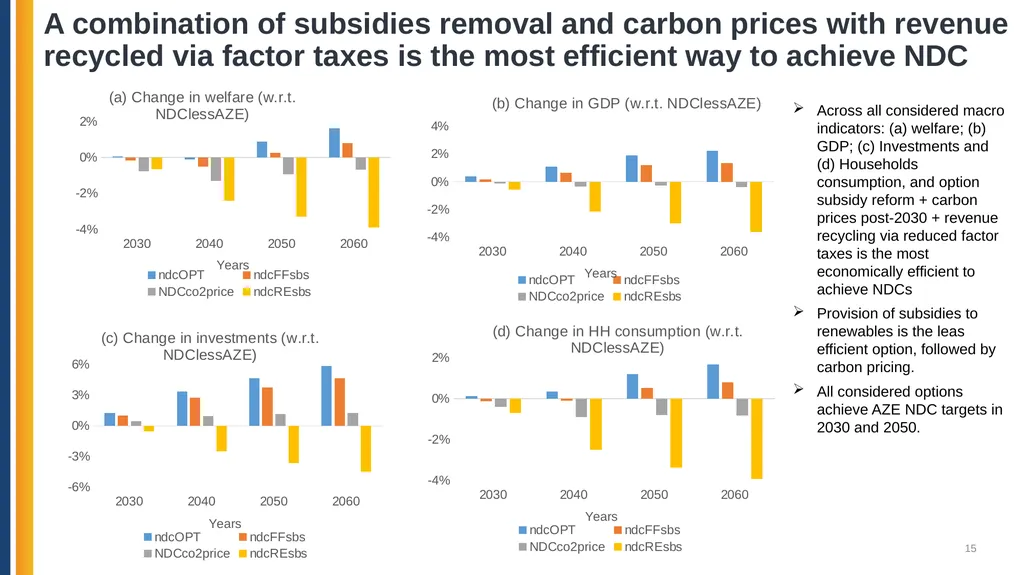
slide15. A combination of subsidies removal and carbon prices with revenue recycled via factor taxes is the most efficient way to achieve NDC 15 Across all considered macro indicators: (a) welfare; (b) GDP; (c) Investments and (d) Households consumption, and option subsidy reform + carbon prices post-2030 + revenue recycling via reduced factor taxes is the most economically efficient to achieve NDCs
Provision of subsidies to renewables is the leas efficient option, followed by carbon pricing.
All considered options achieve AZE NDC targets in 2030 and 2050.<br>
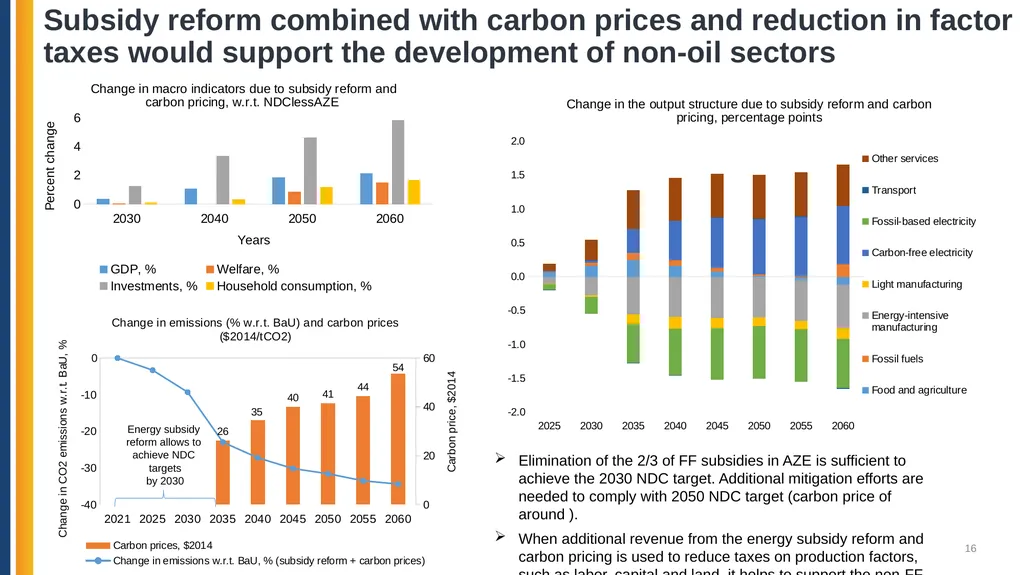
slide16. Subsidy reform combined with carbon prices and reduction in factor taxes would support the development of non-oil sectors 16 Elimination of the 2/3 of FF subsidies in AZE is sufficient to achieve the 2030 NDC target. Additional mitigation efforts are needed to comply with 2050 NDC target (carbon price of around ).
When additional revenue from the energy subsidy reform and carbon pricing is used to reduce taxes on production factors, such as labor, capital and land, it helps to support the non-FF sectors.<br>
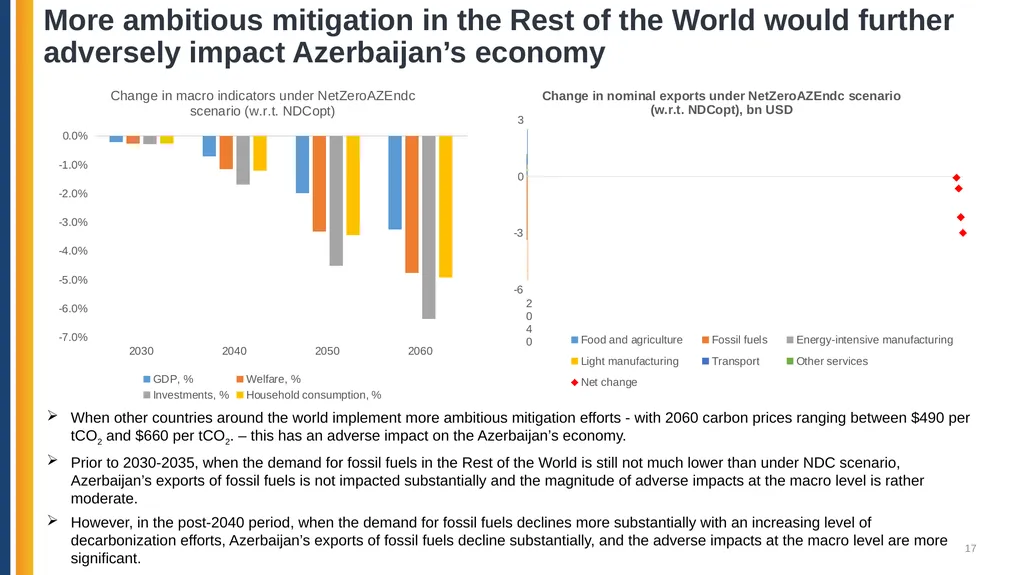
slide17. More ambitious mitigation in the Rest of the World would further adversely impact Azerbaijan’s economy 17 When other countries around the world implement more ambitious mitigation efforts - with 2060 carbon prices ranging between $490 per tCO2 and $660 per tCO2. – this has an adverse impact on the Azerbaijan’s economy.
Prior to 2030-2035, when the demand for fossil fuels in the Rest of the World is still not much lower than under NDC scenario, Azerbaijan’s exports of fossil fuels is not impacted substantially and the magnitude of adverse impacts at the macro level is rather moderate.
However, in the post-2040 period, when the demand for fossil fuels declines more substantially with an increasing level of decarbonization efforts, Azerbaijan’s exports of fossil fuels decline substantially, and the adverse impacts at the macro level are more significant.<br>
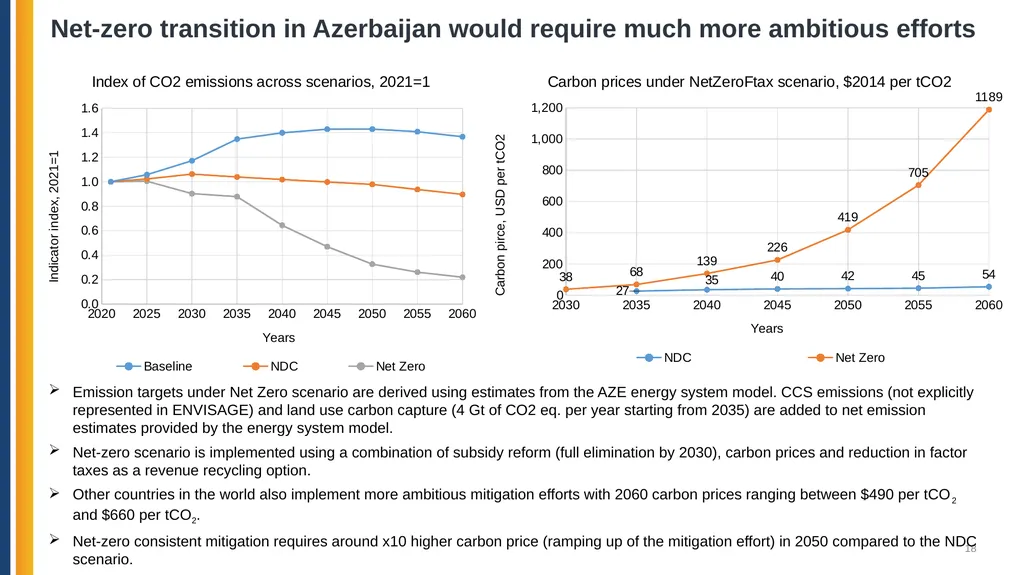
slide18. Net-zero transition in Azerbaijan would require much more ambitious efforts 18 Emission targets under Net Zero scenario are derived using estimates from the AZE energy system model. CCS emissions (not explicitly represented in ENVISAGE) and land use carbon capture (4 Gt of CO2 eq. per year starting from 2035) are added to net emission estimates provided by the energy system model.
Net-zero scenario is implemented using a combination of subsidy reform (full elimination by 2030), carbon prices and reduction in factor taxes as a revenue recycling option.
Other countries in the world also implement more ambitious mitigation efforts with 2060 carbon prices ranging between $490 per tCO2 and $660 per tCO2.
Net-zero consistent mitigation requires around x10 higher carbon price (ramping up of the mitigation effort) in 2050 compared to the NDC scenario.<br>
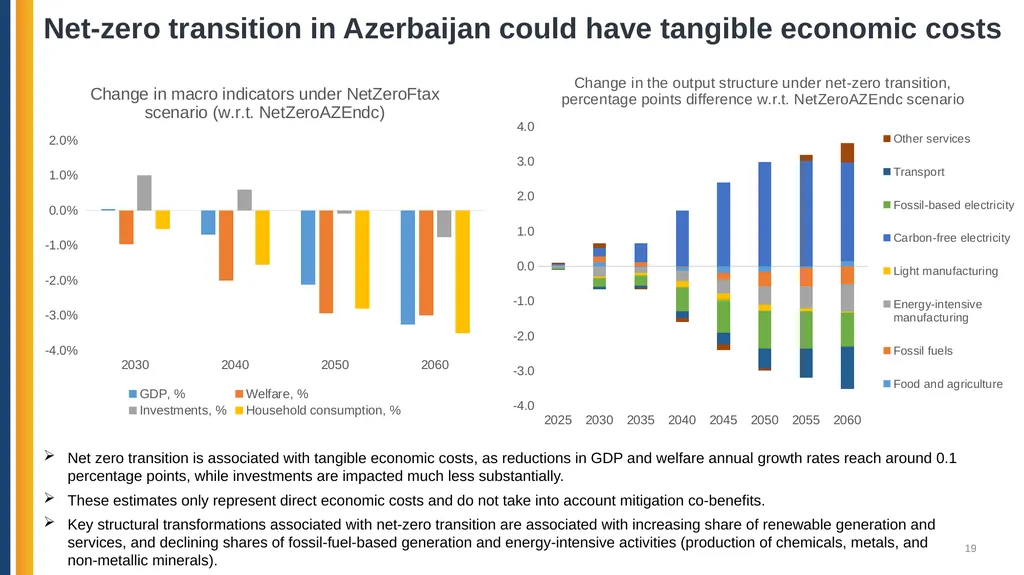
slide19. Net-zero transition in Azerbaijan could have tangible economic costs 19 Net zero transition is associated with tangible economic costs, as reductions in GDP and welfare annual growth rates reach around 0.1 percentage points, while investments are impacted much less substantially.
These estimates only represent direct economic costs and do not take into account mitigation co-benefits.
Key structural transformations associated with net-zero transition are associated with increasing share of renewable generation and services, and declining shares of fossil-fuel-based generation and energy-intensive activities (production of chemicals, metals, and non-metallic minerals).<br>
slide20. Recycling revenue via reduced factor taxes within Net Zero scenario is more efficient than direct payments to households 20 Like in the case of mitigation under NDC scenario the results suggest that if the collected carbon revenue is recycled via reduce factor (capital, labor, land) taxes, this option is more efficient compared to the direct payments to households.
The benefit of such revenue recycling option is observed across all key macro indicators: (a) Welfare; (b) GDP; (c) Investments; (d) Households’ consumption.
An average reduction in costs compared to the ‘Dtax’ option ranges from 17% (welfare and consumption) to over 40% (investments) across indicators.<br>
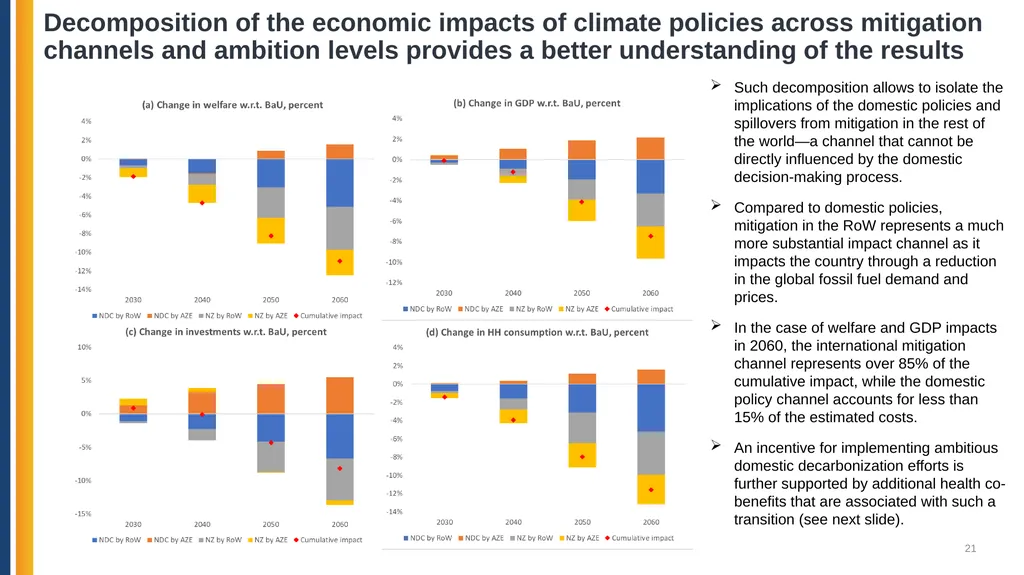
slide21. Decomposition of the economic impacts of climate policies across mitigation channels and ambition levels provides a better understanding of the results 21 Such decomposition allows to isolate the implications of the domestic policies and spillovers from mitigation in the rest of the world—a channel that cannot be directly influenced by the domestic decision-making process.
Compared to domestic policies, mitigation in the RoW represents a much more substantial impact channel as it impacts the country through a reduction in the global fossil fuel demand and prices.
In the case of welfare and GDP impacts in 2060, the international mitigation channel represents over 85% of the cumulative impact, while the domestic policy channel accounts for less than 15% of the estimated costs.
An incentive for implementing ambitious domestic decarbonization efforts is further supported by additional health co-benefits that are associated with such a transition (see next slide).<br>
slide22. Accounting for health-related co-benefits due to changes in air pollution can substantially reduce the overall costs of mitigation 22 Apart from reducing greenhouse gas emissions, domestic mitigation policies also lead to changes in air pollution levels.
Air pollution changes under the two mitigation scenarios (NDC and net-zero) + a hypothetical case where within a net-zero climate policy scenario households reduce the use of wood biomass for domestic heating and cooking—by 50% and 60% respectively in 2030 and 2060 relative to the BaU.
Changes in air pollution levels estimated by ENVISAGE model are fed into the BenMAP-CE global burden of disease (GBD) rollback analysis tool to estimate impacts on mortality.
We further value the risk to life following a conventional approach that estimates the willingness-to-pay (WTP) to secure the health risk reduction associated with a specific policy or measure (e.g. OECD, 2018).<br>
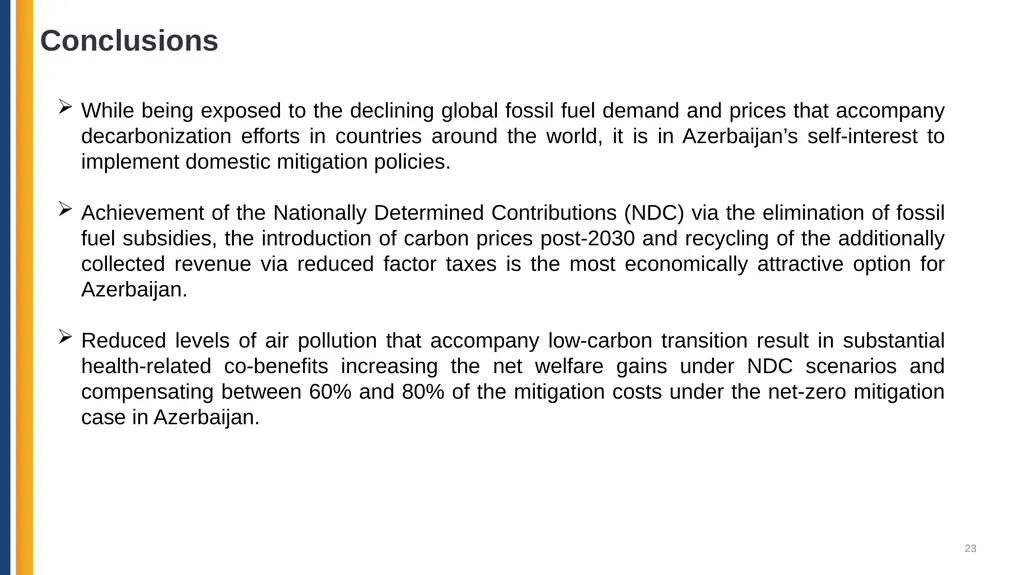
slide23. Conclusions 23 While being exposed to the declining global fossil fuel demand and prices that accompany decarbonization efforts in countries around the world, it is in Azerbaijan’s self-interest to implement domestic mitigation policies.
Achievement of the Nationally Determined Contributions (NDC) via the elimination of fossil fuel subsidies, the introduction of carbon prices post-2030 and recycling of the additionally collected revenue via reduced factor taxes is the most economically attractive option for Azerbaijan.
Reduced levels of air pollution that accompany low-carbon transition result in substantial health-related co-benefits increasing the net welfare gains under NDC scenarios and compensating between 60% and 80% of the mitigation costs under the net-zero mitigation case in Azerbaijan.<br>
slide24. Thank you! mchepeli@purdue.edu<br>
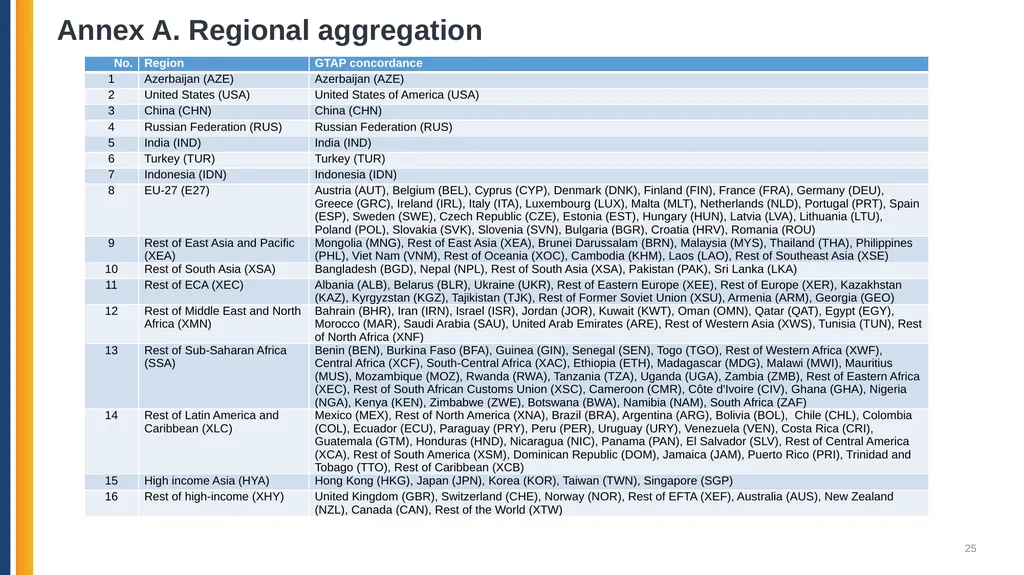
slide25. Annex A. Regional aggregation 25<br>
slide26. Annex B. Sectoral aggregation 26<br>
slide27. Annex C. Carbon prices under the NDClessAZE scenario $2014/tCO2 27<br>
and Dominique van der Mensbrugghe*
*Center for Global Trade Analysis, Purdue University
** The World Bank
30th International Input-Output Association Conference
July 1-5, 2024
Santiago, Chile<br>
slide2. Azerbaijan hydrocarbon-fueled economy has contributed to rapid growth during early 2000s, but has shown its limits
GDP growth has substantially slowed down during the last decade, while country’s diversification efforts have not been successful.
Fossil fuel subsidies remain large and are distorting the economy.
Mitigation efforts around the world can substantially reduce Azerbaijan’s resource rents, through declining global fossil fuel demand and prices
Carbon border adjustment measures can further adversely impact country’s economy: lack of decarbonization efforts is not an option
What policy solutions can country implement to reduce emissions, increase competitiveness and boost the economy?
A set of policies and measures including FF subsidy reform, carbon pricing and alternative revenue recycling options are considered to answer this question. Introduction 2<br>
slide3. Methodological framework: GTAP Data Base 3 GTAP is a global data base describing bilateral trade patterns, production, consumption and intermediate use of commodities and services.
Global economy in the database is divided into 65 sectors (figure below) and 141 regions (with 121 individual countries, including Azerbaijan).
A special version of the GTAP database used in this study (GTAP-Power) further splits electricity and heat production into separate generation technologies (coal, gas, wind, solar, hydro, etc.)<br>
slide4. Methodological framework: ENVISAGE CGE model 4 Global computable general equilibrium (CGE) model
Recursive-dynamic (2014-2060).
Nested energy demand
Alternative generation technologies, such as coal, gas, wind, solar, hydro and other renewables (GTAP-Power database).
Preference shifts/technological changes
Decreasing cost of renewables; increasing preferences toward renewable energy; increasing electrification rates; energy efficiency improvements.
Model aggregation: 16 regions (Annex A) and 37 activities (Annex B). The main strength of the CGE modelling framework, like ENVISAGE, is the consistent representation of the inter-dependencies between different sectors, agents and markets in the economy.
At the same time, deeper understanding of specific sectors might require application of specialized models (e.g. energy system models for energy sector). Circular flows in a CGE model<br>
slide5. Scenario framework 5 "No policies" (BaU): assumes no mitigation around the world except EU and selected high-income countries, where carbon prices are already in place.
"NDClessAZE": assumes that all countries are reaching NDC targets in 2030 and extending mitigation efforts post-2030 in line with limiting global warming <2C. No mitigation policies are assumed in AZE.
“ndcCBAM: all countries except AZE implement NDC-consistent mitigation policies and HICs (EU, US, and other OECD countries) implement carbon border adjustment measures.
“ndcCO2price": AZE achieves its 2030 and 2050 NDC mitigation targets using carbon prices. Carbon revenue is recycled to households.
“ndcREsbs": AZE achieves NDC by providing subsidies to renewable generation sources. Revenue is recycled to households.
“ndcFFsbs": AZE achieves NDC by a combination of FF subsidy removal and carbon pricing. Revenue is recycled to households.
“ndcOPT": AZE achieves NDC by a combination of FF subsidy removal and carbon pricing. Revenue is recycled via a reduction in factor (capital, labor, land) taxes.
“ndcOPTAZE": AZE achieves NDC by a combination of FF subsidy removal and carbon pricing. Other countries do not implement any mitigation efforts (represents a case of global higher energy demand and prices).
“NetZeroAZEndc”: “ndcOPT” (NDC-consistent) scenario for Azerbaijan + more ambitious mitigation by the Rest of the World with carbon prices reaching $490-$660 per tCO2 across countries/regions.
“NetZeroDtax”: AZE achieves a more ambitious mitigation target consistent with net-zero emissions in 2060. A combination of FF subsidy removal with carbon prices is used. Other countries also implement mitigation efforts from the “NetZeroAZEndc” scenario. Revenue is recycled to households.
“NetZeroFtax”: “NetZeroDtax” scenario, but the revenue (in all countries/regions) is recycled via factor taxes (instead of direct taxes).
“NetZeroFtaxAZE”: “NetZeroFtax” scenario, where only Azerbaijan implements mitigation efforts. Other countries do not implement any mitigation efforts (represents a case of global higher energy demand and prices). In addition to the 12 mitigation scenarios, two climate impact scenarios are considered accounting for impacts of labor heat stress, agricultural yields, livestock heat stress and capital damages due to flooding:
A case of hot and dry conditions;
A case of wet and ward climate conditions;<br>
slide6. No policy (BaU) scenario sees a reduction in the role of fossil fuels and increasing role of services 6 Share of fossil fuels in total output drops from around 27% in 2021 to 17% in 2060.
Light manufacturing increases its share by almost 5 times, reaching 2.5% of total output in 2060.
Share of services reaches 56% in 2060 – an increase of 11 percentage points w.r.t. 2021.<br>
slide7. No policy (BaU) scenario results in a relative decoupling, but additional policy efforts are needed to reach NDC targets 7 Between 2010 and 2019 carbon intensity of Azerbaijan’s GDP increased by 29%.
No policy (BaU) scenario leads to a 37% reduction in GDP’s carbon intensity by 2060 (w.r.t. 2021).
This reduction in GDP emission intensity is driven by structural changes in the economy, ongoing energy efficiency improvements and changes in the generation mix.
The “No policy” scenario results in a relative decoupling between GDP and emissions but is not sufficient to reach the NDC targets in 2030 and 2050.<br>
slide8. Climate change impacts are captured via multiple channels 8 Four climate change impact channels are considered in the analysis:
Inland flooding (economy-wide capital damage)
Labor heat stress (reduced labor productivity)
Livestock heat stress (reduced livestock productivity)
Crop yield impacts due to erosion and heat stress
Two weather conditions are considered in the analysis: hot and dry & wet and warm
Adverse climate impacts through these channels increase over time
Climate damages across the four channels are implemented simultaneously<br>
slide9. Climate change impacts are more substantial under hot and dry conditions 9 Climate change adversely affects economic growth.
Negative impacts are expected to increase in magnitude over time with 2060 damages being on average 3 times higher than the impacts in 2030.
Under wet and warm conditions in 2060 GDP declines by around 1% w.r.t. BaU, while welfare drops by 1.4%.
More substantial adverse impacts are observed under the hot and dry conditions, as GDP declines by 1.8% w.r.t. BaU in 2060 and welfare by 2.6%.
Relatively low magnitude of impacts on investments under both climate scenarios is driven by the fact that the fossil fuel mining sector is not adversely impacted by the climate mitigation and sees a moderate increase in output and investments (as shown on the next slide)<br>
slide10. At the sectoral level livestock sector is expected to be impacted the most substantially due to climate change 10 Livestock sector sees the most substantial decline in output due to climate change – in a range of 6% and 12% across climate scenarios.
Livestock is impacted both directly (heat stress) and indirectly (higher cost of feed due to lower crop yields).
A substitution toward other livestock products is observed (as the latter experience less substantial climate impacts).
Food processing sector also experiences substantial reductions in output (between 3% and 6%).
Fossil fuel mining sector is among the sectors with the least substantial direct and indirect impacts and sees a moderate expansion in output (between 0.8% and 1.4%). Most of this output is exported, as overall domestic demand for fossil fuels declines.<br>
slide11. Mitigation efforts around the world can substantially reduce Azerbaijan’s resource rents 11 Global mitigation efforts (implemented via economywide carbon pricing by countries – Appendix C) lead to the reduction in fossil fuel demand and prices. This adversely impacts Azerbaijan’s economy, as the exports of fossil fuels decline.
Production resources (labor, capital) freed out in the fossil fuel extraction activities are reallocated to cleaner sectors (services and manufactured goods), which could see a moderate expansion in output and exports. The latter only partly compensates for a reduction in the FF export revenues.<br>
slide12. Most of the reductions in value added under mitigation in the Rest of the World are coming from fossil fuel sectors in Azerbaijan 12 When the Rest of the World implements mitigation policies, most of the reduction in economic activity (sectoral value added) in Azerbaijan is associated with fossil fuel mining sectors.
Supporting services sectors, such as trade, are also impacted substantially.
Construction sector sees a contraction in value added due to reduced volumes of investments in the economy (see previous slide).
Value added of selected sectors, such as light manufacturing and transportation (largely air) see a moderate expansion.<br>
slide13. Mitigation in the Rest of the World with no climate policies in Azerbaijan also reduces budget revenue 13 When the Rest of the World implements mitigation policies, Azerbaijan sees a decline in tax revenue.
Most of the reductions in tax revenue are coming from factor taxes (labor and capital) and direct taxes (income taxes, property taxes, etc.).
A moderate increase in the revenue from indirect taxes is driven by the reduction in the energy subsidies due to lower energy prices and demand.<br>
slide14. Carbon border adjustment measures can further adversely impact country’s economy (impact relative to NDClessAZE scenario) 14 Strating from 2026 the CBAM is imposed by the EU on Scope 1 emissions covering chemicals, metals and electricity sectors. Between 2031 and 2035 the CBAM is expanded to Scope 2, additionally covers petroleum products and non-metallic minerals, and is imposed not only by the EU, but also US, Japan, Australia, Canada, Korea, and other HICs. Starting from 2036 the CBAM covers all three emission scopes (all other features are the same as in the 2031-2035 period). All middle- and lower-income countries (including China) face the CBAM, as their level of mitigation ambition and carbon prices are assumed to be lower than in the high-income countries.
CBAM puts additional pressure on Azerbaijan's economy by reducing global fossil fuel demand and prices, as well as reducing demand on Azerbaijan's exports of energy-intensive commodities.
A more substantial impact on investments (compared to other macro indicators) is driven by the depreciation of the real exchange rates, which leads to a reduction in investment activity. A similar distribution of the CBAM impacts is observed in other energy-exporting regions, such as MENA and Russia.<br>
slide15. A combination of subsidies removal and carbon prices with revenue recycled via factor taxes is the most efficient way to achieve NDC 15 Across all considered macro indicators: (a) welfare; (b) GDP; (c) Investments and (d) Households consumption, and option subsidy reform + carbon prices post-2030 + revenue recycling via reduced factor taxes is the most economically efficient to achieve NDCs
Provision of subsidies to renewables is the leas efficient option, followed by carbon pricing.
All considered options achieve AZE NDC targets in 2030 and 2050.<br>
slide16. Subsidy reform combined with carbon prices and reduction in factor taxes would support the development of non-oil sectors 16 Elimination of the 2/3 of FF subsidies in AZE is sufficient to achieve the 2030 NDC target. Additional mitigation efforts are needed to comply with 2050 NDC target (carbon price of around ).
When additional revenue from the energy subsidy reform and carbon pricing is used to reduce taxes on production factors, such as labor, capital and land, it helps to support the non-FF sectors.<br>
slide17. More ambitious mitigation in the Rest of the World would further adversely impact Azerbaijan’s economy 17 When other countries around the world implement more ambitious mitigation efforts - with 2060 carbon prices ranging between $490 per tCO2 and $660 per tCO2. – this has an adverse impact on the Azerbaijan’s economy.
Prior to 2030-2035, when the demand for fossil fuels in the Rest of the World is still not much lower than under NDC scenario, Azerbaijan’s exports of fossil fuels is not impacted substantially and the magnitude of adverse impacts at the macro level is rather moderate.
However, in the post-2040 period, when the demand for fossil fuels declines more substantially with an increasing level of decarbonization efforts, Azerbaijan’s exports of fossil fuels decline substantially, and the adverse impacts at the macro level are more significant.<br>
slide18. Net-zero transition in Azerbaijan would require much more ambitious efforts 18 Emission targets under Net Zero scenario are derived using estimates from the AZE energy system model. CCS emissions (not explicitly represented in ENVISAGE) and land use carbon capture (4 Gt of CO2 eq. per year starting from 2035) are added to net emission estimates provided by the energy system model.
Net-zero scenario is implemented using a combination of subsidy reform (full elimination by 2030), carbon prices and reduction in factor taxes as a revenue recycling option.
Other countries in the world also implement more ambitious mitigation efforts with 2060 carbon prices ranging between $490 per tCO2 and $660 per tCO2.
Net-zero consistent mitigation requires around x10 higher carbon price (ramping up of the mitigation effort) in 2050 compared to the NDC scenario.<br>
slide19. Net-zero transition in Azerbaijan could have tangible economic costs 19 Net zero transition is associated with tangible economic costs, as reductions in GDP and welfare annual growth rates reach around 0.1 percentage points, while investments are impacted much less substantially.
These estimates only represent direct economic costs and do not take into account mitigation co-benefits.
Key structural transformations associated with net-zero transition are associated with increasing share of renewable generation and services, and declining shares of fossil-fuel-based generation and energy-intensive activities (production of chemicals, metals, and non-metallic minerals).<br>
slide20. Recycling revenue via reduced factor taxes within Net Zero scenario is more efficient than direct payments to households 20 Like in the case of mitigation under NDC scenario the results suggest that if the collected carbon revenue is recycled via reduce factor (capital, labor, land) taxes, this option is more efficient compared to the direct payments to households.
The benefit of such revenue recycling option is observed across all key macro indicators: (a) Welfare; (b) GDP; (c) Investments; (d) Households’ consumption.
An average reduction in costs compared to the ‘Dtax’ option ranges from 17% (welfare and consumption) to over 40% (investments) across indicators.<br>
slide21. Decomposition of the economic impacts of climate policies across mitigation channels and ambition levels provides a better understanding of the results 21 Such decomposition allows to isolate the implications of the domestic policies and spillovers from mitigation in the rest of the world—a channel that cannot be directly influenced by the domestic decision-making process.
Compared to domestic policies, mitigation in the RoW represents a much more substantial impact channel as it impacts the country through a reduction in the global fossil fuel demand and prices.
In the case of welfare and GDP impacts in 2060, the international mitigation channel represents over 85% of the cumulative impact, while the domestic policy channel accounts for less than 15% of the estimated costs.
An incentive for implementing ambitious domestic decarbonization efforts is further supported by additional health co-benefits that are associated with such a transition (see next slide).<br>
slide22. Accounting for health-related co-benefits due to changes in air pollution can substantially reduce the overall costs of mitigation 22 Apart from reducing greenhouse gas emissions, domestic mitigation policies also lead to changes in air pollution levels.
Air pollution changes under the two mitigation scenarios (NDC and net-zero) + a hypothetical case where within a net-zero climate policy scenario households reduce the use of wood biomass for domestic heating and cooking—by 50% and 60% respectively in 2030 and 2060 relative to the BaU.
Changes in air pollution levels estimated by ENVISAGE model are fed into the BenMAP-CE global burden of disease (GBD) rollback analysis tool to estimate impacts on mortality.
We further value the risk to life following a conventional approach that estimates the willingness-to-pay (WTP) to secure the health risk reduction associated with a specific policy or measure (e.g. OECD, 2018).<br>
slide23. Conclusions 23 While being exposed to the declining global fossil fuel demand and prices that accompany decarbonization efforts in countries around the world, it is in Azerbaijan’s self-interest to implement domestic mitigation policies.
Achievement of the Nationally Determined Contributions (NDC) via the elimination of fossil fuel subsidies, the introduction of carbon prices post-2030 and recycling of the additionally collected revenue via reduced factor taxes is the most economically attractive option for Azerbaijan.
Reduced levels of air pollution that accompany low-carbon transition result in substantial health-related co-benefits increasing the net welfare gains under NDC scenarios and compensating between 60% and 80% of the mitigation costs under the net-zero mitigation case in Azerbaijan.<br>
slide24. Thank you! mchepeli@purdue.edu<br>
slide25. Annex A. Regional aggregation 25<br>
slide26. Annex B. Sectoral aggregation 26<br>
slide27. Annex C. Carbon prices under the NDClessAZE scenario $2014/tCO2 27<br>