
B7 – Ecology Competition Interspecific – different
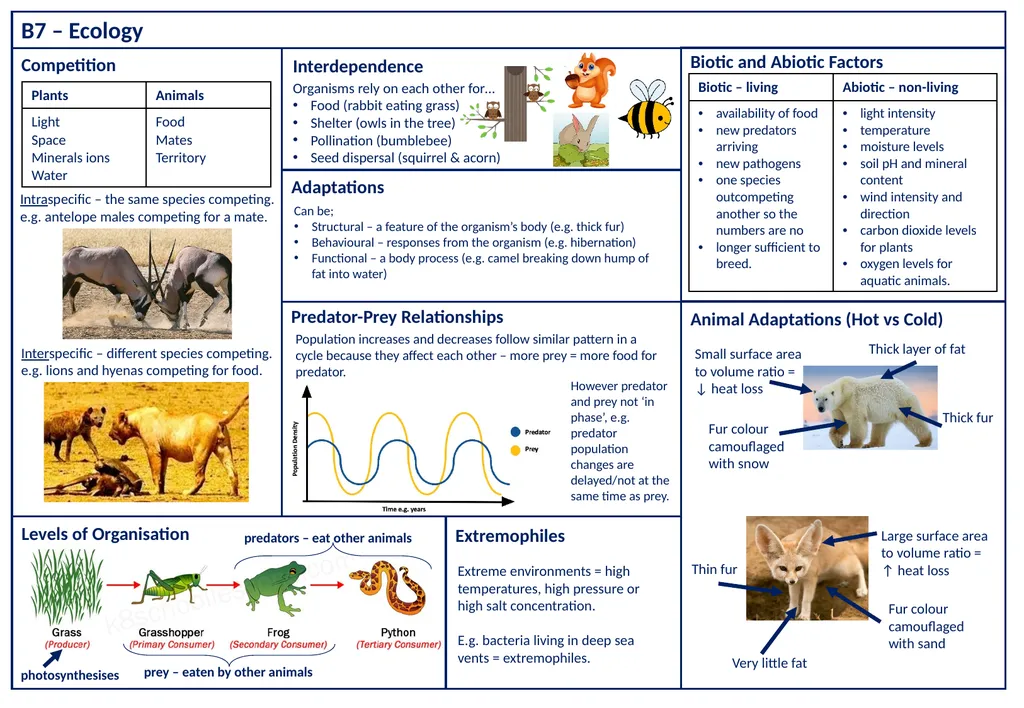
Description: B7 Ecology Competition Interspecific different species competing. e.g. lions and hyenas competing for food. Intraspecific the same species competing. e.g. antelope males competing for a mate. Interdependence Organisms rely on each
Related Topics
Download Presentation
"B7 – Ecology Competition Interspecific – different" is the property of its rightful owner. Permission is granted to download and print the materials on this website for personal, non-commercial use only, and to display it on your personal computer provided you do not modify the materials and that you retain all copyright notices contained in the materials. By downloading content from our website, you accept the terms of this agreement.
Presentation Transcript
slide1. B7 – Ecology Competition Interspecific – different species competing.
e.g. lions and hyenas competing for food. Intraspecific – the same species competing.
e.g. antelope males competing for a mate. Interdependence Organisms rely on each other for…
Food (rabbit eating grass)
Shelter (owls in the tree)
Pollination (bumblebee)
Seed dispersal (squirrel & acorn) Biotic and Abiotic Factors Animal Adaptations (Hot vs Cold) Adaptations Levels of Organisation Thick layer of fat Very little fat Thick fur Small surface area to volume ratio = ↓ heat loss Large surface area to volume ratio = ↑ heat loss Thin fur Can be;
Structural – a feature of the organism’s body (e.g. thick fur)
Behavioural – responses from the organism (e.g. hibernation)
Functional – a body process (e.g. camel breaking down hump of fat into water) photosynthesises predators – eat other animals prey – eaten by other animals Predator-Prey Relationships Population increases and decreases follow similar pattern in a cycle because they affect each other – more prey = more food for predator. However predator and prey not ‘in phase’, e.g. predator population changes are delayed/not at the same time as prey. Extremophiles Fur colour camouflaged with snow Fur colour camouflaged with sand Extreme environments = high temperatures, high pressure or high salt concentration.
E.g. bacteria living in deep sea vents = extremophiles.<br>
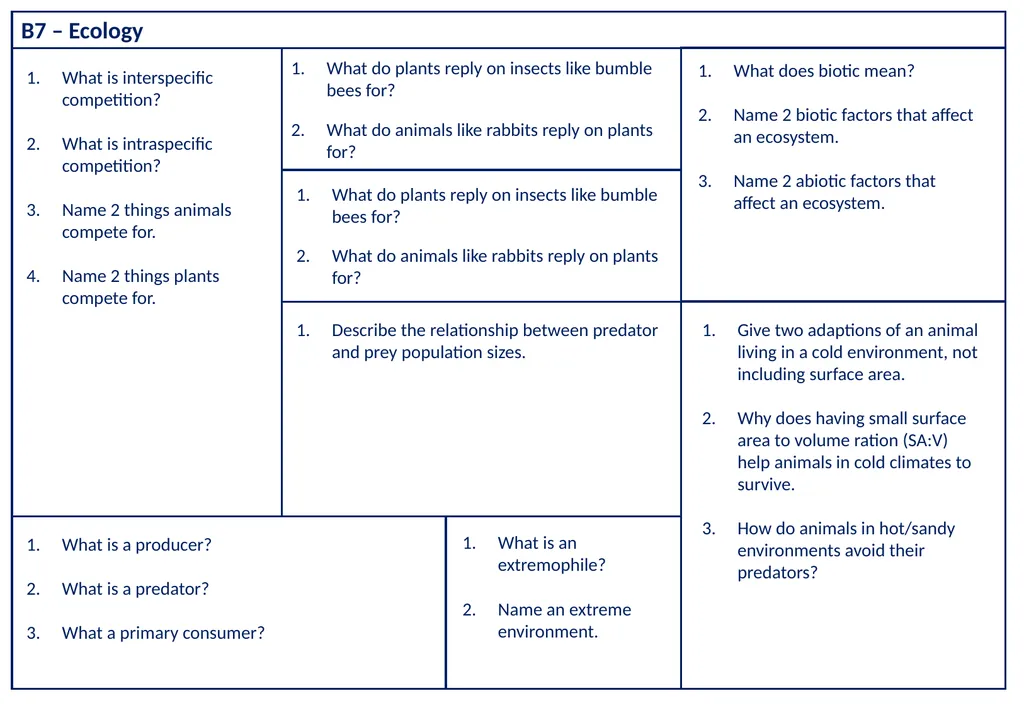
slide2. B7 – Ecology What is interspecific competition?
What is intraspecific competition?
Name 2 things animals compete for.
Name 2 things plants compete for. What do plants reply on insects like bumble bees for?
What do animals like rabbits reply on plants for? What do plants reply on insects like bumble bees for?
What do animals like rabbits reply on plants for? Describe the relationship between predator and prey population sizes. What does biotic mean?
Name 2 biotic factors that affect an ecosystem.
Name 2 abiotic factors that affect an ecosystem. Give two adaptions of an animal living in a cold environment, not including surface area.
Why does having small surface area to volume ration (SA:V) help animals in cold climates to survive.
How do animals in hot/sandy environments avoid their predators? What is an extremophile?
Name an extreme environment. What is a producer?
What is a predator?
What a primary consumer?<br>
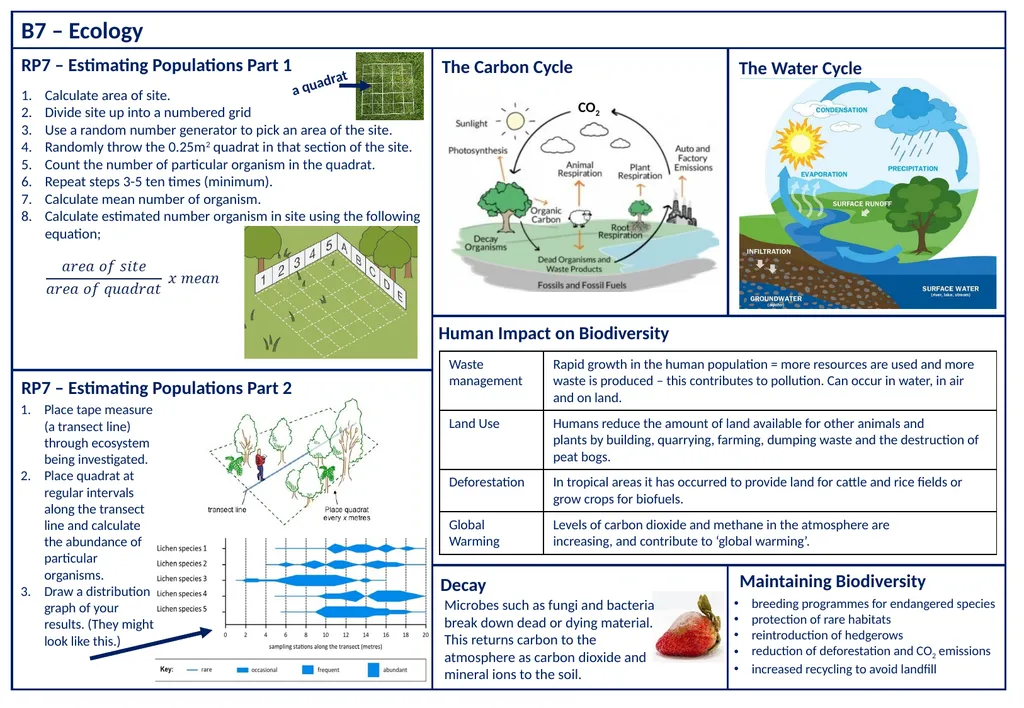
slide3. B7 – Ecology RP7 – Estimating Populations Part 1 RP7 – Estimating Populations Part 2 Calculate area of site.
Divide site up into a numbered grid
Use a random number generator to pick an area of the site.
Randomly throw the 0.25m2 quadrat in that section of the site.
Count the number of particular organism in the quadrat.
Repeat steps 3-5 ten times (minimum).
Calculate mean number of organism.
Calculate estimated number organism in site using the following equation; Place tape measure (a transect line) through ecosystem being investigated.
Place quadrat at regular intervals along the transect line and calculate the abundance of particular organisms.
Draw a distribution graph of your results. (They might look like this.) The Carbon Cycle The Water Cycle Decay Microbes such as fungi and bacteria break down dead or dying material. This returns carbon to the atmosphere as carbon dioxide and mineral ions to the soil. a quadrat Human Impact on Biodiversity breeding programmes for endangered species
protection of rare habitats
reintroduction of hedgerows
reduction of deforestation and CO2 emissions
increased recycling to avoid landfill Maintaining Biodiversity<br>
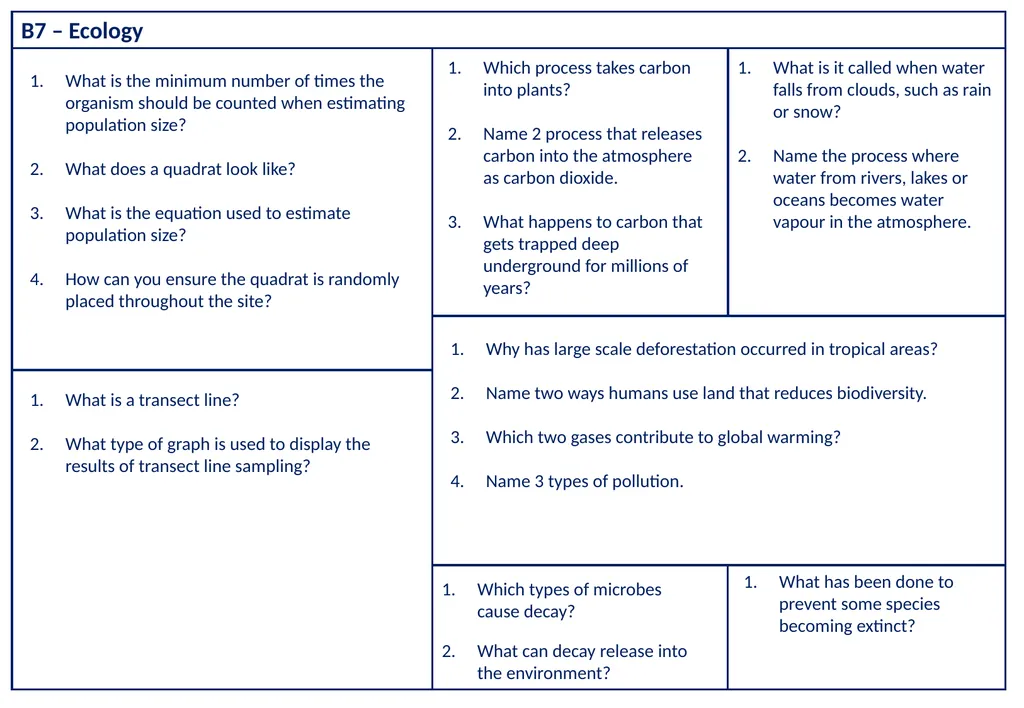
slide4. B7 – Ecology What is the minimum number of times the organism should be counted when estimating population size?
What does a quadrat look like?
What is the equation used to estimate population size?
How can you ensure the quadrat is randomly placed throughout the site? What is a transect line?
What type of graph is used to display the results of transect line sampling? Which process takes carbon into plants?
Name 2 process that releases carbon into the atmosphere as carbon dioxide.
What happens to carbon that gets trapped deep underground for millions of years? What is it called when water falls from clouds, such as rain or snow?
Name the process where water from rivers, lakes or oceans becomes water vapour in the atmosphere. Which types of microbes cause decay?
What can decay release into the environment? What has been done to prevent some species becoming extinct? Why has large scale deforestation occurred in tropical areas?
Name two ways humans use land that reduces biodiversity.
Which two gases contribute to global warming?
Name 3 types of pollution.<br>
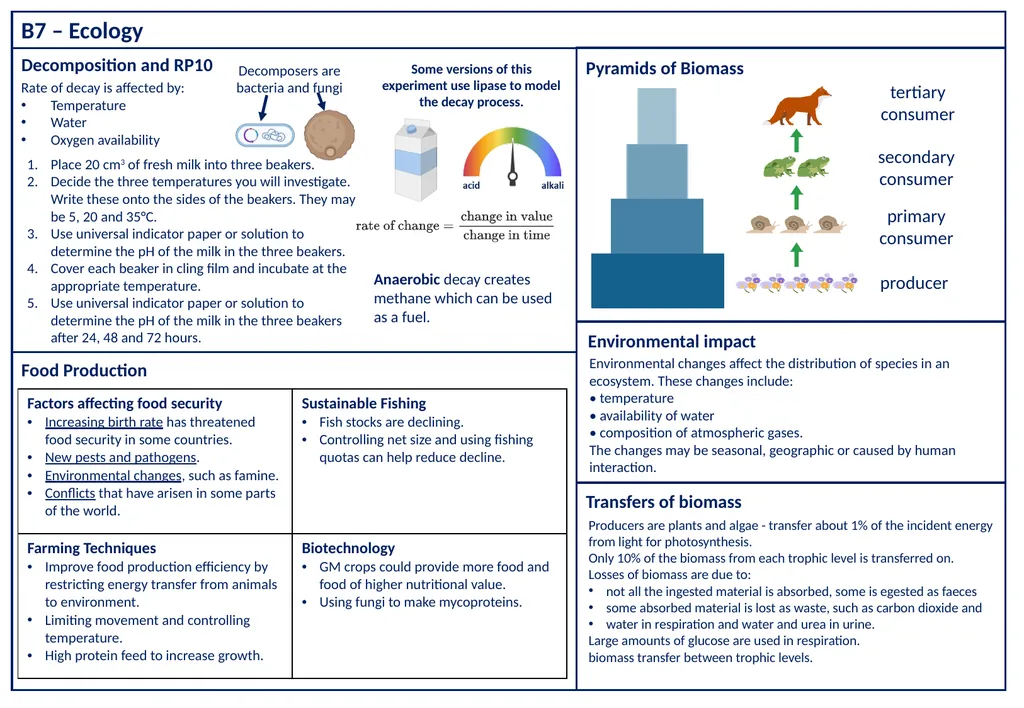
slide5. B7 – Ecology Decomposition and RP10 Environmental impact Pyramids of Biomass Transfers of biomass Food Production Rate of decay is affected by:
Temperature
Water
Oxygen availability Place 20 cm3 of fresh milk into three beakers.
Decide the three temperatures you will investigate. Write these onto the sides of the beakers. They may be 5, 20 and 35°C.
Use universal indicator paper or solution to determine the pH of the milk in the three beakers.
Cover each beaker in cling film and incubate at the appropriate temperature.
Use universal indicator paper or solution to determine the pH of the milk in the three beakers after 24, 48 and 72 hours. Some versions of this experiment use lipase to model the decay process. Anaerobic decay creates methane which can be used as a fuel. Environmental changes affect the distribution of species in an
ecosystem. These changes include:
• temperature
• availability of water
• composition of atmospheric gases.
The changes may be seasonal, geographic or caused by human
interaction. Producers are plants and algae - transfer about 1% of the incident energy from light for photosynthesis.
Only 10% of the biomass from each trophic level is transferred on.
Losses of biomass are due to:
not all the ingested material is absorbed, some is egested as faeces
some absorbed material is lost as waste, such as carbon dioxide and
water in respiration and water and urea in urine.
Large amounts of glucose are used in respiration.
biomass transfer between trophic levels. producer primary consumer secondary consumer tertiary consumer Decomposers are bacteria and fungi<br>
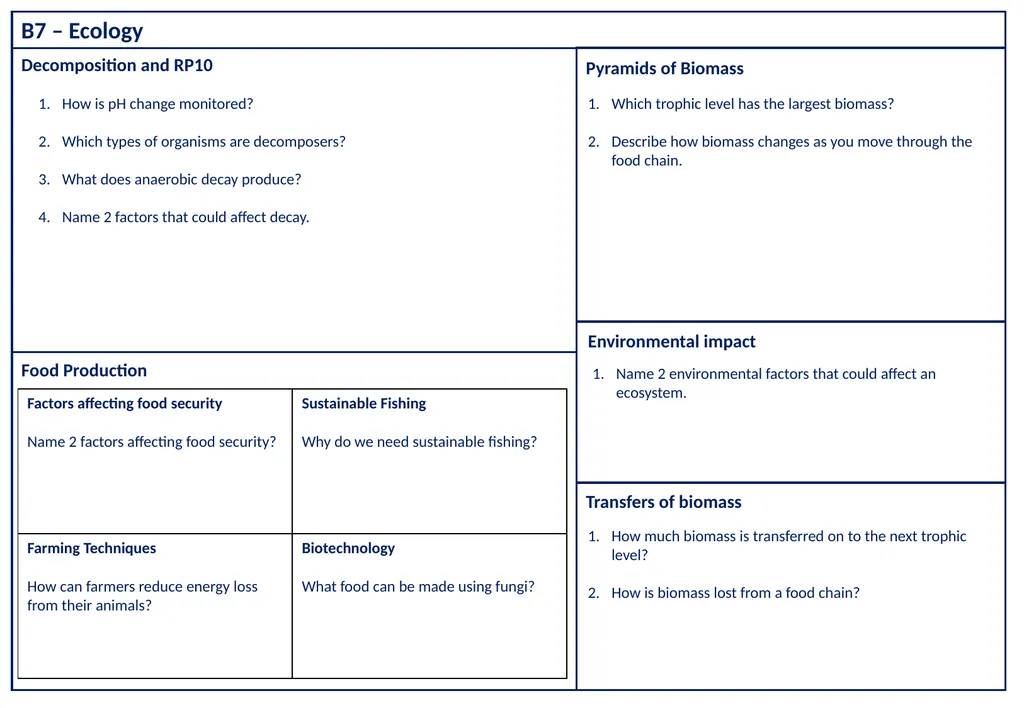
slide6. B7 – Ecology Decomposition and RP10 Environmental impact Pyramids of Biomass Transfers of biomass Food Production How is pH change monitored?
Which types of organisms are decomposers?
What does anaerobic decay produce?
Name 2 factors that could affect decay. Which trophic level has the largest biomass?
Describe how biomass changes as you move through the food chain. Name 2 environmental factors that could affect an ecosystem. How much biomass is transferred on to the next trophic level?
How is biomass lost from a food chain?<br>
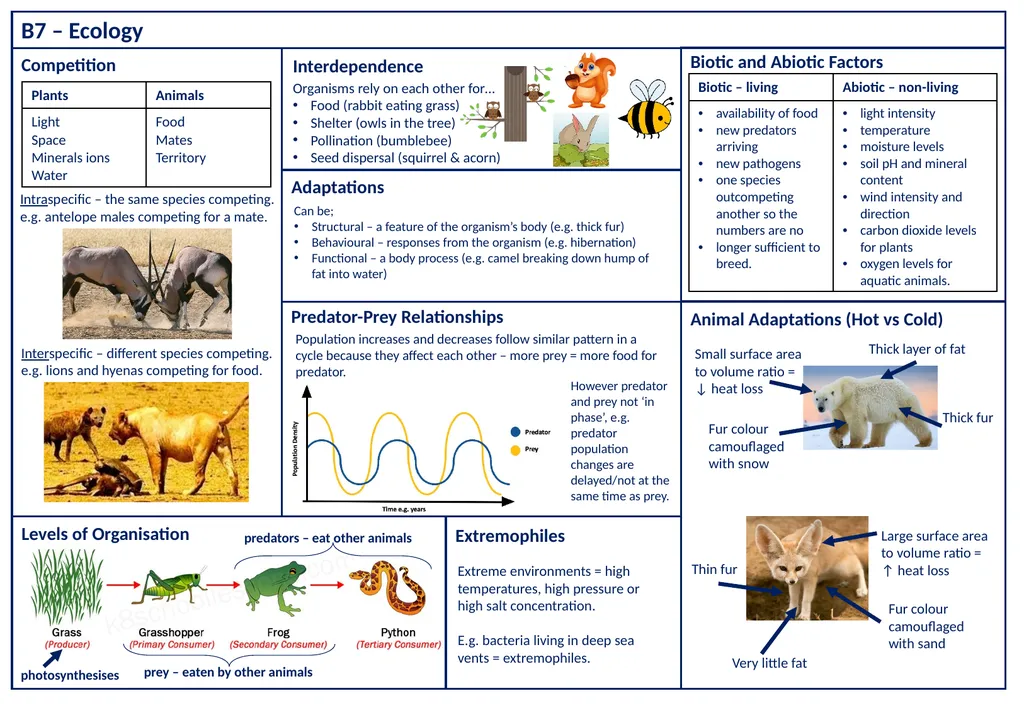
e.g. lions and hyenas competing for food. Intraspecific – the same species competing.
e.g. antelope males competing for a mate. Interdependence Organisms rely on each other for…
Food (rabbit eating grass)
Shelter (owls in the tree)
Pollination (bumblebee)
Seed dispersal (squirrel & acorn) Biotic and Abiotic Factors Animal Adaptations (Hot vs Cold) Adaptations Levels of Organisation Thick layer of fat Very little fat Thick fur Small surface area to volume ratio = ↓ heat loss Large surface area to volume ratio = ↑ heat loss Thin fur Can be;
Structural – a feature of the organism’s body (e.g. thick fur)
Behavioural – responses from the organism (e.g. hibernation)
Functional – a body process (e.g. camel breaking down hump of fat into water) photosynthesises predators – eat other animals prey – eaten by other animals Predator-Prey Relationships Population increases and decreases follow similar pattern in a cycle because they affect each other – more prey = more food for predator. However predator and prey not ‘in phase’, e.g. predator population changes are delayed/not at the same time as prey. Extremophiles Fur colour camouflaged with snow Fur colour camouflaged with sand Extreme environments = high temperatures, high pressure or high salt concentration.
E.g. bacteria living in deep sea vents = extremophiles.<br>
slide2. B7 – Ecology What is interspecific competition?
What is intraspecific competition?
Name 2 things animals compete for.
Name 2 things plants compete for. What do plants reply on insects like bumble bees for?
What do animals like rabbits reply on plants for? What do plants reply on insects like bumble bees for?
What do animals like rabbits reply on plants for? Describe the relationship between predator and prey population sizes. What does biotic mean?
Name 2 biotic factors that affect an ecosystem.
Name 2 abiotic factors that affect an ecosystem. Give two adaptions of an animal living in a cold environment, not including surface area.
Why does having small surface area to volume ration (SA:V) help animals in cold climates to survive.
How do animals in hot/sandy environments avoid their predators? What is an extremophile?
Name an extreme environment. What is a producer?
What is a predator?
What a primary consumer?<br>
slide3. B7 – Ecology RP7 – Estimating Populations Part 1 RP7 – Estimating Populations Part 2 Calculate area of site.
Divide site up into a numbered grid
Use a random number generator to pick an area of the site.
Randomly throw the 0.25m2 quadrat in that section of the site.
Count the number of particular organism in the quadrat.
Repeat steps 3-5 ten times (minimum).
Calculate mean number of organism.
Calculate estimated number organism in site using the following equation; Place tape measure (a transect line) through ecosystem being investigated.
Place quadrat at regular intervals along the transect line and calculate the abundance of particular organisms.
Draw a distribution graph of your results. (They might look like this.) The Carbon Cycle The Water Cycle Decay Microbes such as fungi and bacteria break down dead or dying material. This returns carbon to the atmosphere as carbon dioxide and mineral ions to the soil. a quadrat Human Impact on Biodiversity breeding programmes for endangered species
protection of rare habitats
reintroduction of hedgerows
reduction of deforestation and CO2 emissions
increased recycling to avoid landfill Maintaining Biodiversity<br>
slide4. B7 – Ecology What is the minimum number of times the organism should be counted when estimating population size?
What does a quadrat look like?
What is the equation used to estimate population size?
How can you ensure the quadrat is randomly placed throughout the site? What is a transect line?
What type of graph is used to display the results of transect line sampling? Which process takes carbon into plants?
Name 2 process that releases carbon into the atmosphere as carbon dioxide.
What happens to carbon that gets trapped deep underground for millions of years? What is it called when water falls from clouds, such as rain or snow?
Name the process where water from rivers, lakes or oceans becomes water vapour in the atmosphere. Which types of microbes cause decay?
What can decay release into the environment? What has been done to prevent some species becoming extinct? Why has large scale deforestation occurred in tropical areas?
Name two ways humans use land that reduces biodiversity.
Which two gases contribute to global warming?
Name 3 types of pollution.<br>
slide5. B7 – Ecology Decomposition and RP10 Environmental impact Pyramids of Biomass Transfers of biomass Food Production Rate of decay is affected by:
Temperature
Water
Oxygen availability Place 20 cm3 of fresh milk into three beakers.
Decide the three temperatures you will investigate. Write these onto the sides of the beakers. They may be 5, 20 and 35°C.
Use universal indicator paper or solution to determine the pH of the milk in the three beakers.
Cover each beaker in cling film and incubate at the appropriate temperature.
Use universal indicator paper or solution to determine the pH of the milk in the three beakers after 24, 48 and 72 hours. Some versions of this experiment use lipase to model the decay process. Anaerobic decay creates methane which can be used as a fuel. Environmental changes affect the distribution of species in an
ecosystem. These changes include:
• temperature
• availability of water
• composition of atmospheric gases.
The changes may be seasonal, geographic or caused by human
interaction. Producers are plants and algae - transfer about 1% of the incident energy from light for photosynthesis.
Only 10% of the biomass from each trophic level is transferred on.
Losses of biomass are due to:
not all the ingested material is absorbed, some is egested as faeces
some absorbed material is lost as waste, such as carbon dioxide and
water in respiration and water and urea in urine.
Large amounts of glucose are used in respiration.
biomass transfer between trophic levels. producer primary consumer secondary consumer tertiary consumer Decomposers are bacteria and fungi<br>
slide6. B7 – Ecology Decomposition and RP10 Environmental impact Pyramids of Biomass Transfers of biomass Food Production How is pH change monitored?
Which types of organisms are decomposers?
What does anaerobic decay produce?
Name 2 factors that could affect decay. Which trophic level has the largest biomass?
Describe how biomass changes as you move through the food chain. Name 2 environmental factors that could affect an ecosystem. How much biomass is transferred on to the next trophic level?
How is biomass lost from a food chain?<br>