
Biology Concepts & Applications 10 Edition Chapter

Description: Biology Concepts Applications 10 Edition Chapter 40 Population Ecology Copyright 2018 Cengage Learning. All Rights Reserved. May not be copied, scanned, or duplicated, in whole or in part, except for use as permitted in a license
Related Topics
Download Presentation
"Biology Concepts & Applications 10 Edition Chapter" is the property of its rightful owner. Permission is granted to download and print the materials on this website for personal, non-commercial use only, and to display it on your personal computer provided you do not modify the materials and that you retain all copyright notices contained in the materials. By downloading content from our website, you accept the terms of this agreement.
Presentation Transcript
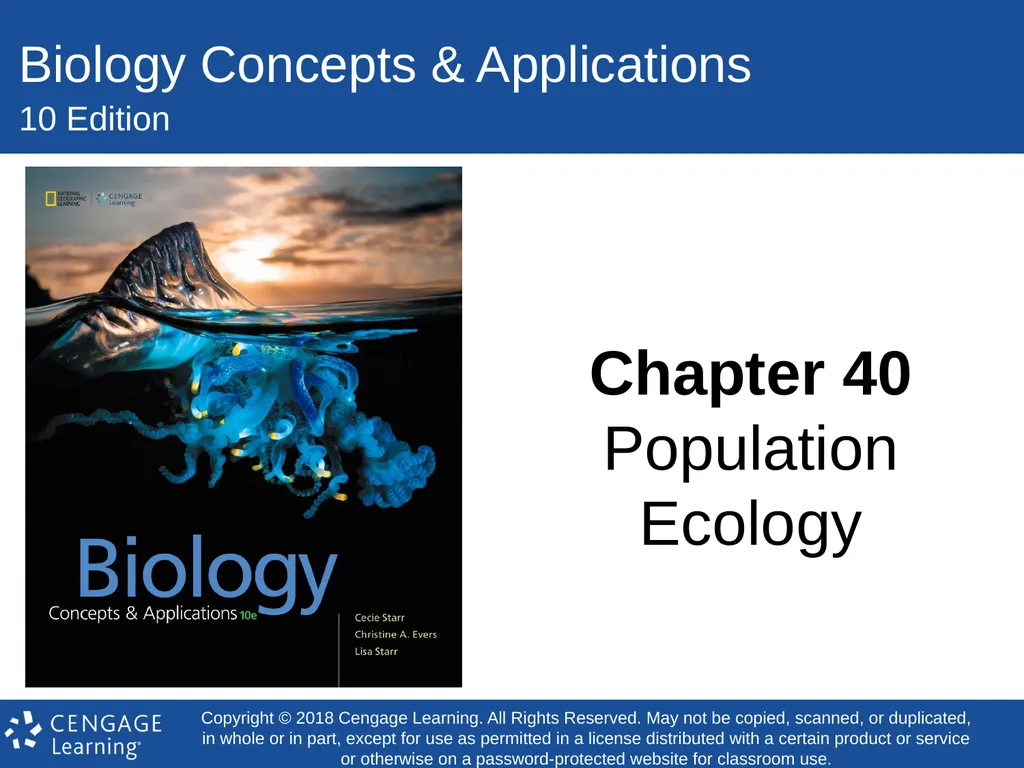
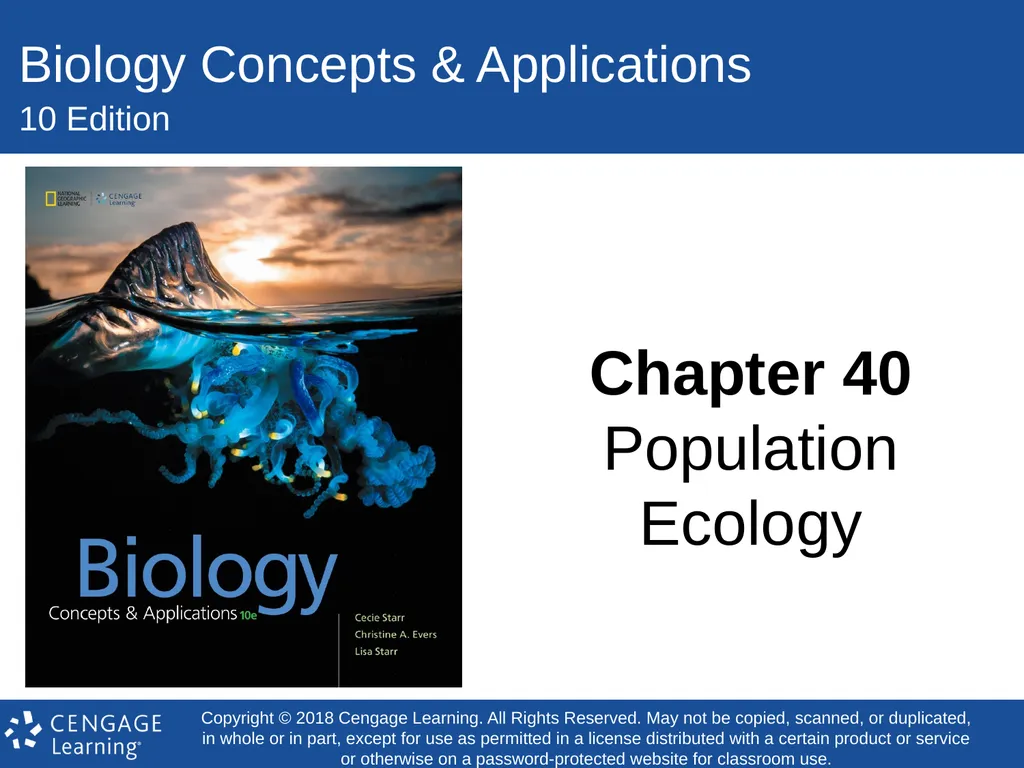
slide1. Biology Concepts & Applications 10 Edition Chapter 40
Population Ecology Copyright © 2018 Cengage Learning. All Rights Reserved. May not be copied, scanned, or duplicated, in whole or in part, except for use as permitted in a license distributed with a certain product or service or otherwise on a password-protected website for classroom use.<br>
slide2. 40.1 Characteristics of a Population Population ecology investigates the factors that influence the size, distribution, and other properties of natural populations
Data can be used to make decisions about managing a species
Studying population ecology often involves the use of demographics
Statistics that describe a population and often change over time<br>
slide3. Size, Density, and Distribution (1 of 3) Population: group of organisms that interbreed with one another more often than they interbreed with other members of their species
Population size: total number of individuals in population
Population density: number of individuals per unit area or volume<br>
slide4. Size, Density, and Distribution (2 of 3) Population distribution: describes how individuals are distributed
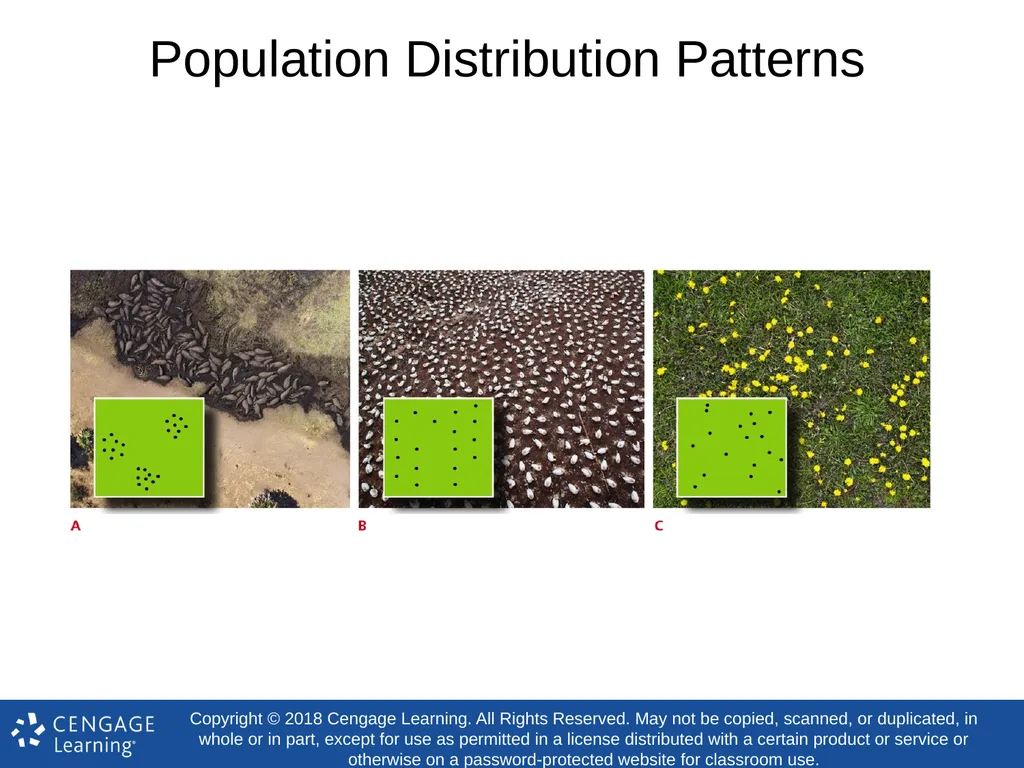
Clumped distribution
Individuals are closer to one another than would be predicted by chance alone
Due to resource distribution, limited dispersal availability, or asexual reproduction<br>
slide5. Size, Density, and Distribution (3 of 3) Near-uniform distribution
Individuals are more evenly spaced than would be expected by chance
Found in breeding colonies and with competition for resources
Random distribution
Individuals are distributed randomly when environmental resources are uniformly distributed
Proximity to others is neither beneficial or detrimental<br>
slide6. Population Distribution Patterns<br>
slide7. Sampling a Population (1 of 2) Biologists frequently use sampling techniques to estimate population size
Plot sampling estimates the total number of individuals in an area based on direct counts in a small portion of that area
Estimates from plot sampling are most accurate when the organisms counted are not very mobile and conditions across the area they occupy are more or less uniform<br>
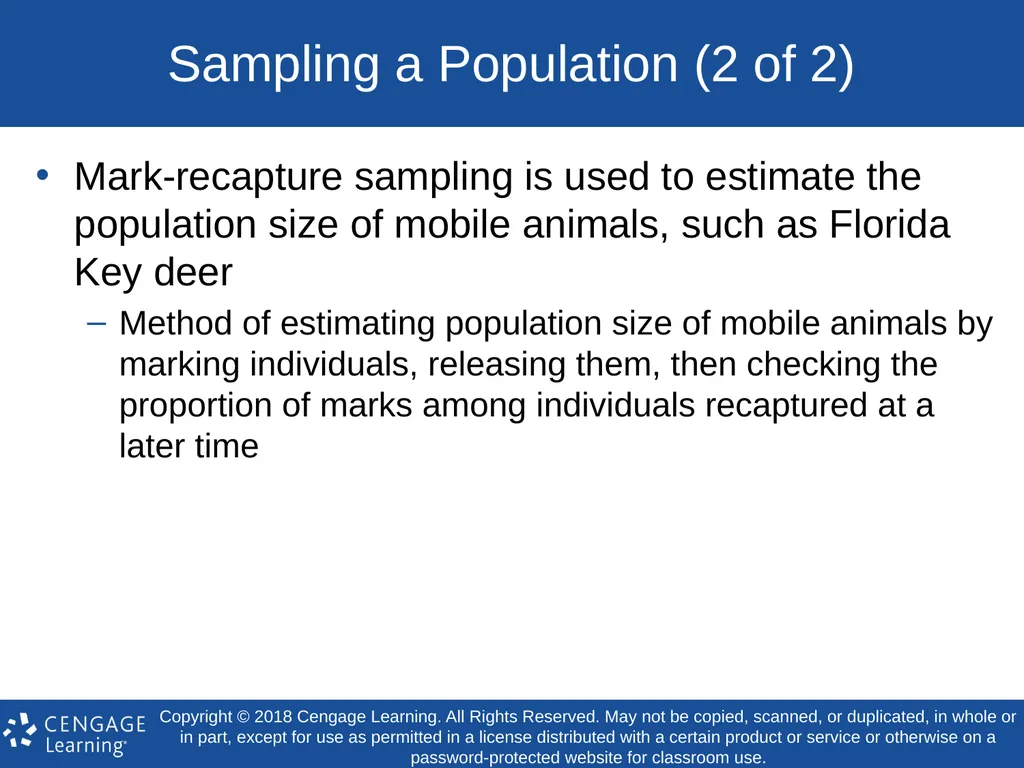
slide8. Sampling a Population (2 of 2) Mark-recapture sampling is used to estimate the population size of mobile animals, such as Florida Key deer
Method of estimating population size of mobile animals by marking individuals, releasing them, then checking the proportion of marks among individuals recaptured at a later time<br>
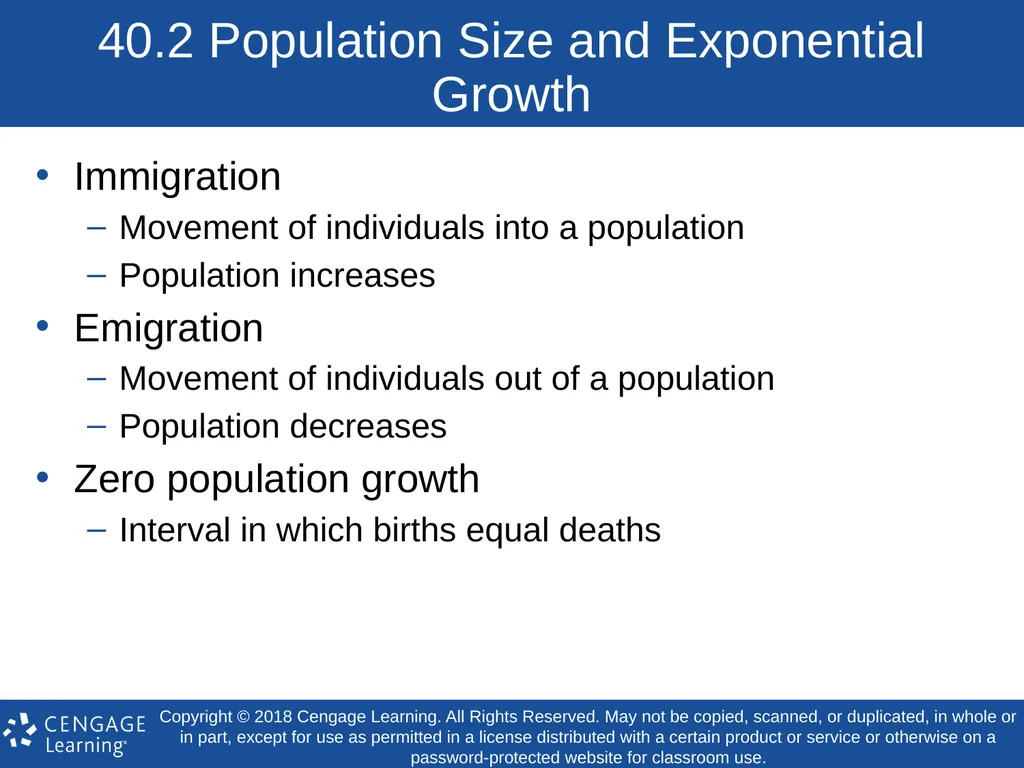
slide9. 40.2 Population Size and Exponential Growth Immigration
Movement of individuals into a population
Population increases
Emigration
Movement of individuals out of a population
Population decreases
Zero population growth
Interval in which births equal deaths<br>
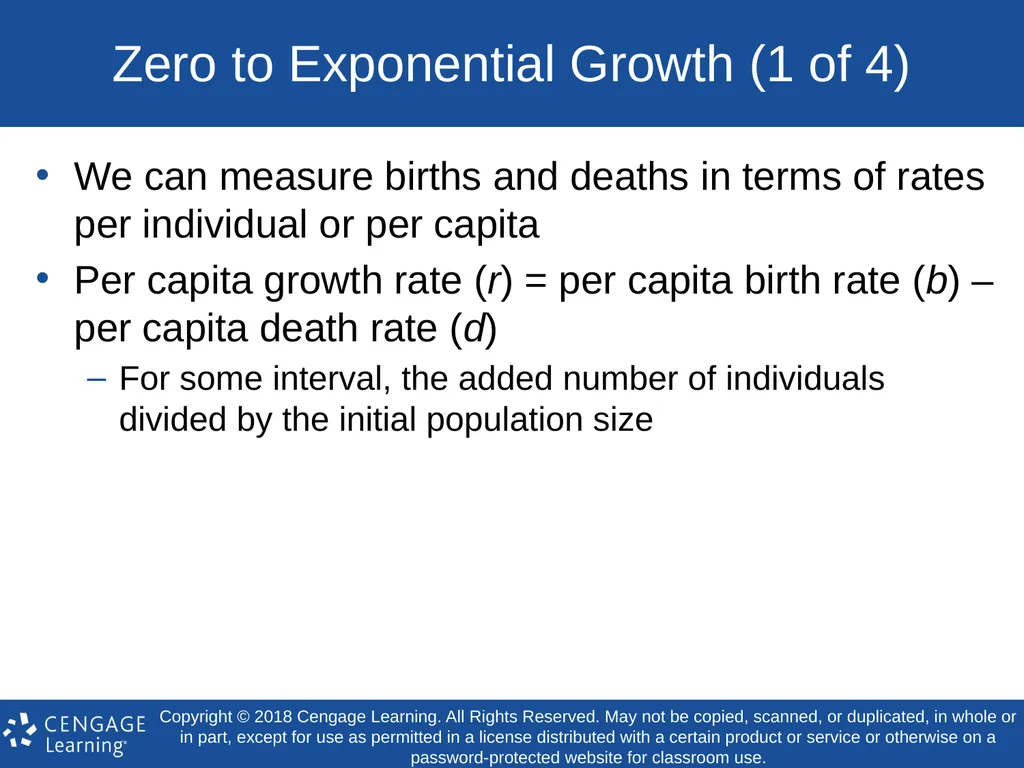
slide10. Zero to Exponential Growth (1 of 4) We can measure births and deaths in terms of rates per individual or per capita
Per capita growth rate (r) = per capita birth rate (b) – per capita death rate (d)
For some interval, the added number of individuals divided by the initial population size<br>
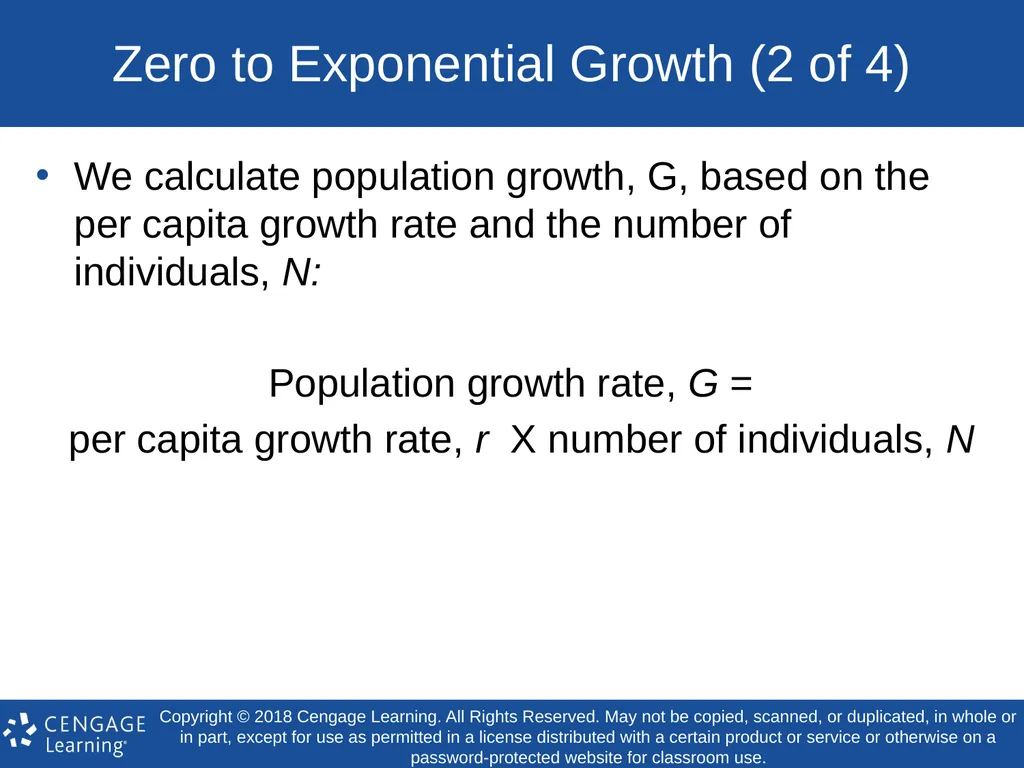
slide11. Zero to Exponential Growth (2 of 4) We calculate population growth, G, based on the per capita growth rate and the number of individuals, N:
Population growth rate, G =
per capita growth rate, r X number of individuals, N<br>
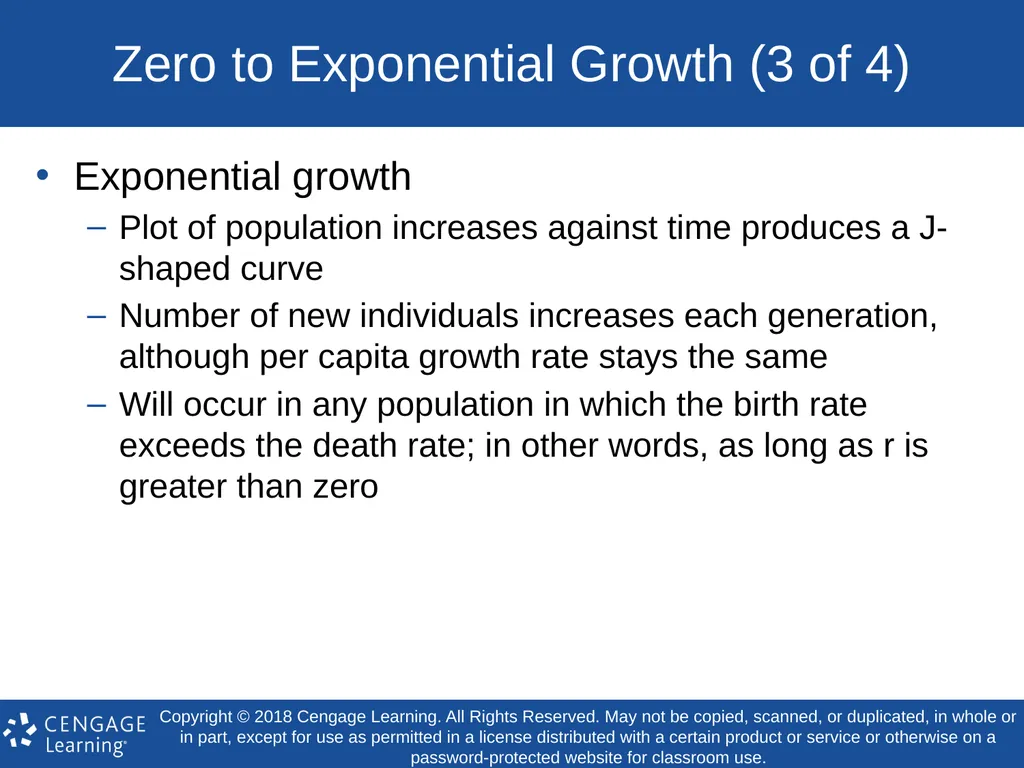
slide12. Zero to Exponential Growth (3 of 4) Exponential growth
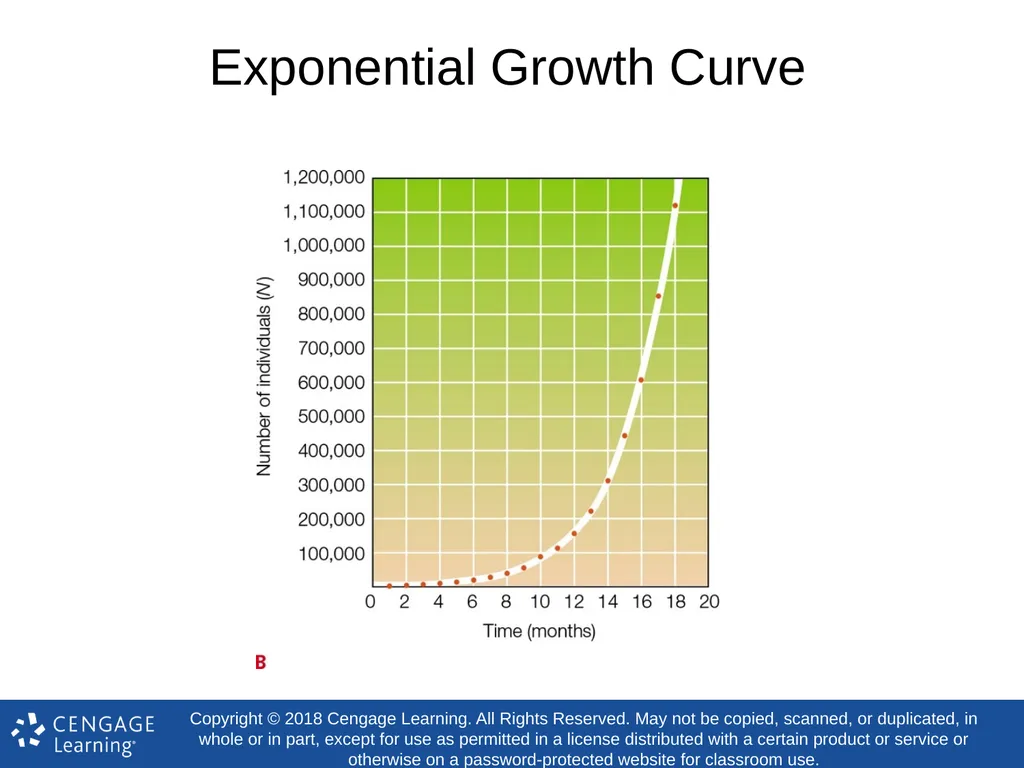
Plot of population increases against time produces a J-shaped curve
Number of new individuals increases each generation, although per capita growth rate stays the same
Will occur in any population in which the birth rate exceeds the death rate; in other words, as long as r is greater than zero<br>
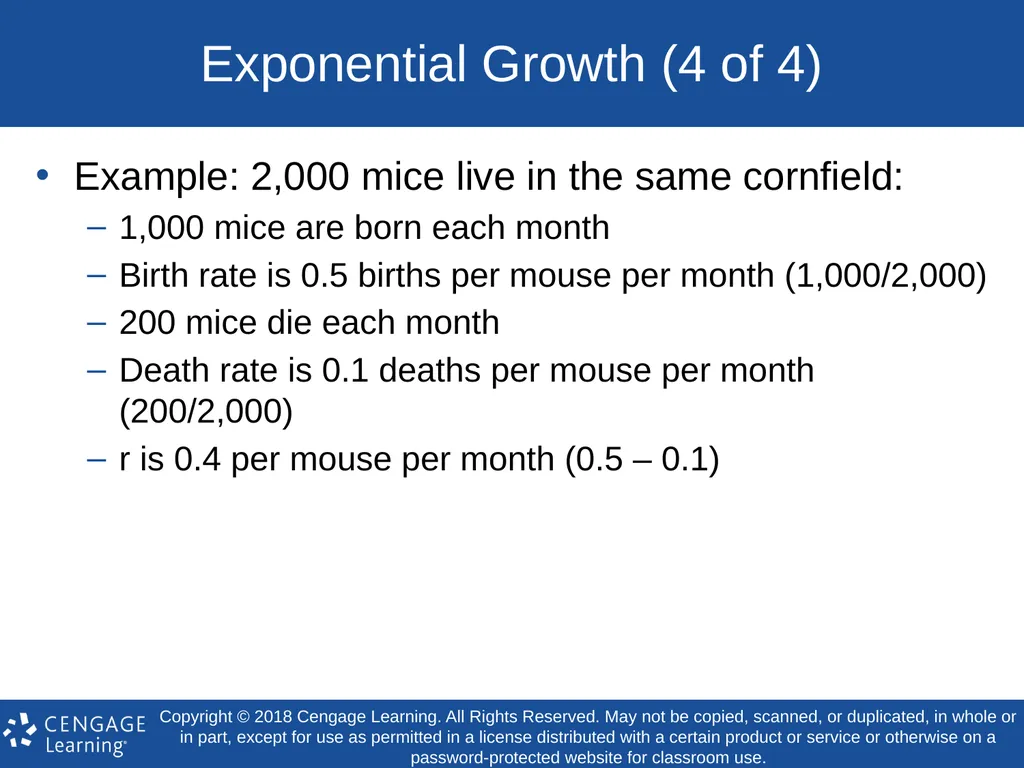
slide13. Exponential Growth (4 of 4) Example: 2,000 mice live in the same cornfield:
1,000 mice are born each month
Birth rate is 0.5 births per mouse per month (1,000/2,000)
200 mice die each month
Death rate is 0.1 deaths per mouse per month (200/2,000)
r is 0.4 per mouse per month (0.5 – 0.1)<br>
slide14. Exponential Growth Curve<br>
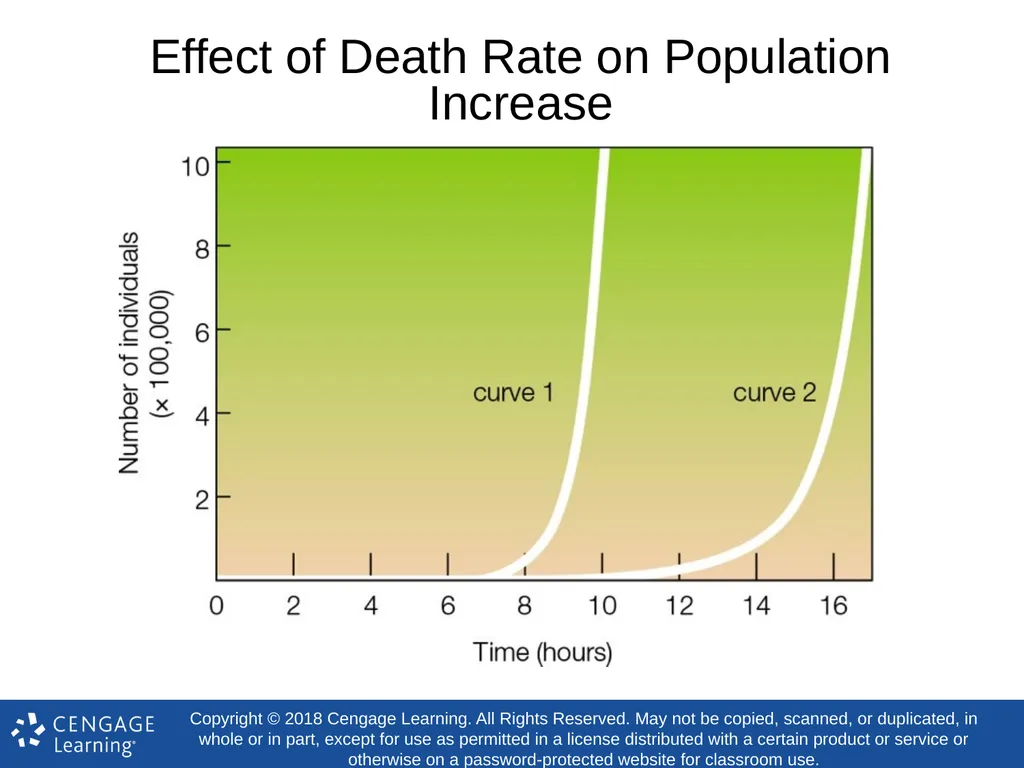
slide15. Effect of Death Rate on Population Increase<br>
slide16. Biotic Potential Maximum possible population growth rate under optimal conditions
Under ideal conditions (shelter, food, and other essential resources are unlimited, no predators or pathogens), a population’s growth rate reaches its biotic potential
Microbes have high biotic potentials
Large-bodied mammals have low biotic potentials<br>
slide17. 40.3 Limits on Population Growth No population can grow exponentially forever
Density-dependent factor
Factor that limits population growth and has a greater effect in dense populations than less dense ones
Examples: pathogens and parasites<br>
slide18. Density-Dependent Factors In any natural environment, there are limited resources
An increase in the number of individuals in an area leads to increased intraspecific competition
Competition for a resource among members of the same species
Detrimental effect even on winners, because energy they use in competition for resources is not available for reproduction<br>
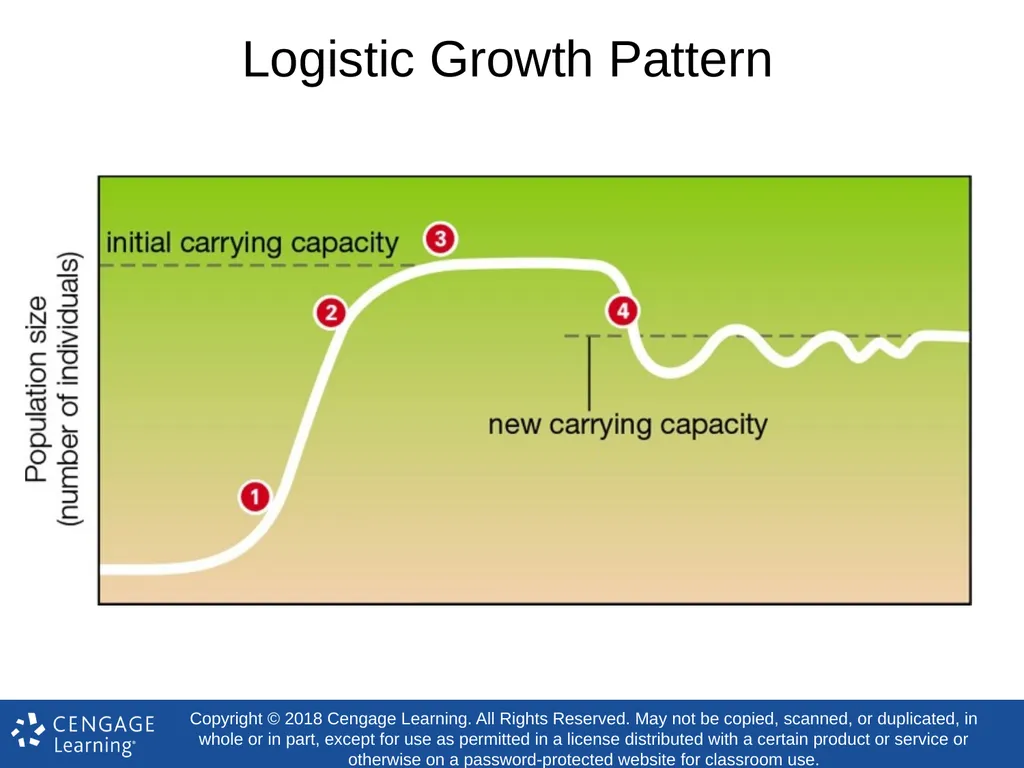
slide19. Logistic Growth Occurs when density-dependent factors affect population size over time
Plots out as an S-shaped curve
Carrying capacity
Maximum number of individuals of a species that an environment can sustain
Species-specific, environment-specific, and can change over time
Ultimately, the sustainable supply of resources determines population size<br>
slide20. Logistic Growth Pattern<br>
slide21. Density-Independent Factors Factor that limits population growth and arises regardless of population density
Examples: fires and earthquakes
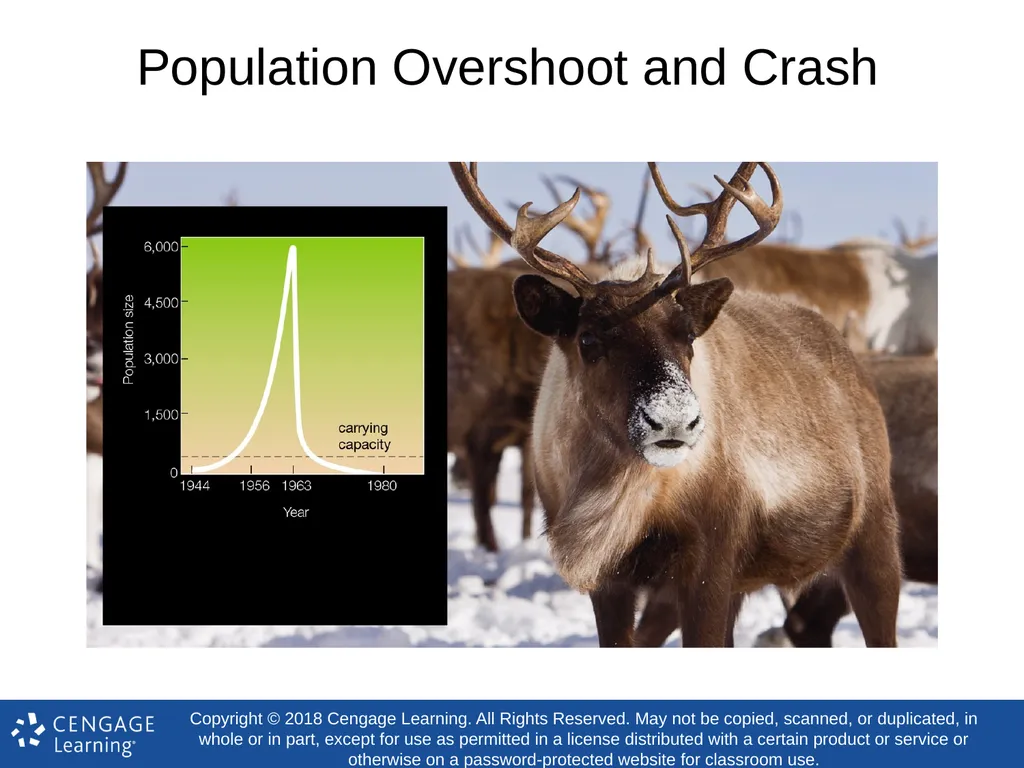
In nature, density-dependent and density-independent factors often interact to determine a population’s size
Example: St. Matthew Island reindeer population<br>
slide22. Population Overshoot and Crash<br>
slide23. 40.4 Life History Patterns Life history pattern: manner in which individuals allocate resources to growth, survival, and reproduction over the course of their lifetimes
Survival: probability of surviving to a given age and of dying at specific ages
Reproduction: age at which reproduction begins, frequency and number of offspring produced by each reproductive event, and the extent of parental investment in each offspring<br>
slide24. Timing of Births and Deaths One way to investigate life history traits is to focus on a cohort
Group of individuals born during the same interval
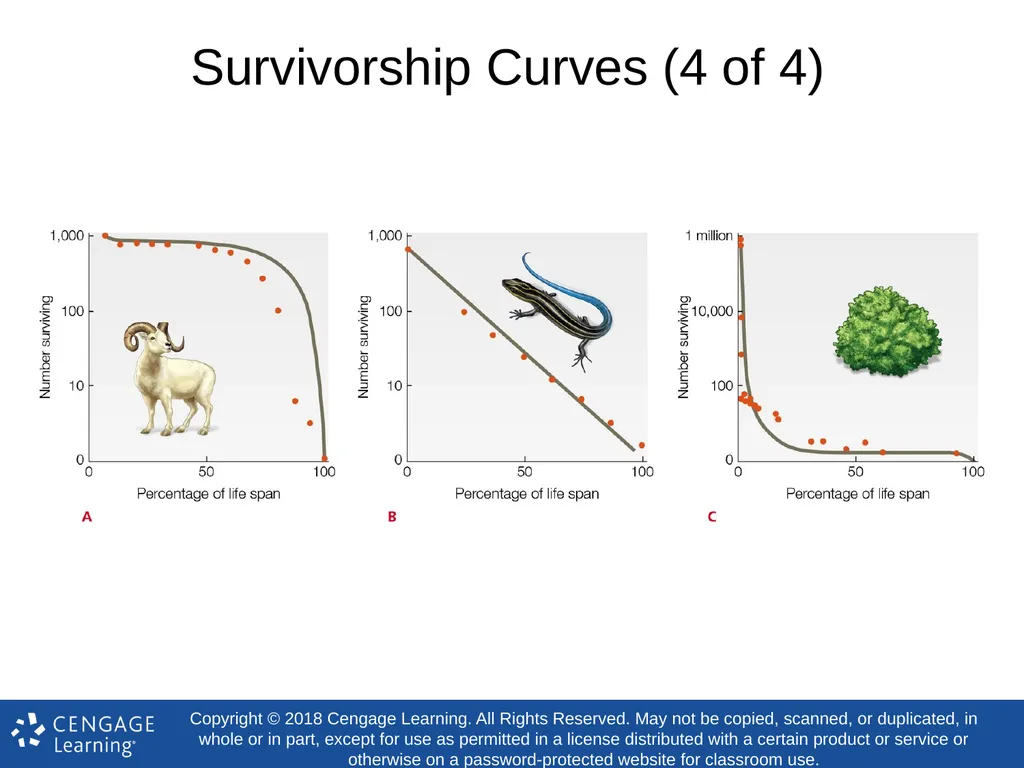
Information about age-specific death rates can also be summarized by a survivorship curve
How many members of a cohort remain alive over time<br>
slide25. Survivorship Curves (1 of 4) Type I survivorship curve
Convex shape, indicating that the death rate remains low until relatively late in life
Elephants have type I survivorship, with low mortality until old age
Typical of large animals that bear one or few offspring at a time and provide extended parental care<br>
slide26. Survivorship Curves (2 of 4) Type II survivorship curve
Diagonal, indicating death rate does not vary much with age
Snowy egrets are type II population, with a fairly constant death rate
Typical of lizards, small mammals, and large birds<br>
slide27. Survivorship Curves (3 of 4) Type III survivorship curve
Concave, indicating that death rate peaks early in life
Sea urchins are type III; mortality is high for larvae and in old age, but low in adults
Typical of species that produce many small offspring and provide little or no parental care<br>
slide28. Survivorship Curves (4 of 4)<br>
slide29. r-Selection and K-Selection r-selection
Individuals who produce maximum number offspring as quickly as possible have a selective advantage
Occurs when population density is low and resources are abundant
K-selection
Individuals who produce offspring that outcompete others for limited resources have a selective advantage
Occurs when a population is near carrying capacity<br>
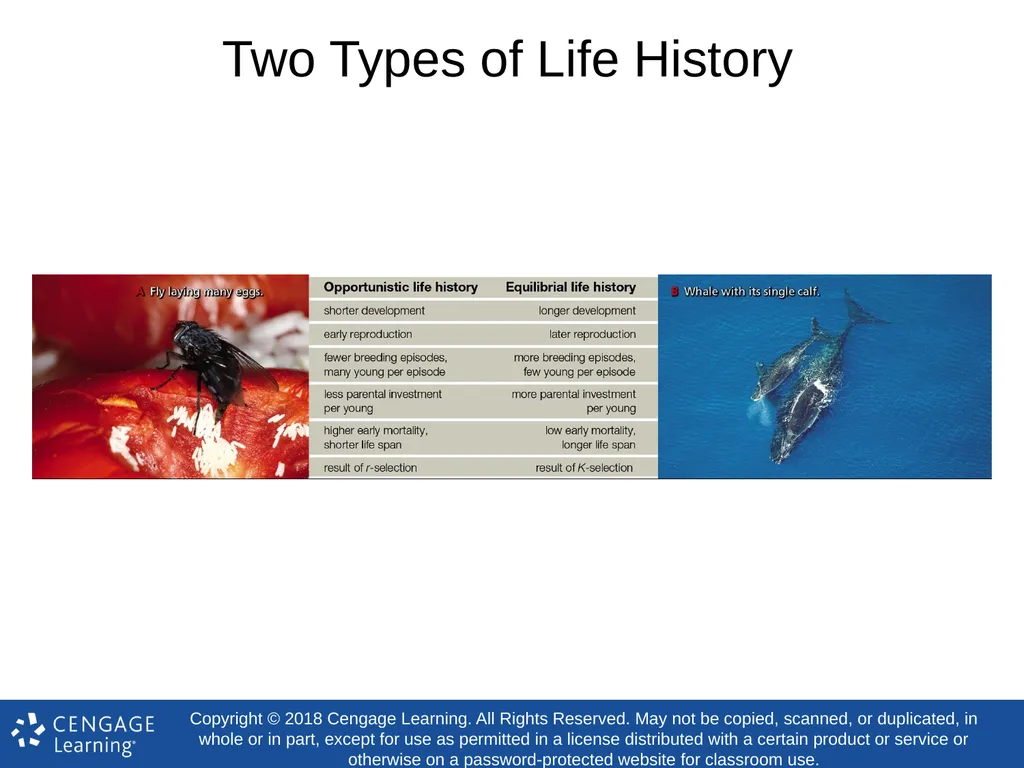
slide30. Two Types of Life History<br>
slide31. 40.5 Predation Effects on Life History (1 of 2) Several populations of guppies live in a stream with many small waterfalls that serve as natural barriers
Different guppy populations face different predation pressures
Some populations live with killifish, a relatively small predator that eats mostly immature guppies
Other populations live with cichlids, which are larger and tend to eat mature guppies<br>
slide32. 40.5 Predation Effects on Life History (2 of 2) Many predators prefer prey of a specific size, and individuals of most prey species change in size over their lifetime
When predators prefer large prey, prey who reproduce when still small and young are at a selective advantage
When predators focus on small prey, fast-growing individuals have the selective advantage<br>
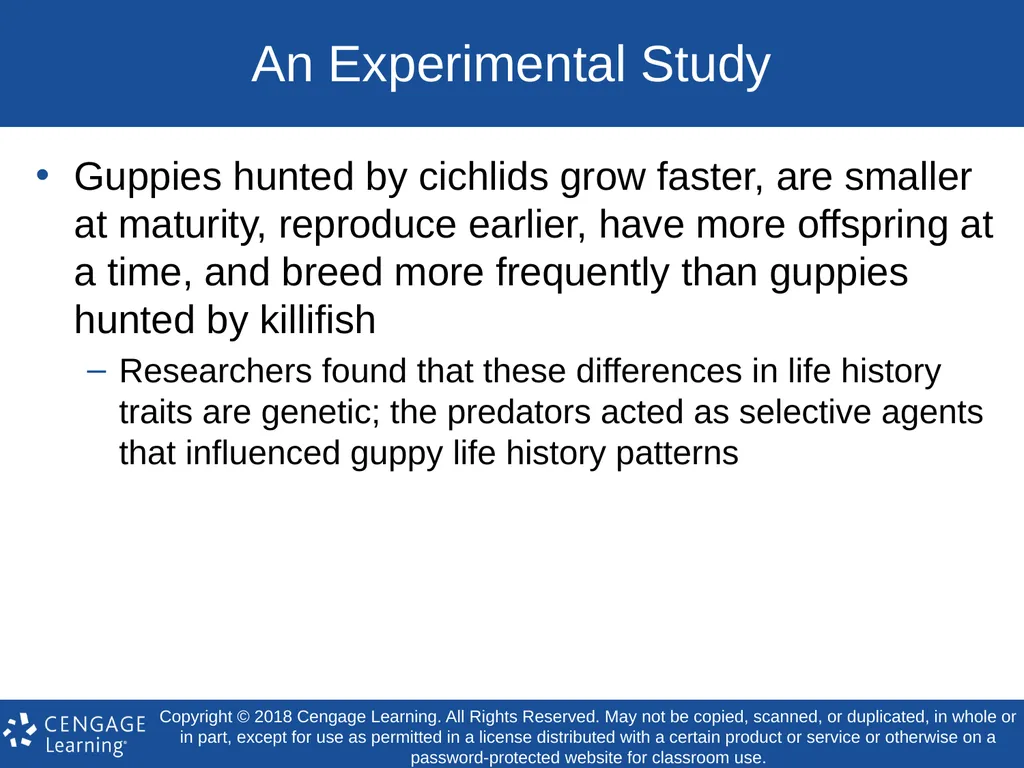
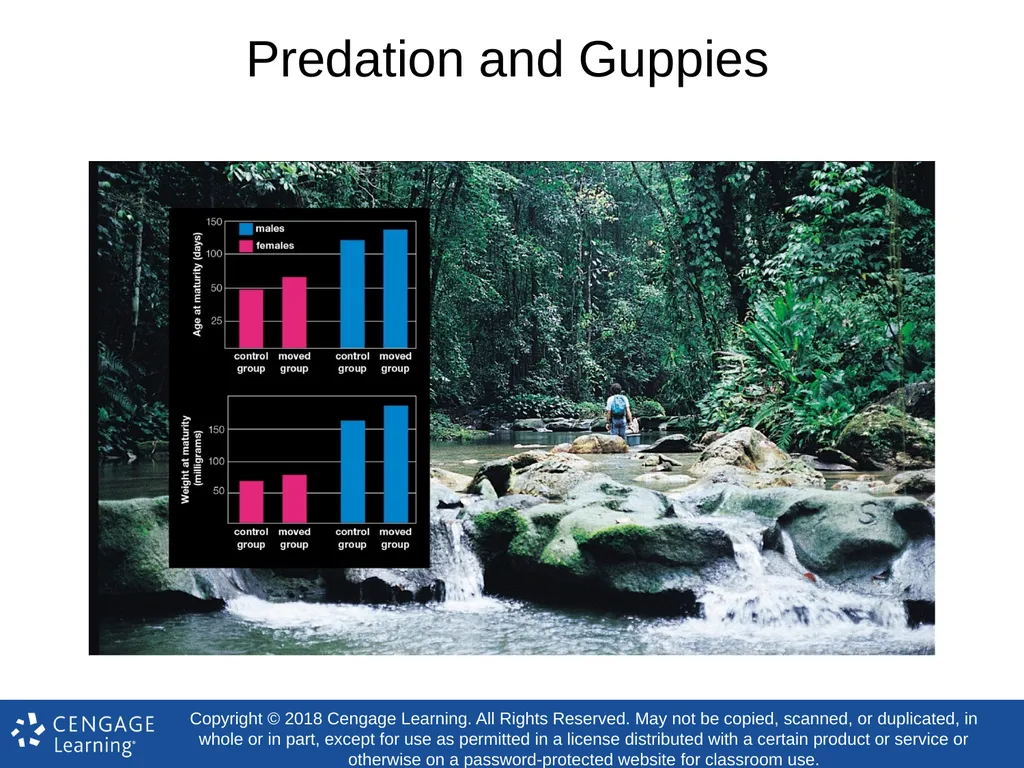
slide33. An Experimental Study Guppies hunted by cichlids grow faster, are smaller at maturity, reproduce earlier, have more offspring at a time, and breed more frequently than guppies hunted by killifish
Researchers found that these differences in life history traits are genetic; the predators acted as selective agents that influenced guppy life history patterns<br>
slide34. Predation and Guppies<br>
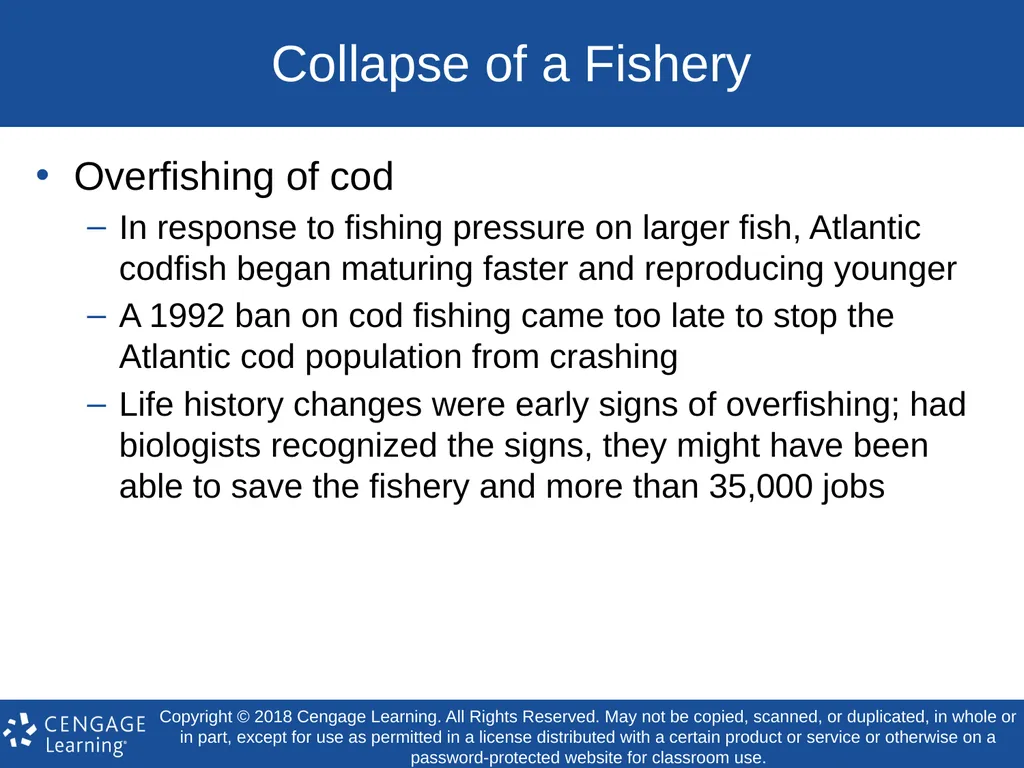
slide35. Collapse of a Fishery Overfishing of cod
In response to fishing pressure on larger fish, Atlantic codfish began maturing faster and reproducing younger
A 1992 ban on cod fishing came too late to stop the Atlantic cod population from crashing
Life history changes were early signs of overfishing; had biologists recognized the signs, they might have been able to save the fishery and more than 35,000 jobs<br>
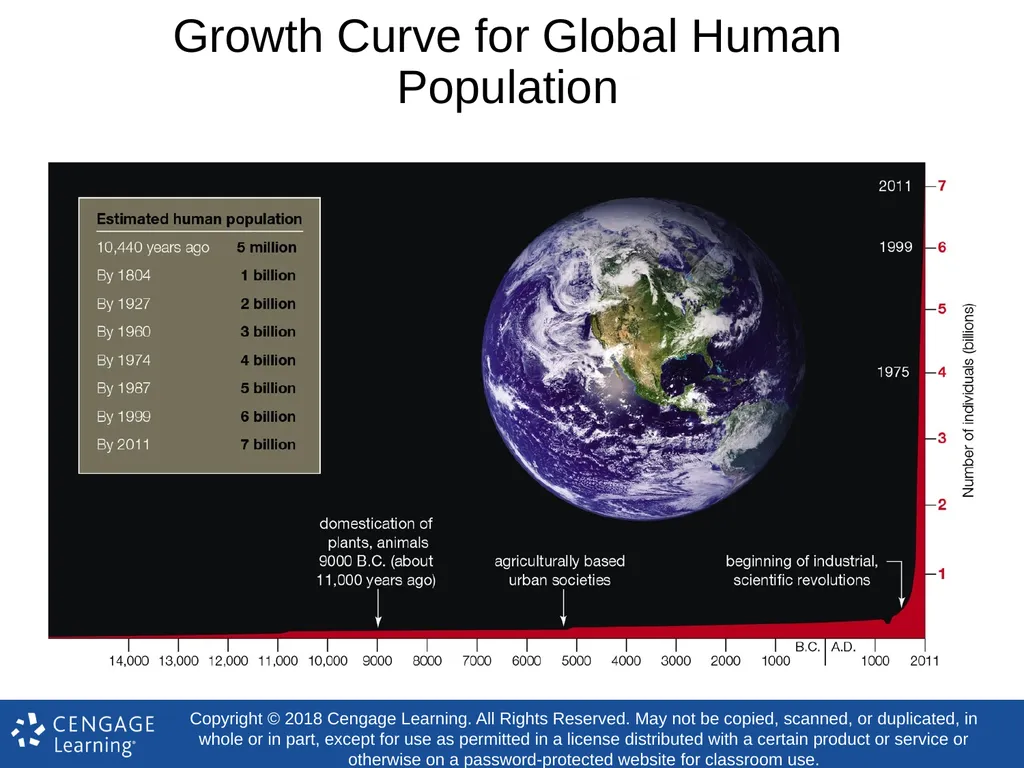
slide36. 40.6 Human Population Growth For most of history, the human population grew very slowly
In 2009, human population size surpassed 6.8 billion
Growth rate began to increase about 10,000 years ago, then soared during the past two centuries
Three trends promoted the large increases<br>
slide37. Expansions and Innovations Humans were able to migrate into new habitats and expand into new climate zones
Humans developed new technologies that increased the carrying capacity of existing habitats
Humans sidestepped some limiting factors that restrain growth of other species<br>
slide38. Growth Curve for Global Human Population<br>
slide39. Fertility and Future Growth (1 of 2) Total fertility rate of a population = number of offspring a woman would be expected to have during her reproductive years given the current age-specific birth rate
Replacement fertility rate = number of children a woman must bear to replace herself with one daughter of reproductive age, varies among regions<br>
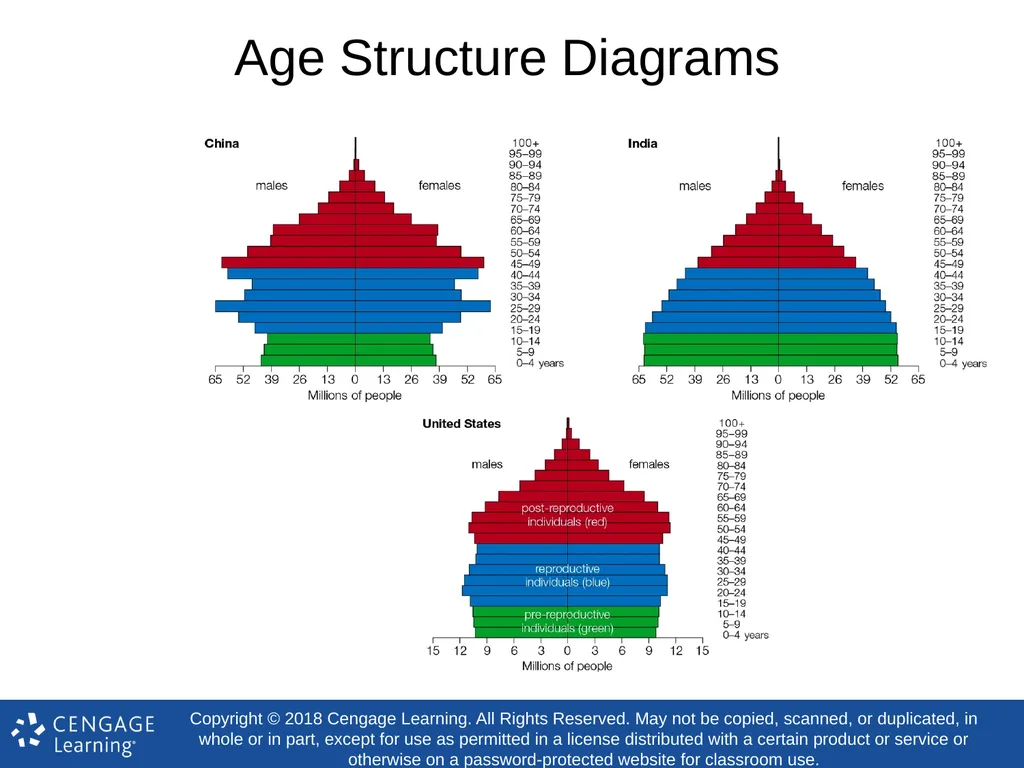
slide40. Fertility and Future Growth (2 of 2) Age structure diagrams show the age distribution of individuals
The broader the base of an age structure diagram, the greater proportion of young people, and the greater expected growth
More than 1/3 of the world population is in the broad pre-reproductive base
World population growth cannot be slowed for many years, because 1.9 billion people are about to enter reproductive age<br>
slide41. Age Structure Diagrams<br>
slide42. 40.7 Economic Effects and Resource Consumption The most highly developed countries have the lowest birth rates and infant mortality, and the highest life expectancy
High population growth is correlated with low levels of economic development, and low per capita consumption of resources
Negative population growth in some countries also poses challenges<br>
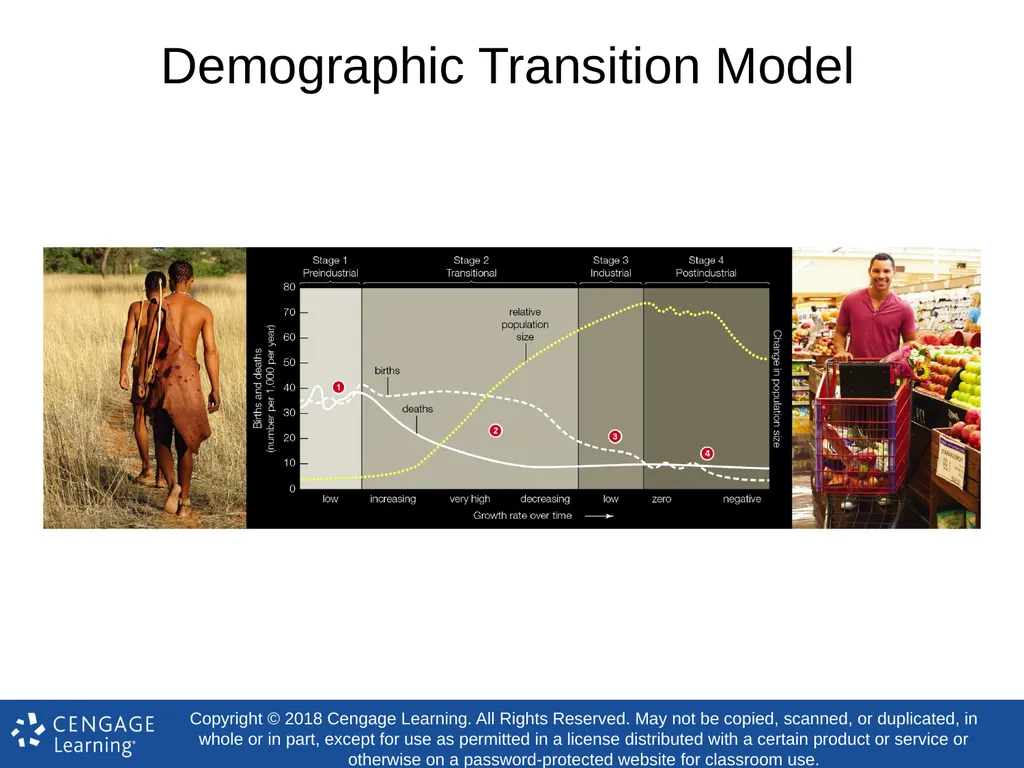
slide43. A Demographic Transition The demographic transition model describes how changes in population growth often unfold in four stages of economic development<br>
slide44. Demographic Transition Model<br>
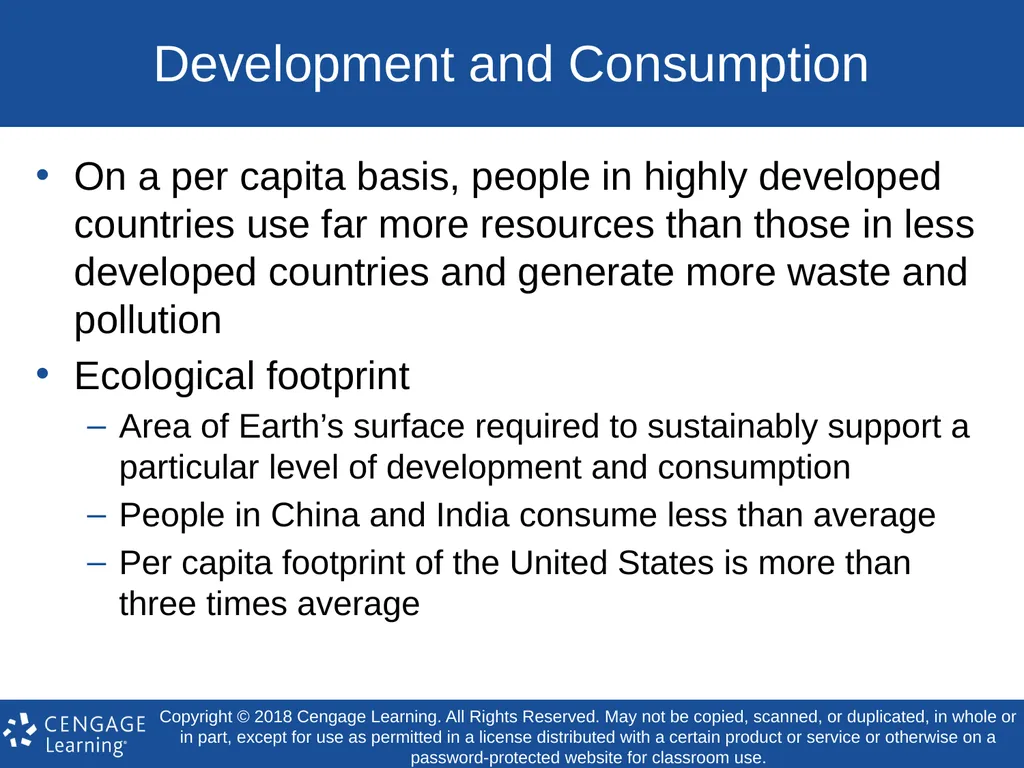
slide45. Development and Consumption On a per capita basis, people in highly developed countries use far more resources than those in less developed countries and generate more waste and pollution
Ecological footprint
Area of Earth’s surface required to sustainably support a particular level of development and consumption
People in China and India consume less than average
Per capita footprint of the United States is more than three times average<br>
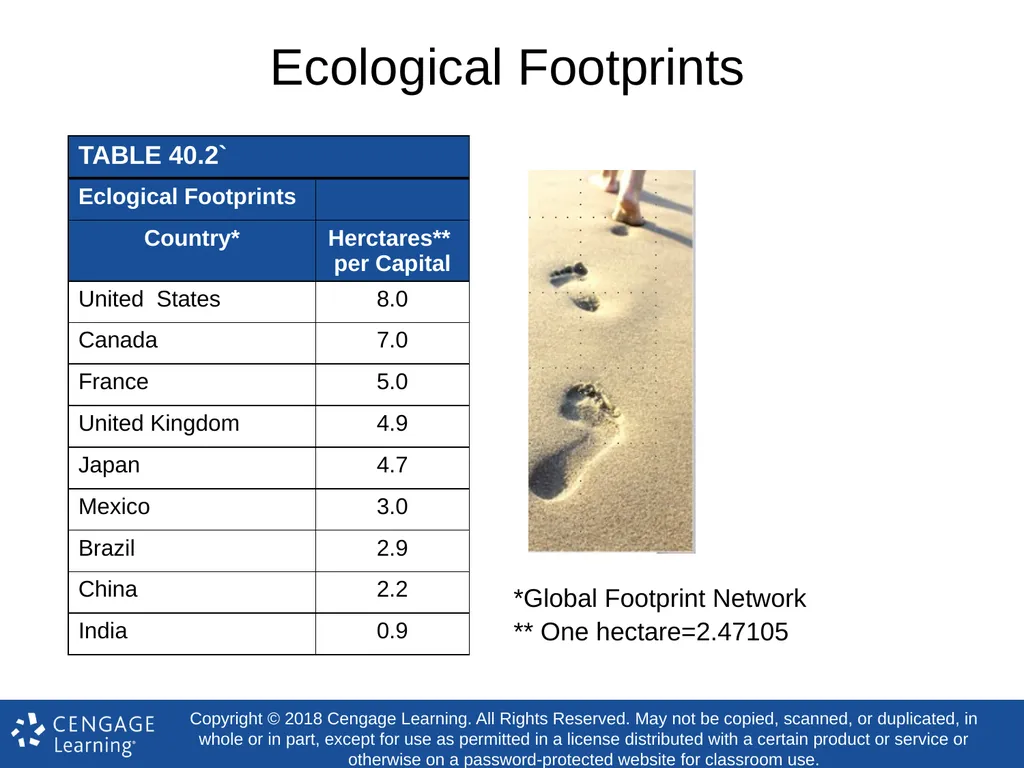
slide46. Ecological Footprints *Global Footprint Network
** One hectare=2.47105<br>
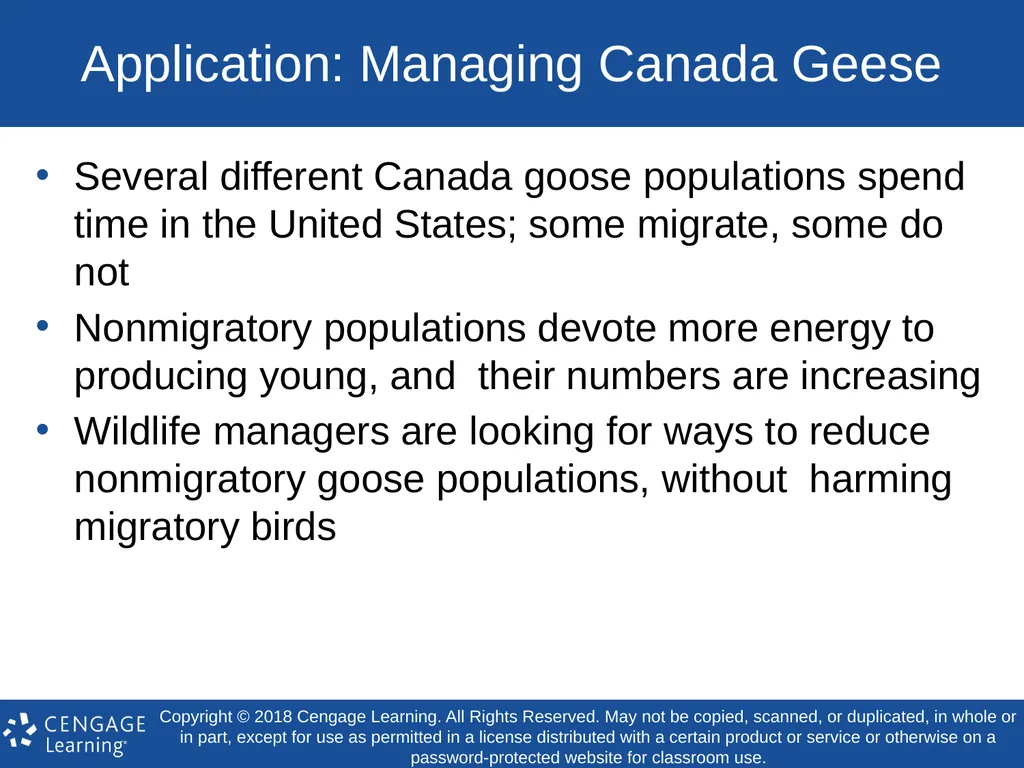
slide47. Application: Managing Canada Geese Several different Canada goose populations spend time in the United States; some migrate, some do not
Nonmigratory populations devote more energy to producing young, and their numbers are increasing
Wildlife managers are looking for ways to reduce nonmigratory goose populations, without harming migratory birds<br>
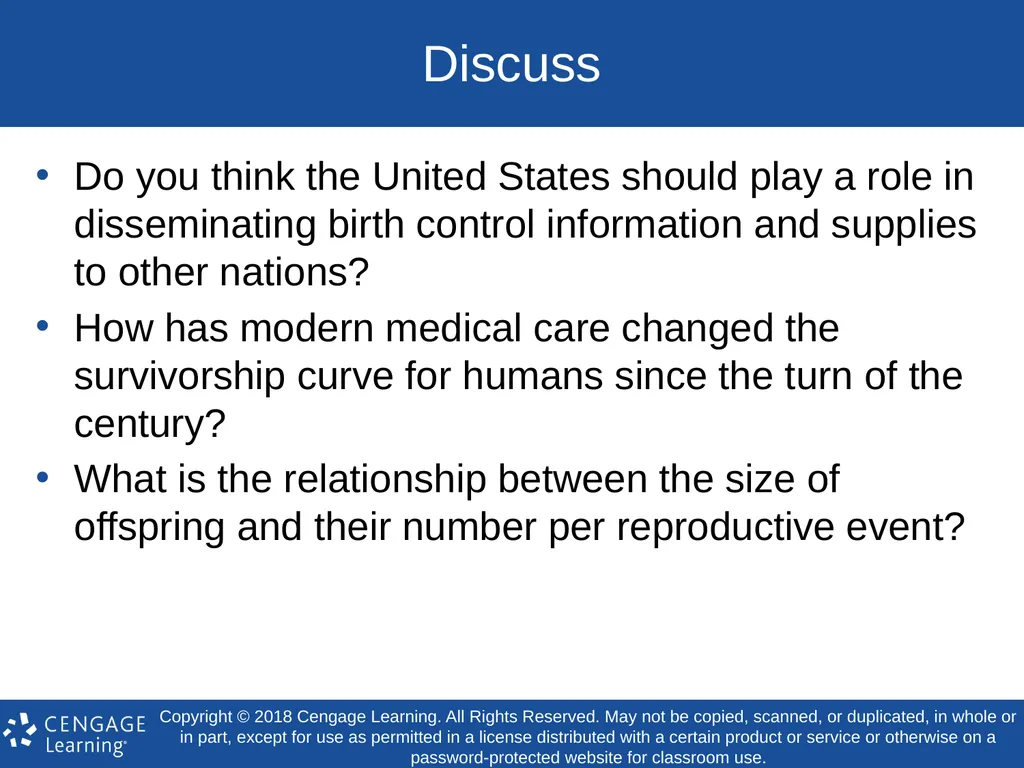
slide48. Discuss Do you think the United States should play a role in disseminating birth control information and supplies to other nations?
How has modern medical care changed the survivorship curve for humans since the turn of the century?
What is the relationship between the size of offspring and their number per reproductive event?<br>
Population Ecology Copyright © 2018 Cengage Learning. All Rights Reserved. May not be copied, scanned, or duplicated, in whole or in part, except for use as permitted in a license distributed with a certain product or service or otherwise on a password-protected website for classroom use.<br>
slide2. 40.1 Characteristics of a Population Population ecology investigates the factors that influence the size, distribution, and other properties of natural populations
Data can be used to make decisions about managing a species
Studying population ecology often involves the use of demographics
Statistics that describe a population and often change over time<br>
slide3. Size, Density, and Distribution (1 of 3) Population: group of organisms that interbreed with one another more often than they interbreed with other members of their species
Population size: total number of individuals in population
Population density: number of individuals per unit area or volume<br>
slide4. Size, Density, and Distribution (2 of 3) Population distribution: describes how individuals are distributed
Clumped distribution
Individuals are closer to one another than would be predicted by chance alone
Due to resource distribution, limited dispersal availability, or asexual reproduction<br>
slide5. Size, Density, and Distribution (3 of 3) Near-uniform distribution
Individuals are more evenly spaced than would be expected by chance
Found in breeding colonies and with competition for resources
Random distribution
Individuals are distributed randomly when environmental resources are uniformly distributed
Proximity to others is neither beneficial or detrimental<br>
slide6. Population Distribution Patterns<br>
slide7. Sampling a Population (1 of 2) Biologists frequently use sampling techniques to estimate population size
Plot sampling estimates the total number of individuals in an area based on direct counts in a small portion of that area
Estimates from plot sampling are most accurate when the organisms counted are not very mobile and conditions across the area they occupy are more or less uniform<br>
slide8. Sampling a Population (2 of 2) Mark-recapture sampling is used to estimate the population size of mobile animals, such as Florida Key deer
Method of estimating population size of mobile animals by marking individuals, releasing them, then checking the proportion of marks among individuals recaptured at a later time<br>
slide9. 40.2 Population Size and Exponential Growth Immigration
Movement of individuals into a population
Population increases
Emigration
Movement of individuals out of a population
Population decreases
Zero population growth
Interval in which births equal deaths<br>
slide10. Zero to Exponential Growth (1 of 4) We can measure births and deaths in terms of rates per individual or per capita
Per capita growth rate (r) = per capita birth rate (b) – per capita death rate (d)
For some interval, the added number of individuals divided by the initial population size<br>
slide11. Zero to Exponential Growth (2 of 4) We calculate population growth, G, based on the per capita growth rate and the number of individuals, N:
Population growth rate, G =
per capita growth rate, r X number of individuals, N<br>
slide12. Zero to Exponential Growth (3 of 4) Exponential growth
Plot of population increases against time produces a J-shaped curve
Number of new individuals increases each generation, although per capita growth rate stays the same
Will occur in any population in which the birth rate exceeds the death rate; in other words, as long as r is greater than zero<br>
slide13. Exponential Growth (4 of 4) Example: 2,000 mice live in the same cornfield:
1,000 mice are born each month
Birth rate is 0.5 births per mouse per month (1,000/2,000)
200 mice die each month
Death rate is 0.1 deaths per mouse per month (200/2,000)
r is 0.4 per mouse per month (0.5 – 0.1)<br>
slide14. Exponential Growth Curve<br>
slide15. Effect of Death Rate on Population Increase<br>
slide16. Biotic Potential Maximum possible population growth rate under optimal conditions
Under ideal conditions (shelter, food, and other essential resources are unlimited, no predators or pathogens), a population’s growth rate reaches its biotic potential
Microbes have high biotic potentials
Large-bodied mammals have low biotic potentials<br>
slide17. 40.3 Limits on Population Growth No population can grow exponentially forever
Density-dependent factor
Factor that limits population growth and has a greater effect in dense populations than less dense ones
Examples: pathogens and parasites<br>
slide18. Density-Dependent Factors In any natural environment, there are limited resources
An increase in the number of individuals in an area leads to increased intraspecific competition
Competition for a resource among members of the same species
Detrimental effect even on winners, because energy they use in competition for resources is not available for reproduction<br>
slide19. Logistic Growth Occurs when density-dependent factors affect population size over time
Plots out as an S-shaped curve
Carrying capacity
Maximum number of individuals of a species that an environment can sustain
Species-specific, environment-specific, and can change over time
Ultimately, the sustainable supply of resources determines population size<br>
slide20. Logistic Growth Pattern<br>
slide21. Density-Independent Factors Factor that limits population growth and arises regardless of population density
Examples: fires and earthquakes
In nature, density-dependent and density-independent factors often interact to determine a population’s size
Example: St. Matthew Island reindeer population<br>
slide22. Population Overshoot and Crash<br>
slide23. 40.4 Life History Patterns Life history pattern: manner in which individuals allocate resources to growth, survival, and reproduction over the course of their lifetimes
Survival: probability of surviving to a given age and of dying at specific ages
Reproduction: age at which reproduction begins, frequency and number of offspring produced by each reproductive event, and the extent of parental investment in each offspring<br>
slide24. Timing of Births and Deaths One way to investigate life history traits is to focus on a cohort
Group of individuals born during the same interval
Information about age-specific death rates can also be summarized by a survivorship curve
How many members of a cohort remain alive over time<br>
slide25. Survivorship Curves (1 of 4) Type I survivorship curve
Convex shape, indicating that the death rate remains low until relatively late in life
Elephants have type I survivorship, with low mortality until old age
Typical of large animals that bear one or few offspring at a time and provide extended parental care<br>
slide26. Survivorship Curves (2 of 4) Type II survivorship curve
Diagonal, indicating death rate does not vary much with age
Snowy egrets are type II population, with a fairly constant death rate
Typical of lizards, small mammals, and large birds<br>
slide27. Survivorship Curves (3 of 4) Type III survivorship curve
Concave, indicating that death rate peaks early in life
Sea urchins are type III; mortality is high for larvae and in old age, but low in adults
Typical of species that produce many small offspring and provide little or no parental care<br>
slide28. Survivorship Curves (4 of 4)<br>
slide29. r-Selection and K-Selection r-selection
Individuals who produce maximum number offspring as quickly as possible have a selective advantage
Occurs when population density is low and resources are abundant
K-selection
Individuals who produce offspring that outcompete others for limited resources have a selective advantage
Occurs when a population is near carrying capacity<br>
slide30. Two Types of Life History<br>
slide31. 40.5 Predation Effects on Life History (1 of 2) Several populations of guppies live in a stream with many small waterfalls that serve as natural barriers
Different guppy populations face different predation pressures
Some populations live with killifish, a relatively small predator that eats mostly immature guppies
Other populations live with cichlids, which are larger and tend to eat mature guppies<br>
slide32. 40.5 Predation Effects on Life History (2 of 2) Many predators prefer prey of a specific size, and individuals of most prey species change in size over their lifetime
When predators prefer large prey, prey who reproduce when still small and young are at a selective advantage
When predators focus on small prey, fast-growing individuals have the selective advantage<br>
slide33. An Experimental Study Guppies hunted by cichlids grow faster, are smaller at maturity, reproduce earlier, have more offspring at a time, and breed more frequently than guppies hunted by killifish
Researchers found that these differences in life history traits are genetic; the predators acted as selective agents that influenced guppy life history patterns<br>
slide34. Predation and Guppies<br>
slide35. Collapse of a Fishery Overfishing of cod
In response to fishing pressure on larger fish, Atlantic codfish began maturing faster and reproducing younger
A 1992 ban on cod fishing came too late to stop the Atlantic cod population from crashing
Life history changes were early signs of overfishing; had biologists recognized the signs, they might have been able to save the fishery and more than 35,000 jobs<br>
slide36. 40.6 Human Population Growth For most of history, the human population grew very slowly
In 2009, human population size surpassed 6.8 billion
Growth rate began to increase about 10,000 years ago, then soared during the past two centuries
Three trends promoted the large increases<br>
slide37. Expansions and Innovations Humans were able to migrate into new habitats and expand into new climate zones
Humans developed new technologies that increased the carrying capacity of existing habitats
Humans sidestepped some limiting factors that restrain growth of other species<br>
slide38. Growth Curve for Global Human Population<br>
slide39. Fertility and Future Growth (1 of 2) Total fertility rate of a population = number of offspring a woman would be expected to have during her reproductive years given the current age-specific birth rate
Replacement fertility rate = number of children a woman must bear to replace herself with one daughter of reproductive age, varies among regions<br>
slide40. Fertility and Future Growth (2 of 2) Age structure diagrams show the age distribution of individuals
The broader the base of an age structure diagram, the greater proportion of young people, and the greater expected growth
More than 1/3 of the world population is in the broad pre-reproductive base
World population growth cannot be slowed for many years, because 1.9 billion people are about to enter reproductive age<br>
slide41. Age Structure Diagrams<br>
slide42. 40.7 Economic Effects and Resource Consumption The most highly developed countries have the lowest birth rates and infant mortality, and the highest life expectancy
High population growth is correlated with low levels of economic development, and low per capita consumption of resources
Negative population growth in some countries also poses challenges<br>
slide43. A Demographic Transition The demographic transition model describes how changes in population growth often unfold in four stages of economic development<br>
slide44. Demographic Transition Model<br>
slide45. Development and Consumption On a per capita basis, people in highly developed countries use far more resources than those in less developed countries and generate more waste and pollution
Ecological footprint
Area of Earth’s surface required to sustainably support a particular level of development and consumption
People in China and India consume less than average
Per capita footprint of the United States is more than three times average<br>
slide46. Ecological Footprints *Global Footprint Network
** One hectare=2.47105<br>
slide47. Application: Managing Canada Geese Several different Canada goose populations spend time in the United States; some migrate, some do not
Nonmigratory populations devote more energy to producing young, and their numbers are increasing
Wildlife managers are looking for ways to reduce nonmigratory goose populations, without harming migratory birds<br>
slide48. Discuss Do you think the United States should play a role in disseminating birth control information and supplies to other nations?
How has modern medical care changed the survivorship curve for humans since the turn of the century?
What is the relationship between the size of offspring and their number per reproductive event?<br>