Burning Cost Agenda De tariff cycle - learning from other markets Phase I Price War Pressure on cost Adequacy of Sum Insured Coverage enhancement Phase II Phase III Rational Behavior Return of growth Value destruction Companies go down
"Burning Cost Agenda De tariff cycle - learning" is the property of its rightful owner. Permission is granted to
download and print the materials on this website for personal, non-commercial use only, and to display it
on your personal computer provided you do not modify the materials and that you retain all copyright
notices contained in the materials. By downloading content from our website, you accept the terms of this
agreement.
Presentation Transcript
01
Burning Cost<br>
02
Agenda<br>
03
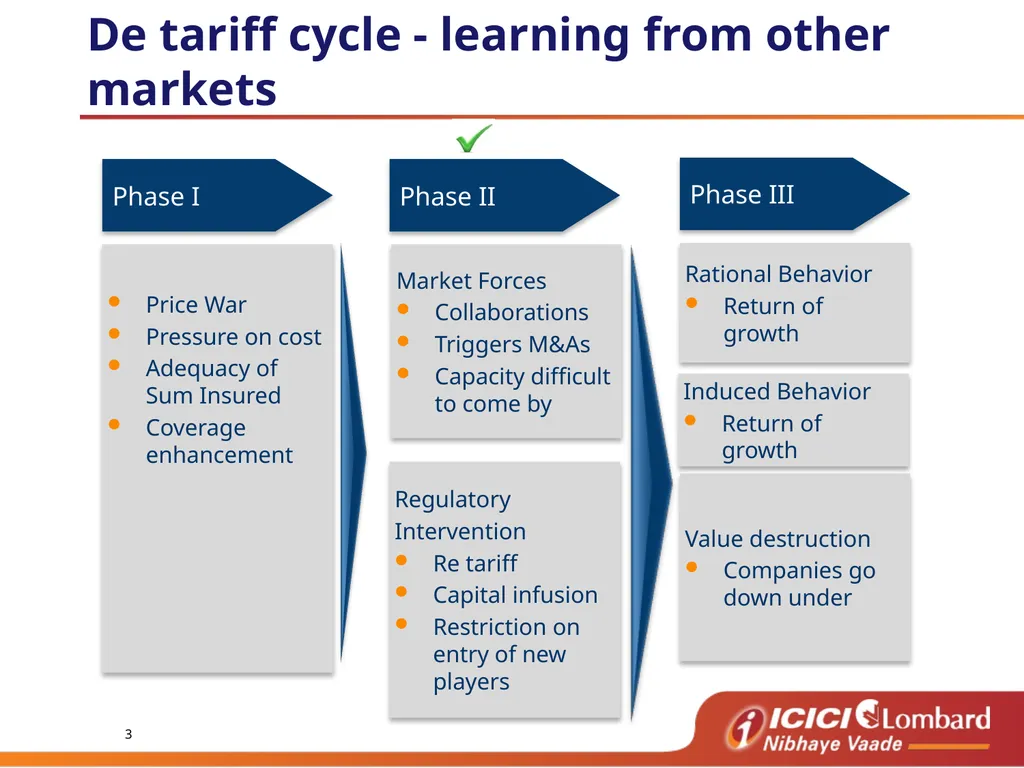
De tariff cycle - learning from other markets Phase I Price War
Pressure on cost
Adequacy of Sum Insured
Coverage enhancement Phase II Phase III Rational Behavior
Return of growth Value destruction
Companies go down under Market Forces
Collaborations
Triggers M&As
Capacity difficult to come by Induced Behavior
Return of growth Regulatory
Intervention
Re tariff
Capital infusion
Restriction on entry of new players<br>
04
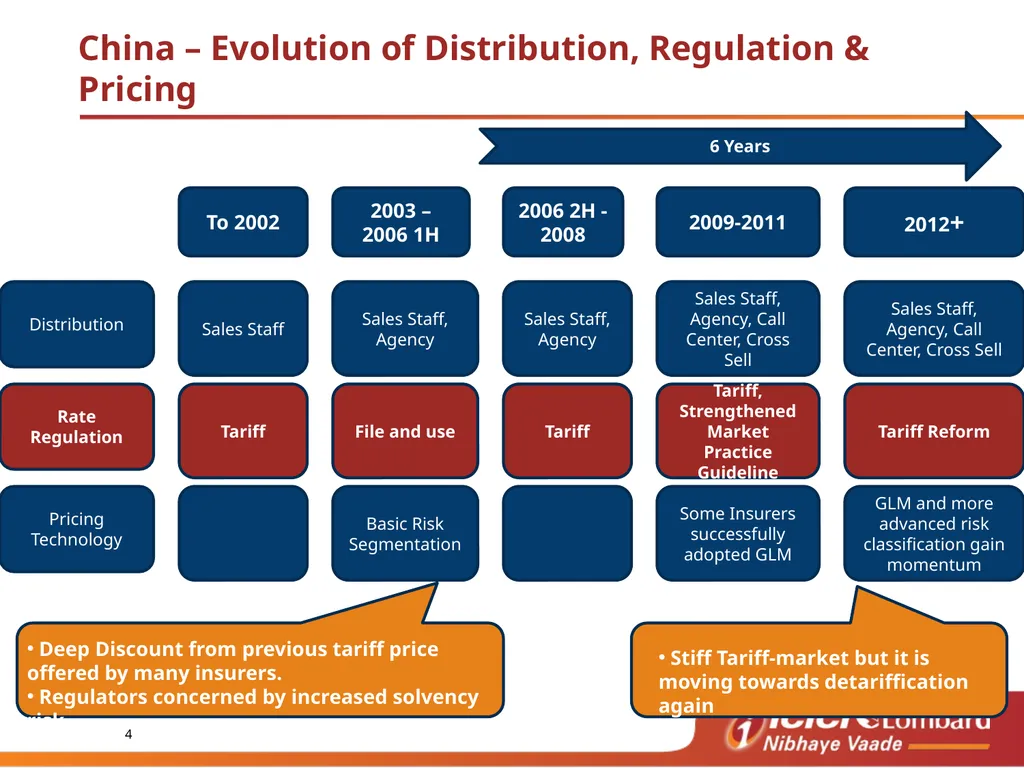
China – Evolution of Distribution, Regulation & Pricing 6 Years 2003 – 2006 1H 2006 2H - 2008 2009-2011 2012+ To 2002 Sales Staff, Agency, Call Center, Cross Sell Sales Staff, Agency Sales Staff, Agency Sales Staff, Agency, Call Center, Cross Sell Sales Staff Distribution Tariff Reform File and use Tariff Tariff, Strengthened Market Practice Guideline Tariff Rate Regulation GLM and more advanced risk classification gain momentum Basic Risk Segmentation Some Insurers successfully adopted GLM Pricing Technology Deep Discount from previous tariff price offered by many insurers.
Regulators concerned by increased solvency risk Stiff Tariff-market but it is moving towards detariffication again<br>
05
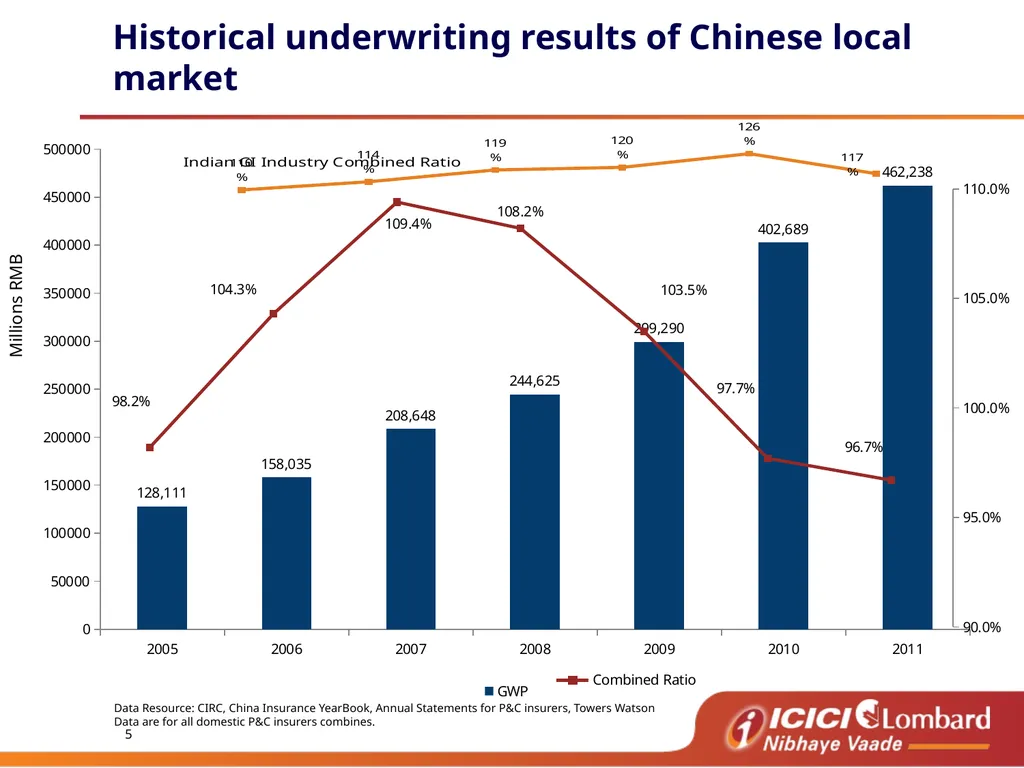
Historical underwriting results of Chinese local market Millions RMB Data Resource: CIRC, China Insurance YearBook, Annual Statements for P&C insurers, Towers Watson
Data are for all domestic P&C insurers combines.<br>
06
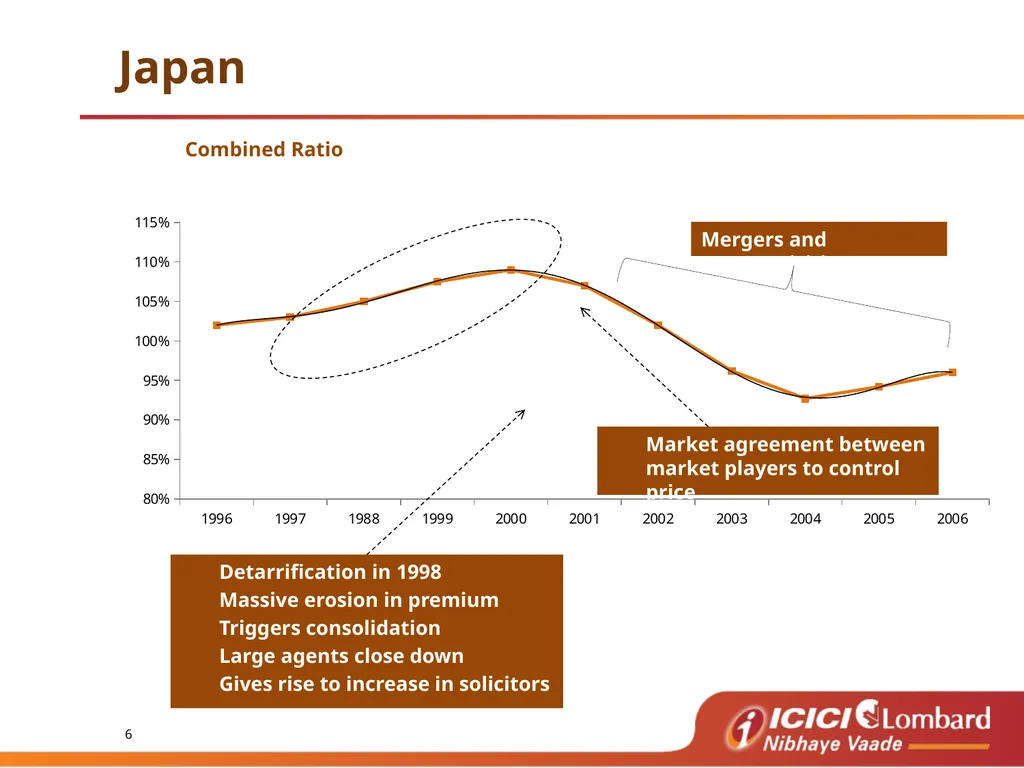
Japan Market agreement between market players to control price Combined Ratio Detarrification in 1998
Massive erosion in premium
Triggers consolidation
Large agents close down
Gives rise to increase in solicitors Mergers and Acquisitions<br>
07
Agenda<br>
08
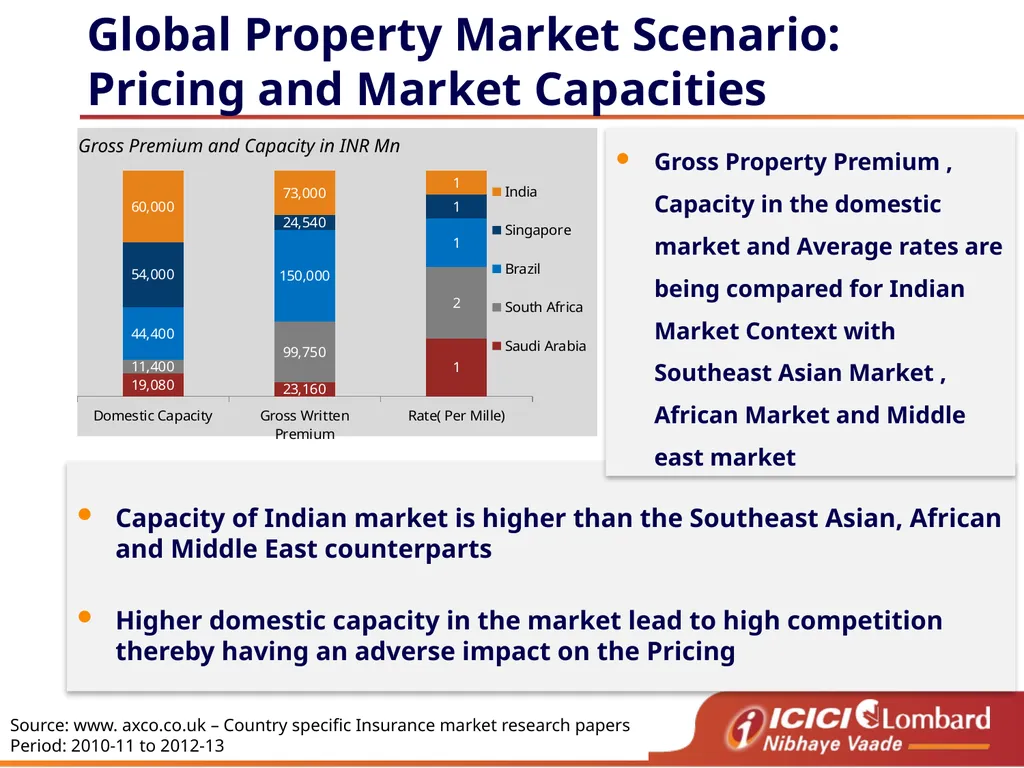
Global Property Market Scenario: Pricing and Market Capacities Capacity of Indian market is higher than the Southeast Asian, African and Middle East counterparts
Higher domestic capacity in the market lead to high competition thereby having an adverse impact on the Pricing Gross Property Premium , Capacity in the domestic market and Average rates are being compared for Indian Market Context with Southeast Asian Market , African Market and Middle east market Source: www. axco.co.uk – Country specific Insurance market research papers
Period: 2010-11 to 2012-13 Gross Premium and Capacity in INR Mn<br>
09
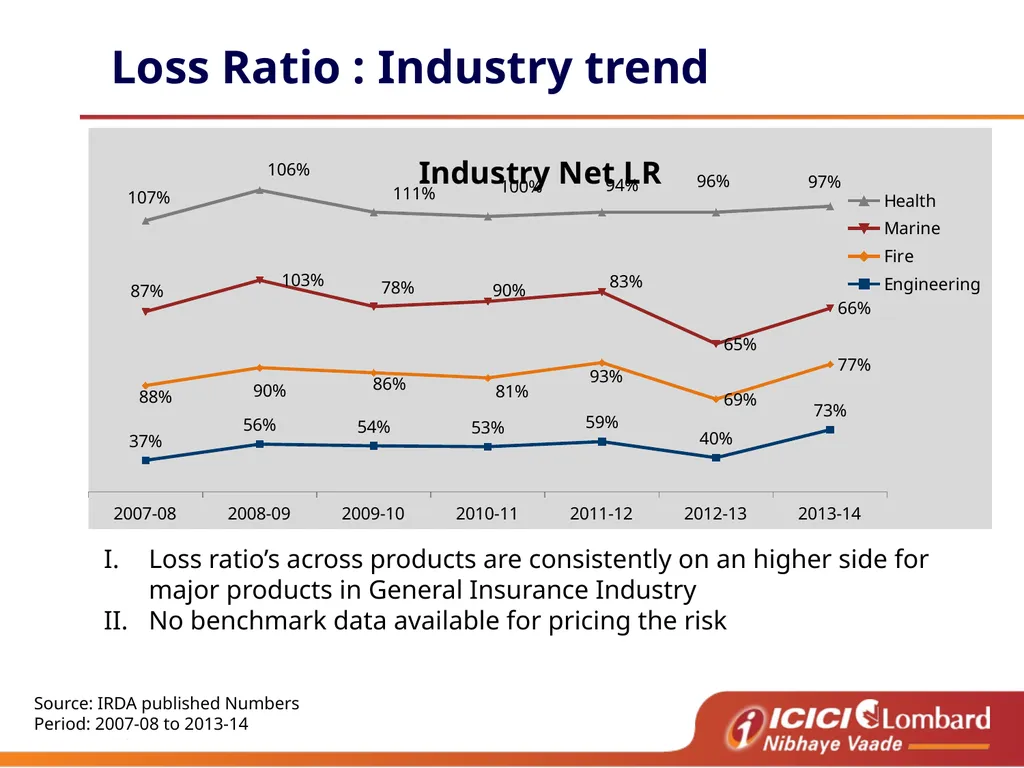
Loss Ratio : Industry trend Source: IRDA published Numbers
Period: 2007-08 to 2013-14 Loss ratio’s across products are consistently on an higher side for major products in General Insurance Industry
No benchmark data available for pricing the risk<br>
10
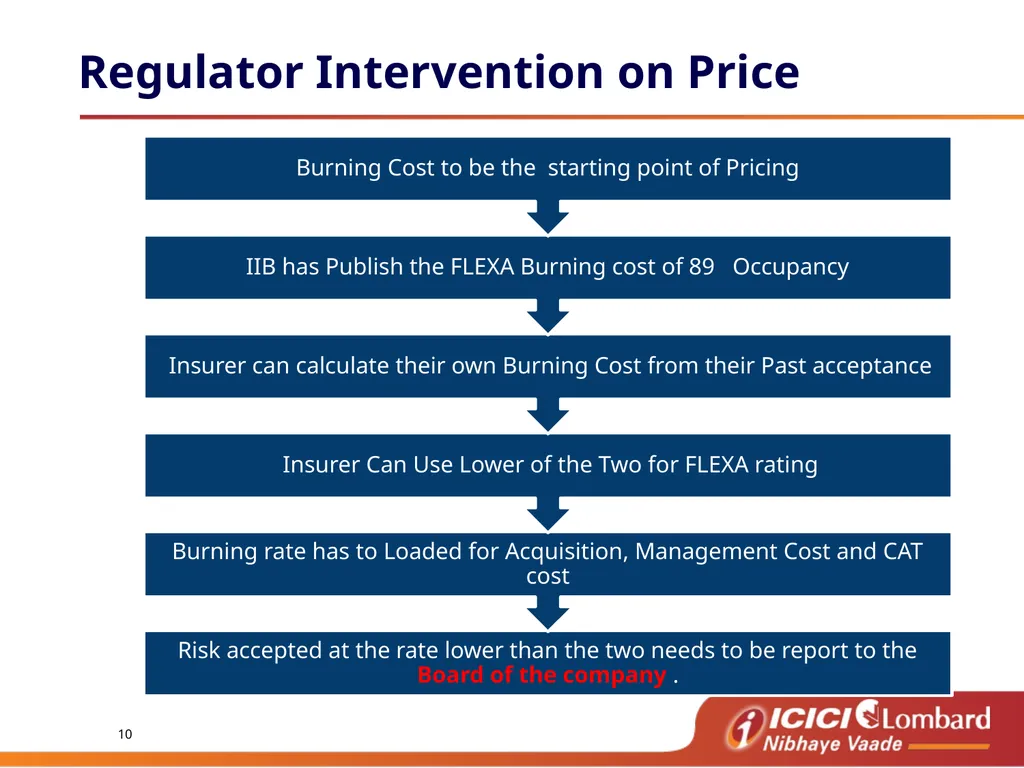
Regulator Intervention on Price<br>
11
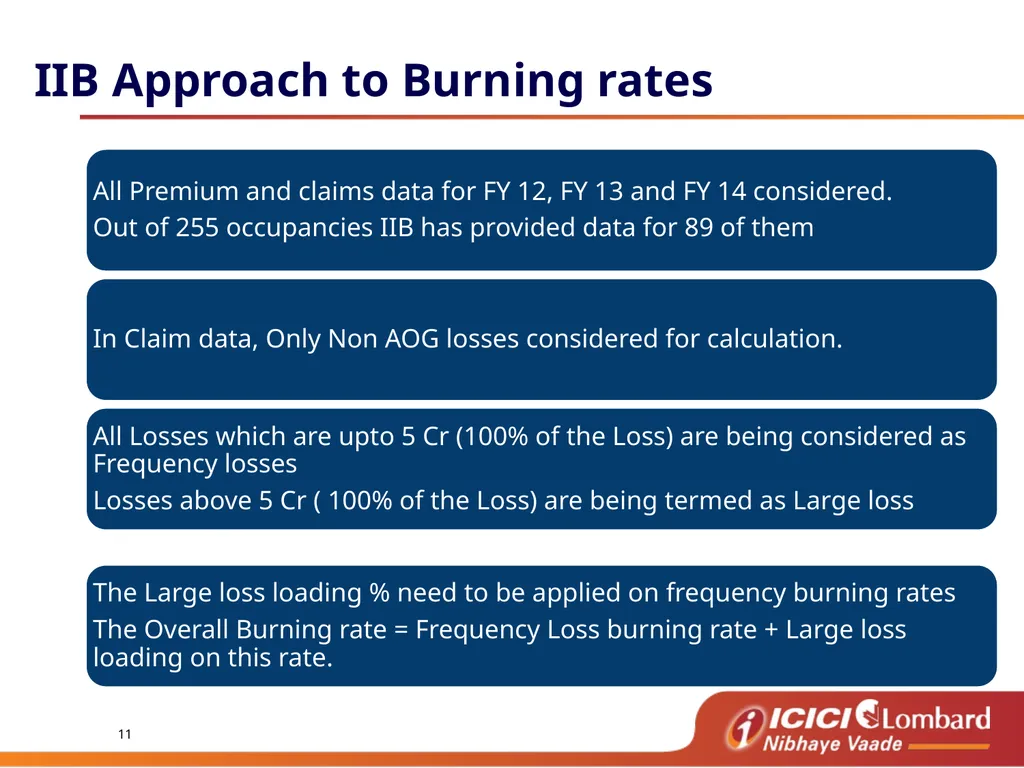
IIB Approach to Burning rates<br>
12
Agenda<br>
13
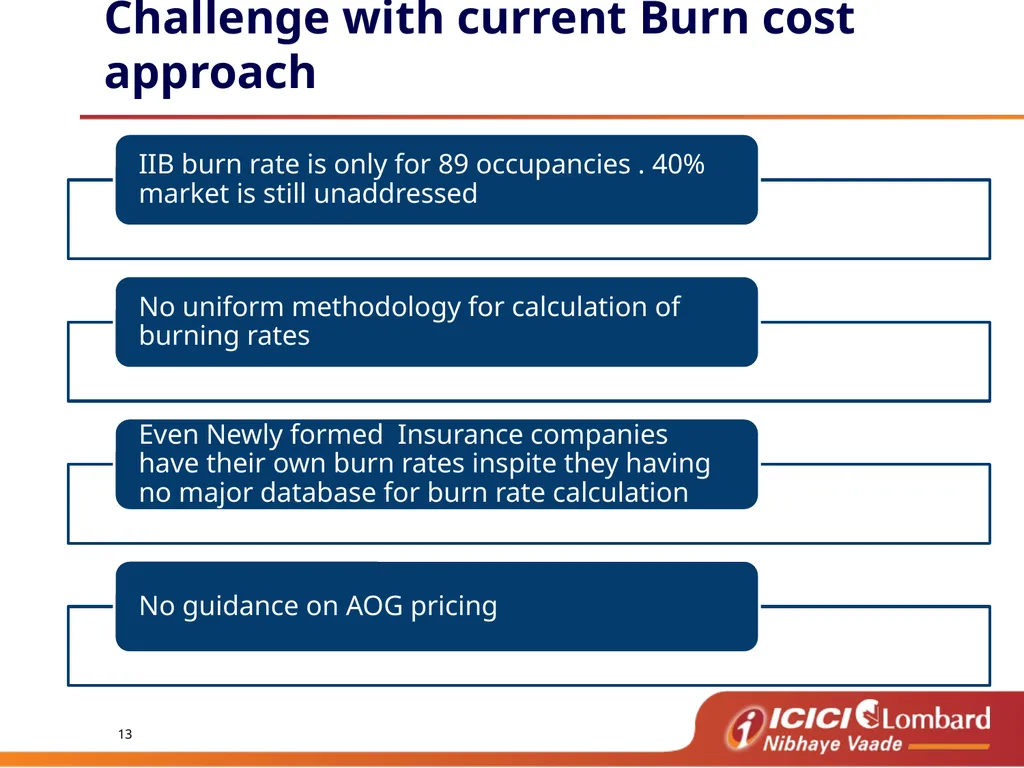
Challenge with current Burn cost approach<br>
14
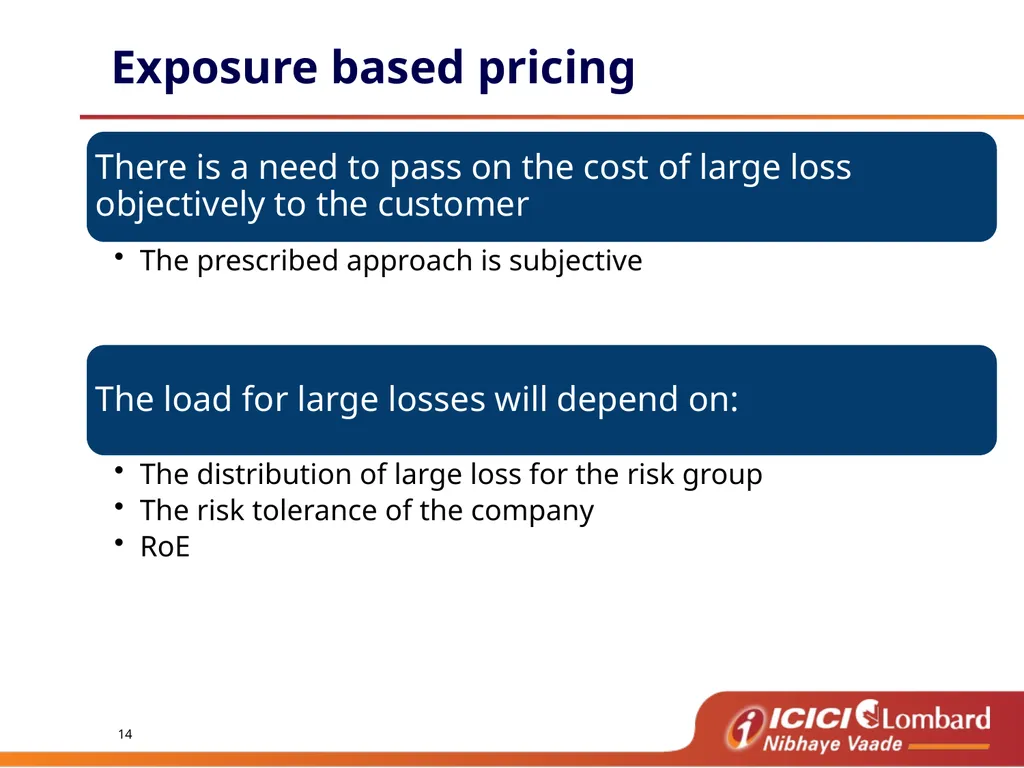
Exposure based pricing<br>
15
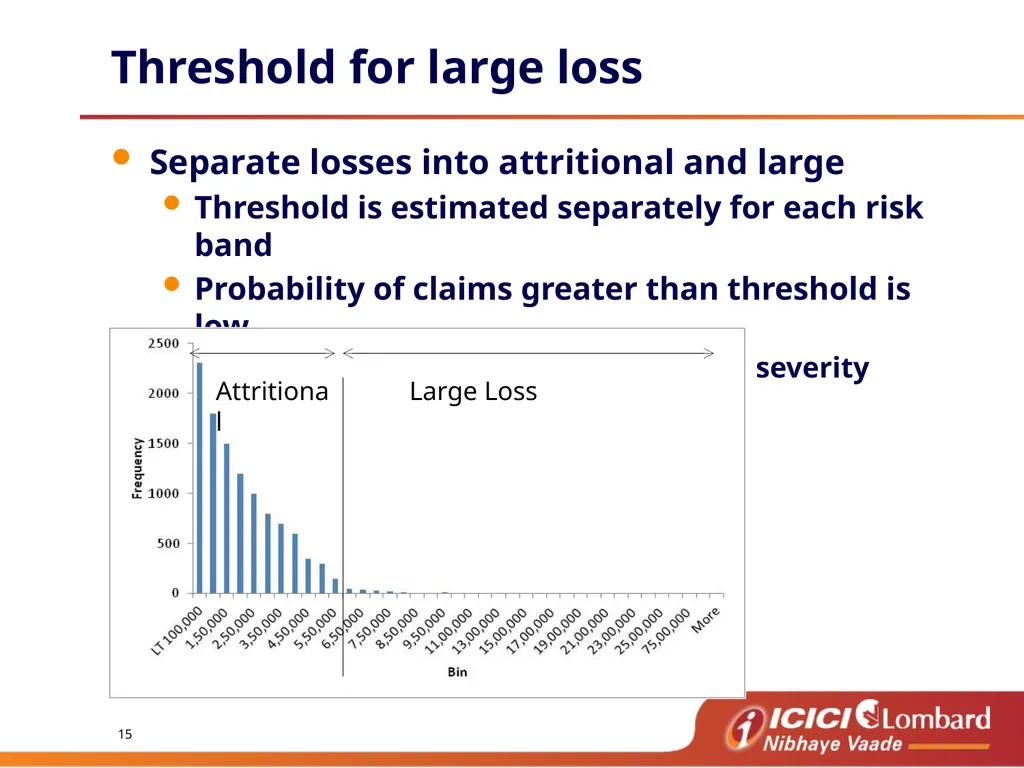
Threshold for large loss Separate losses into attritional and large
Threshold is estimated separately for each risk band
Probability of claims greater than threshold is low
Large losses are low frequency-high severity Attritional Large Loss<br>
16
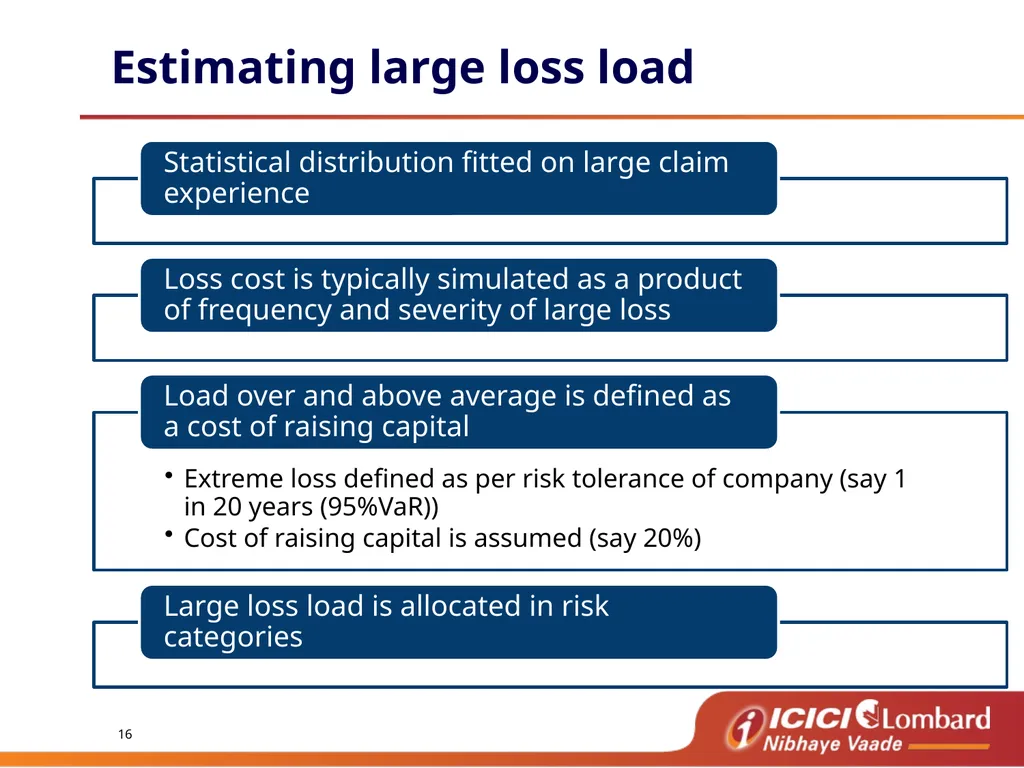
Estimating large loss load<br>
17
Agenda<br>
18
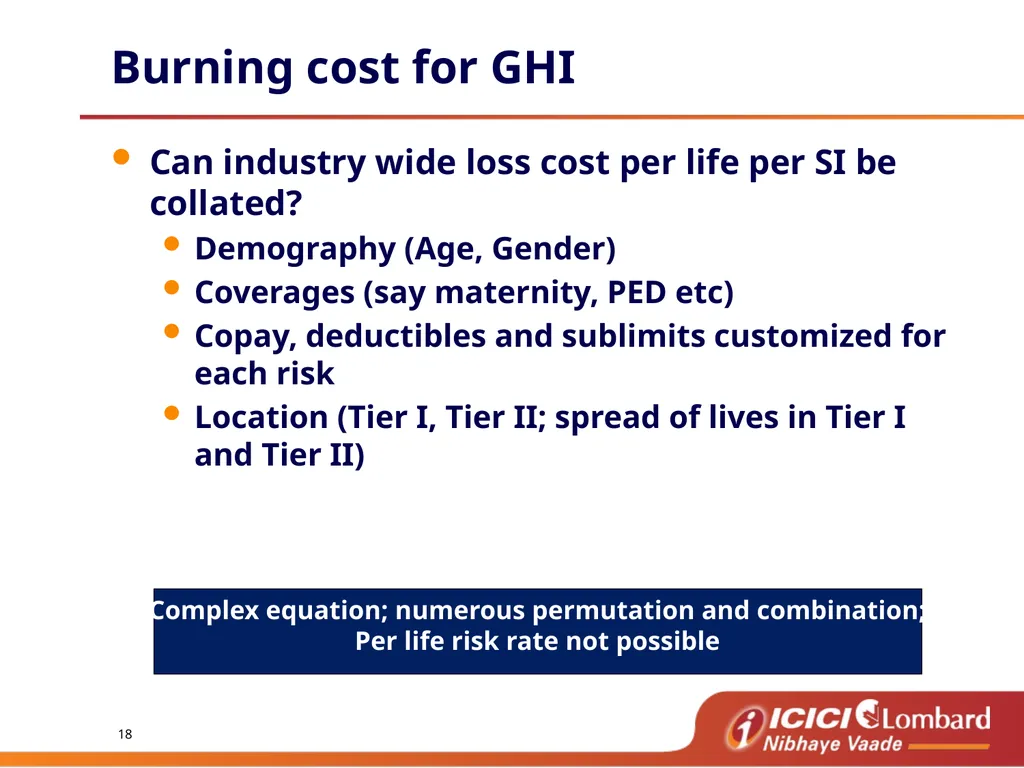
Burning cost for GHI Can industry wide loss cost per life per SI be collated?
Demography (Age, Gender)
Coverages (say maternity, PED etc)
Copay, deductibles and sublimits customized for each risk
Location (Tier I, Tier II; spread of lives in Tier I and Tier II) Complex equation; numerous permutation and combination;
Per life risk rate not possible<br>
19
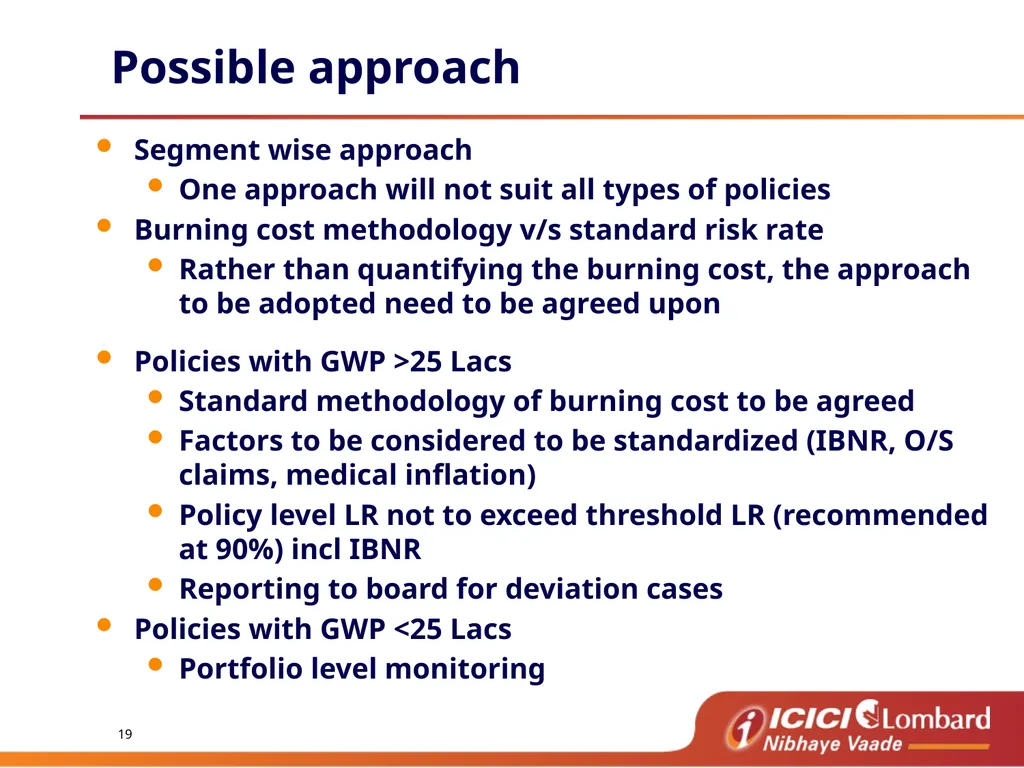
Possible approach Segment wise approach
One approach will not suit all types of policies
Burning cost methodology v/s standard risk rate
Rather than quantifying the burning cost, the approach to be adopted need to be agreed upon
Policies with GWP >25 Lacs
Standard methodology of burning cost to be agreed
Factors to be considered to be standardized (IBNR, O/S claims, medical inflation)
Policy level LR not to exceed threshold LR (recommended at 90%) incl IBNR
Reporting to board for deviation cases
Policies with GWP <25 Lacs
Portfolio level monitoring<br>