
Business Intelligence, Analytics, and Data
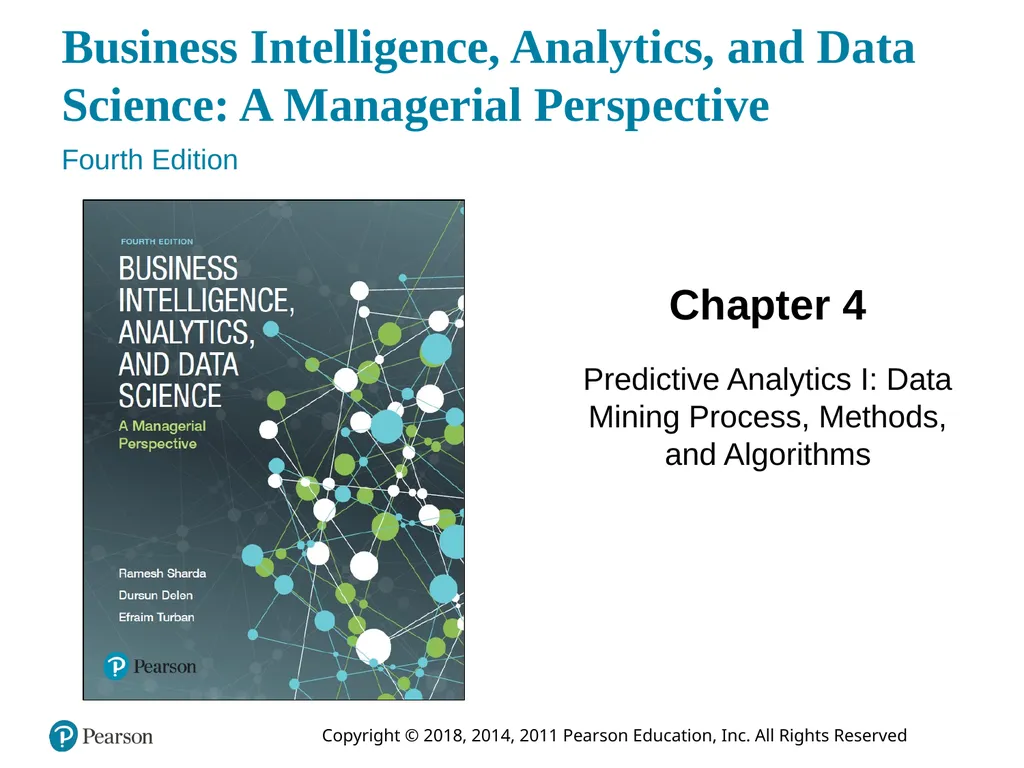
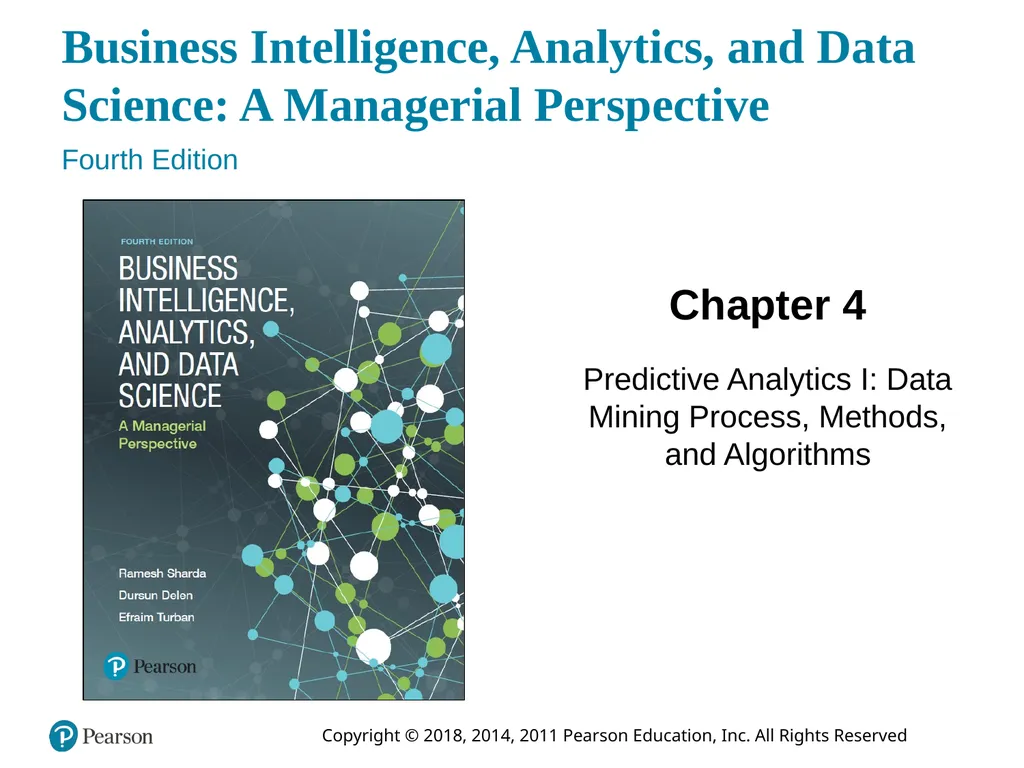

Description: Business Intelligence, Analytics, and Data Science: A Managerial Perspective Fourth Edition Chapter 4 Predictive Analytics I: Data Mining Process, Methods, and Algorithms Copyright 2018, 2014, 2011 Pearson Education, Inc. All Rights
Related Topics
Download Presentation
"Business Intelligence, Analytics, and Data" is the property of its rightful owner. Permission is granted to download and print the materials on this website for personal, non-commercial use only, and to display it on your personal computer provided you do not modify the materials and that you retain all copyright notices contained in the materials. By downloading content from our website, you accept the terms of this agreement.
Presentation Transcript
slide1. Business Intelligence, Analytics, and Data Science: A Managerial Perspective Fourth Edition Chapter 4 Predictive Analytics I: Data Mining Process, Methods, and Algorithms Copyright © 2018, 2014, 2011 Pearson Education, Inc. All Rights Reserved<br>
slide2. Learning Objectives (1 of 2) 4.1 Define data mining as an enabling technology for business analytics
4.2 Understand the objectives and benefits of data mining
4.3 Become familiar with the wide range of applications of data mining
4.4 Learn the standardized data mining processes
4.5 Learn different methods and algorithms of data mining<br>
slide3. Learning Objectives (2 of 2) 4.6 Build awareness of the existing data mining software tools
4.7 Understand the privacy issues, pitfalls, and myths of data mining<br>
slide4. Opening Vignette (1 of 3) Miami-Dade Police Department Is Using Predictive Analytics to Foresee and Fight Crime Predictive analytics in law enforcement
Policing with less
New thinking on cold cases
The big picture starts small
Success brings credibility
Just for the facts
Safer streets for smarter cities<br>
slide5. Opening Vignette (2 of 3) Discussion Questions
Why do law enforcement agencies and departments like Miami-Dade Police Department embrace advanced analytics and data mining?
What are the top challenges for law enforcement agencies and departments like Miami-Dade Police Department? Can you think of other challenges (not mentioned in this case) that can benefit from data mining?<br>
slide6. Opening Vignette (3 of 3) What are the sources of data that law enforcement agencies and departments like Miami-Dade Police Department use for their predictive modeling and data mining projects?
What type of analytics do law enforcement agencies and departments like Miami-Dade Police Department use to fight crime?
What does “the big picture starts small” mean in this case? Explain.<br>
slide7. Data Mining Concepts and Definitions Why Data Mining? More intense competition at the global scale.
Recognition of the value in data sources.
Availability of quality data on customers, vendors, transactions, Web, etc.
Consolidation and integration of data repositories into data warehouses.
The exponential increase in data processing and storage capabilities; and decrease in cost.
Movement toward conversion of information resources into nonphysical form.<br>
slide8. Definition of Data Mining The nontrivial process of identifying valid, novel, potentially useful, and ultimately understandable patterns in data stored in structured databases.
– Fayyad et al., (1996)
Keywords in this definition: Process, nontrivial, valid, novel, potentially useful, understandable.
Data mining: a misnomer?
Other names: knowledge extraction, pattern analysis, knowledge discovery, information harvesting, pattern searching, data dredging,…<br>
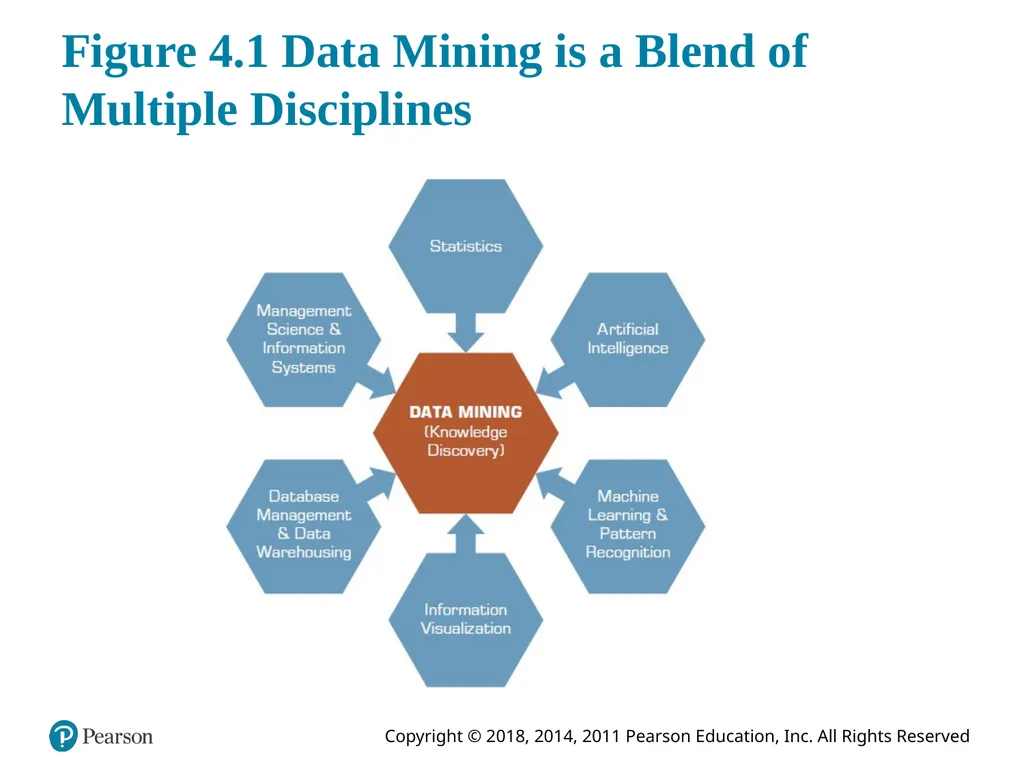
slide9. Figure 4.1 Data Mining is a Blend of Multiple Disciplines<br>
slide10. Application Case 4.1 Visa Is Enhancing the Customer Experience While Reducing Fraud with Predictive Analytics and Data Mining
Questions for Discussion
What challenges were Visa and the rest of the credit card industry facing?
How did Visa improve customer service while also improving retention of fraud?
What is in-memory analytics, and why was it necessary?<br>
slide11. Data Mining Characteristics & Objectives Source of data for D M is often a consolidated data warehouse (not always!).
D M environment is usually a client-server or a Web-based information systems architecture.
Data is the most critical ingredient for D M which may include soft/unstructured data.
The miner is often an end user.
Striking it rich requires creative thinking.
Data mining tools’ capabilities and ease of use are essential (Web, Parallel processing, etc.).<br>
slide12. How Data Mining Works D M extract patterns from data
Pattern? A mathematical (numeric and/or symbolic) relationship among data items
Types of patterns
Association
Prediction
Cluster (segmentation)
Sequential (or time series) relationships<br>
slide13. Application Case 4.2 Dell Is Staying Agile and Effective with Analytics in the 21st Century
Questions for Discussion
What was the challenge Dell was facing that led to their analytics journey?
What solution did Dell develop and implement? What were the results?
As an analytics company itself, Dell has used its service offerings for its own business. Do you think it is easier or harder for a company to taste its own medicine? Explain.<br>
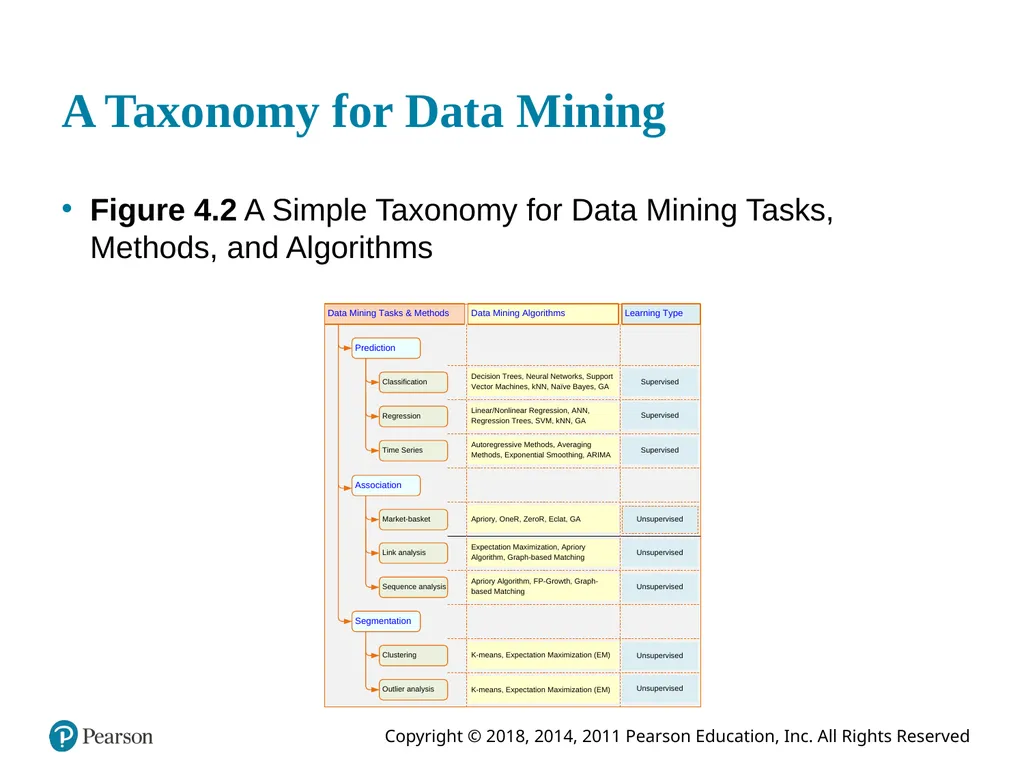
slide14. A Taxonomy for Data Mining Figure 4.2 A Simple Taxonomy for Data Mining Tasks, Methods, and Algorithms<br>
slide15. Other Data Mining Patterns/Tasks Time-series forecasting
Part of the sequence or link analysis?
Visualization
Another data mining task?
Covered in Chapter 3
Data Mining versus Statistics
Are they the same?
What is the relationship between the two?<br>
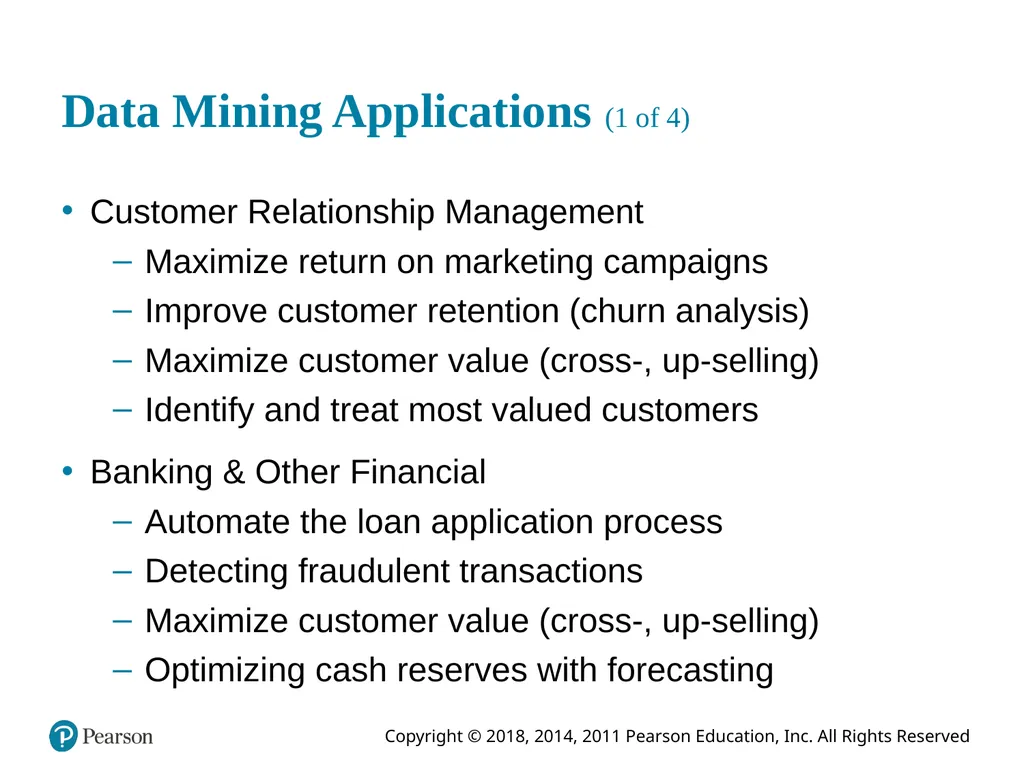
slide16. Data Mining Applications (1 of 4) Customer Relationship Management
Maximize return on marketing campaigns
Improve customer retention (churn analysis)
Maximize customer value (cross-, up-selling)
Identify and treat most valued customers
Banking & Other Financial
Automate the loan application process
Detecting fraudulent transactions
Maximize customer value (cross-, up-selling)
Optimizing cash reserves with forecasting<br>
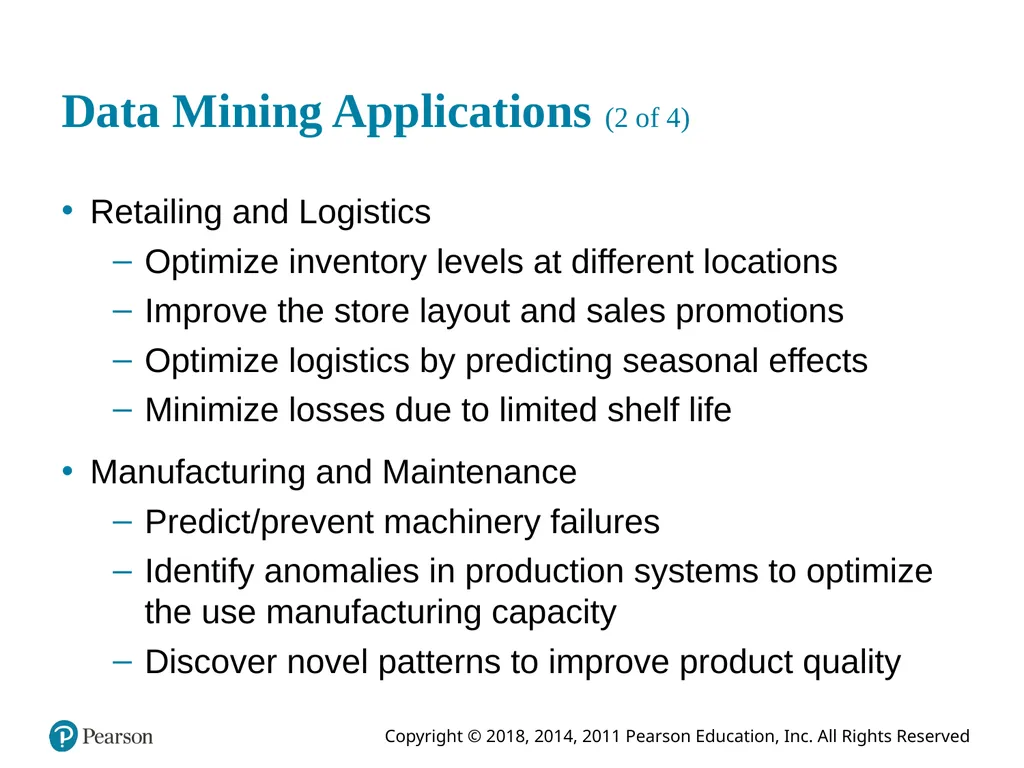
slide17. Data Mining Applications (2 of 4) Retailing and Logistics
Optimize inventory levels at different locations
Improve the store layout and sales promotions
Optimize logistics by predicting seasonal effects
Minimize losses due to limited shelf life
Manufacturing and Maintenance
Predict/prevent machinery failures
Identify anomalies in production systems to optimize the use manufacturing capacity
Discover novel patterns to improve product quality<br>
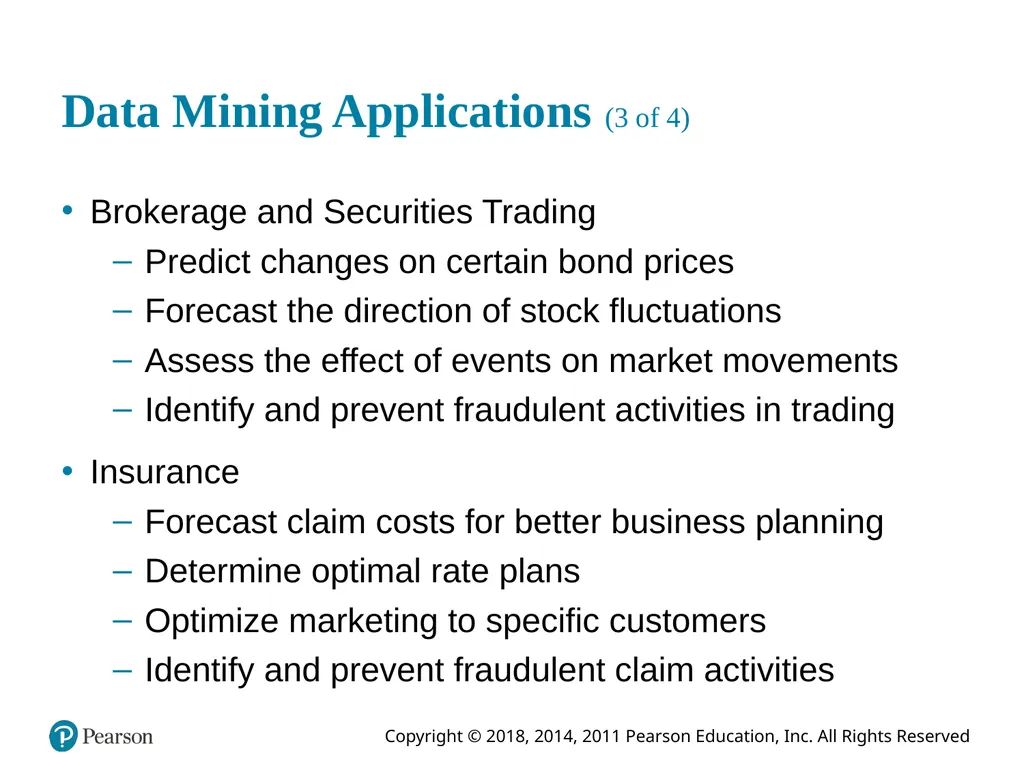
slide18. Data Mining Applications (3 of 4) Brokerage and Securities Trading
Predict changes on certain bond prices
Forecast the direction of stock fluctuations
Assess the effect of events on market movements
Identify and prevent fraudulent activities in trading
Insurance
Forecast claim costs for better business planning
Determine optimal rate plans
Optimize marketing to specific customers
Identify and prevent fraudulent claim activities<br>
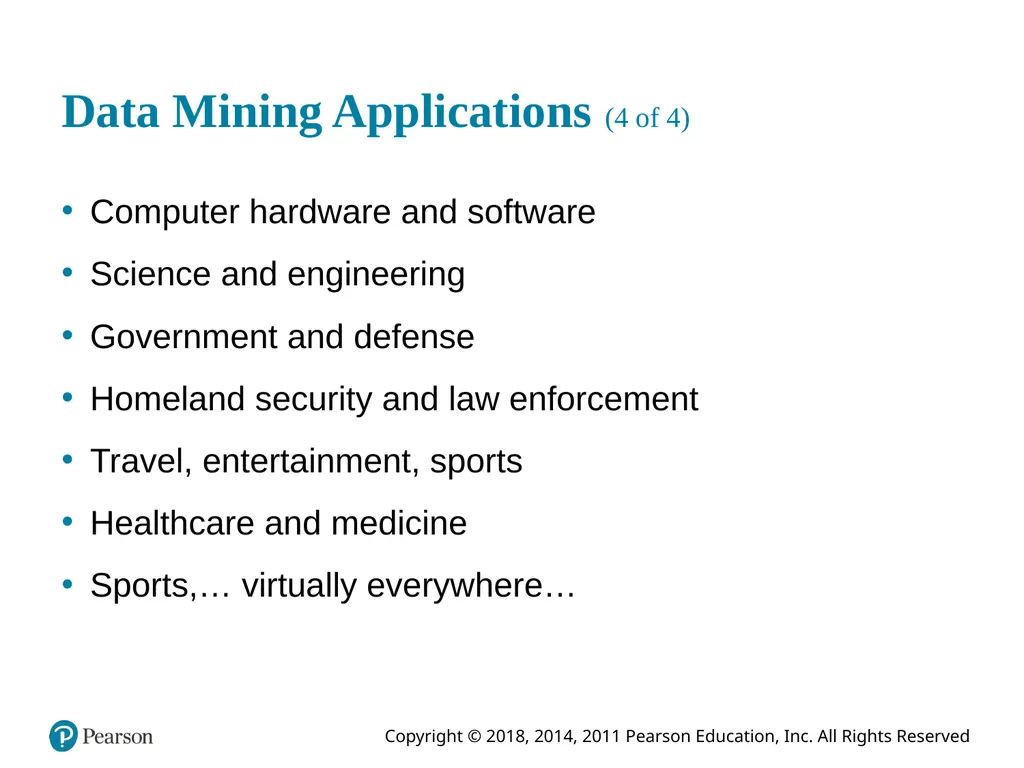
slide19. Data Mining Applications (4 of 4) Computer hardware and software
Science and engineering
Government and defense
Homeland security and law enforcement
Travel, entertainment, sports
Healthcare and medicine
Sports,… virtually everywhere…<br>
slide20. Application Case 4.3 Predictive Analytic and Data Mining Help Stop Terrorist Funding
Questions for Discussion
How can data mining be used to fight terrorism? Comment on what else can be done beyond what is covered in this short application case.
Do you think data mining, although essential for fighting terrorist cells, also jeopardizes individuals’ rights of privacy?<br>
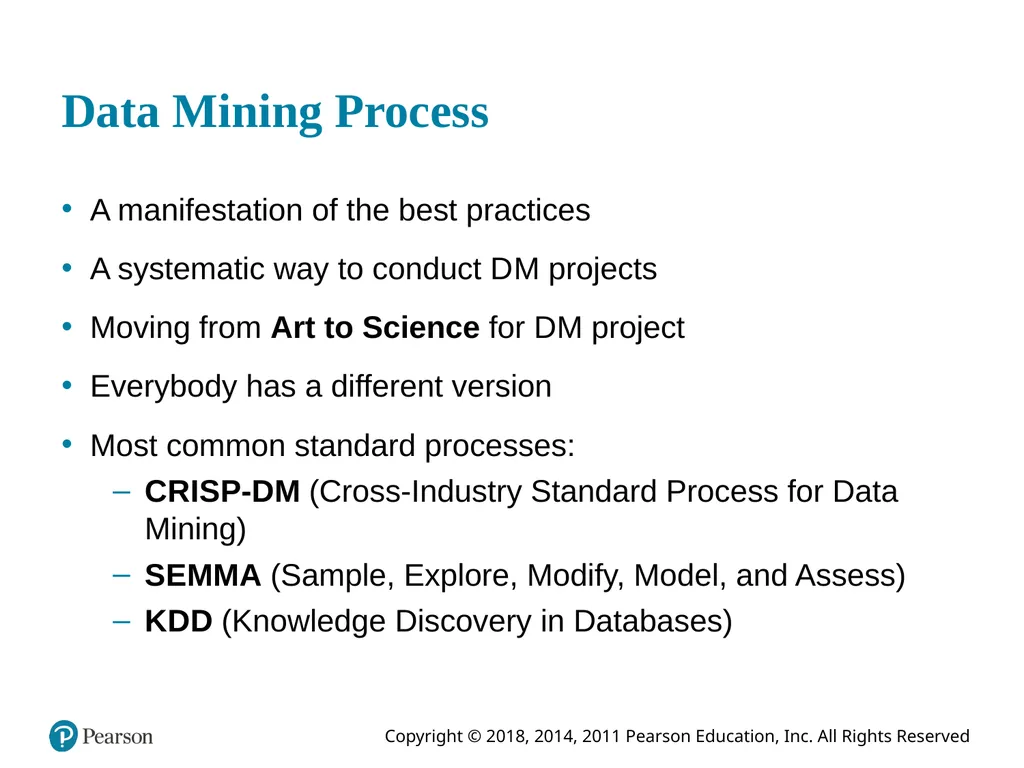
slide21. Data Mining Process A manifestation of the best practices
A systematic way to conduct D M projects
Moving from Art to Science for D M project
Everybody has a different version
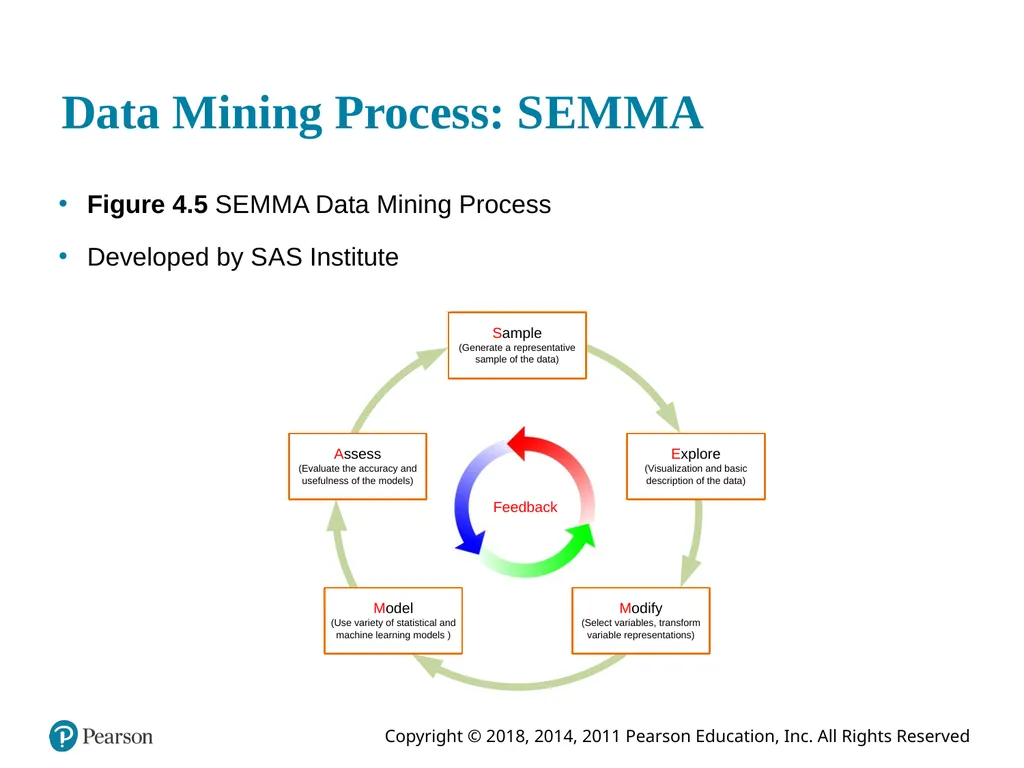
Most common standard processes:
C R I S P-D M (Cross-Industry Standard Process for Data Mining)
S E M M A (Sample, Explore, Modify, Model, and Assess)
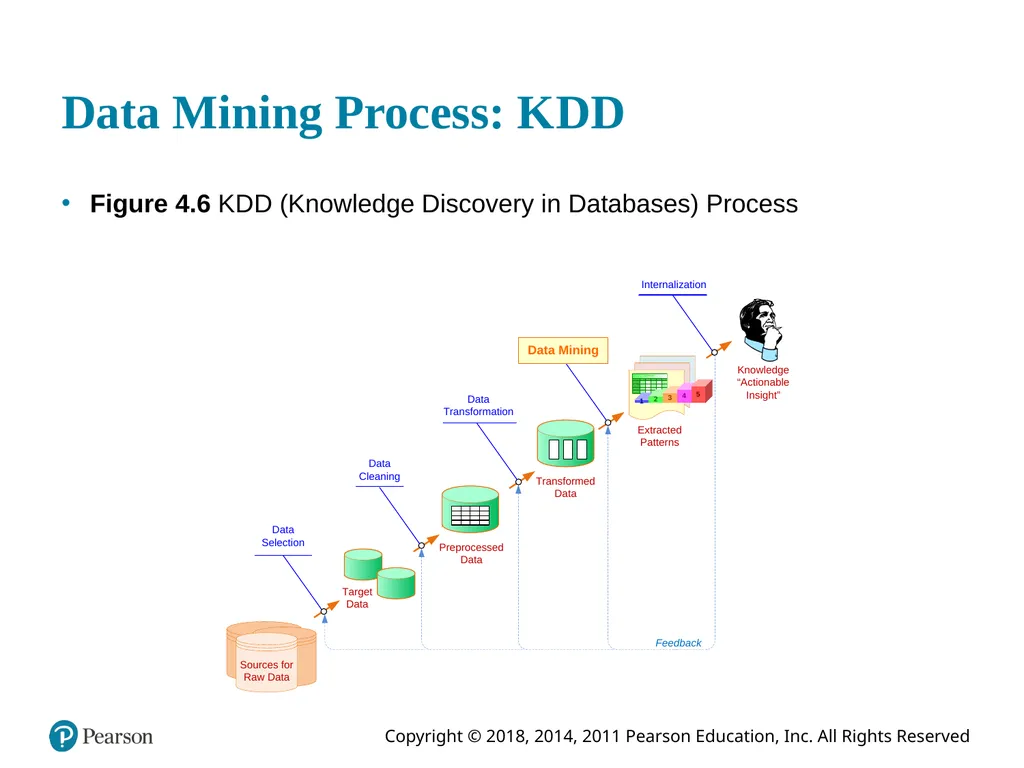
K D D (Knowledge Discovery in Databases)<br>
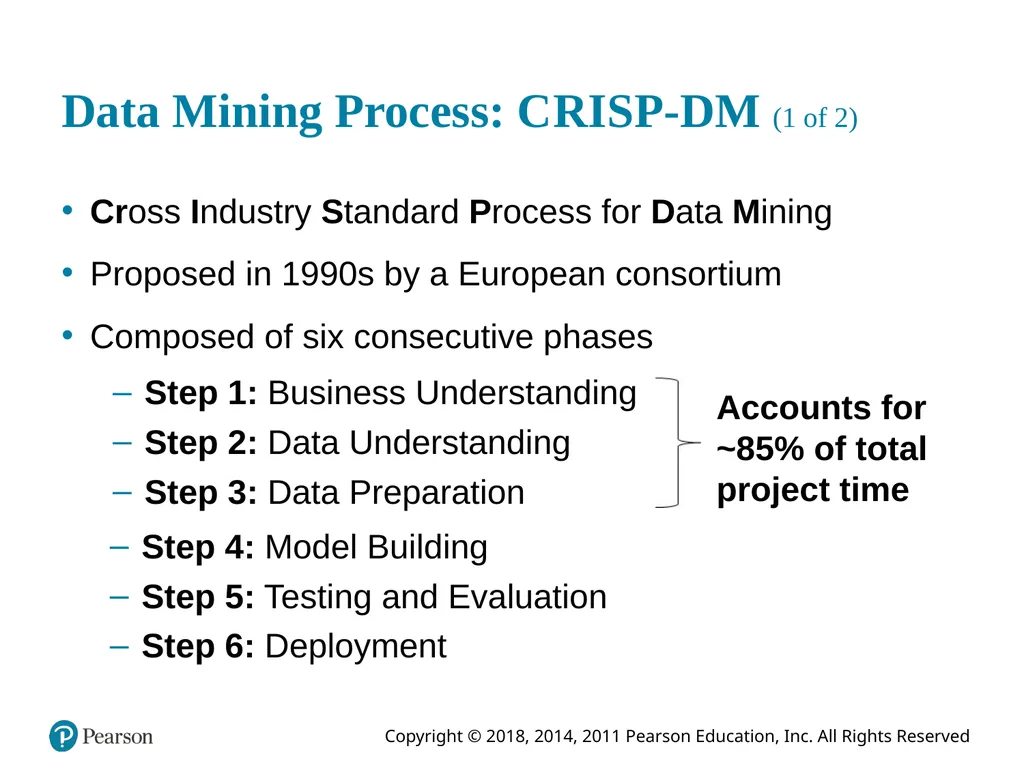
slide22. Data Mining Process: C R I S P-D M (1 of 2) Cross Industry Standard Process for Data Mining
Proposed in 1990s by a European consortium
Composed of six consecutive phases Step 1: Business Understanding
Step 2: Data Understanding
Step 3: Data Preparation Accounts for ~85% of total project time Step 4: Model Building
Step 5: Testing and Evaluation
Step 6: Deployment<br>
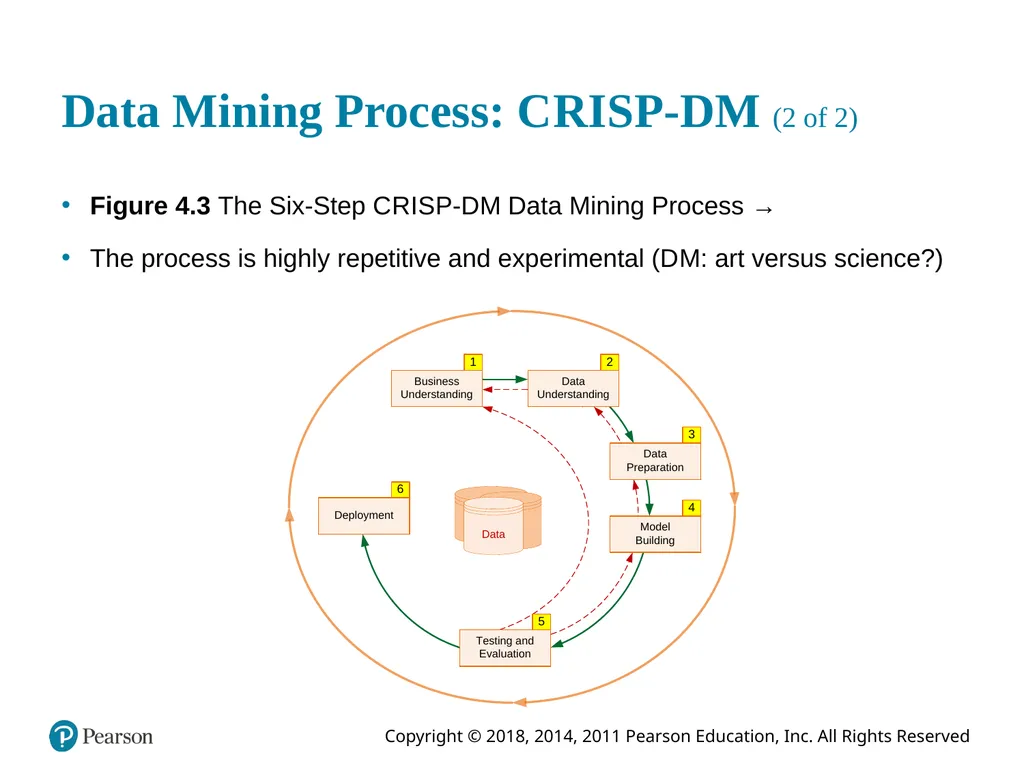
slide23. Data Mining Process: C R I S P-D M (2 of 2) Figure 4.3 The Six-Step C R I S P-D M Data Mining Process →
The process is highly repetitive and experimental (D M: art versus science?)<br>
slide24. Data Mining Process: S E M M A Figure 4.5 S E M M A Data Mining Process
Developed by S A S Institute<br>
slide25. Data Mining Process: K D D Figure 4.6 K D D (Knowledge Discovery in Databases) Process<br>
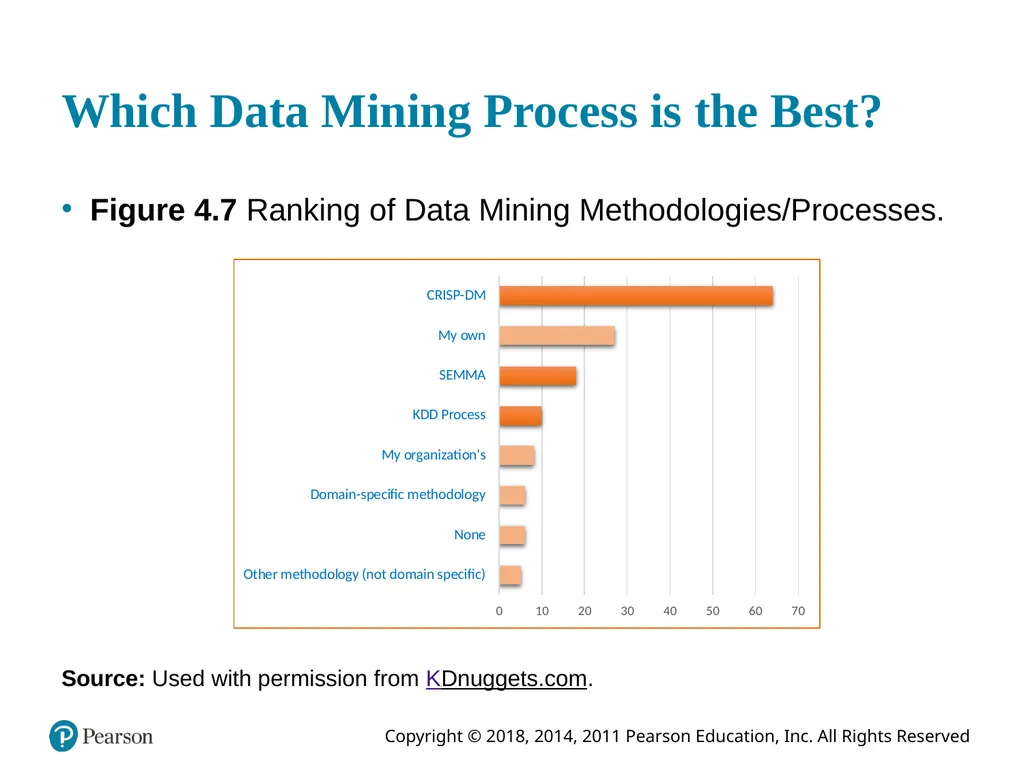
slide26. Which Data Mining Process is the Best? Figure 4.7 Ranking of Data Mining Methodologies/Processes. Source: Used with permission from K Dnuggets.com.<br>
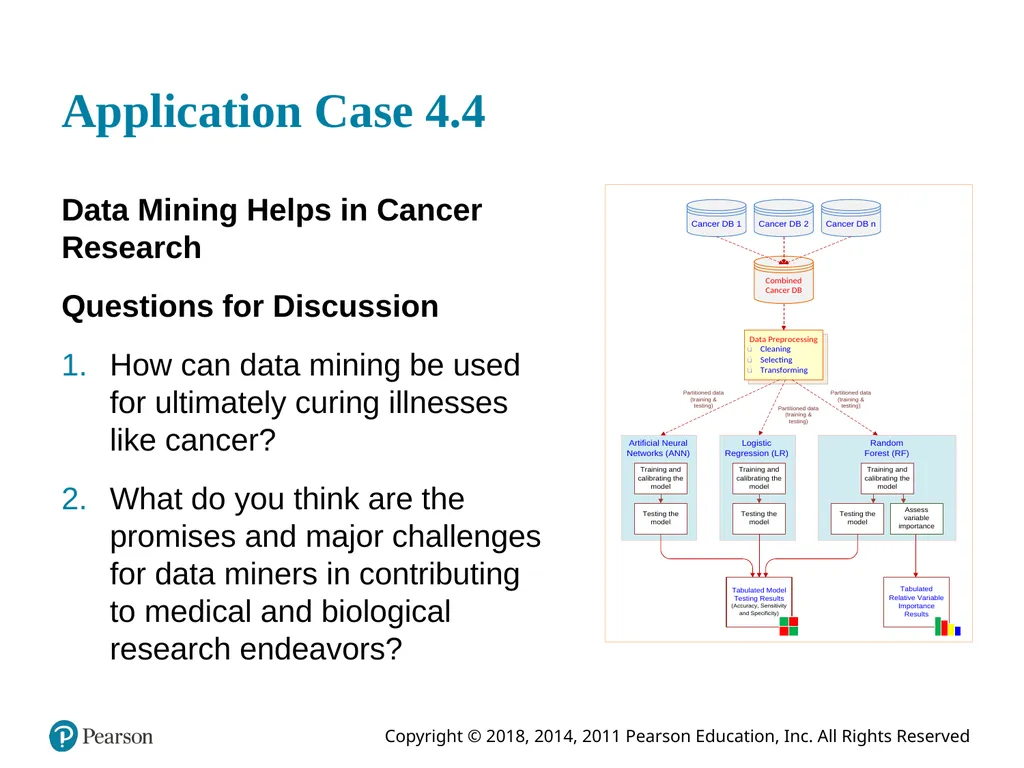
slide27. Application Case 4.4 Data Mining Helps in Cancer Research
Questions for Discussion
How can data mining be used for ultimately curing illnesses like cancer?
What do you think are the promises and major challenges for data miners in contributing to medical and biological research endeavors?<br>
slide28. Data Mining Methods: Classification Most frequently used D M method
Part of the machine-learning family
Employ supervised learning
Learn from past data, classify new data
The output variable is categorical (nominal or ordinal) in nature
Classification versus regression?
Classification versus clustering?<br>
slide29. Assessment Methods for Classification Predictive accuracy
Hit rate
Speed
Model building versus predicting/usage speed
Robustness
Scalability
Interpretability
Transparency, explainability<br>
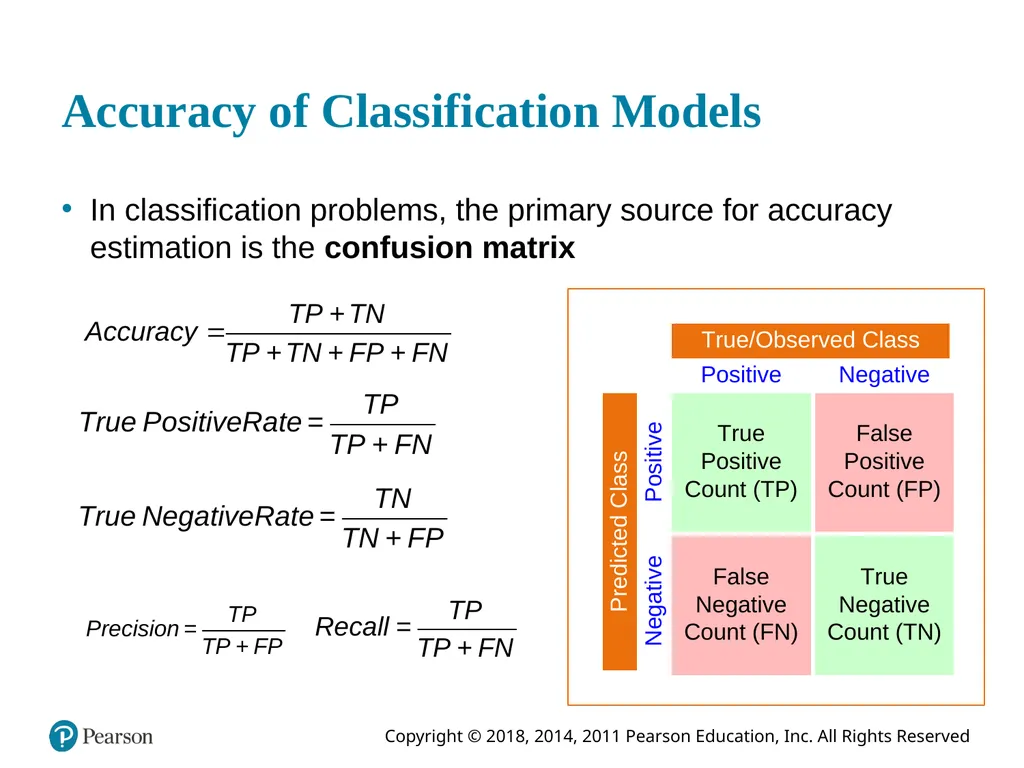
slide30. Accuracy of Classification Models In classification problems, the primary source for accuracy estimation is the confusion matrix<br>
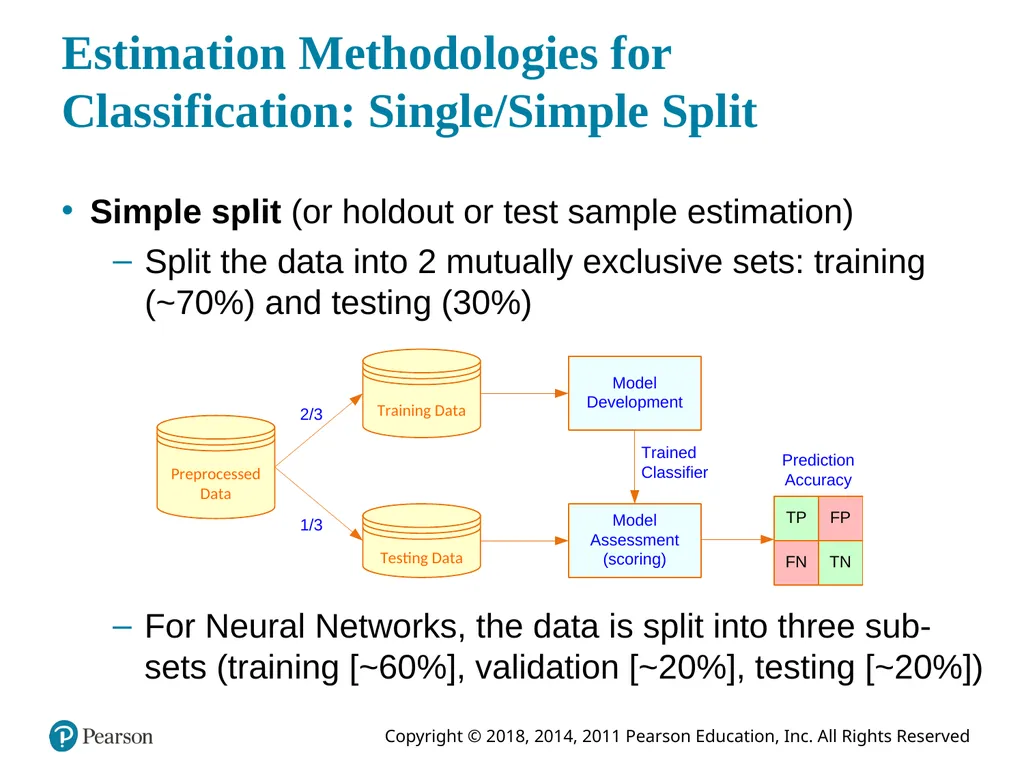
slide31. Estimation Methodologies for Classification: Single/Simple Split Simple split (or holdout or test sample estimation)
Split the data into 2 mutually exclusive sets: training (~70%) and testing (30%) For Neural Networks, the data is split into three sub-sets (training [~60%], validation [~20%], testing [~20%])<br>
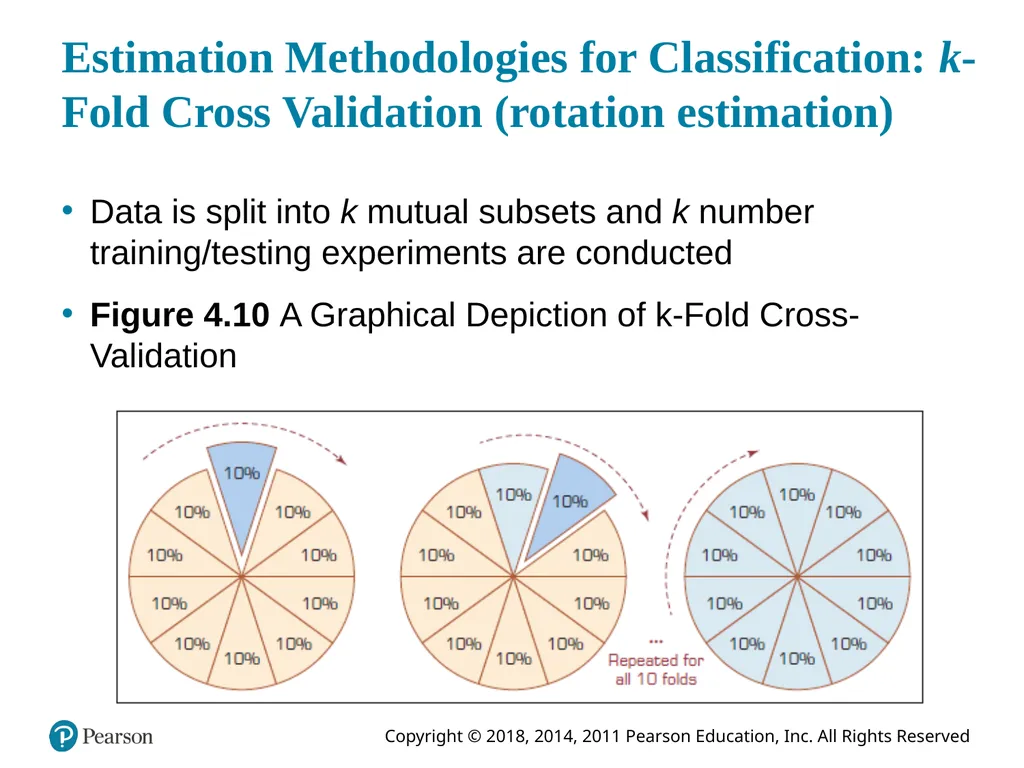
slide32. Estimation Methodologies for Classification: k-Fold Cross Validation (rotation estimation) Data is split into k mutual subsets and k number training/testing experiments are conducted
Figure 4.10 A Graphical Depiction of k-Fold Cross-Validation<br>
slide33. Additional Estimation Methodologies for Classification Leave-one-out
Similar to k-fold where k = number of samples
Bootstrapping
Random sampling with replacement
Jackknifing
Similar to leave-one-out
Area Under the R O C Curve (A U C)
R O C: receiver operating characteristics (a term borrowed from radar image processing)<br>
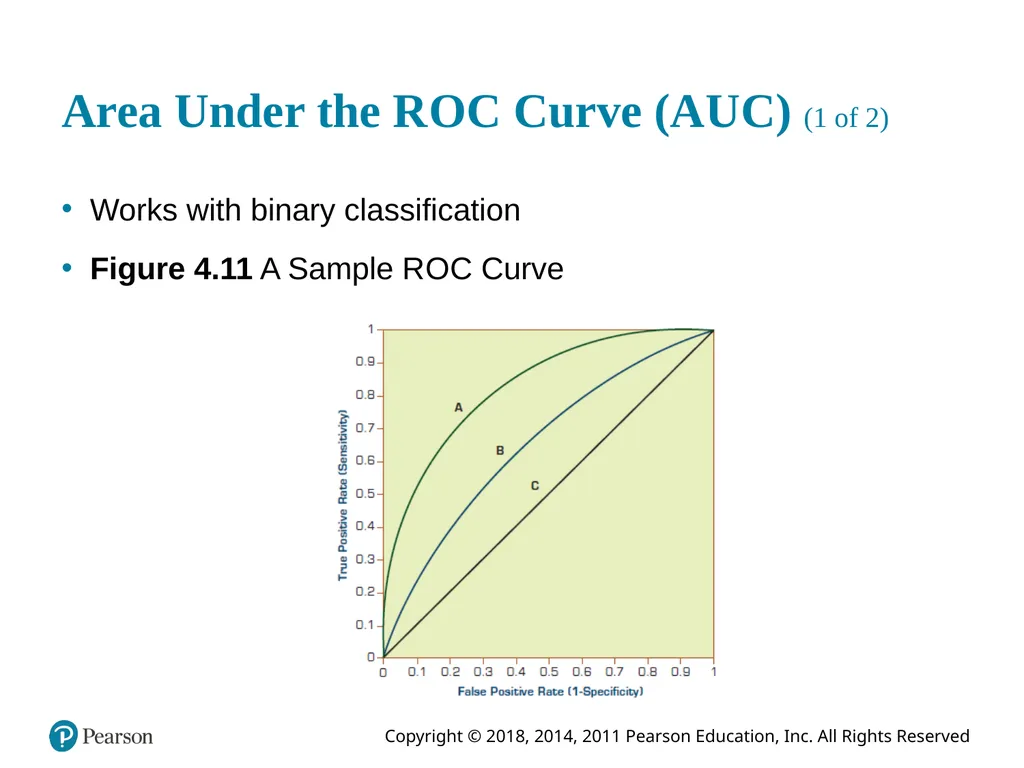
slide34. Area Under the R O C Curve (A U C) (1 of 2) Works with binary classification
Figure 4.11 A Sample R O C Curve<br>
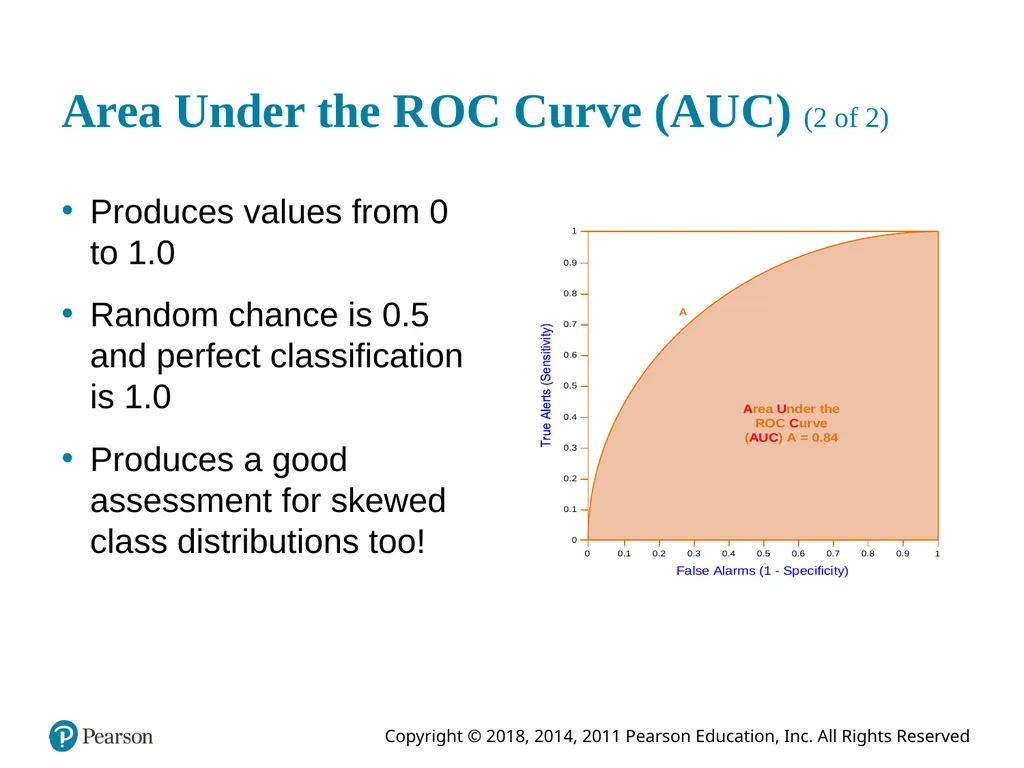
slide35. Area Under the R O C Curve (A U C) (2 of 2) Produces values from 0 to 1.0
Random chance is 0.5 and perfect classification is 1.0
Produces a good assessment for skewed class distributions too!<br>
slide36. Classification Techniques Decision tree analysis
Statistical analysis
Neural networks
Support vector machines
Case-based reasoning
Bayesian classifiers
Genetic algorithms
Rough sets<br>
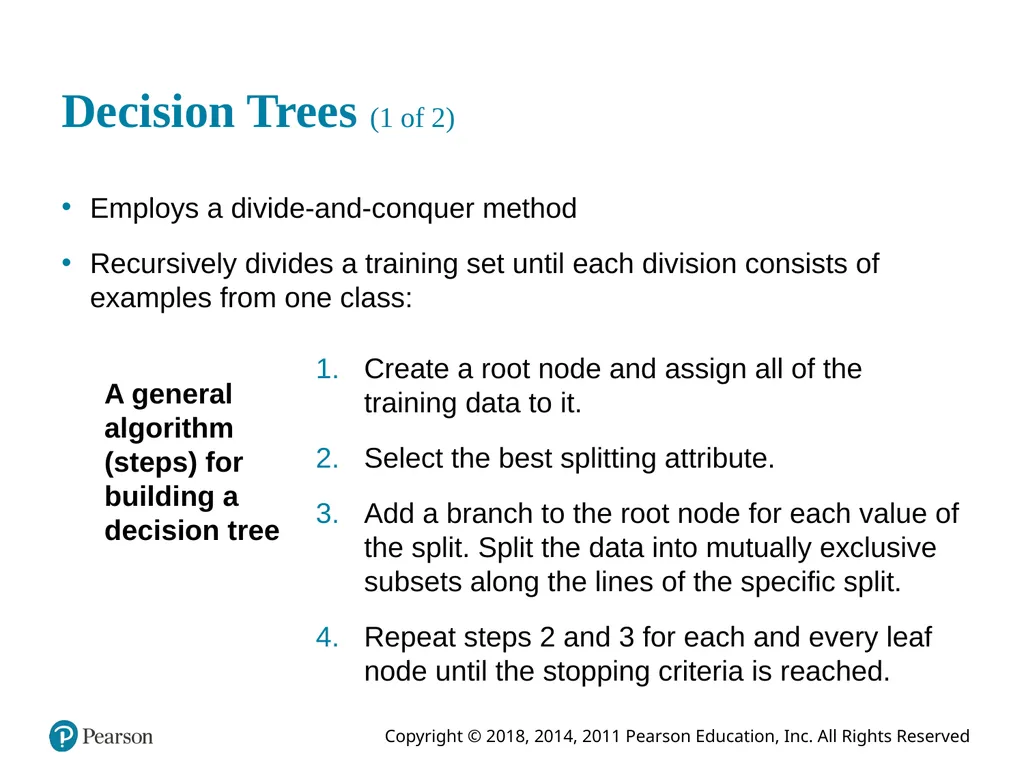
slide37. Decision Trees (1 of 2) Employs a divide-and-conquer method
Recursively divides a training set until each division consists of examples from one class: A general algorithm (steps) for building a decision tree Create a root node and assign all of the training data to it.
Select the best splitting attribute.
Add a branch to the root node for each value of the split. Split the data into mutually exclusive subsets along the lines of the specific split.
Repeat steps 2 and 3 for each and every leaf node until the stopping criteria is reached.<br>
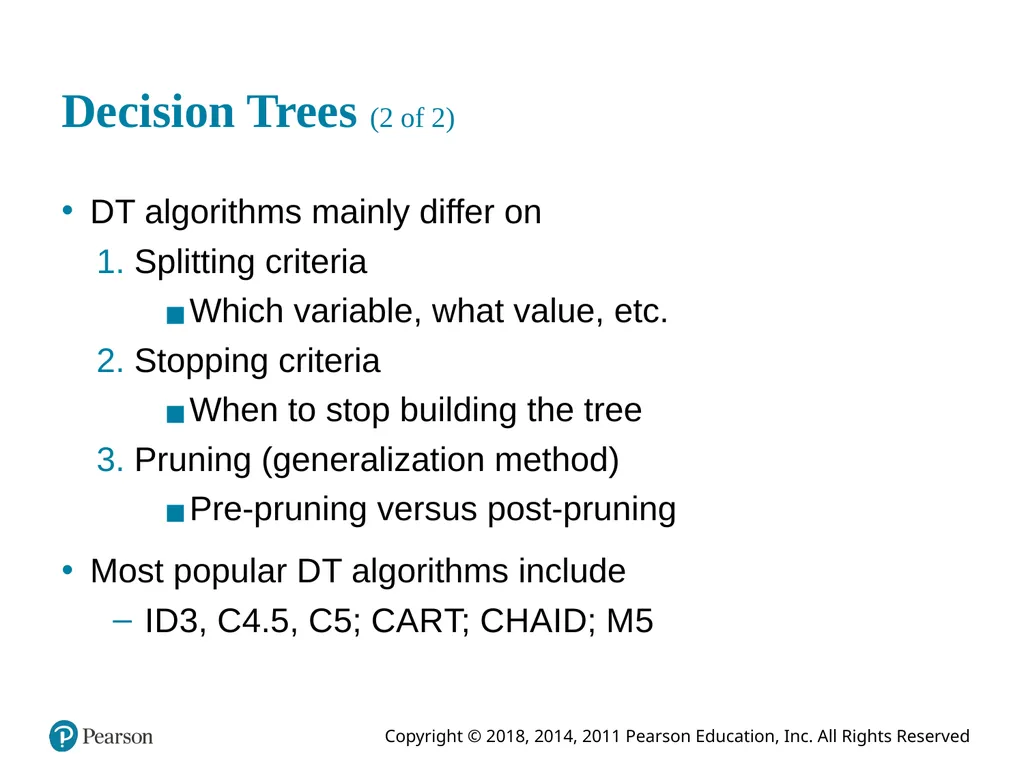
slide38. Decision Trees (2 of 2) D T algorithms mainly differ on
1. Splitting criteria
Which variable, what value, etc.
2. Stopping criteria
When to stop building the tree
3. Pruning (generalization method)
Pre-pruning versus post-pruning
Most popular D T algorithms include
I D 3, C 4.5, C 5; C A R T; C H A I D; M 5<br>
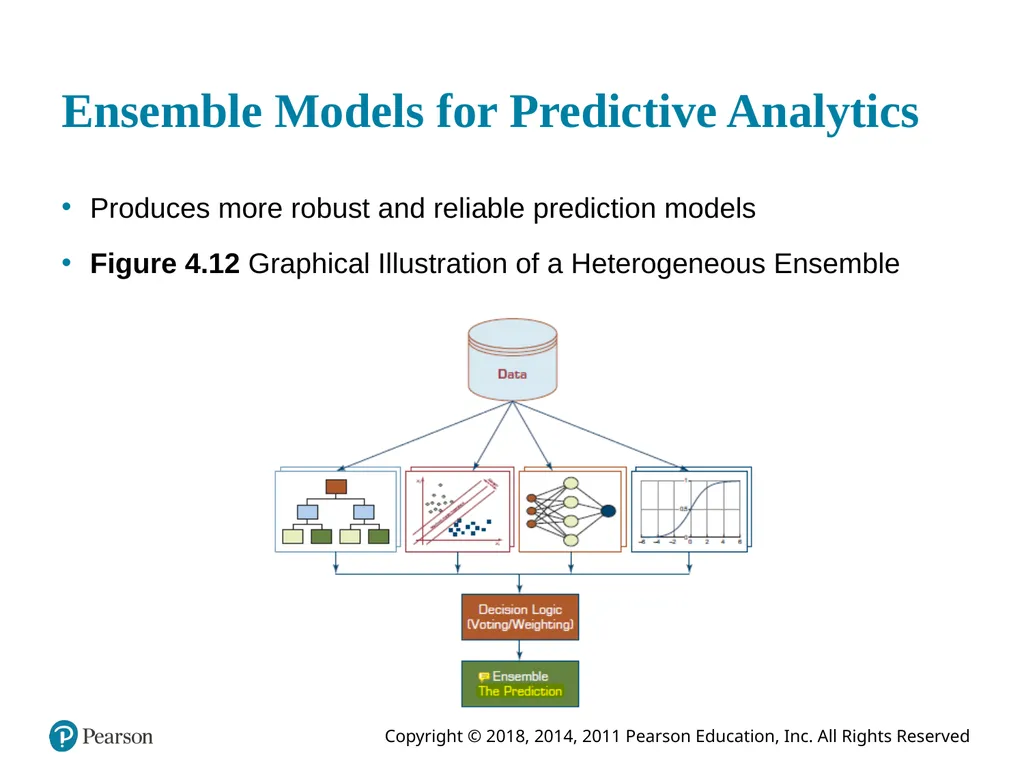
slide39. Ensemble Models for Predictive Analytics Produces more robust and reliable prediction models
Figure 4.12 Graphical Illustration of a Heterogeneous Ensemble<br>
slide40. Application Case 4.5 Influence Health Uses Advanced Predictive Analytics to Focus on the Factors That Really Influence People’s Healthcare Decisions
Questions for Discussion
What did Influence Health do?
What were the challenges, the proposed solutions, and the obtained results?
How can data mining help companies in the healthcare industry (in ways other than the ones mentioned in this case)?<br>
slide41. Cluster Analysis for Data Mining (1 of 4) Used for automatic identification of natural groupings of things
Part of the machine-learning family
Employ unsupervised learning
Learns the clusters of things from past data, then assigns new instances
There is not an output/target variable
In marketing, it is also known as segmentation<br>
slide42. Cluster Analysis for Data Mining (2 of 4) Clustering results may be used to
Identify natural groupings of customers
Identify rules for assigning new cases to classes for targeting/diagnostic purposes
Provide characterization, definition, labeling of populations
Decrease the size and complexity of problems for other data mining methods
Identify outliers in a specific domain (e.g., rare-event detection)<br>
slide43. Cluster Analysis for Data Mining (3 of 4) Analysis methods
Statistical methods (including both hierarchical and nonhierarchical), such as k-means, k-modes, and so on.
Neural networks (adaptive resonance theory [A R T], self-organizing map [S O M])
Fuzzy logic (e.g., fuzzy c-means algorithm)
Genetic algorithms
How many clusters?<br>
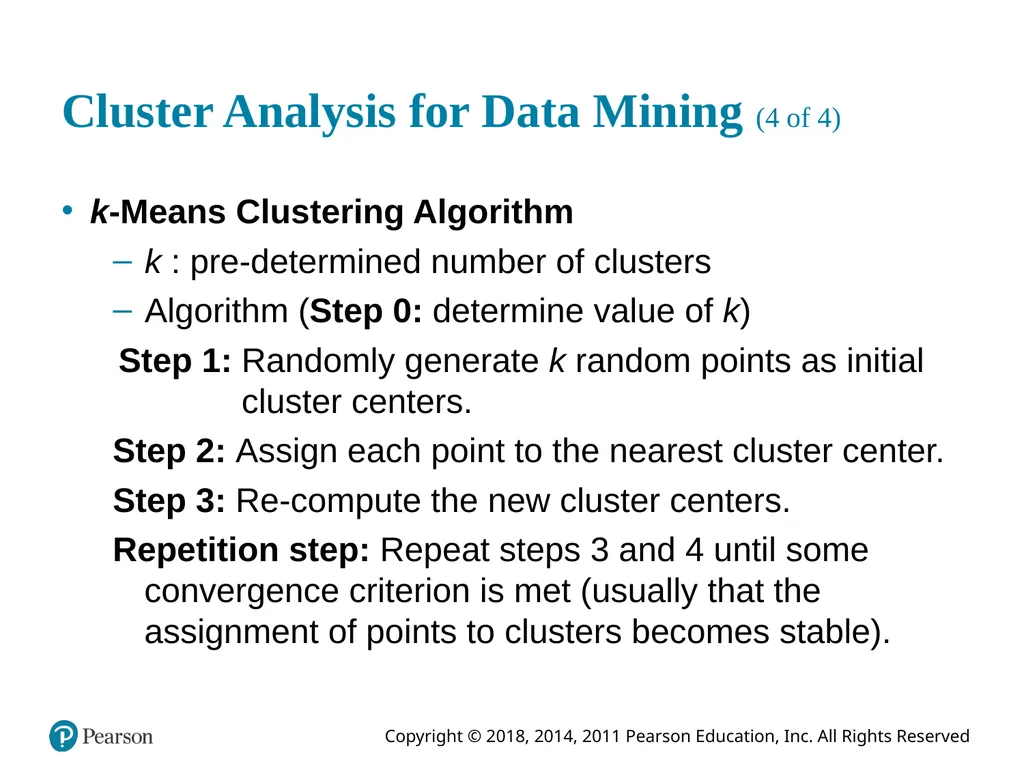
slide44. Cluster Analysis for Data Mining (4 of 4) k-Means Clustering Algorithm
k : pre-determined number of clusters
Algorithm (Step 0: determine value of k)
Step 1: Randomly generate k random points as initial cluster centers.
Step 2: Assign each point to the nearest cluster center.
Step 3: Re-compute the new cluster centers.
Repetition step: Repeat steps 3 and 4 until some convergence criterion is met (usually that the assignment of points to clusters becomes stable).<br>
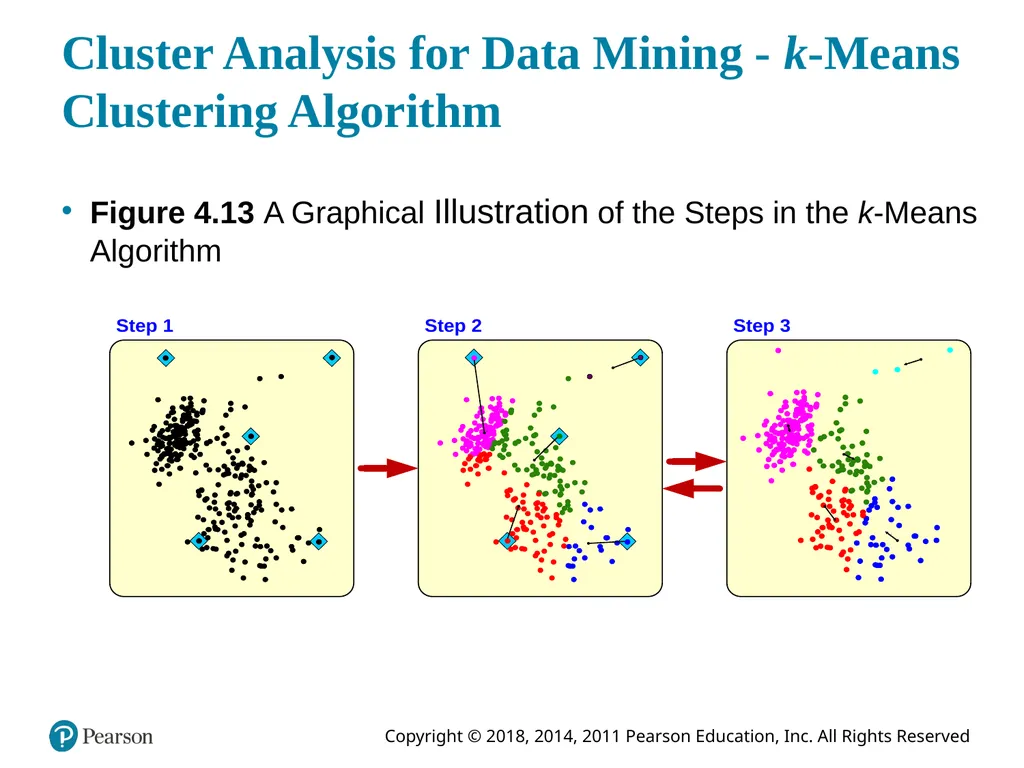
slide45. Cluster Analysis for Data Mining - k-Means Clustering Algorithm Figure 4.13 A Graphical Illustration of the Steps in the k-Means Algorithm<br>
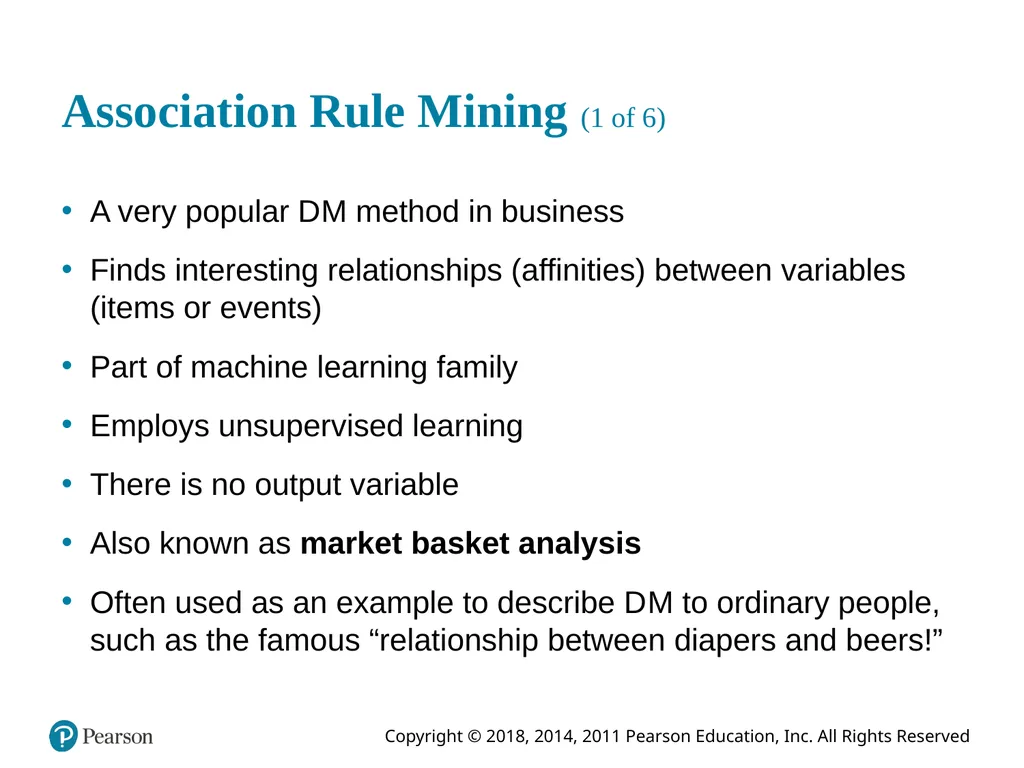
slide46. Association Rule Mining (1 of 6) A very popular D M method in business
Finds interesting relationships (affinities) between variables (items or events)
Part of machine learning family
Employs unsupervised learning
There is no output variable
Also known as market basket analysis
Often used as an example to describe D M to ordinary people, such as the famous “relationship between diapers and beers!”<br>
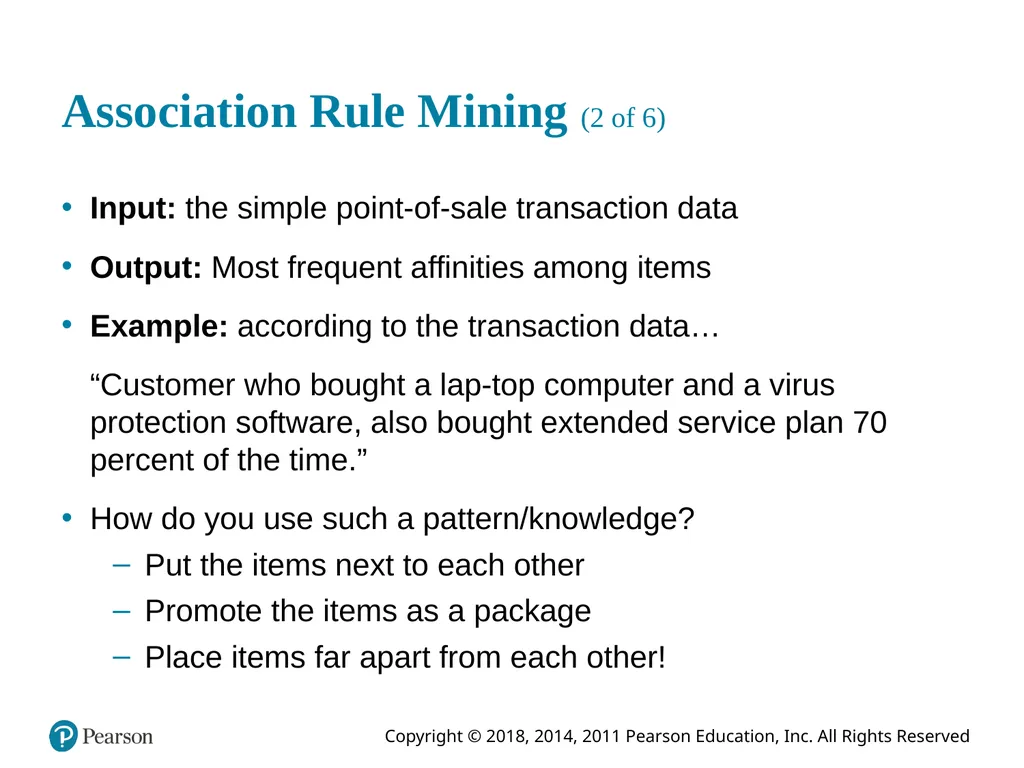
slide47. Association Rule Mining (2 of 6) Input: the simple point-of-sale transaction data
Output: Most frequent affinities among items
Example: according to the transaction data…
“Customer who bought a lap-top computer and a virus protection software, also bought extended service plan 70 percent of the time.”
How do you use such a pattern/knowledge?
Put the items next to each other
Promote the items as a package
Place items far apart from each other!<br>
slide48. Association Rule Mining (3 of 6) A representative application of association rule mining includes
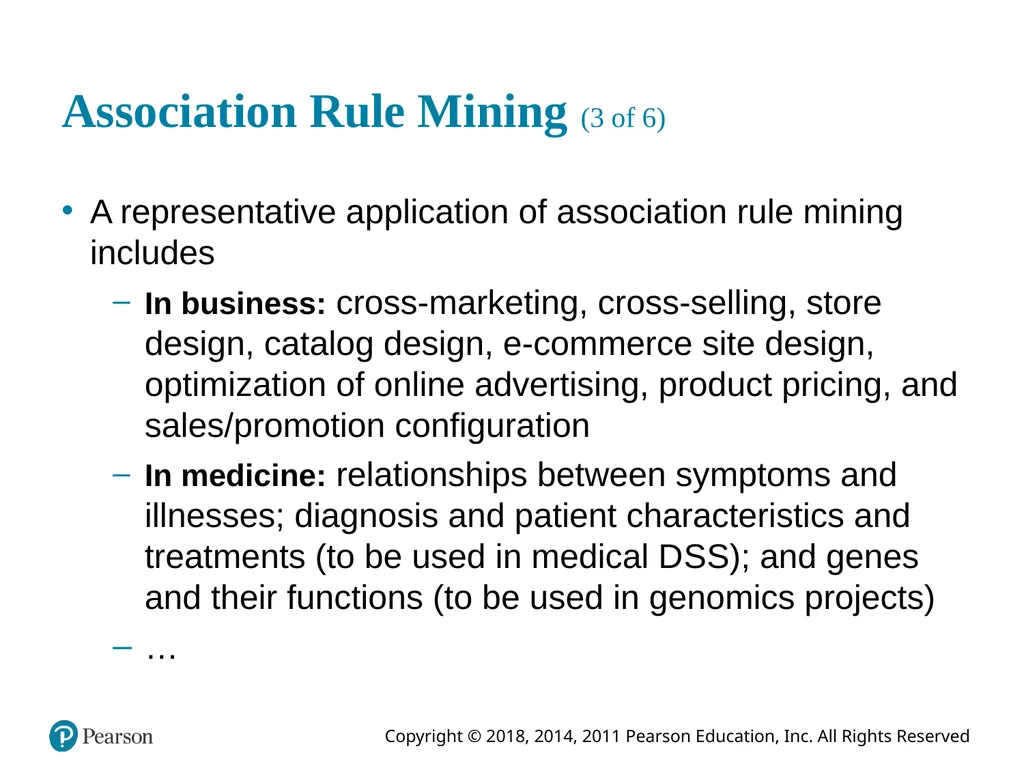
In business: cross-marketing, cross-selling, store design, catalog design, e-commerce site design, optimization of online advertising, product pricing, and sales/promotion configuration
In medicine: relationships between symptoms and illnesses; diagnosis and patient characteristics and treatments (to be used in medical D S S); and genes and their functions (to be used in genomics projects)
…<br>
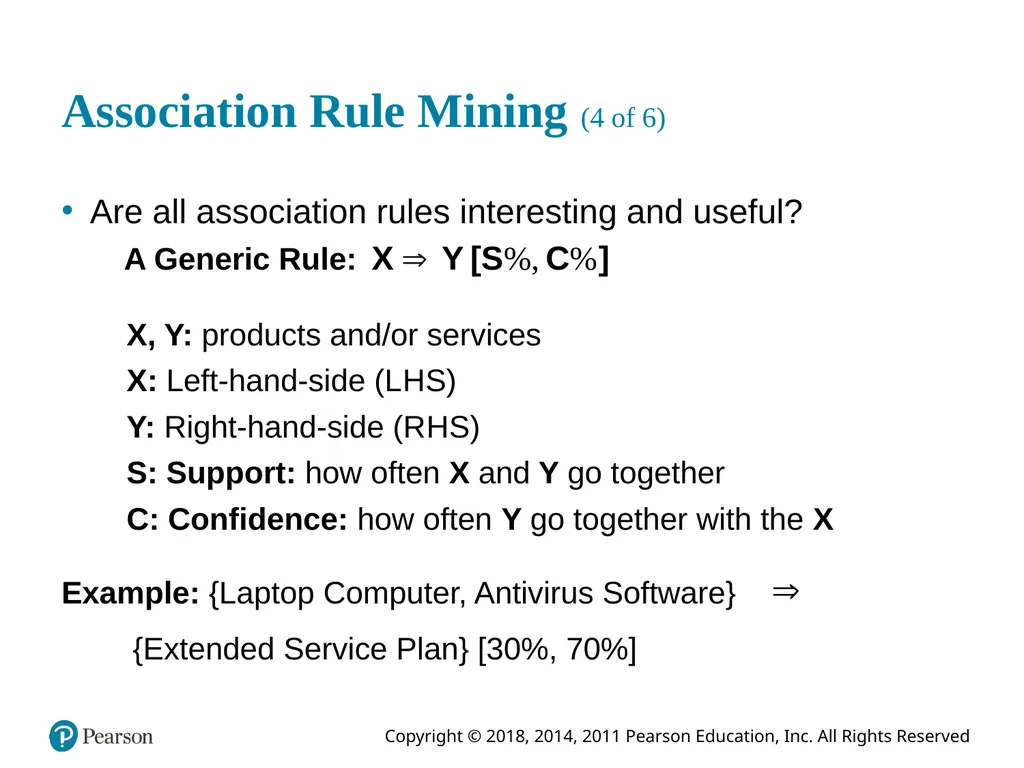
slide49. Association Rule Mining (4 of 6) Are all association rules interesting and useful?
A Generic Rule: X, Y: products and/or services
X: Left-hand-side (L H S)
Y: Right-hand-side (R H S)
S: Support: how often X and Y go together
C: Confidence: how often Y go together with the X Example: {Laptop Computer, Antivirus Software} {Extended Service Plan} [30%, 70%]<br>
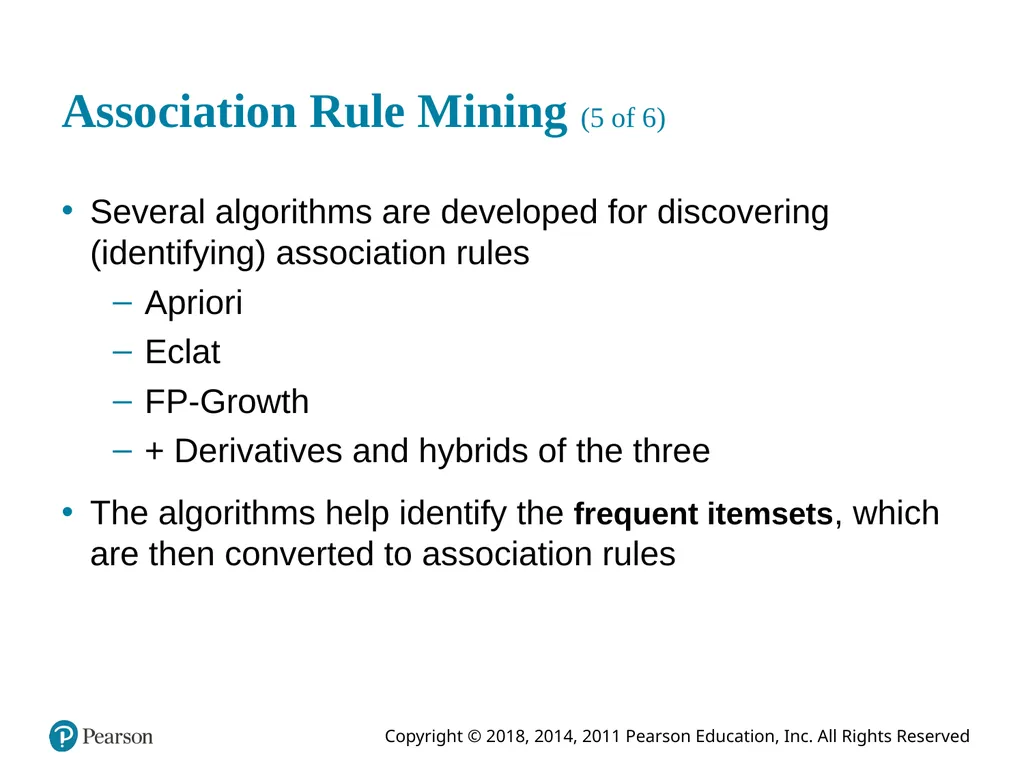
slide50. Association Rule Mining (5 of 6) Several algorithms are developed for discovering (identifying) association rules
Apriori
Eclat
F P-Growth
+ Derivatives and hybrids of the three
The algorithms help identify the frequent itemsets, which are then converted to association rules<br>
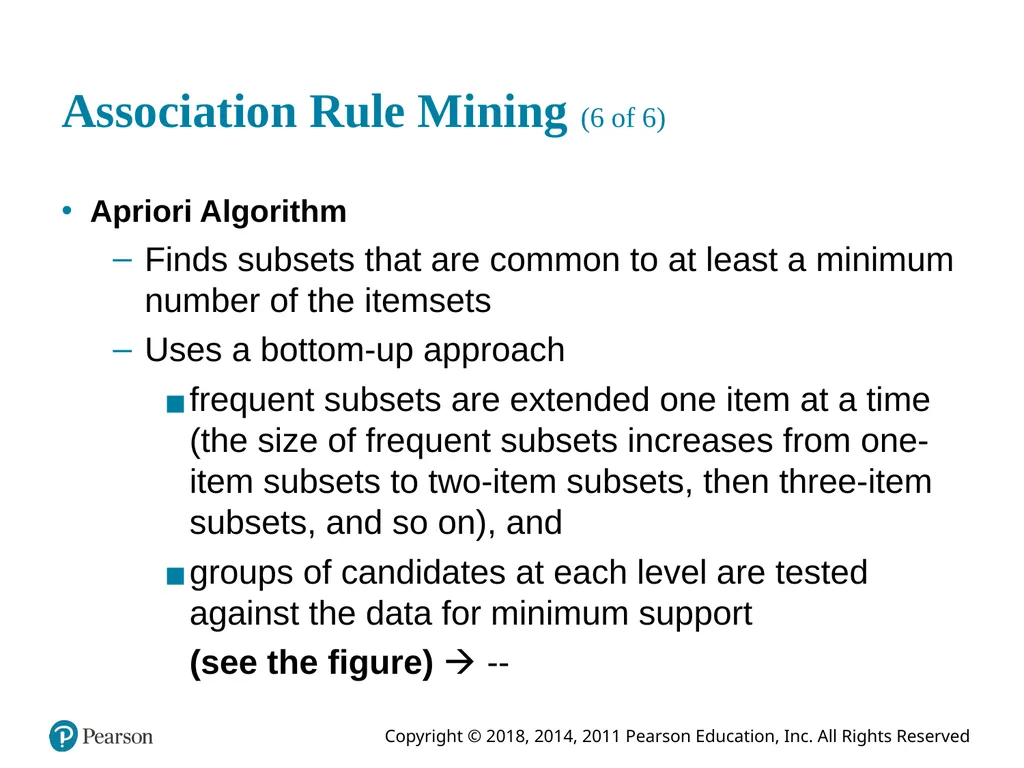
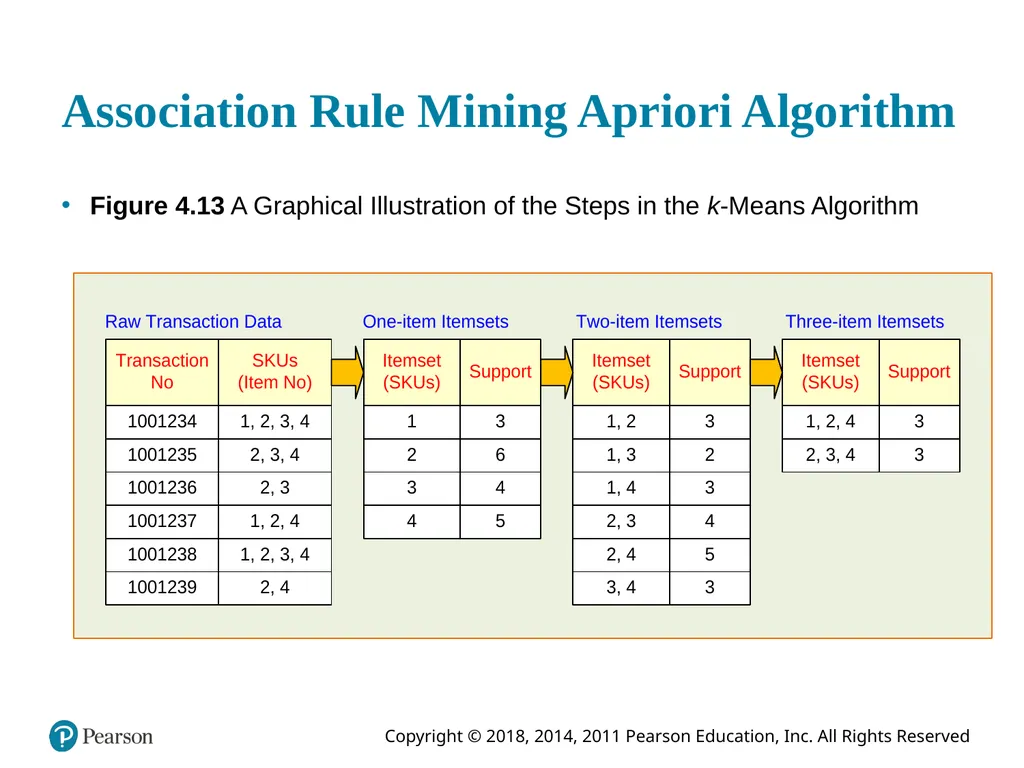
slide51. Association Rule Mining (6 of 6) Apriori Algorithm
Finds subsets that are common to at least a minimum number of the itemsets
Uses a bottom-up approach
frequent subsets are extended one item at a time (the size of frequent subsets increases from one-item subsets to two-item subsets, then three-item subsets, and so on), and
groups of candidates at each level are tested against the data for minimum support
(see the figure) --<br>
slide52. Association Rule Mining Apriori Algorithm Figure 4.13 A Graphical Illustration of the Steps in the k-Means Algorithm<br>
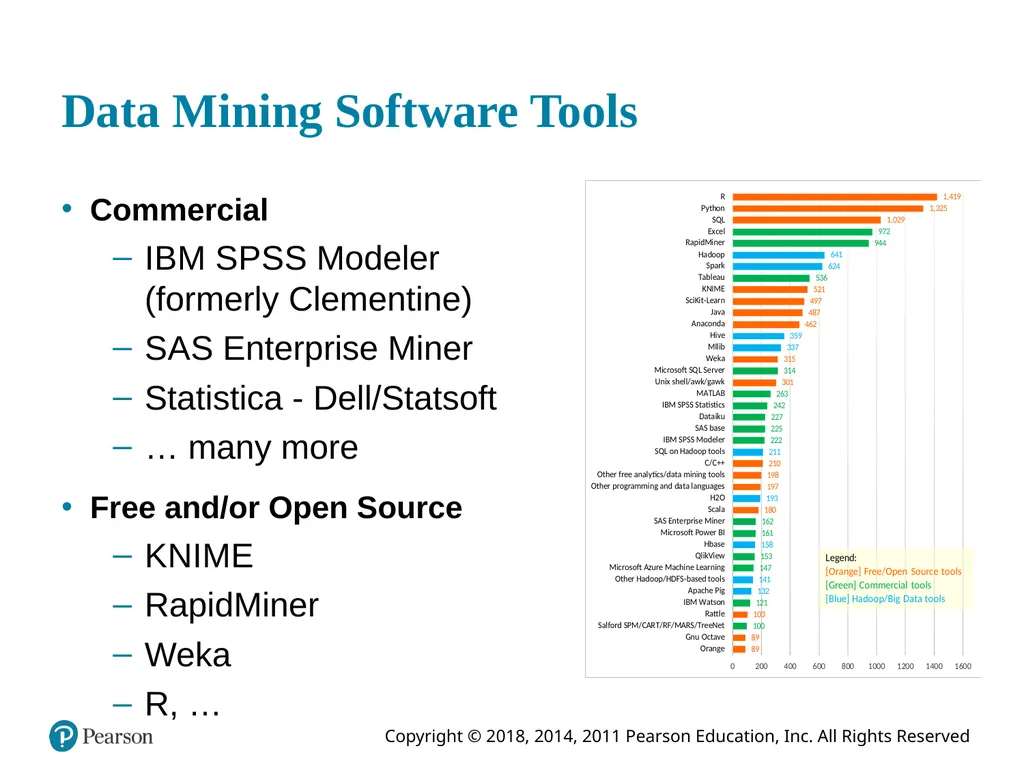
slide53. Data Mining Software Tools Commercial
I B M S P S S Modeler (formerly Clementine)
S A S Enterprise Miner
Statistica - Dell/Statsoft
… many more
Free and/or Open Source
K N I M E
RapidMiner
Weka
R, …<br>
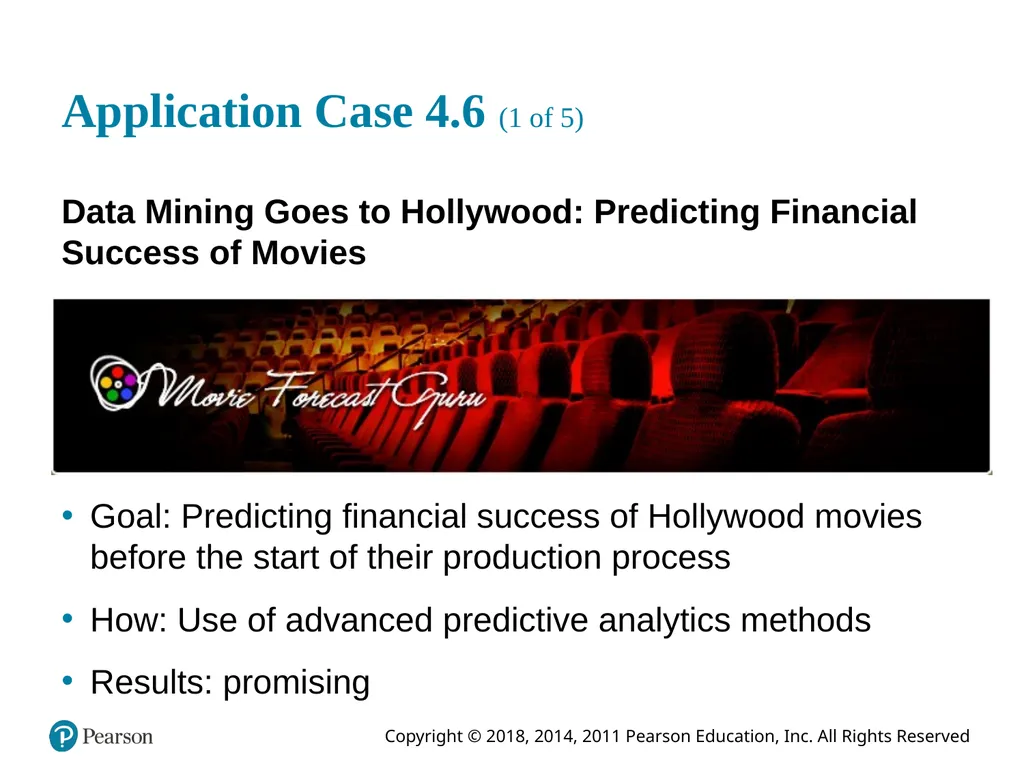
slide54. Application Case 4.6 (1 of 5) Data Mining Goes to Hollywood: Predicting Financial Success of Movies Goal: Predicting financial success of Hollywood movies before the start of their production process
How: Use of advanced predictive analytics methods
Results: promising<br>
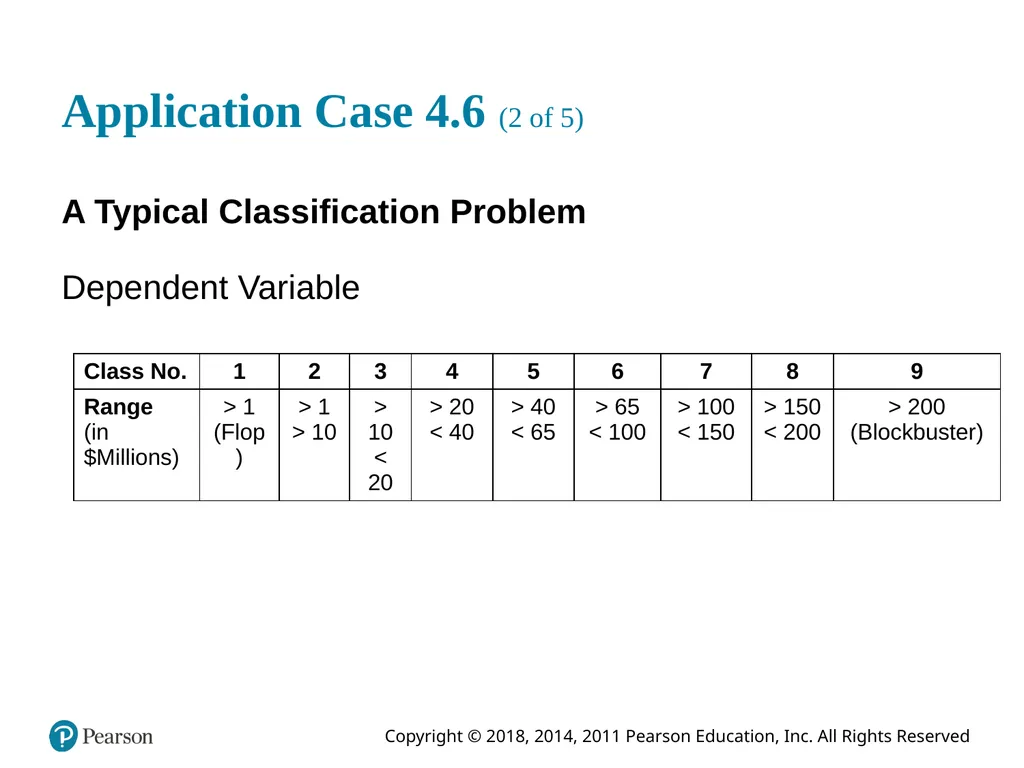
slide55. Application Case 4.6 (2 of 5) A Typical Classification Problem Dependent Variable<br>
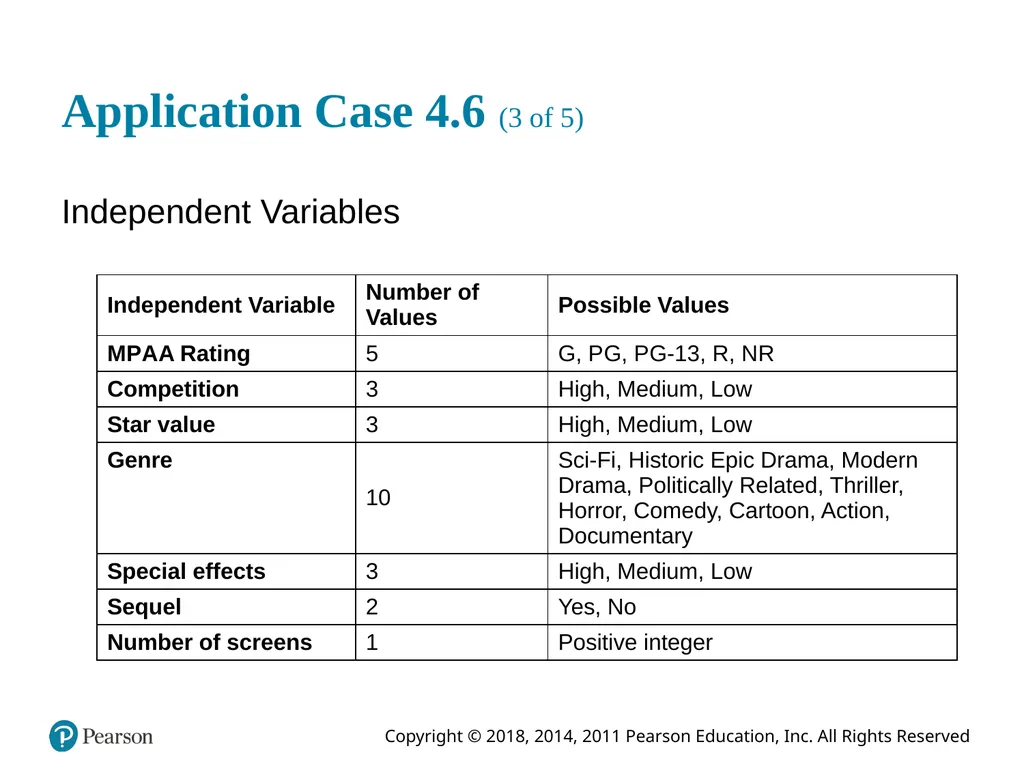
slide56. Application Case 4.6 (3 of 5) Independent Variables<br>
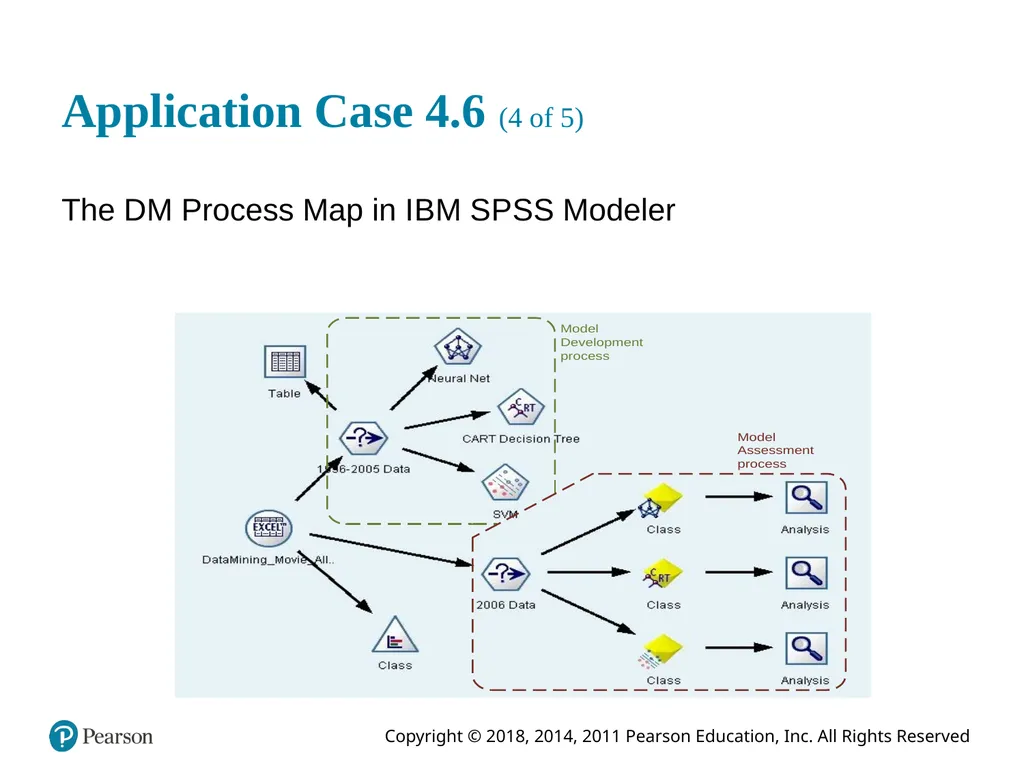
slide57. Application Case 4.6 (4 of 5) The D M Process Map in I B M S P S S Modeler<br>
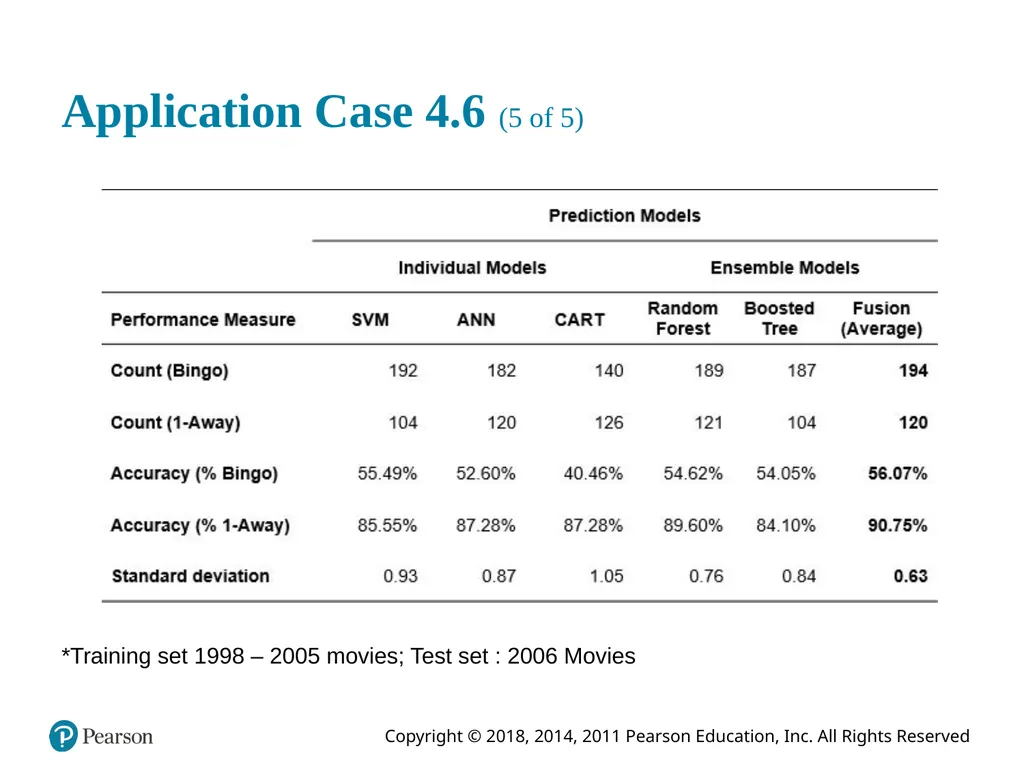
slide58. Application Case 4.6 (5 of 5) *Training set 1998 – 2005 movies; Test set : 2006 Movies<br>
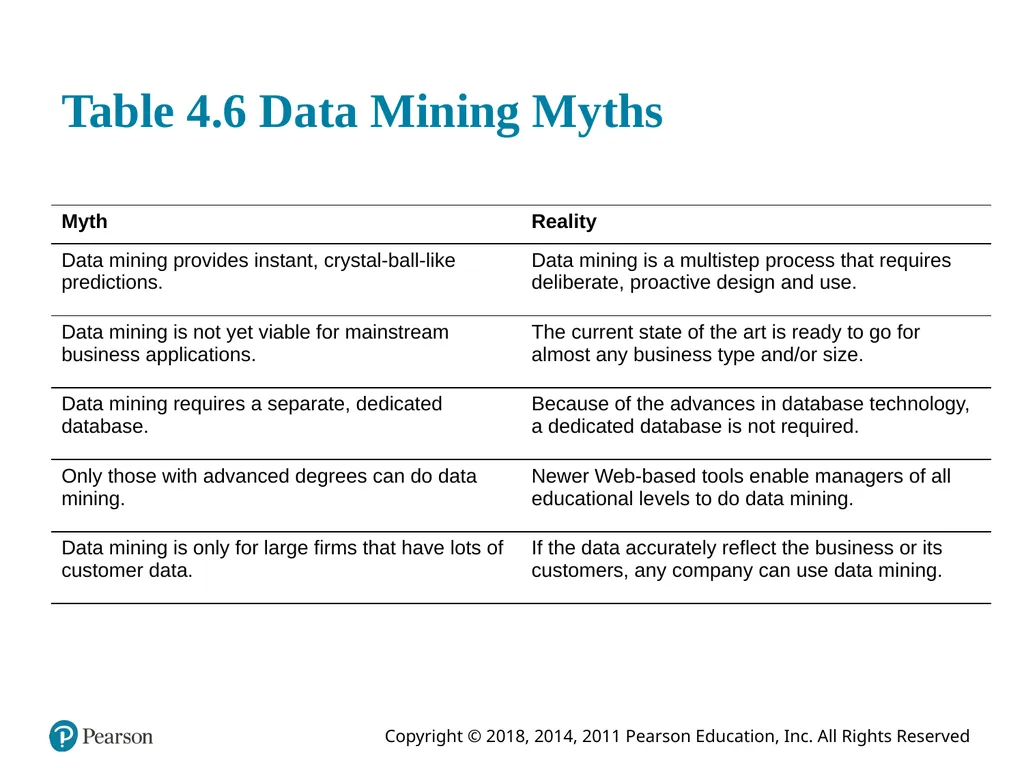
slide59. Table 4.6 Data Mining Myths<br>
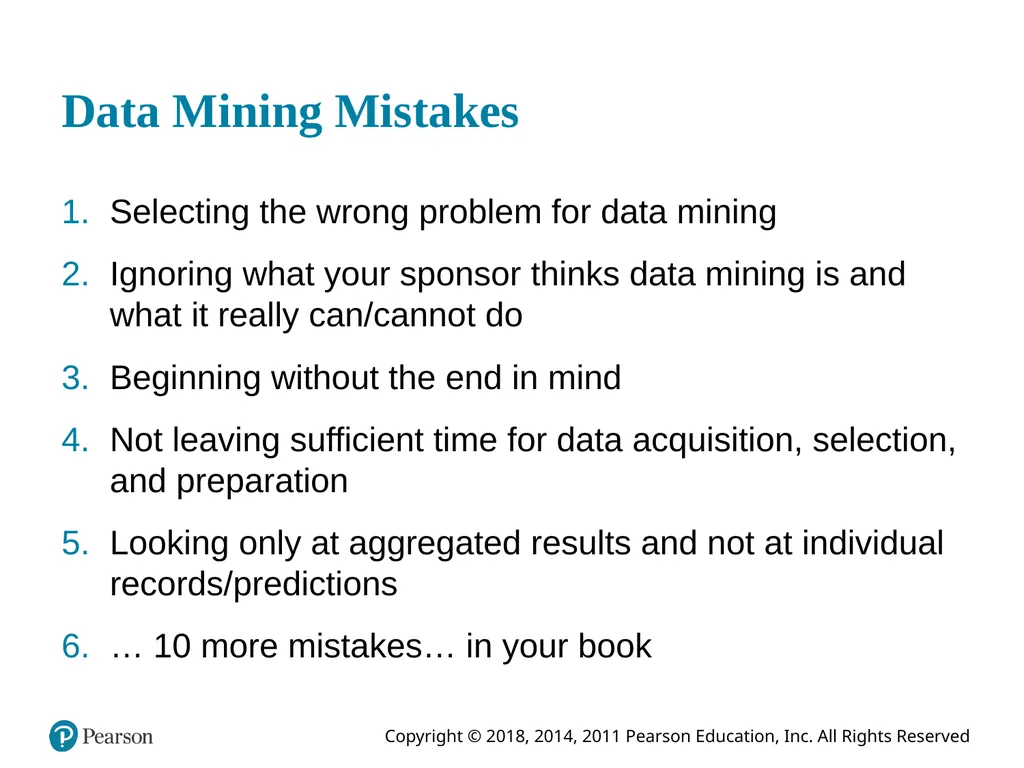
slide60. Data Mining Mistakes Selecting the wrong problem for data mining
Ignoring what your sponsor thinks data mining is and what it really can/cannot do
Beginning without the end in mind
Not leaving sufficient time for data acquisition, selection, and preparation
Looking only at aggregated results and not at individual records/predictions
… 10 more mistakes… in your book<br>
slide61. End of Chapter 4 Questions / Comments<br>
slide62. Copyright<br>
slide2. Learning Objectives (1 of 2) 4.1 Define data mining as an enabling technology for business analytics
4.2 Understand the objectives and benefits of data mining
4.3 Become familiar with the wide range of applications of data mining
4.4 Learn the standardized data mining processes
4.5 Learn different methods and algorithms of data mining<br>
slide3. Learning Objectives (2 of 2) 4.6 Build awareness of the existing data mining software tools
4.7 Understand the privacy issues, pitfalls, and myths of data mining<br>
slide4. Opening Vignette (1 of 3) Miami-Dade Police Department Is Using Predictive Analytics to Foresee and Fight Crime Predictive analytics in law enforcement
Policing with less
New thinking on cold cases
The big picture starts small
Success brings credibility
Just for the facts
Safer streets for smarter cities<br>
slide5. Opening Vignette (2 of 3) Discussion Questions
Why do law enforcement agencies and departments like Miami-Dade Police Department embrace advanced analytics and data mining?
What are the top challenges for law enforcement agencies and departments like Miami-Dade Police Department? Can you think of other challenges (not mentioned in this case) that can benefit from data mining?<br>
slide6. Opening Vignette (3 of 3) What are the sources of data that law enforcement agencies and departments like Miami-Dade Police Department use for their predictive modeling and data mining projects?
What type of analytics do law enforcement agencies and departments like Miami-Dade Police Department use to fight crime?
What does “the big picture starts small” mean in this case? Explain.<br>
slide7. Data Mining Concepts and Definitions Why Data Mining? More intense competition at the global scale.
Recognition of the value in data sources.
Availability of quality data on customers, vendors, transactions, Web, etc.
Consolidation and integration of data repositories into data warehouses.
The exponential increase in data processing and storage capabilities; and decrease in cost.
Movement toward conversion of information resources into nonphysical form.<br>
slide8. Definition of Data Mining The nontrivial process of identifying valid, novel, potentially useful, and ultimately understandable patterns in data stored in structured databases.
– Fayyad et al., (1996)
Keywords in this definition: Process, nontrivial, valid, novel, potentially useful, understandable.
Data mining: a misnomer?
Other names: knowledge extraction, pattern analysis, knowledge discovery, information harvesting, pattern searching, data dredging,…<br>
slide9. Figure 4.1 Data Mining is a Blend of Multiple Disciplines<br>
slide10. Application Case 4.1 Visa Is Enhancing the Customer Experience While Reducing Fraud with Predictive Analytics and Data Mining
Questions for Discussion
What challenges were Visa and the rest of the credit card industry facing?
How did Visa improve customer service while also improving retention of fraud?
What is in-memory analytics, and why was it necessary?<br>
slide11. Data Mining Characteristics & Objectives Source of data for D M is often a consolidated data warehouse (not always!).
D M environment is usually a client-server or a Web-based information systems architecture.
Data is the most critical ingredient for D M which may include soft/unstructured data.
The miner is often an end user.
Striking it rich requires creative thinking.
Data mining tools’ capabilities and ease of use are essential (Web, Parallel processing, etc.).<br>
slide12. How Data Mining Works D M extract patterns from data
Pattern? A mathematical (numeric and/or symbolic) relationship among data items
Types of patterns
Association
Prediction
Cluster (segmentation)
Sequential (or time series) relationships<br>
slide13. Application Case 4.2 Dell Is Staying Agile and Effective with Analytics in the 21st Century
Questions for Discussion
What was the challenge Dell was facing that led to their analytics journey?
What solution did Dell develop and implement? What were the results?
As an analytics company itself, Dell has used its service offerings for its own business. Do you think it is easier or harder for a company to taste its own medicine? Explain.<br>
slide14. A Taxonomy for Data Mining Figure 4.2 A Simple Taxonomy for Data Mining Tasks, Methods, and Algorithms<br>
slide15. Other Data Mining Patterns/Tasks Time-series forecasting
Part of the sequence or link analysis?
Visualization
Another data mining task?
Covered in Chapter 3
Data Mining versus Statistics
Are they the same?
What is the relationship between the two?<br>
slide16. Data Mining Applications (1 of 4) Customer Relationship Management
Maximize return on marketing campaigns
Improve customer retention (churn analysis)
Maximize customer value (cross-, up-selling)
Identify and treat most valued customers
Banking & Other Financial
Automate the loan application process
Detecting fraudulent transactions
Maximize customer value (cross-, up-selling)
Optimizing cash reserves with forecasting<br>
slide17. Data Mining Applications (2 of 4) Retailing and Logistics
Optimize inventory levels at different locations
Improve the store layout and sales promotions
Optimize logistics by predicting seasonal effects
Minimize losses due to limited shelf life
Manufacturing and Maintenance
Predict/prevent machinery failures
Identify anomalies in production systems to optimize the use manufacturing capacity
Discover novel patterns to improve product quality<br>
slide18. Data Mining Applications (3 of 4) Brokerage and Securities Trading
Predict changes on certain bond prices
Forecast the direction of stock fluctuations
Assess the effect of events on market movements
Identify and prevent fraudulent activities in trading
Insurance
Forecast claim costs for better business planning
Determine optimal rate plans
Optimize marketing to specific customers
Identify and prevent fraudulent claim activities<br>
slide19. Data Mining Applications (4 of 4) Computer hardware and software
Science and engineering
Government and defense
Homeland security and law enforcement
Travel, entertainment, sports
Healthcare and medicine
Sports,… virtually everywhere…<br>
slide20. Application Case 4.3 Predictive Analytic and Data Mining Help Stop Terrorist Funding
Questions for Discussion
How can data mining be used to fight terrorism? Comment on what else can be done beyond what is covered in this short application case.
Do you think data mining, although essential for fighting terrorist cells, also jeopardizes individuals’ rights of privacy?<br>
slide21. Data Mining Process A manifestation of the best practices
A systematic way to conduct D M projects
Moving from Art to Science for D M project
Everybody has a different version
Most common standard processes:
C R I S P-D M (Cross-Industry Standard Process for Data Mining)
S E M M A (Sample, Explore, Modify, Model, and Assess)
K D D (Knowledge Discovery in Databases)<br>
slide22. Data Mining Process: C R I S P-D M (1 of 2) Cross Industry Standard Process for Data Mining
Proposed in 1990s by a European consortium
Composed of six consecutive phases Step 1: Business Understanding
Step 2: Data Understanding
Step 3: Data Preparation Accounts for ~85% of total project time Step 4: Model Building
Step 5: Testing and Evaluation
Step 6: Deployment<br>
slide23. Data Mining Process: C R I S P-D M (2 of 2) Figure 4.3 The Six-Step C R I S P-D M Data Mining Process →
The process is highly repetitive and experimental (D M: art versus science?)<br>
slide24. Data Mining Process: S E M M A Figure 4.5 S E M M A Data Mining Process
Developed by S A S Institute<br>
slide25. Data Mining Process: K D D Figure 4.6 K D D (Knowledge Discovery in Databases) Process<br>
slide26. Which Data Mining Process is the Best? Figure 4.7 Ranking of Data Mining Methodologies/Processes. Source: Used with permission from K Dnuggets.com.<br>
slide27. Application Case 4.4 Data Mining Helps in Cancer Research
Questions for Discussion
How can data mining be used for ultimately curing illnesses like cancer?
What do you think are the promises and major challenges for data miners in contributing to medical and biological research endeavors?<br>
slide28. Data Mining Methods: Classification Most frequently used D M method
Part of the machine-learning family
Employ supervised learning
Learn from past data, classify new data
The output variable is categorical (nominal or ordinal) in nature
Classification versus regression?
Classification versus clustering?<br>
slide29. Assessment Methods for Classification Predictive accuracy
Hit rate
Speed
Model building versus predicting/usage speed
Robustness
Scalability
Interpretability
Transparency, explainability<br>
slide30. Accuracy of Classification Models In classification problems, the primary source for accuracy estimation is the confusion matrix<br>
slide31. Estimation Methodologies for Classification: Single/Simple Split Simple split (or holdout or test sample estimation)
Split the data into 2 mutually exclusive sets: training (~70%) and testing (30%) For Neural Networks, the data is split into three sub-sets (training [~60%], validation [~20%], testing [~20%])<br>
slide32. Estimation Methodologies for Classification: k-Fold Cross Validation (rotation estimation) Data is split into k mutual subsets and k number training/testing experiments are conducted
Figure 4.10 A Graphical Depiction of k-Fold Cross-Validation<br>
slide33. Additional Estimation Methodologies for Classification Leave-one-out
Similar to k-fold where k = number of samples
Bootstrapping
Random sampling with replacement
Jackknifing
Similar to leave-one-out
Area Under the R O C Curve (A U C)
R O C: receiver operating characteristics (a term borrowed from radar image processing)<br>
slide34. Area Under the R O C Curve (A U C) (1 of 2) Works with binary classification
Figure 4.11 A Sample R O C Curve<br>
slide35. Area Under the R O C Curve (A U C) (2 of 2) Produces values from 0 to 1.0
Random chance is 0.5 and perfect classification is 1.0
Produces a good assessment for skewed class distributions too!<br>
slide36. Classification Techniques Decision tree analysis
Statistical analysis
Neural networks
Support vector machines
Case-based reasoning
Bayesian classifiers
Genetic algorithms
Rough sets<br>
slide37. Decision Trees (1 of 2) Employs a divide-and-conquer method
Recursively divides a training set until each division consists of examples from one class: A general algorithm (steps) for building a decision tree Create a root node and assign all of the training data to it.
Select the best splitting attribute.
Add a branch to the root node for each value of the split. Split the data into mutually exclusive subsets along the lines of the specific split.
Repeat steps 2 and 3 for each and every leaf node until the stopping criteria is reached.<br>
slide38. Decision Trees (2 of 2) D T algorithms mainly differ on
1. Splitting criteria
Which variable, what value, etc.
2. Stopping criteria
When to stop building the tree
3. Pruning (generalization method)
Pre-pruning versus post-pruning
Most popular D T algorithms include
I D 3, C 4.5, C 5; C A R T; C H A I D; M 5<br>
slide39. Ensemble Models for Predictive Analytics Produces more robust and reliable prediction models
Figure 4.12 Graphical Illustration of a Heterogeneous Ensemble<br>
slide40. Application Case 4.5 Influence Health Uses Advanced Predictive Analytics to Focus on the Factors That Really Influence People’s Healthcare Decisions
Questions for Discussion
What did Influence Health do?
What were the challenges, the proposed solutions, and the obtained results?
How can data mining help companies in the healthcare industry (in ways other than the ones mentioned in this case)?<br>
slide41. Cluster Analysis for Data Mining (1 of 4) Used for automatic identification of natural groupings of things
Part of the machine-learning family
Employ unsupervised learning
Learns the clusters of things from past data, then assigns new instances
There is not an output/target variable
In marketing, it is also known as segmentation<br>
slide42. Cluster Analysis for Data Mining (2 of 4) Clustering results may be used to
Identify natural groupings of customers
Identify rules for assigning new cases to classes for targeting/diagnostic purposes
Provide characterization, definition, labeling of populations
Decrease the size and complexity of problems for other data mining methods
Identify outliers in a specific domain (e.g., rare-event detection)<br>
slide43. Cluster Analysis for Data Mining (3 of 4) Analysis methods
Statistical methods (including both hierarchical and nonhierarchical), such as k-means, k-modes, and so on.
Neural networks (adaptive resonance theory [A R T], self-organizing map [S O M])
Fuzzy logic (e.g., fuzzy c-means algorithm)
Genetic algorithms
How many clusters?<br>
slide44. Cluster Analysis for Data Mining (4 of 4) k-Means Clustering Algorithm
k : pre-determined number of clusters
Algorithm (Step 0: determine value of k)
Step 1: Randomly generate k random points as initial cluster centers.
Step 2: Assign each point to the nearest cluster center.
Step 3: Re-compute the new cluster centers.
Repetition step: Repeat steps 3 and 4 until some convergence criterion is met (usually that the assignment of points to clusters becomes stable).<br>
slide45. Cluster Analysis for Data Mining - k-Means Clustering Algorithm Figure 4.13 A Graphical Illustration of the Steps in the k-Means Algorithm<br>
slide46. Association Rule Mining (1 of 6) A very popular D M method in business
Finds interesting relationships (affinities) between variables (items or events)
Part of machine learning family
Employs unsupervised learning
There is no output variable
Also known as market basket analysis
Often used as an example to describe D M to ordinary people, such as the famous “relationship between diapers and beers!”<br>
slide47. Association Rule Mining (2 of 6) Input: the simple point-of-sale transaction data
Output: Most frequent affinities among items
Example: according to the transaction data…
“Customer who bought a lap-top computer and a virus protection software, also bought extended service plan 70 percent of the time.”
How do you use such a pattern/knowledge?
Put the items next to each other
Promote the items as a package
Place items far apart from each other!<br>
slide48. Association Rule Mining (3 of 6) A representative application of association rule mining includes
In business: cross-marketing, cross-selling, store design, catalog design, e-commerce site design, optimization of online advertising, product pricing, and sales/promotion configuration
In medicine: relationships between symptoms and illnesses; diagnosis and patient characteristics and treatments (to be used in medical D S S); and genes and their functions (to be used in genomics projects)
…<br>
slide49. Association Rule Mining (4 of 6) Are all association rules interesting and useful?
A Generic Rule: X, Y: products and/or services
X: Left-hand-side (L H S)
Y: Right-hand-side (R H S)
S: Support: how often X and Y go together
C: Confidence: how often Y go together with the X Example: {Laptop Computer, Antivirus Software} {Extended Service Plan} [30%, 70%]<br>
slide50. Association Rule Mining (5 of 6) Several algorithms are developed for discovering (identifying) association rules
Apriori
Eclat
F P-Growth
+ Derivatives and hybrids of the three
The algorithms help identify the frequent itemsets, which are then converted to association rules<br>
slide51. Association Rule Mining (6 of 6) Apriori Algorithm
Finds subsets that are common to at least a minimum number of the itemsets
Uses a bottom-up approach
frequent subsets are extended one item at a time (the size of frequent subsets increases from one-item subsets to two-item subsets, then three-item subsets, and so on), and
groups of candidates at each level are tested against the data for minimum support
(see the figure) --<br>
slide52. Association Rule Mining Apriori Algorithm Figure 4.13 A Graphical Illustration of the Steps in the k-Means Algorithm<br>
slide53. Data Mining Software Tools Commercial
I B M S P S S Modeler (formerly Clementine)
S A S Enterprise Miner
Statistica - Dell/Statsoft
… many more
Free and/or Open Source
K N I M E
RapidMiner
Weka
R, …<br>
slide54. Application Case 4.6 (1 of 5) Data Mining Goes to Hollywood: Predicting Financial Success of Movies Goal: Predicting financial success of Hollywood movies before the start of their production process
How: Use of advanced predictive analytics methods
Results: promising<br>
slide55. Application Case 4.6 (2 of 5) A Typical Classification Problem Dependent Variable<br>
slide56. Application Case 4.6 (3 of 5) Independent Variables<br>
slide57. Application Case 4.6 (4 of 5) The D M Process Map in I B M S P S S Modeler<br>
slide58. Application Case 4.6 (5 of 5) *Training set 1998 – 2005 movies; Test set : 2006 Movies<br>
slide59. Table 4.6 Data Mining Myths<br>
slide60. Data Mining Mistakes Selecting the wrong problem for data mining
Ignoring what your sponsor thinks data mining is and what it really can/cannot do
Beginning without the end in mind
Not leaving sufficient time for data acquisition, selection, and preparation
Looking only at aggregated results and not at individual records/predictions
… 10 more mistakes… in your book<br>
slide61. End of Chapter 4 Questions / Comments<br>
slide62. Copyright<br>