
CAPITAL AND RATE SUPPORTED OPERATING BUDGETS
Description: CAPITAL AND RATE SUPPORTED OPERATING BUDGETS Special Committee of the Whole November 13, 2017 Presented by: Mike Mayes, Director, Financial Services 1 Background 2 Budget process overview On an annual basis, the Town of Newmarket prepares a
Related Topics
Download Presentation
"CAPITAL AND RATE SUPPORTED OPERATING BUDGETS" is the property of its rightful owner. Permission is granted to download and print the materials on this website for personal, non-commercial use only, and to display it on your personal computer provided you do not modify the materials and that you retain all copyright notices contained in the materials. By downloading content from our website, you accept the terms of this agreement.
Presentation Transcript
slide1. CAPITAL AND RATE SUPPORTED OPERATING BUDGETS
Special Committee of the Whole
November 13, 2017 Presented by:
Mike Mayes, Director, Financial Services 1<br>
slide2. Background 2<br>
slide3. Budget process overview On an annual basis, the Town of Newmarket prepares a budget to authorize its expenditures for the year. For 2018, this includes:
$127 million in operating expenditures
- $84 million in tax-supported operations
- $43 million in rate-supported operations (water, stormwater, building)
$26 million in capital expenditures
When developing the budget, the Town prioritizes projects and services that are required to meet legislative requirements and community needs.
Although the budgets are broken down into service areas, the budget is considered and recommended as a whole to enhance the Town’s decision-making process.<br>
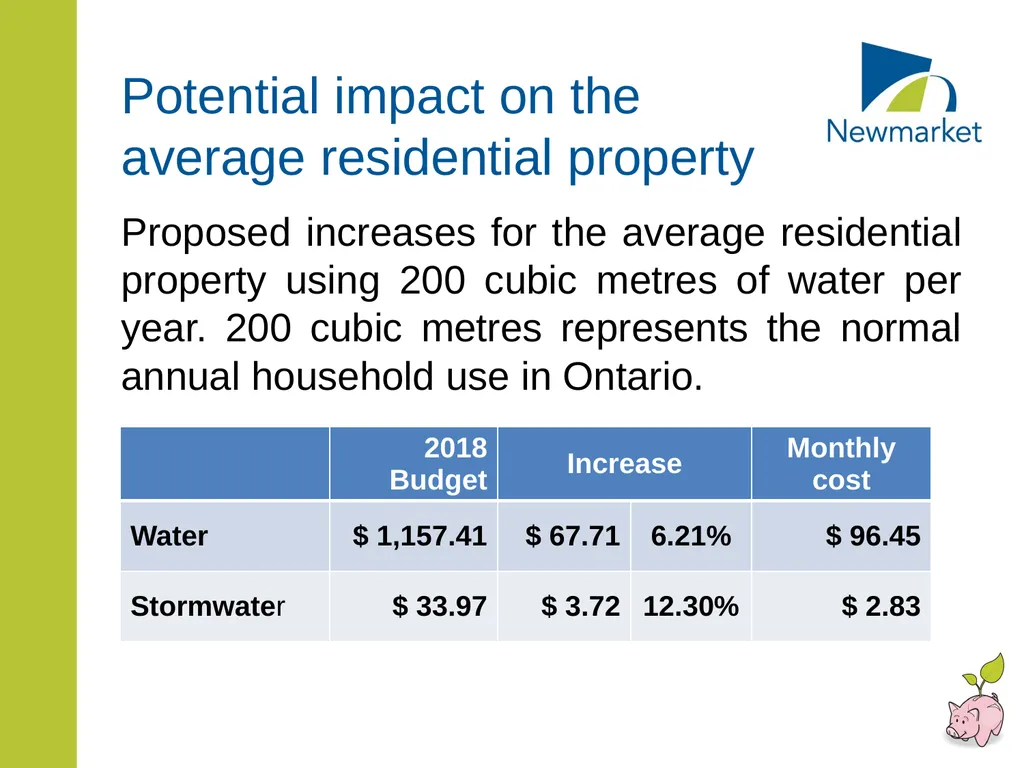
slide4. Potential impact on the average residential property Proposed increases for the average residential property using 200 cubic metres of water per year. 200 cubic metres represents the normal annual household use in Ontario.<br>
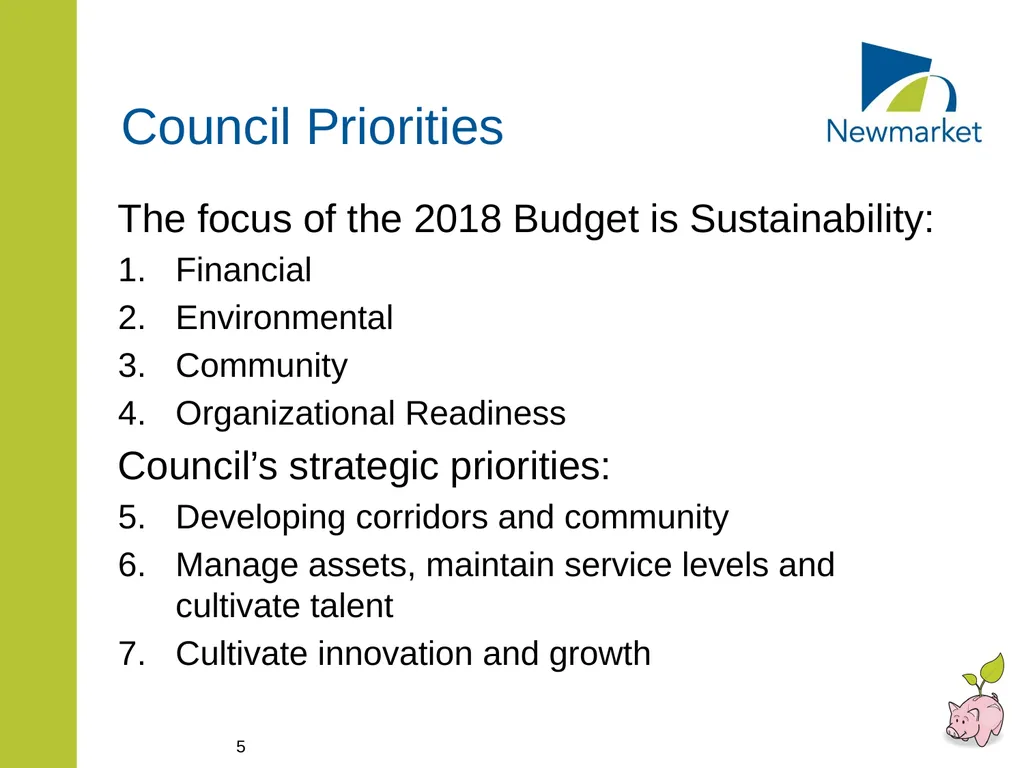
slide5. Council Priorities The focus of the 2018 Budget is Sustainability:
Financial
Environmental
Community
Organizational Readiness
Council’s strategic priorities:
Developing corridors and community
Manage assets, maintain service levels and cultivate talent
Cultivate innovation and growth 5<br>
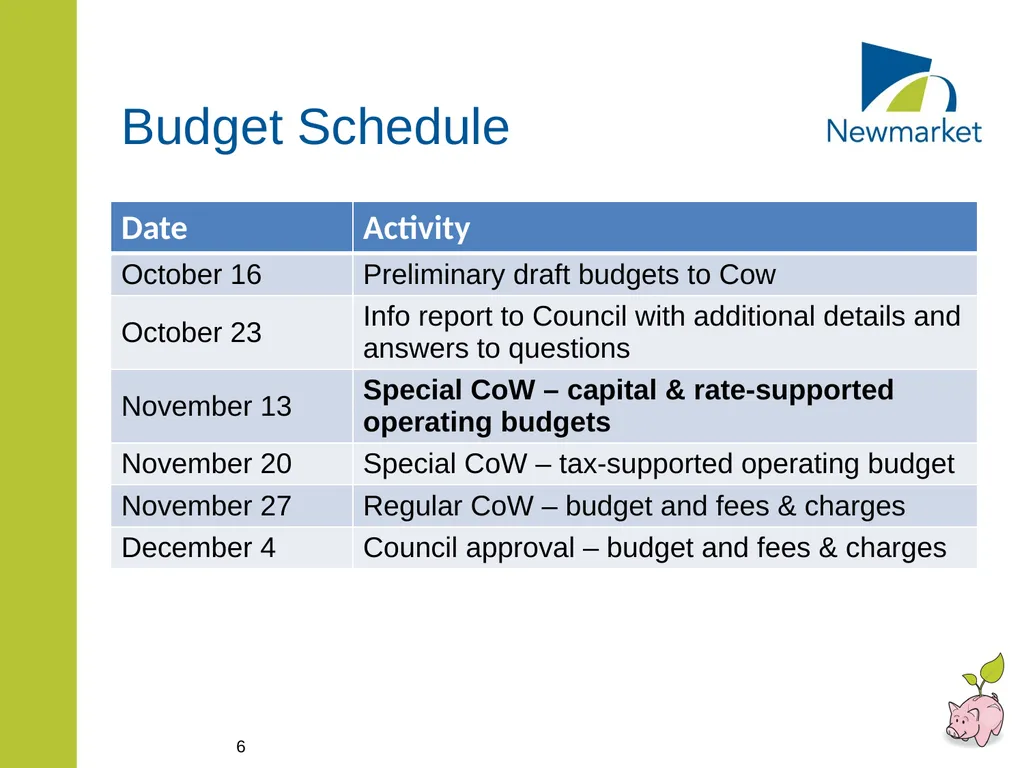
slide6. Budget Schedule 6<br>
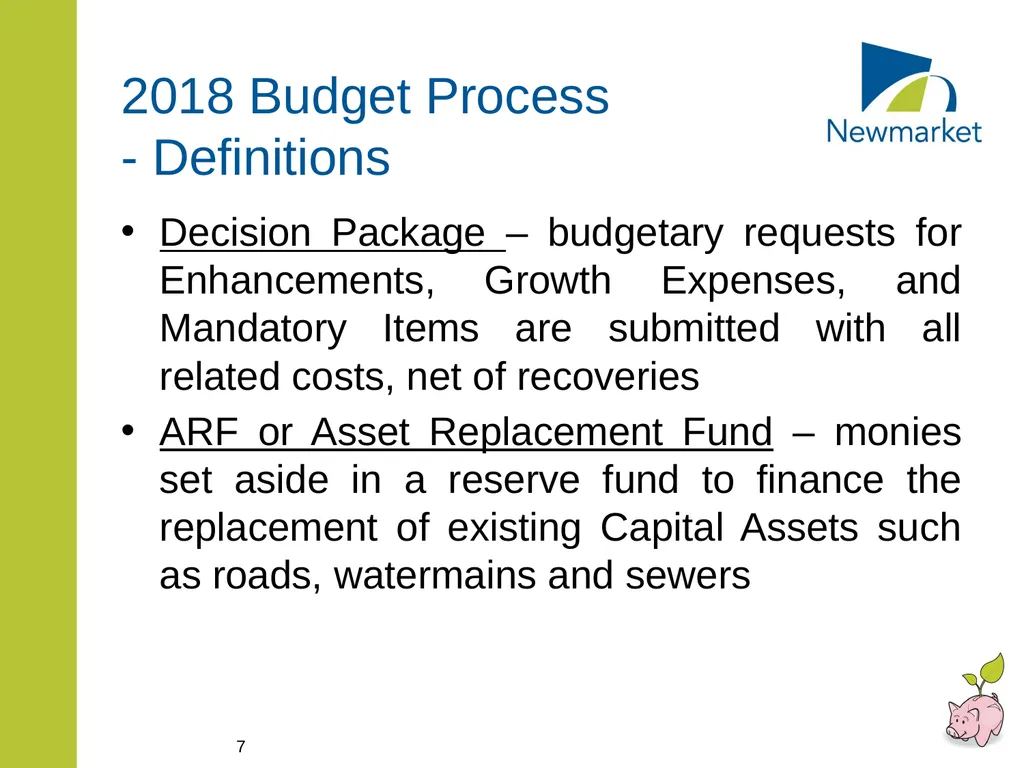
slide7. 2018 Budget Process - Definitions Decision Package – budgetary requests for Enhancements, Growth Expenses, and Mandatory Items are submitted with all related costs, net of recoveries
ARF or Asset Replacement Fund – monies set aside in a reserve fund to finance the replacement of existing Capital Assets such as roads, watermains and sewers 7<br>
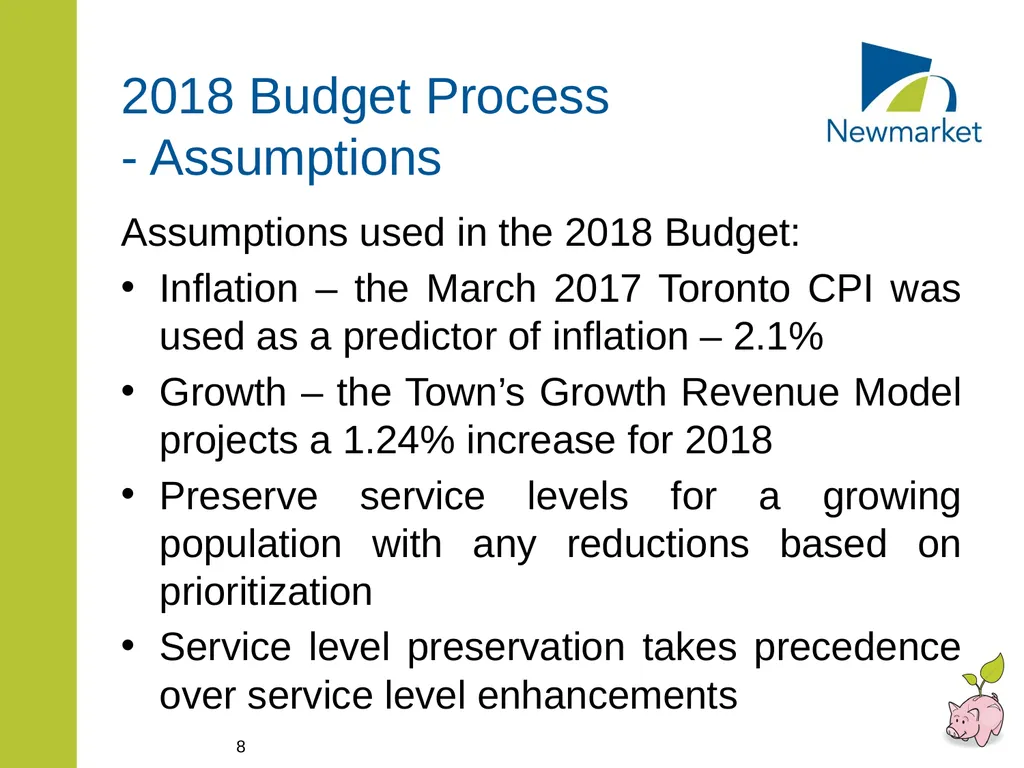
slide8. 2018 Budget Process - Assumptions Assumptions used in the 2018 Budget:
Inflation – the March 2017 Toronto CPI was used as a predictor of inflation – 2.1%
Growth – the Town’s Growth Revenue Model projects a 1.24% increase for 2018
Preserve service levels for a growing population with any reductions based on prioritization
Service level preservation takes precedence over service level enhancements 8<br>
slide9. Water and Wastewater Budget 9<br>
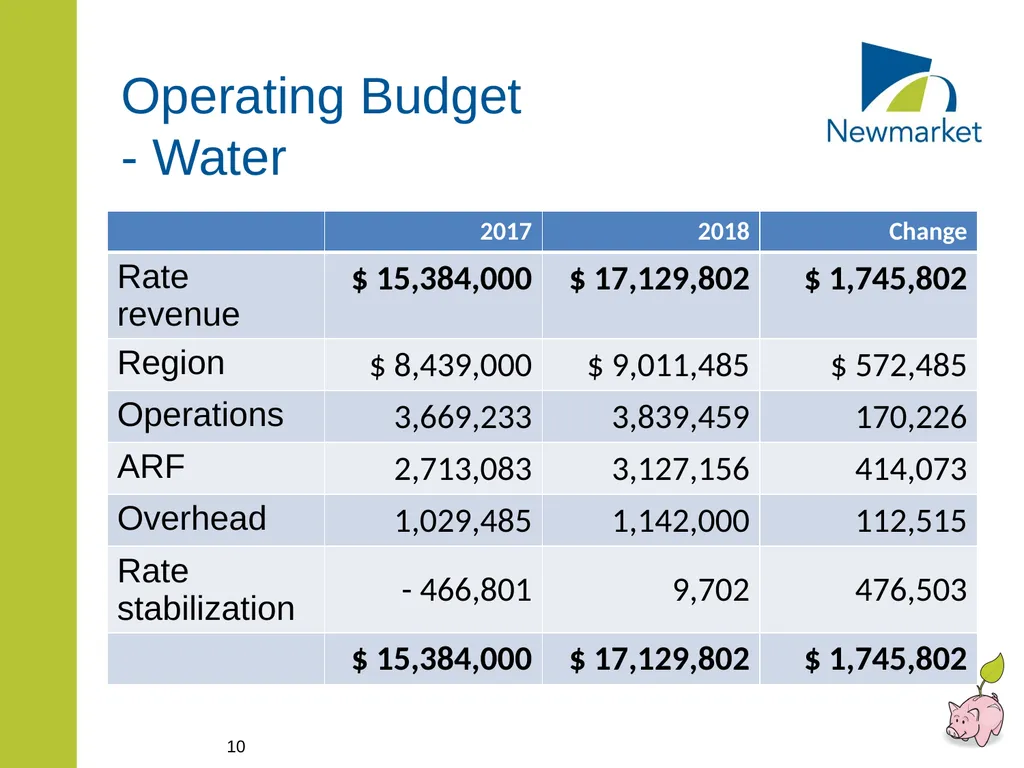
slide10. Operating Budget - Water 10<br>
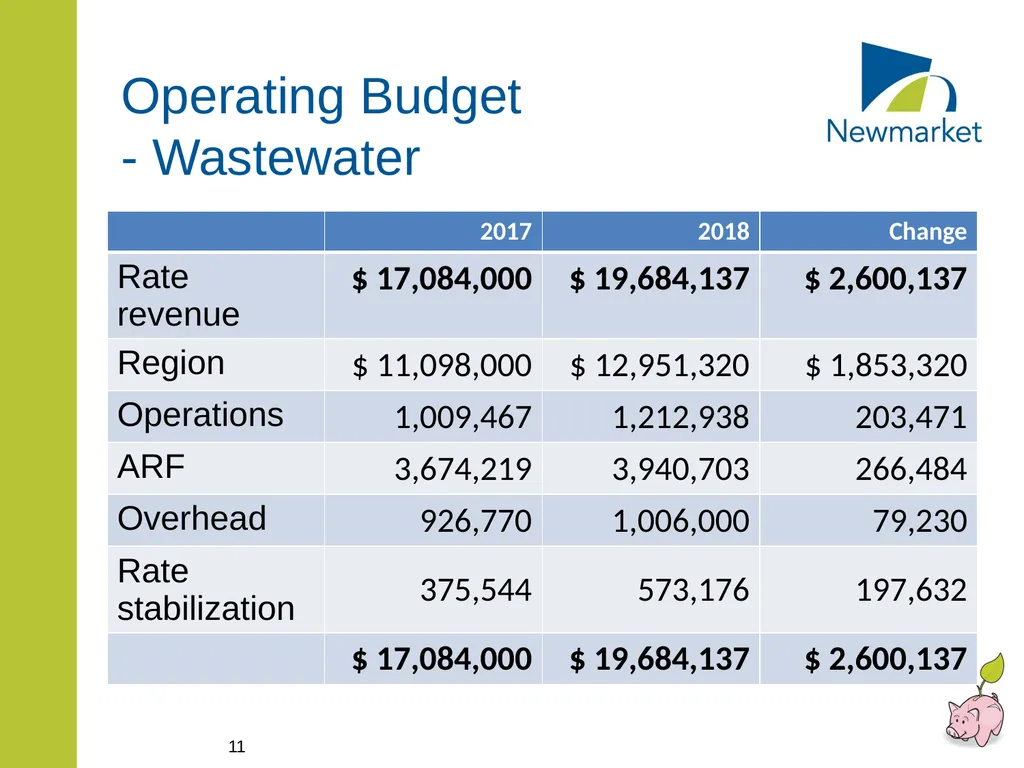
slide11. Operating Budget - Wastewater 11<br>
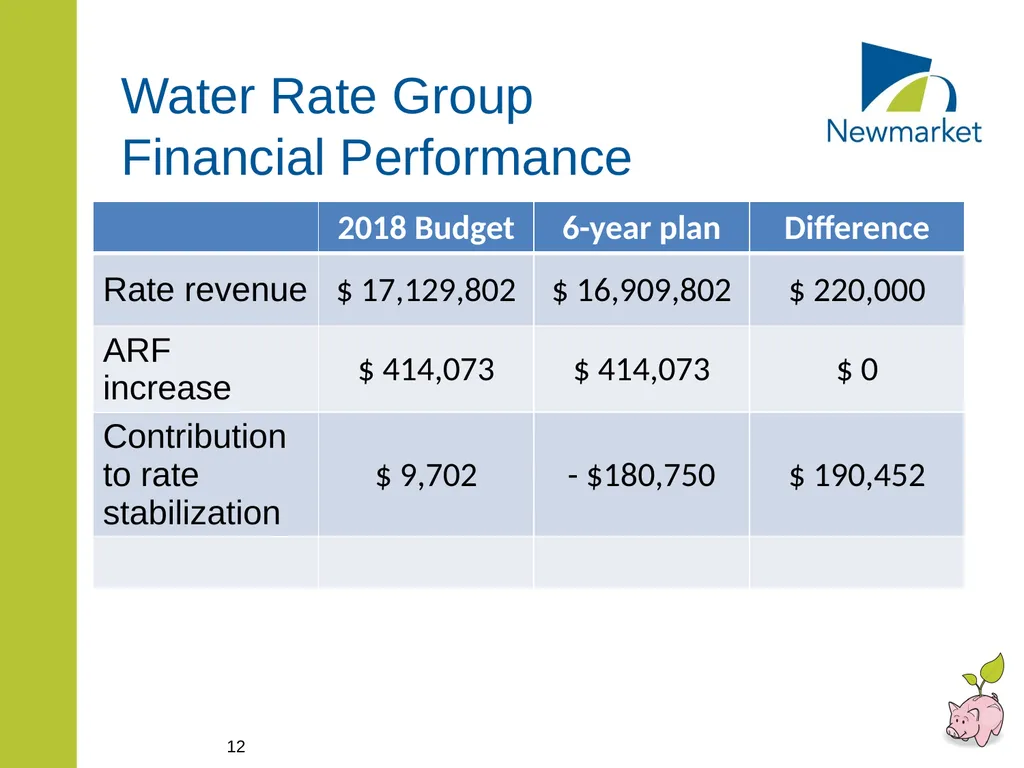
slide12. Water Rate Group Financial Performance 12<br>
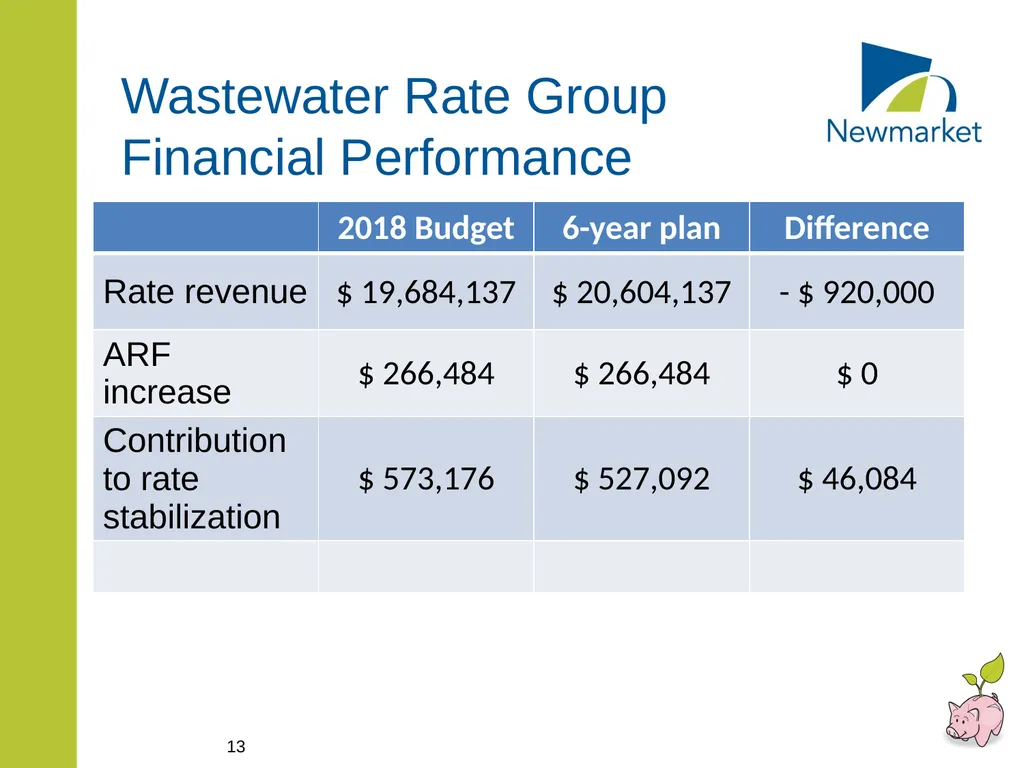
slide13. Wastewater Rate Group Financial Performance 13<br>
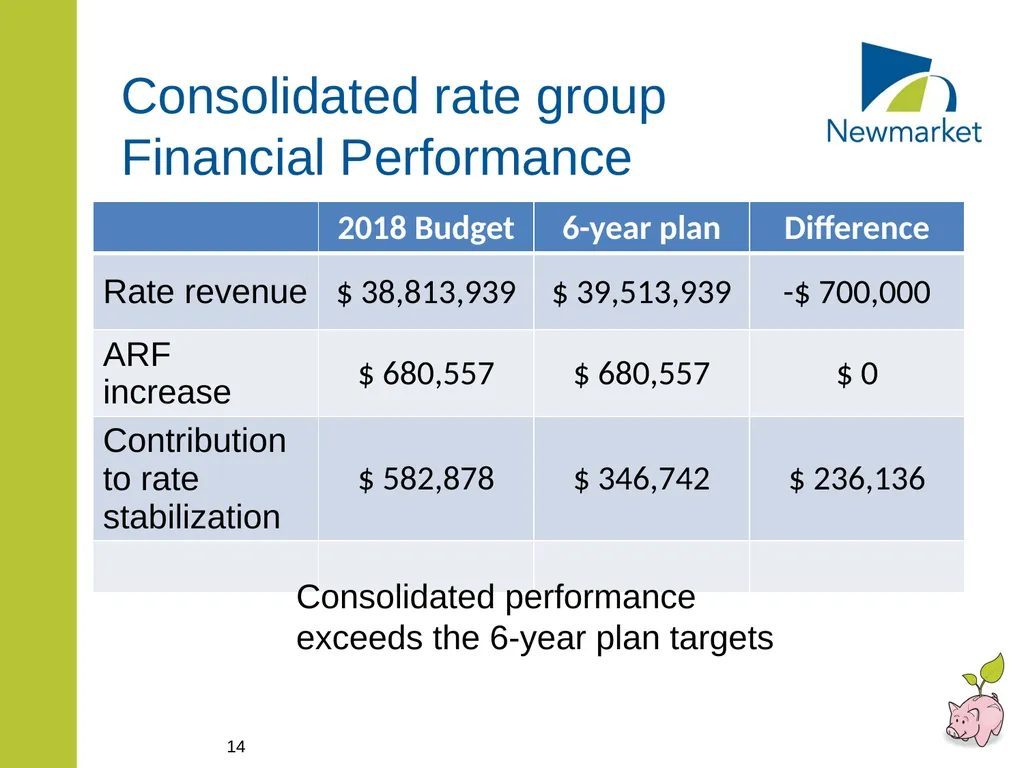
slide14. Consolidated rate group Financial Performance 14 Consolidated performance exceeds the 6-year plan targets<br>
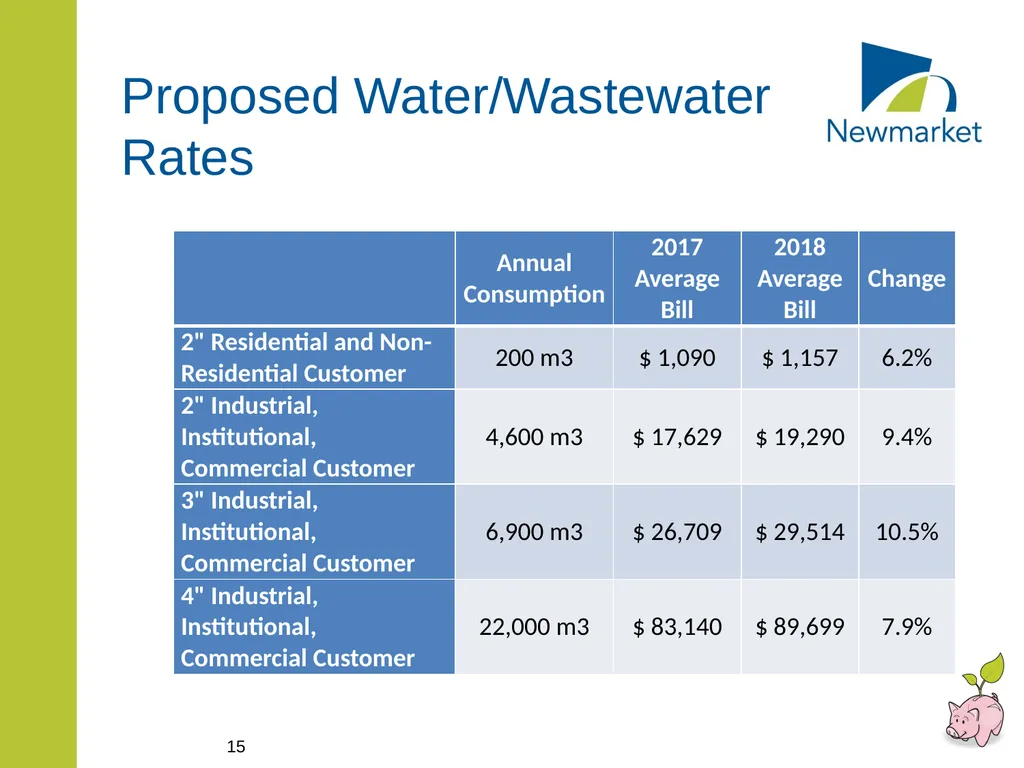
slide15. Proposed Water/Wastewater Rates 15<br>
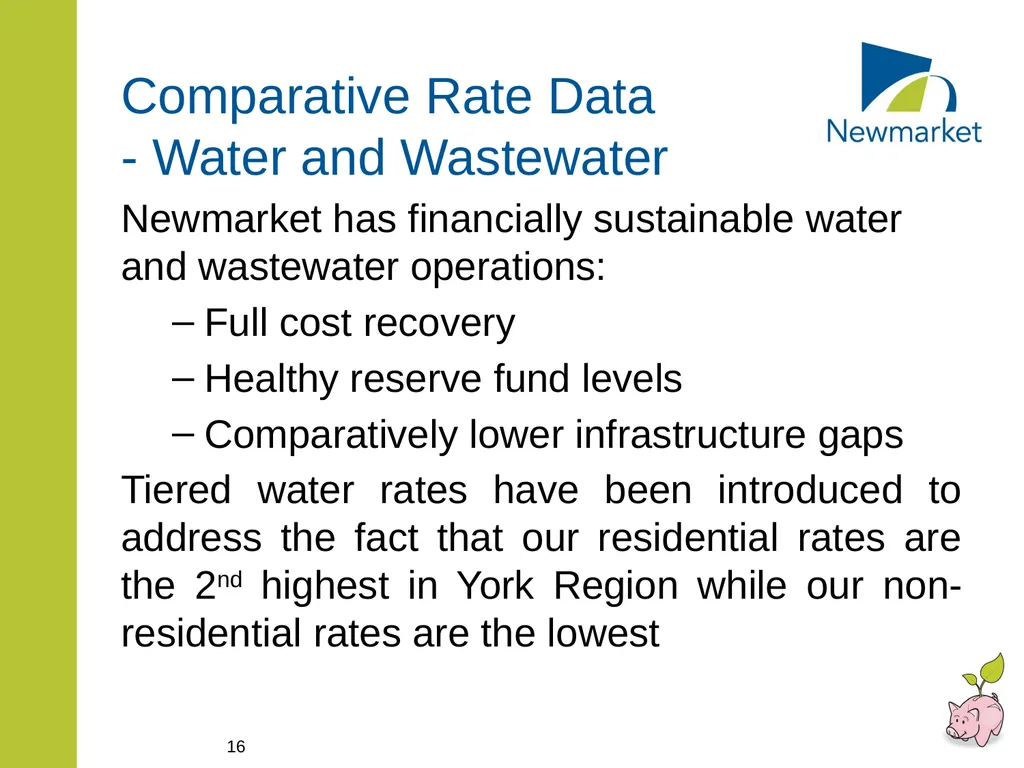
slide16. Comparative Rate Data - Water and Wastewater Newmarket has financially sustainable water and wastewater operations:
Full cost recovery
Healthy reserve fund levels
Comparatively lower infrastructure gaps
Tiered water rates have been introduced to address the fact that our residential rates are the 2nd highest in York Region while our non-residential rates are the lowest 16<br>
slide17. Stormwater Budget 17<br>
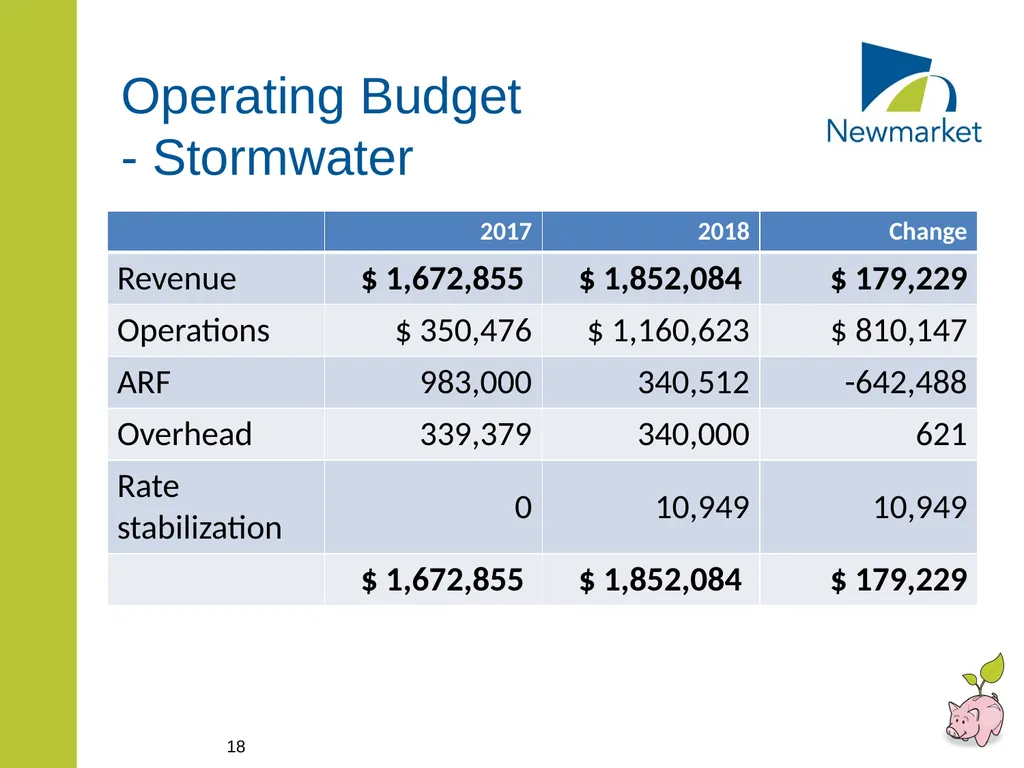
slide18. Operating Budget - Stormwater 18<br>
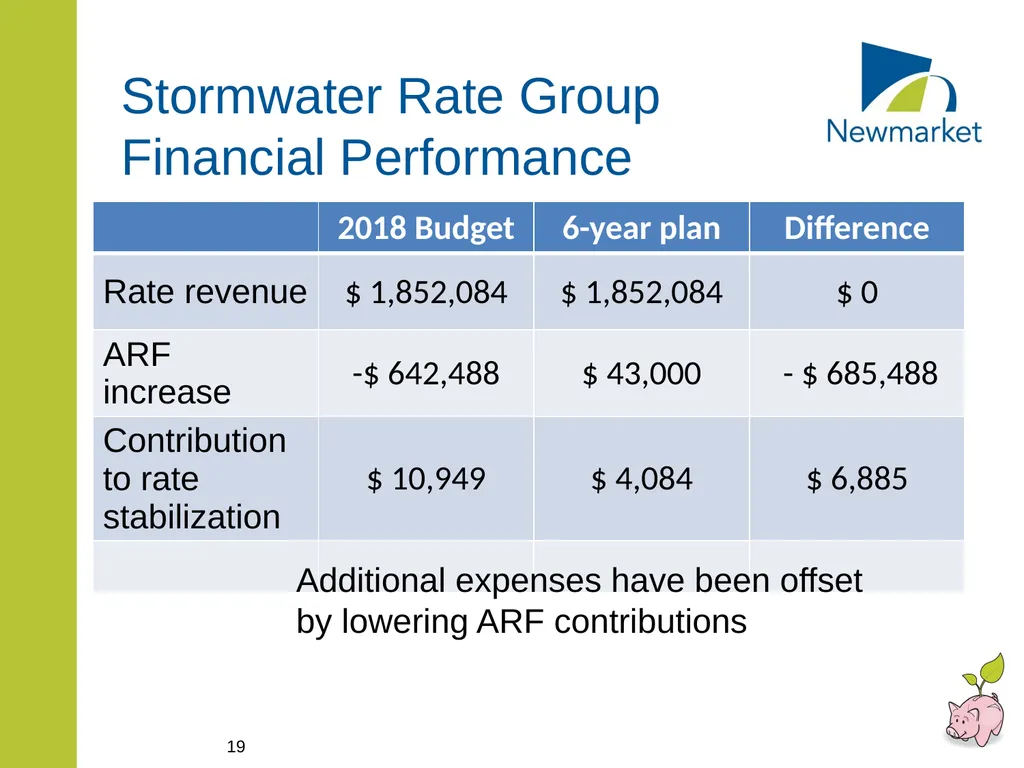
slide19. Stormwater Rate Group Financial Performance 19 Additional expenses have been offset by lowering ARF contributions<br>
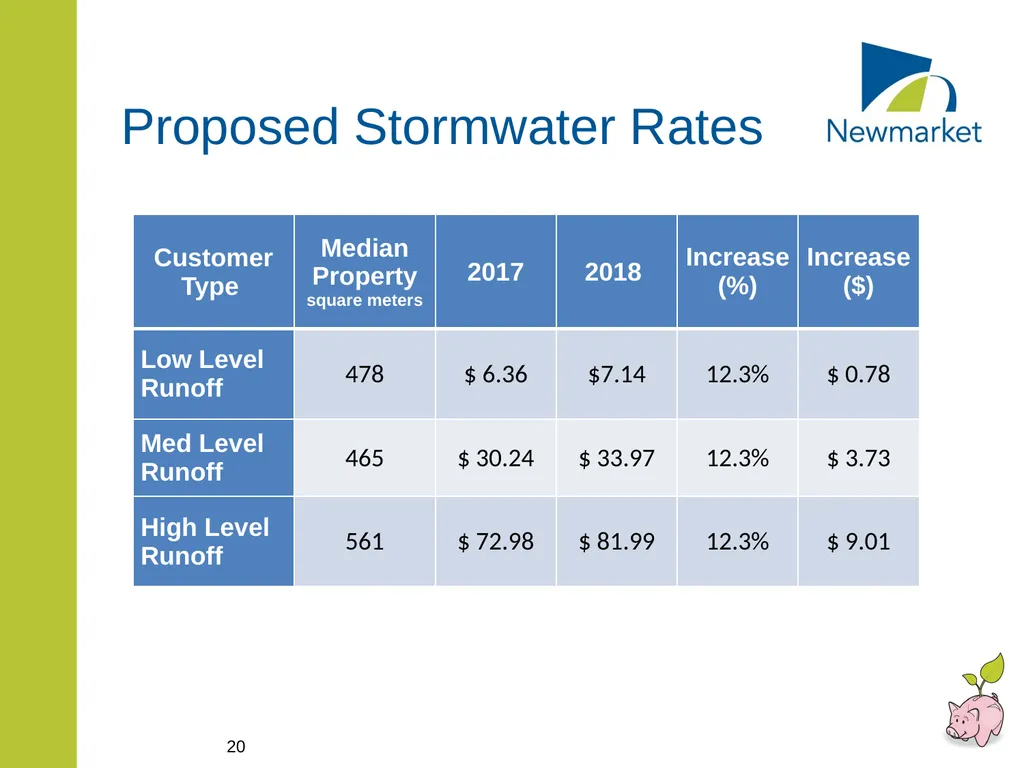
slide20. Proposed Stormwater Rates 20<br>
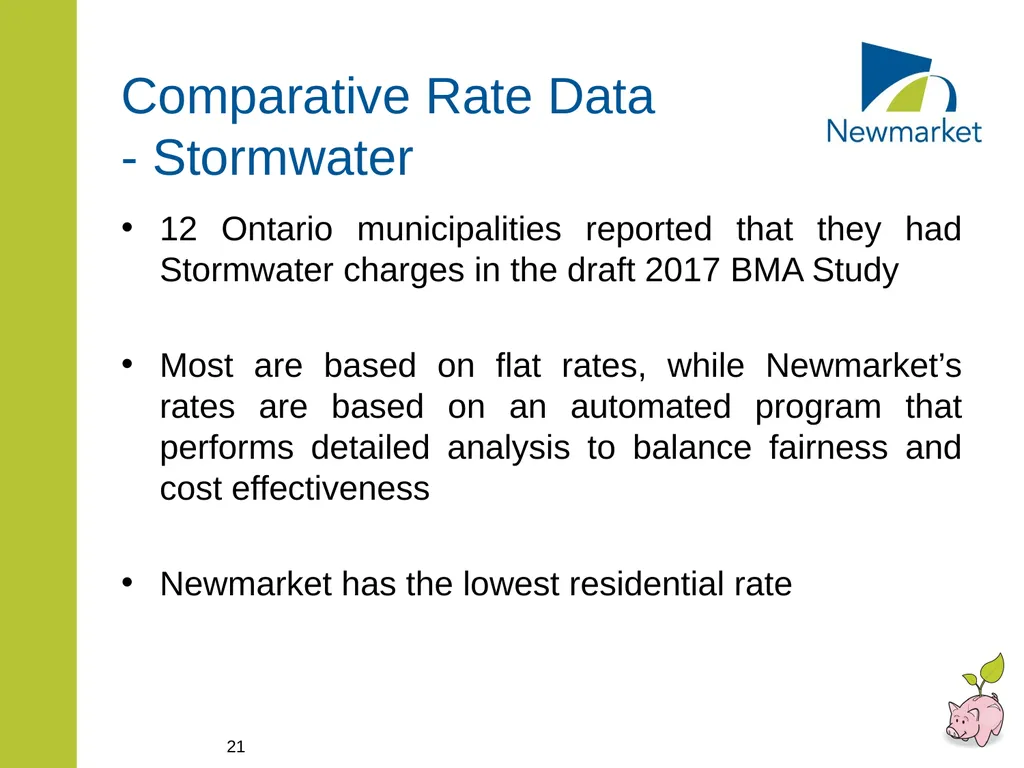
slide21. Comparative Rate Data - Stormwater 12 Ontario municipalities reported that they had Stormwater charges in the draft 2017 BMA Study
Most are based on flat rates, while Newmarket’s rates are based on an automated program that performs detailed analysis to balance fairness and cost effectiveness
Newmarket has the lowest residential rate 21<br>
slide22. Building Department Budget 22<br>
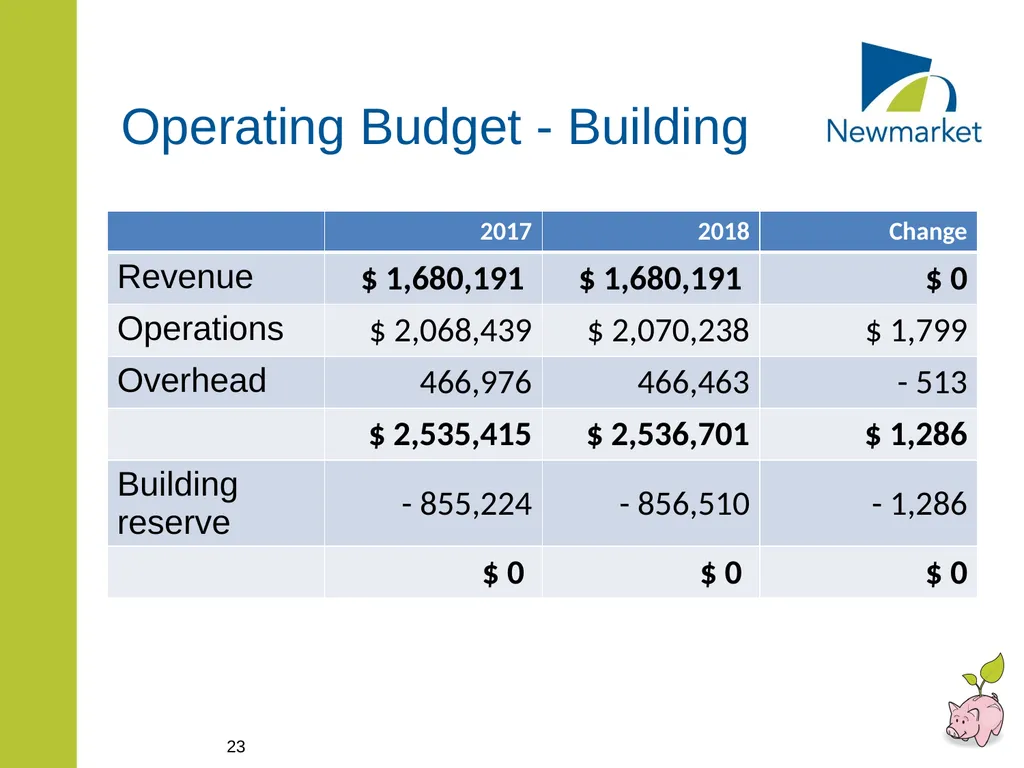
slide23. Operating Budget - Building 23<br>
slide24. Rate Supported Decision Packages 24<br>
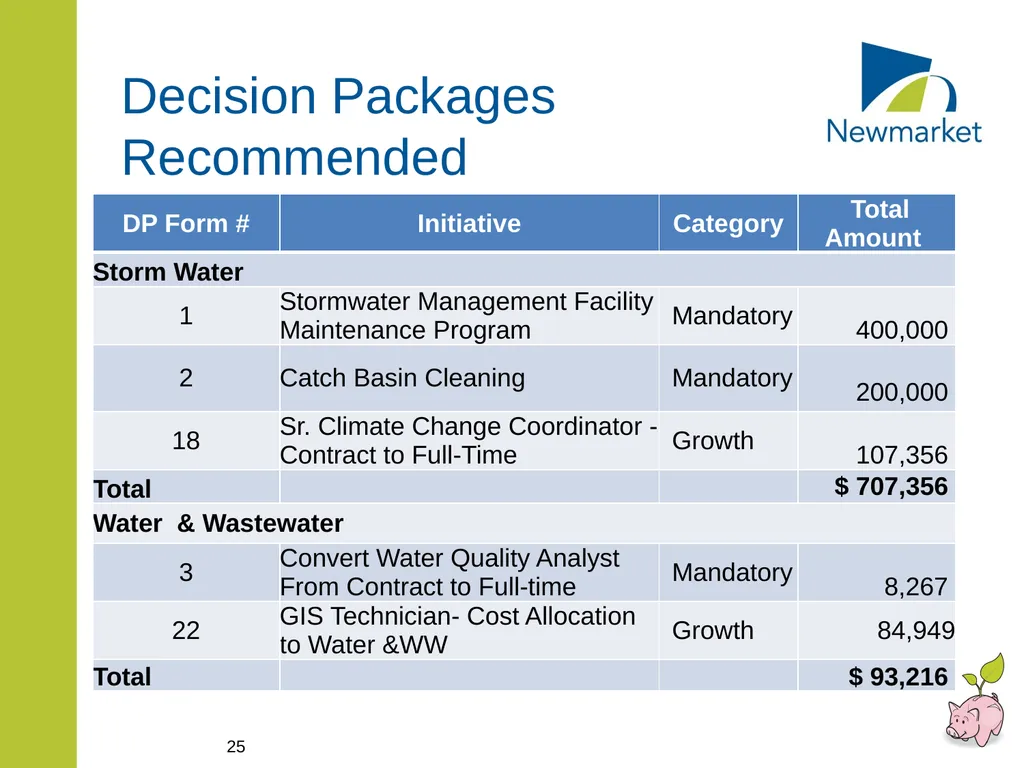
slide25. Decision Packages Recommended 25<br>
slide26. Capital Budget 26<br>
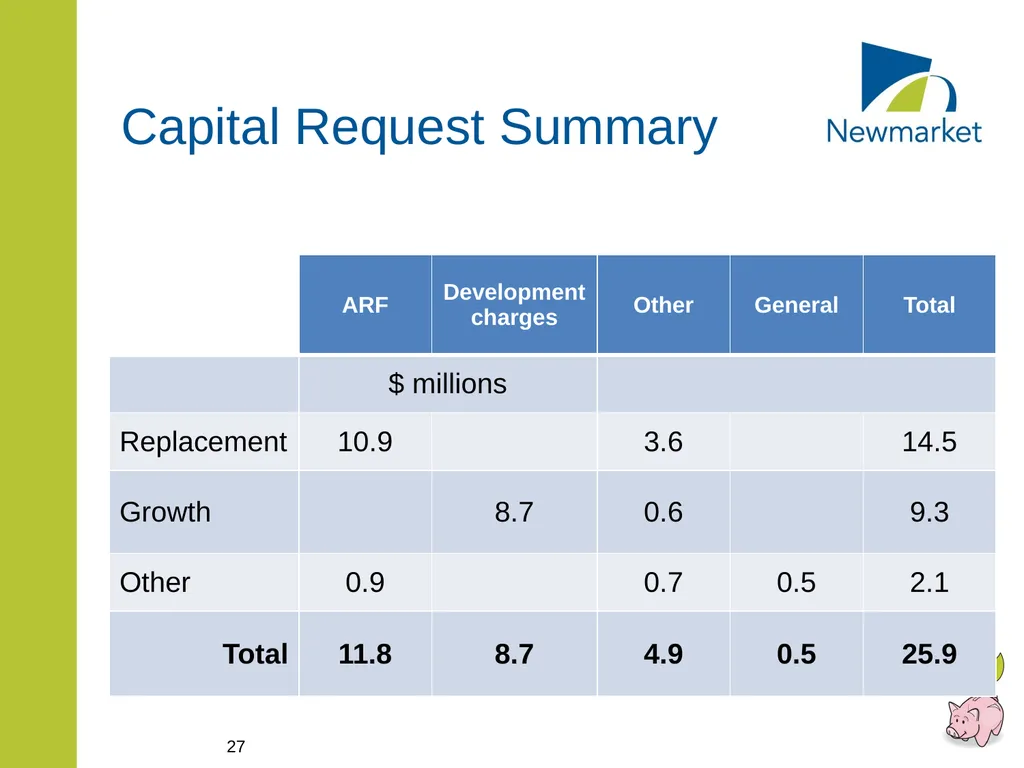
slide27. Capital Request Summary 27<br>
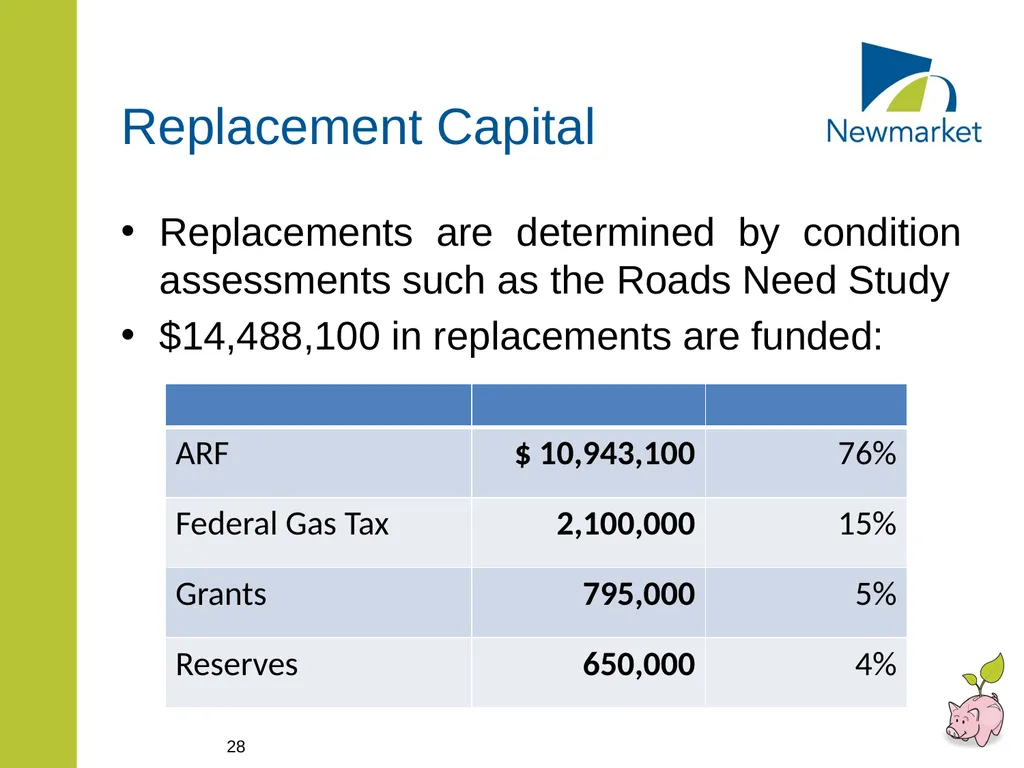
slide28. Replacement Capital Replacements are determined by condition assessments such as the Roads Need Study
$14,488,100 in replacements are funded: 28<br>
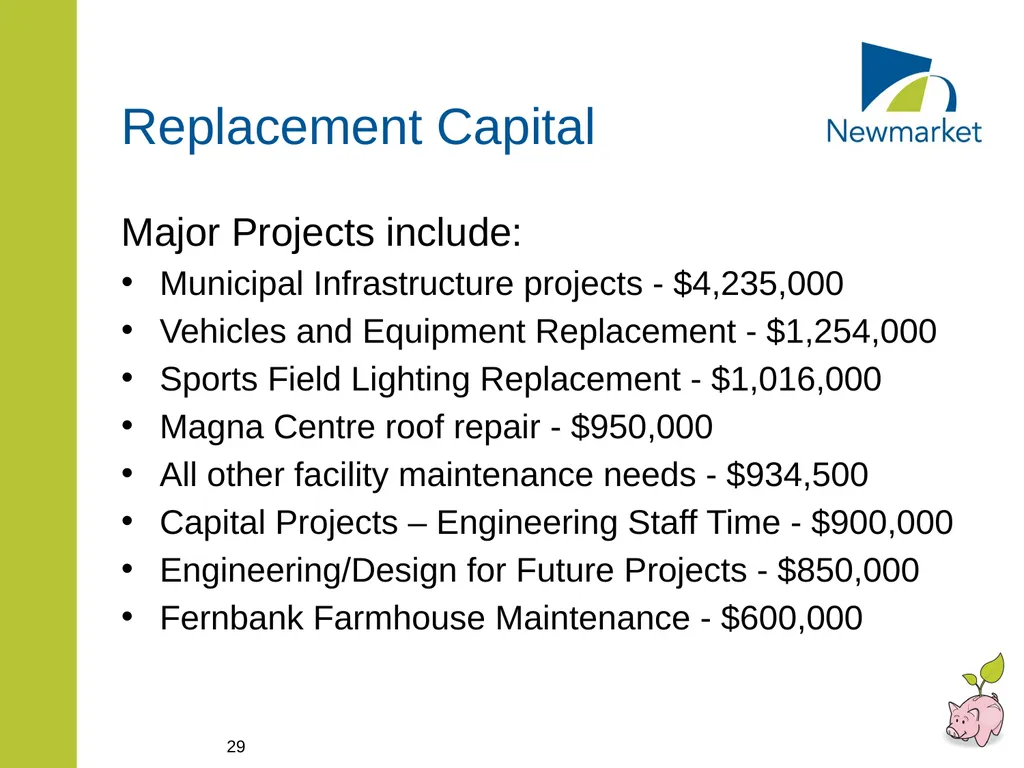
slide29. Replacement Capital Major Projects include:
Municipal Infrastructure projects - $4,235,000
Vehicles and Equipment Replacement - $1,254,000
Sports Field Lighting Replacement - $1,016,000
Magna Centre roof repair - $950,000
All other facility maintenance needs - $934,500
Capital Projects – Engineering Staff Time - $900,000
Engineering/Design for Future Projects - $850,000
Fernbank Farmhouse Maintenance - $600,000 29<br>
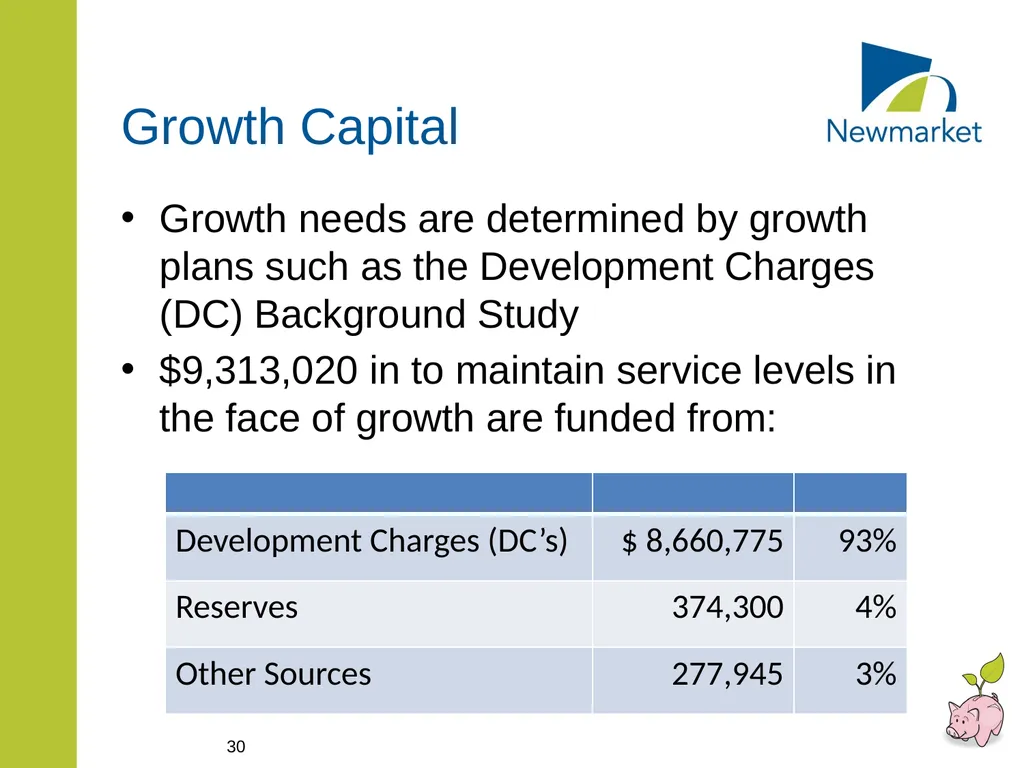
slide30. Growth Capital Growth needs are determined by growth plans such as the Development Charges (DC) Background Study
$9,313,020 in to maintain service levels in the face of growth are funded from: 30<br>
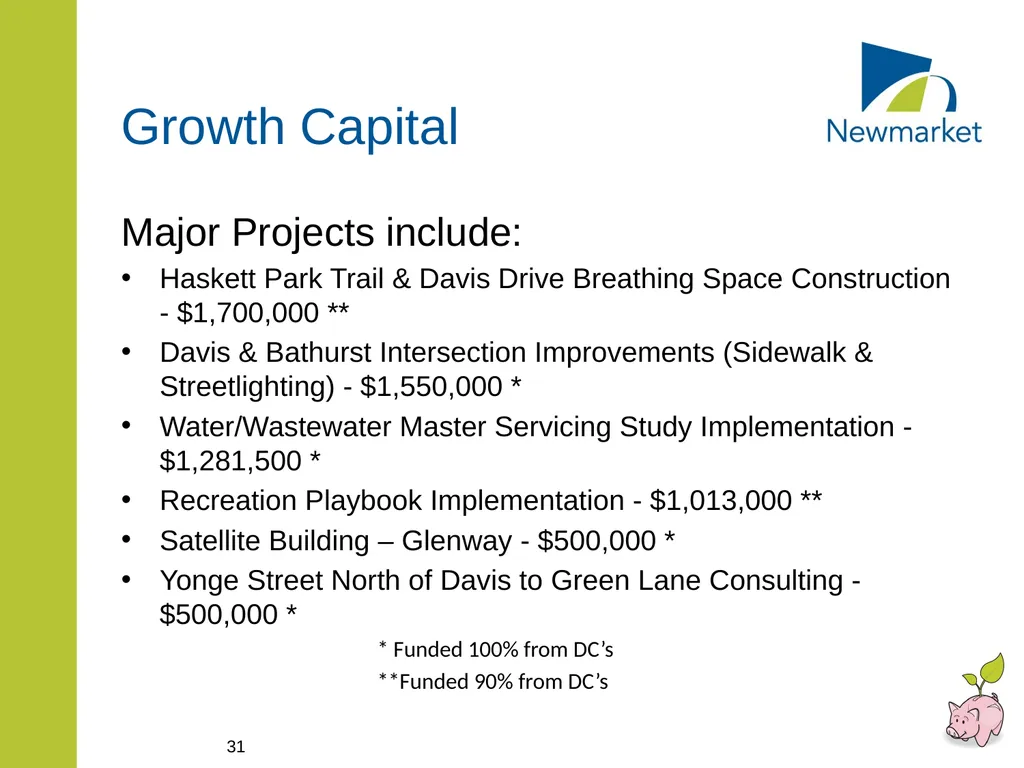
slide31. Growth Capital Major Projects include:
Haskett Park Trail & Davis Drive Breathing Space Construction - $1,700,000 **
Davis & Bathurst Intersection Improvements (Sidewalk & Streetlighting) - $1,550,000 *
Water/Wastewater Master Servicing Study Implementation - $1,281,500 *
Recreation Playbook Implementation - $1,013,000 **
Satellite Building – Glenway - $500,000 *
Yonge Street North of Davis to Green Lane Consulting - $500,000 *
* Funded 100% from DC’s
**Funded 90% from DC’s 31<br>
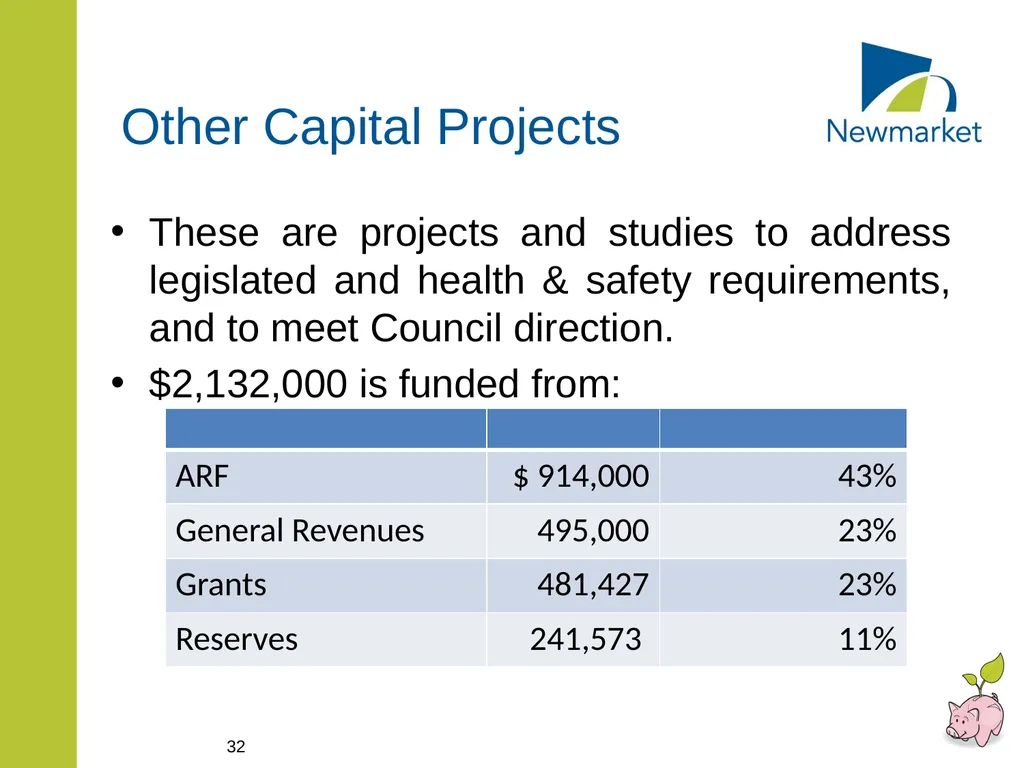
slide32. Other Capital Projects These are projects and studies to address legislated and health & safety requirements, and to meet Council direction.
$2,132,000 is funded from: 32<br>
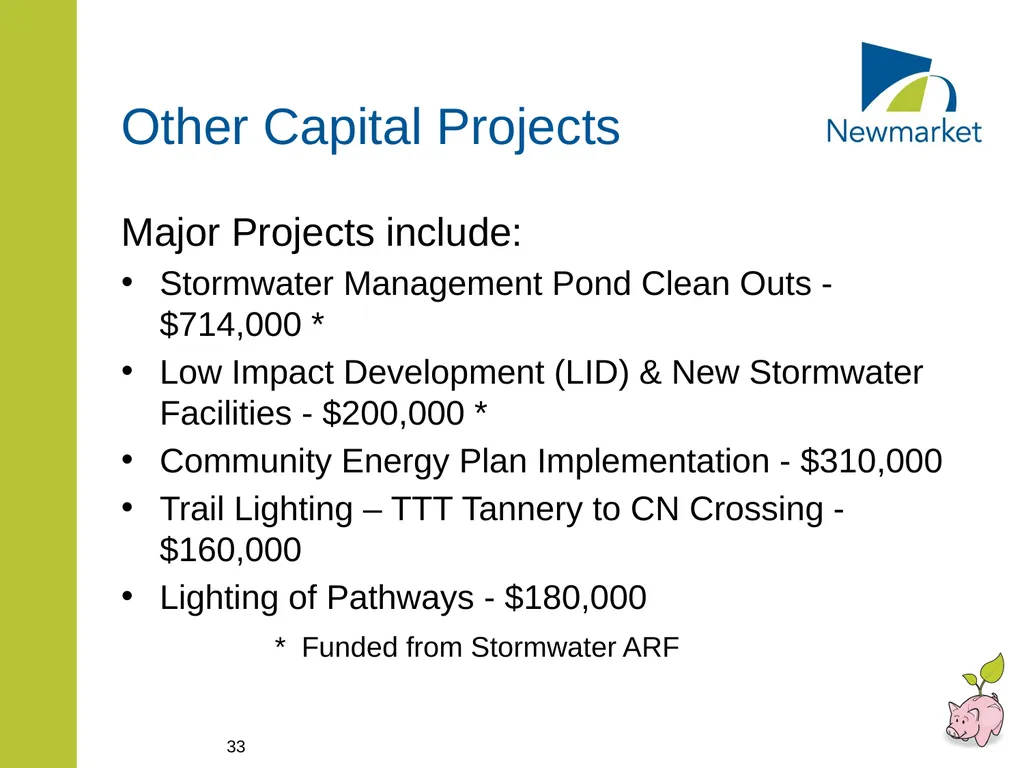
slide33. Other Capital Projects Major Projects include:
Stormwater Management Pond Clean Outs - $714,000 *
Low Impact Development (LID) & New Stormwater Facilities - $200,000 *
Community Energy Plan Implementation - $310,000
Trail Lighting – TTT Tannery to CN Crossing - $160,000
Lighting of Pathways - $180,000
* Funded from Stormwater ARF 33<br>
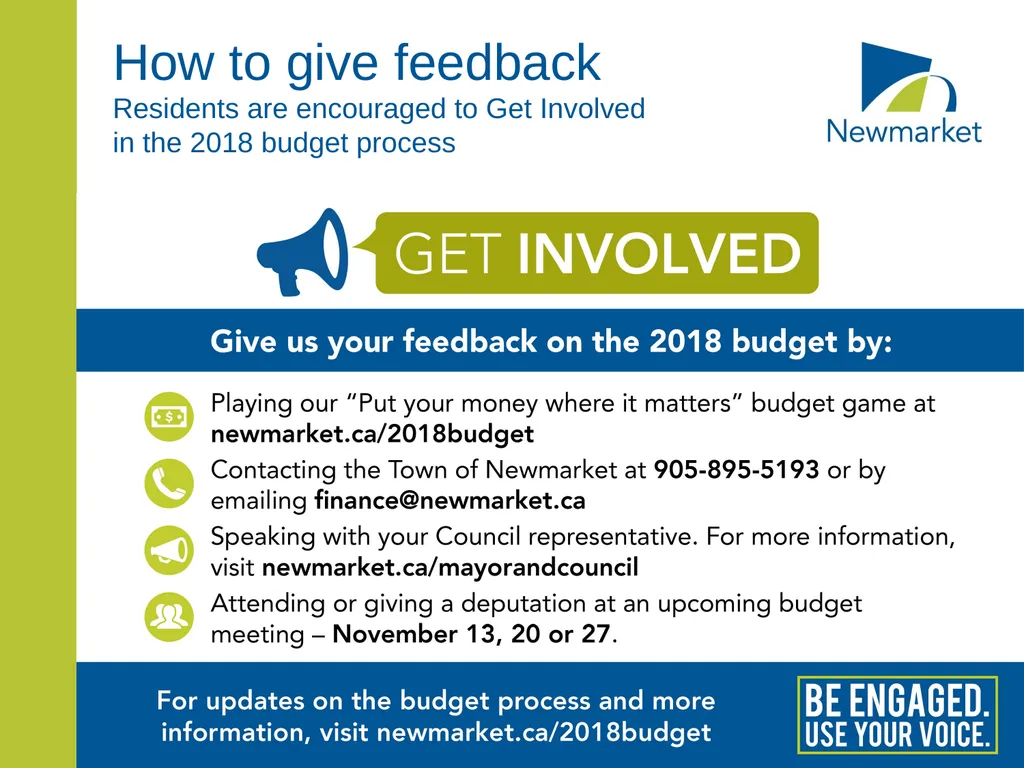
slide34. How to give feedback Residents are encouraged to Get Involved in the 2018 budget process<br>
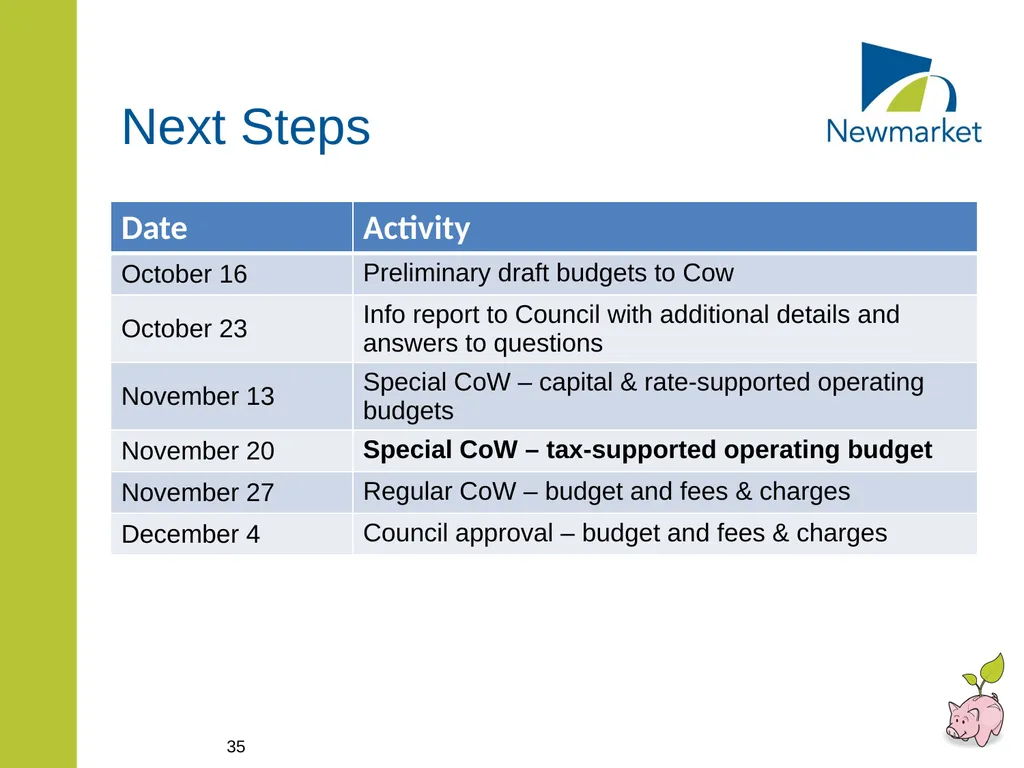
slide35. Next Steps 35<br>
Special Committee of the Whole
November 13, 2017 Presented by:
Mike Mayes, Director, Financial Services 1<br>
slide2. Background 2<br>
slide3. Budget process overview On an annual basis, the Town of Newmarket prepares a budget to authorize its expenditures for the year. For 2018, this includes:
$127 million in operating expenditures
- $84 million in tax-supported operations
- $43 million in rate-supported operations (water, stormwater, building)
$26 million in capital expenditures
When developing the budget, the Town prioritizes projects and services that are required to meet legislative requirements and community needs.
Although the budgets are broken down into service areas, the budget is considered and recommended as a whole to enhance the Town’s decision-making process.<br>
slide4. Potential impact on the average residential property Proposed increases for the average residential property using 200 cubic metres of water per year. 200 cubic metres represents the normal annual household use in Ontario.<br>
slide5. Council Priorities The focus of the 2018 Budget is Sustainability:
Financial
Environmental
Community
Organizational Readiness
Council’s strategic priorities:
Developing corridors and community
Manage assets, maintain service levels and cultivate talent
Cultivate innovation and growth 5<br>
slide6. Budget Schedule 6<br>
slide7. 2018 Budget Process - Definitions Decision Package – budgetary requests for Enhancements, Growth Expenses, and Mandatory Items are submitted with all related costs, net of recoveries
ARF or Asset Replacement Fund – monies set aside in a reserve fund to finance the replacement of existing Capital Assets such as roads, watermains and sewers 7<br>
slide8. 2018 Budget Process - Assumptions Assumptions used in the 2018 Budget:
Inflation – the March 2017 Toronto CPI was used as a predictor of inflation – 2.1%
Growth – the Town’s Growth Revenue Model projects a 1.24% increase for 2018
Preserve service levels for a growing population with any reductions based on prioritization
Service level preservation takes precedence over service level enhancements 8<br>
slide9. Water and Wastewater Budget 9<br>
slide10. Operating Budget - Water 10<br>
slide11. Operating Budget - Wastewater 11<br>
slide12. Water Rate Group Financial Performance 12<br>
slide13. Wastewater Rate Group Financial Performance 13<br>
slide14. Consolidated rate group Financial Performance 14 Consolidated performance exceeds the 6-year plan targets<br>
slide15. Proposed Water/Wastewater Rates 15<br>
slide16. Comparative Rate Data - Water and Wastewater Newmarket has financially sustainable water and wastewater operations:
Full cost recovery
Healthy reserve fund levels
Comparatively lower infrastructure gaps
Tiered water rates have been introduced to address the fact that our residential rates are the 2nd highest in York Region while our non-residential rates are the lowest 16<br>
slide17. Stormwater Budget 17<br>
slide18. Operating Budget - Stormwater 18<br>
slide19. Stormwater Rate Group Financial Performance 19 Additional expenses have been offset by lowering ARF contributions<br>
slide20. Proposed Stormwater Rates 20<br>
slide21. Comparative Rate Data - Stormwater 12 Ontario municipalities reported that they had Stormwater charges in the draft 2017 BMA Study
Most are based on flat rates, while Newmarket’s rates are based on an automated program that performs detailed analysis to balance fairness and cost effectiveness
Newmarket has the lowest residential rate 21<br>
slide22. Building Department Budget 22<br>
slide23. Operating Budget - Building 23<br>
slide24. Rate Supported Decision Packages 24<br>
slide25. Decision Packages Recommended 25<br>
slide26. Capital Budget 26<br>
slide27. Capital Request Summary 27<br>
slide28. Replacement Capital Replacements are determined by condition assessments such as the Roads Need Study
$14,488,100 in replacements are funded: 28<br>
slide29. Replacement Capital Major Projects include:
Municipal Infrastructure projects - $4,235,000
Vehicles and Equipment Replacement - $1,254,000
Sports Field Lighting Replacement - $1,016,000
Magna Centre roof repair - $950,000
All other facility maintenance needs - $934,500
Capital Projects – Engineering Staff Time - $900,000
Engineering/Design for Future Projects - $850,000
Fernbank Farmhouse Maintenance - $600,000 29<br>
slide30. Growth Capital Growth needs are determined by growth plans such as the Development Charges (DC) Background Study
$9,313,020 in to maintain service levels in the face of growth are funded from: 30<br>
slide31. Growth Capital Major Projects include:
Haskett Park Trail & Davis Drive Breathing Space Construction - $1,700,000 **
Davis & Bathurst Intersection Improvements (Sidewalk & Streetlighting) - $1,550,000 *
Water/Wastewater Master Servicing Study Implementation - $1,281,500 *
Recreation Playbook Implementation - $1,013,000 **
Satellite Building – Glenway - $500,000 *
Yonge Street North of Davis to Green Lane Consulting - $500,000 *
* Funded 100% from DC’s
**Funded 90% from DC’s 31<br>
slide32. Other Capital Projects These are projects and studies to address legislated and health & safety requirements, and to meet Council direction.
$2,132,000 is funded from: 32<br>
slide33. Other Capital Projects Major Projects include:
Stormwater Management Pond Clean Outs - $714,000 *
Low Impact Development (LID) & New Stormwater Facilities - $200,000 *
Community Energy Plan Implementation - $310,000
Trail Lighting – TTT Tannery to CN Crossing - $160,000
Lighting of Pathways - $180,000
* Funded from Stormwater ARF 33<br>
slide34. How to give feedback Residents are encouraged to Get Involved in the 2018 budget process<br>
slide35. Next Steps 35<br>