Capital infusion – Is the business appealing
Description: Capital infusion Is the business appealing enough to attract investors? Serving the Cause of Public Interest Indian Actuarial Profession Vichitra Malhotra Gopal Kumar Ishwar Gopashetti Guide: Mayur Ankolekar Agenda 2 Introduction Industry
Related Topics
Download Presentation
"Capital infusion – Is the business appealing" is the property of its rightful owner. Permission is granted to download and print the materials on this website for personal, non-commercial use only, and to display it on your personal computer provided you do not modify the materials and that you retain all copyright notices contained in the materials. By downloading content from our website, you accept the terms of this agreement.
Presentation Transcript
slide1. Capital infusion – Is the business appealing enough to attract investors? Serving the Cause of Public Interest Indian Actuarial Profession Vichitra Malhotra
Gopal Kumar
Ishwar Gopashetti
Guide: Mayur Ankolekar<br>
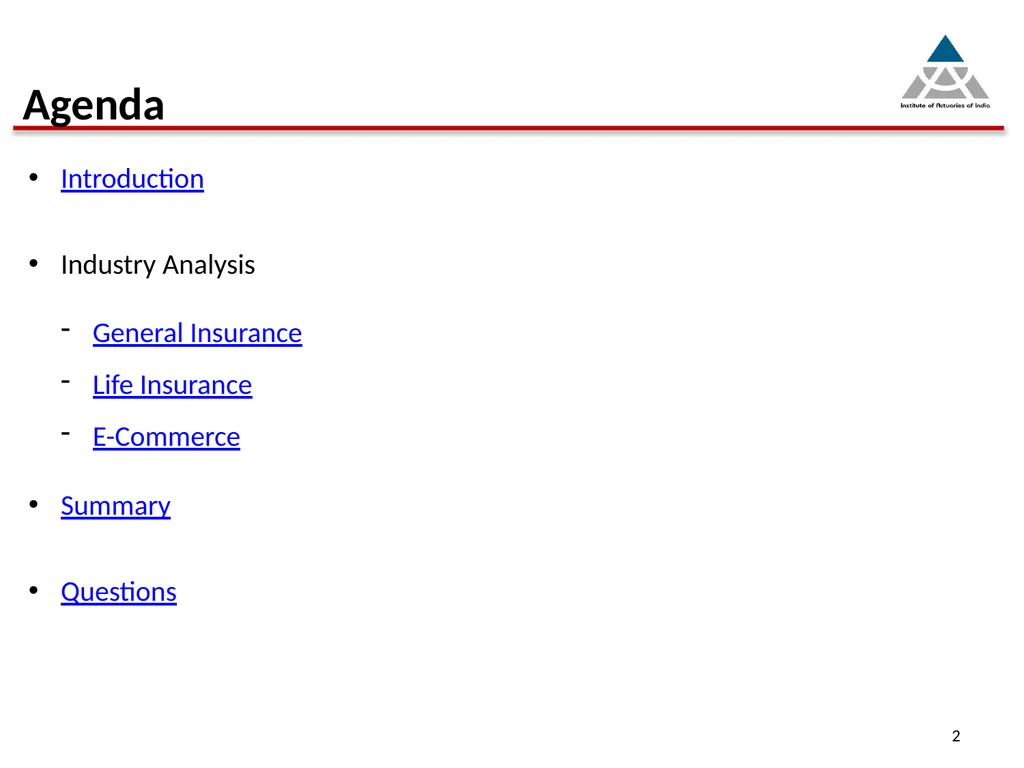
slide2. Agenda 2 Introduction
Industry Analysis
General Insurance
Life Insurance
E-Commerce
Summary
Questions<br>
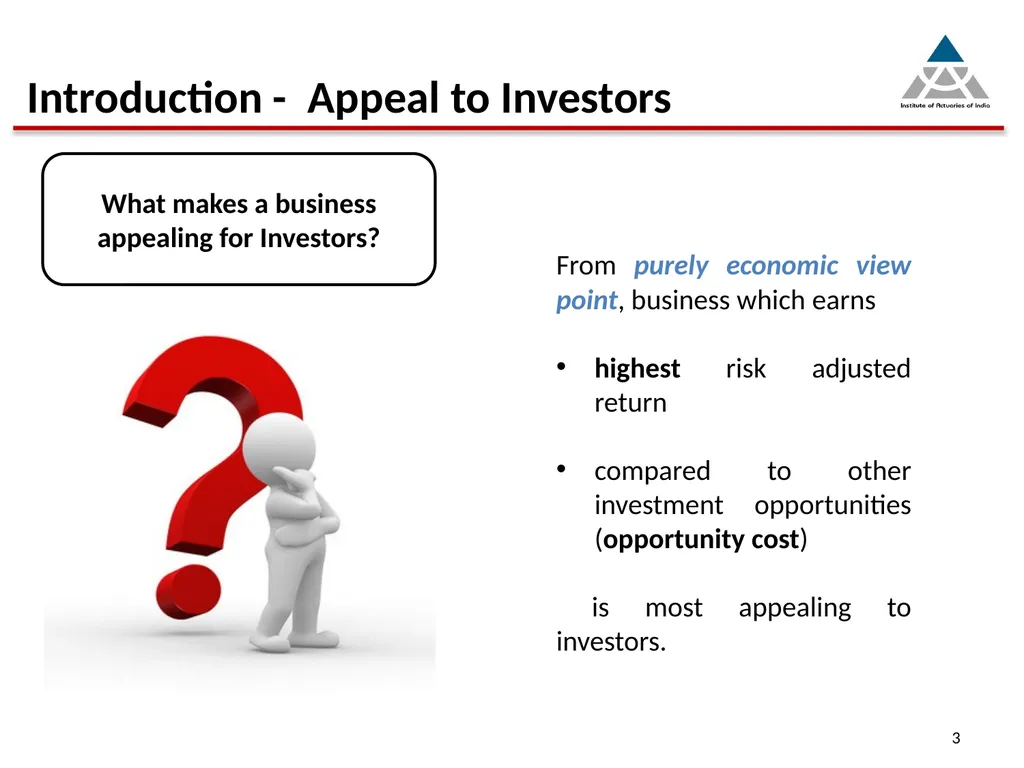
slide3. Introduction - Appeal to Investors 3 From purely economic view point, business which earns
highest risk adjusted return
compared to other investment opportunities (opportunity cost)
is most appealing to investors.<br>
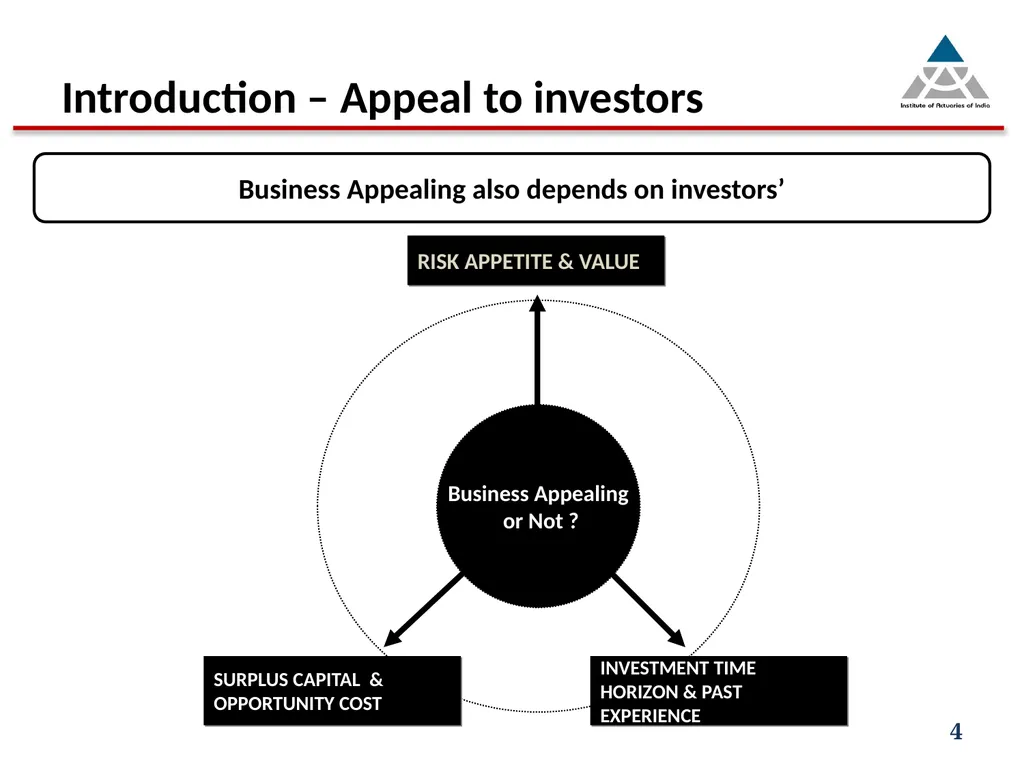
slide4. Introduction – Appeal to investors SURPLUS CAPITAL & OPPORTUNITY COST INVESTMENT TIME HORIZON & PAST EXPERIENCE RISK APPETITE & VALUE Business Appealing
or Not ? Business Appealing also depends on investors’ 4<br>
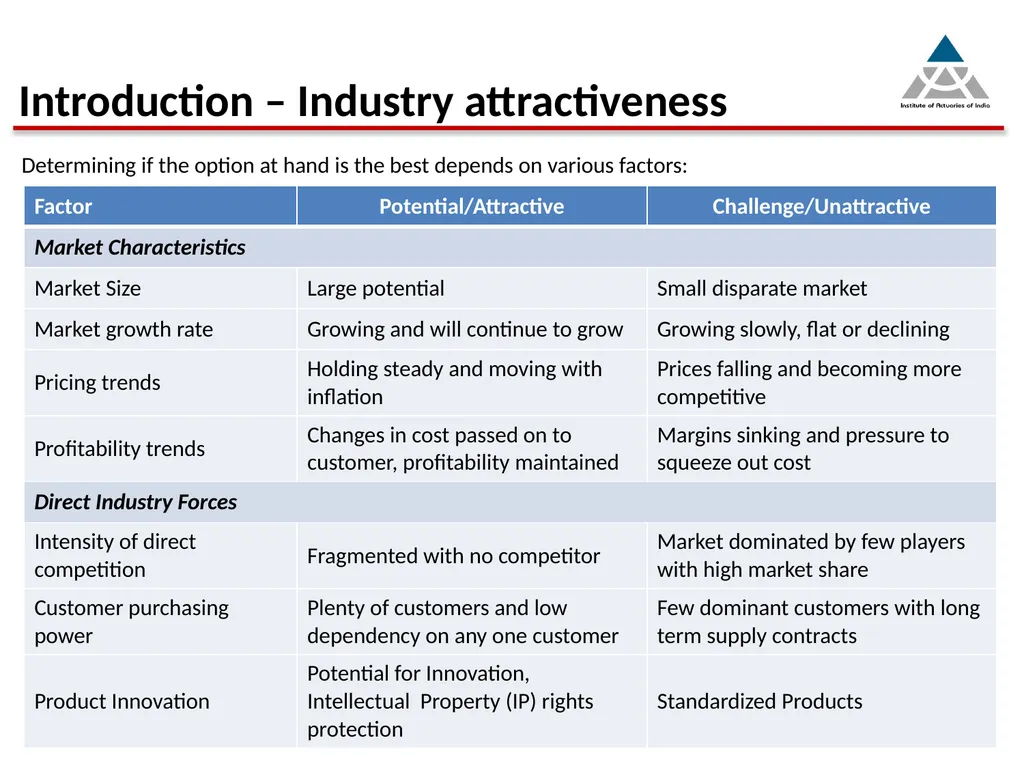
slide5. Introduction – Industry attractiveness Determining if the option at hand is the best depends on various factors: 5<br>
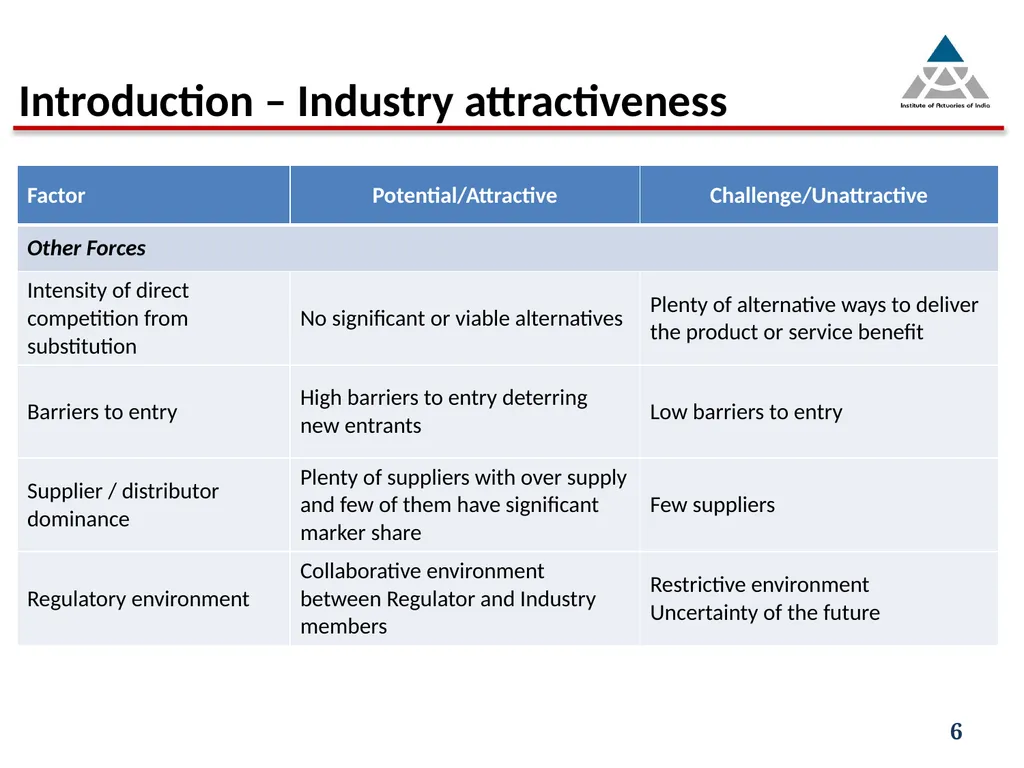
slide6. Introduction – Industry attractiveness 6<br>
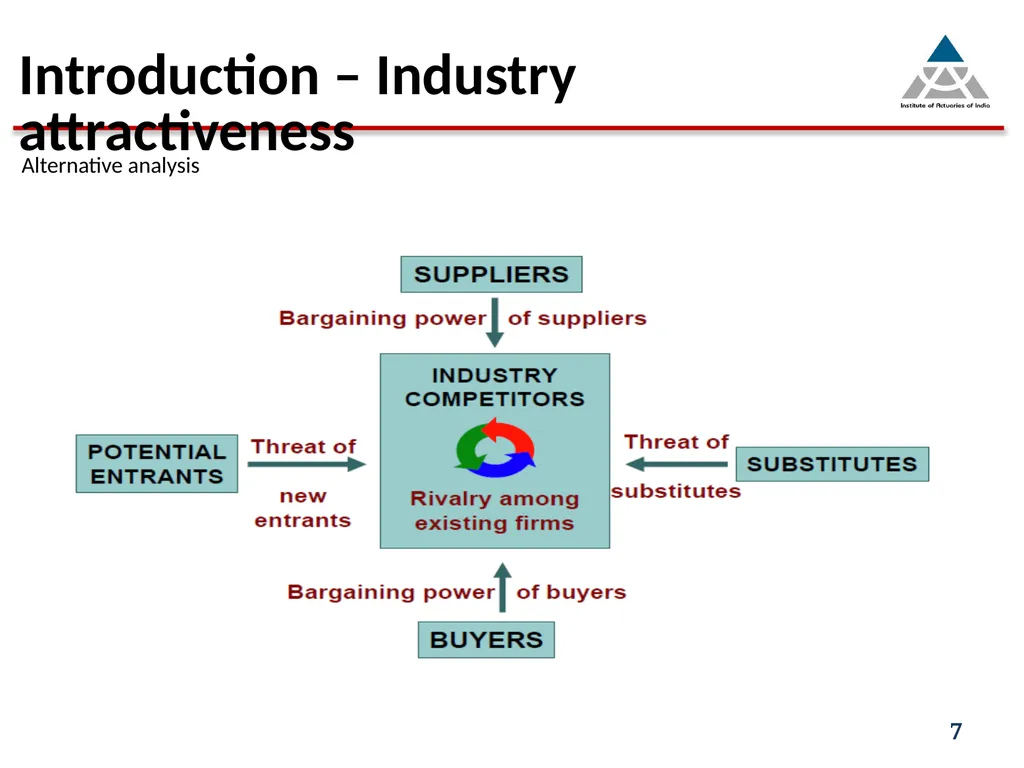
slide7. 7 Alternative analysis Introduction – Industry attractiveness<br>
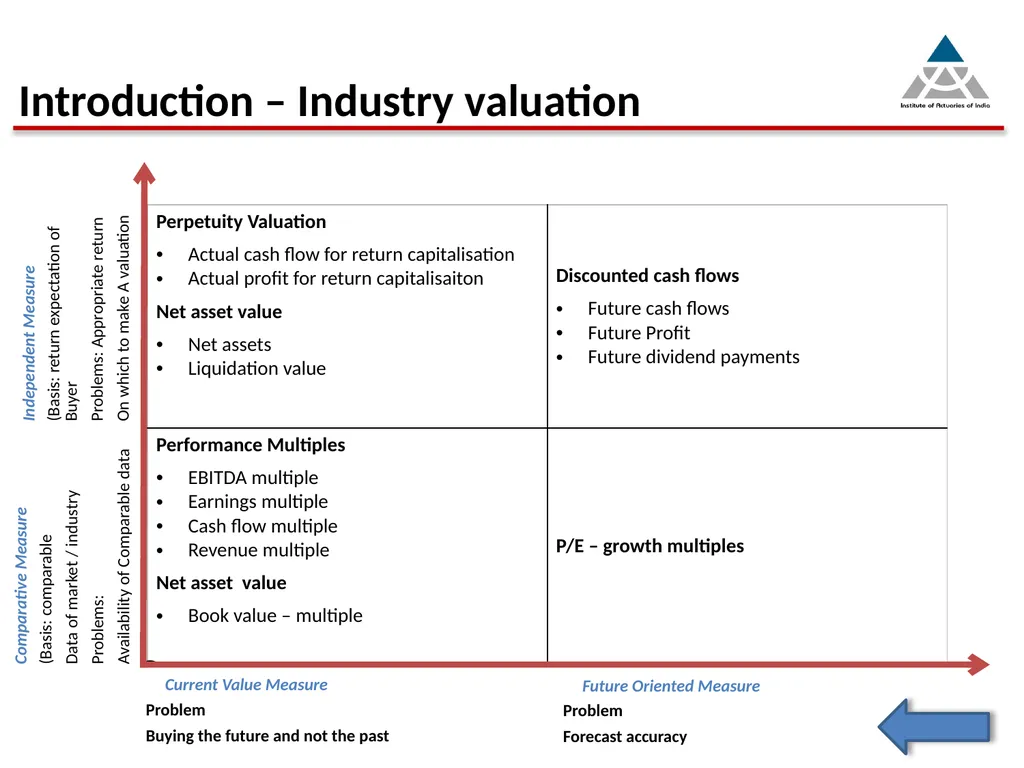
slide8. Introduction – Industry valuation Future Oriented Measure
Problem
Forecast accuracy 8<br>
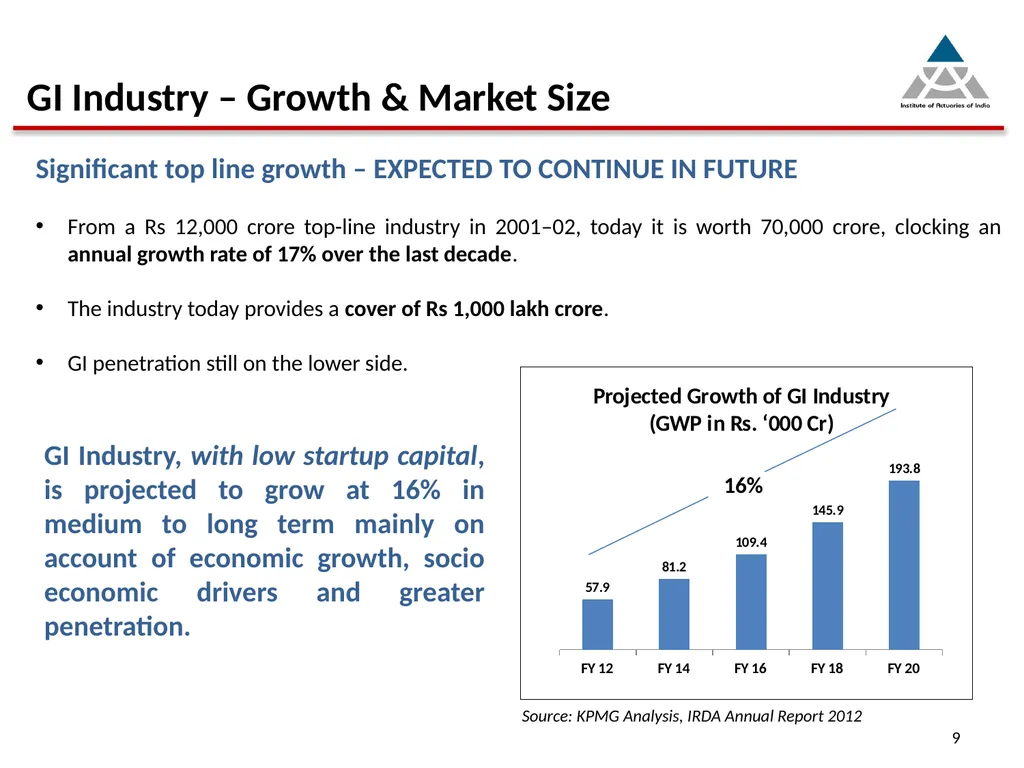
slide9. GI Industry – Growth & Market Size 9 Significant top line growth – EXPECTED TO CONTINUE IN FUTURE
From a Rs 12,000 crore top-line industry in 2001–02, today it is worth 70,000 crore, clocking an annual growth rate of 17% over the last decade.
The industry today provides a cover of Rs 1,000 lakh crore.
GI penetration still on the lower side. GI Industry, with low startup capital, is projected to grow at 16% in medium to long term mainly on account of economic growth, socio economic drivers and greater penetration. Source: KPMG Analysis, IRDA Annual Report 2012 16%<br>
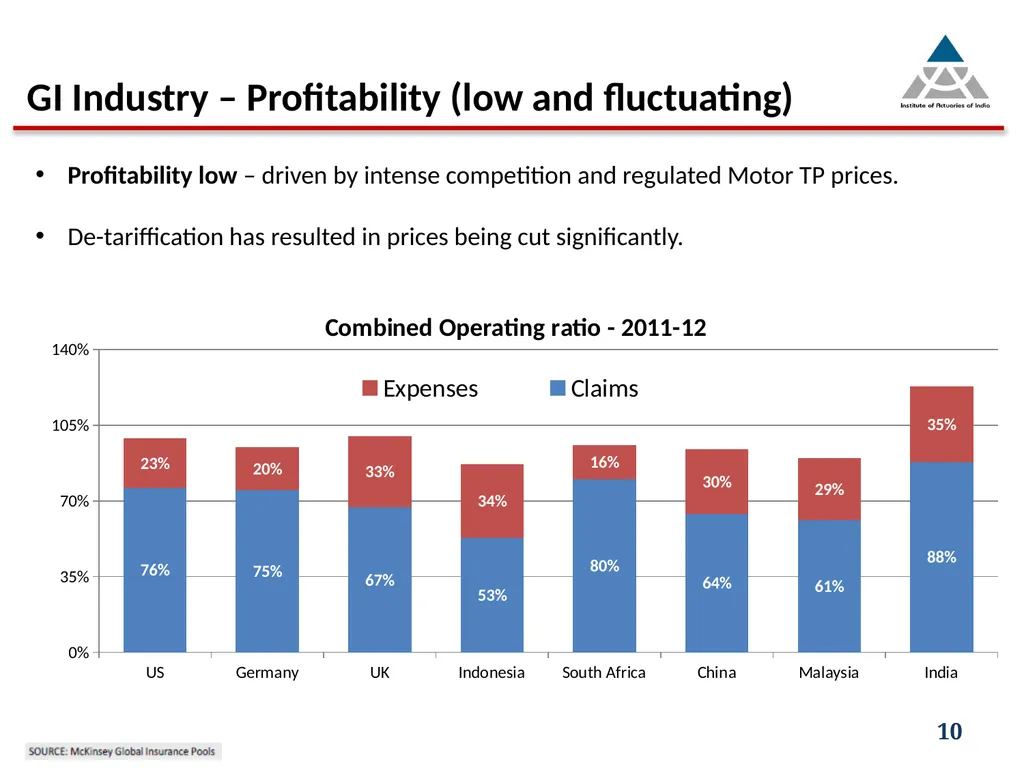
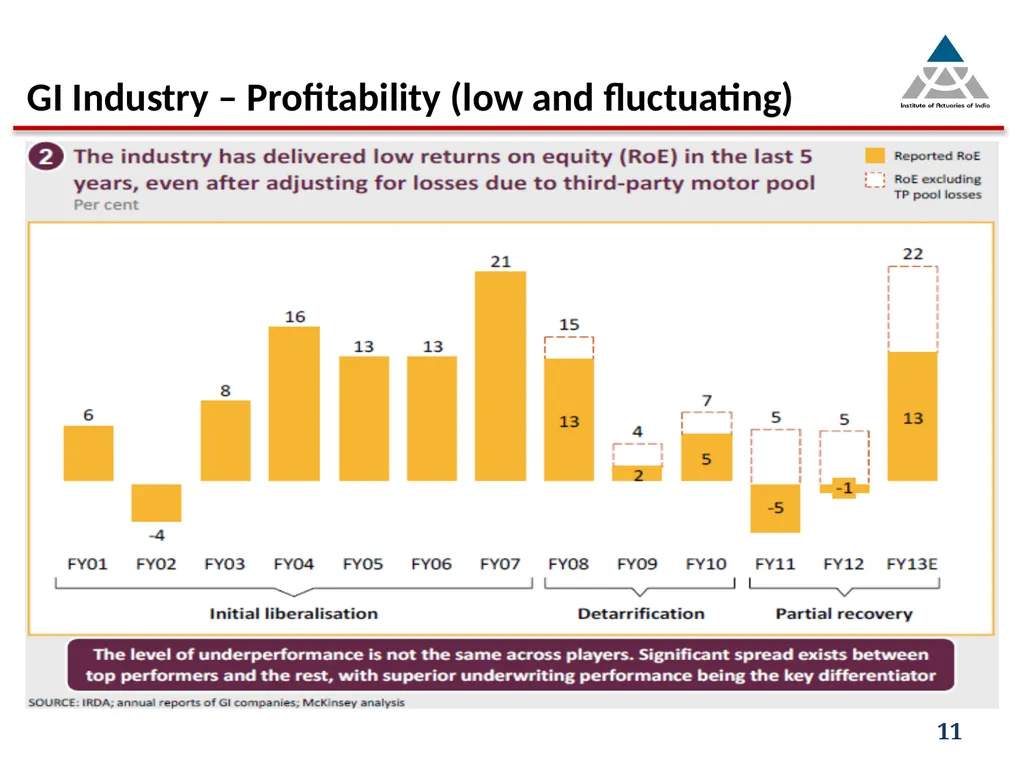
slide10. GI Industry – Profitability (low and fluctuating) Profitability low – driven by intense competition and regulated Motor TP prices.
De-tariffication has resulted in prices being cut significantly. 10<br>
slide11. GI Industry – Profitability (low and fluctuating) 11<br>
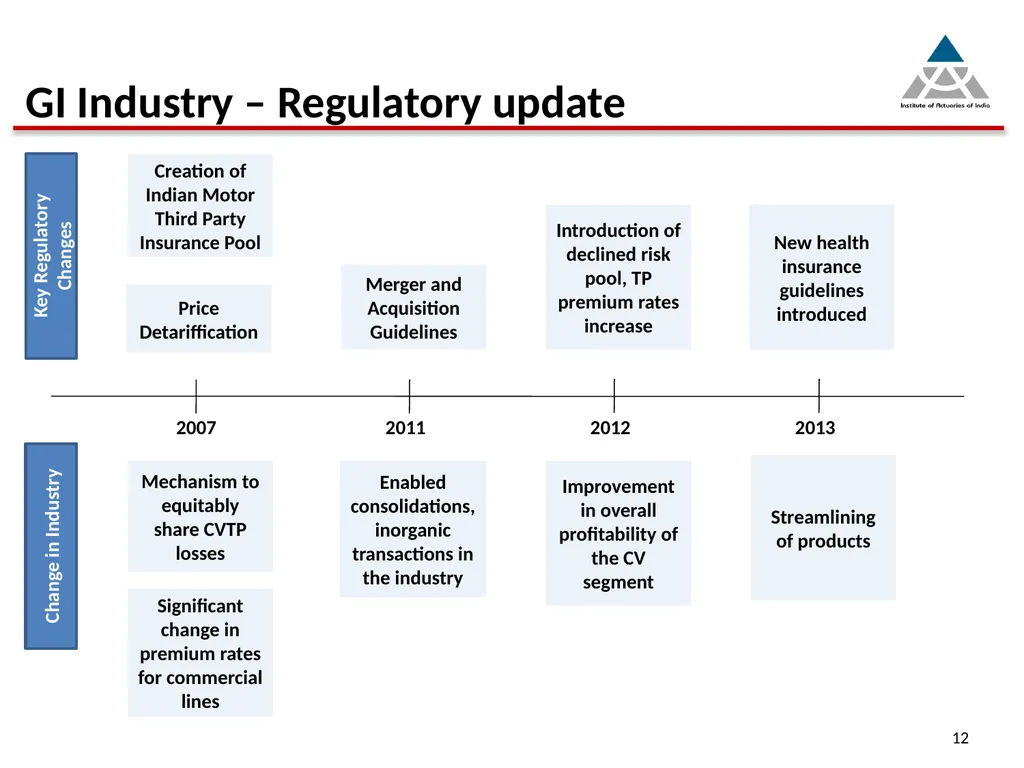
slide12. GI Industry – Regulatory update 12 Key Regulatory Changes Change in Industry 2007 Price Detariffication Creation of Indian Motor Third Party Insurance Pool Mechanism to equitably share CVTP losses Significant change in premium rates for commercial lines 2011 Merger and Acquisition Guidelines Enabled consolidations, inorganic transactions in the industry 2012 Introduction of declined risk pool, TP premium rates increase Improvement in overall profitability of the CV segment 2013 New health insurance guidelines introduced Streamlining of products<br>
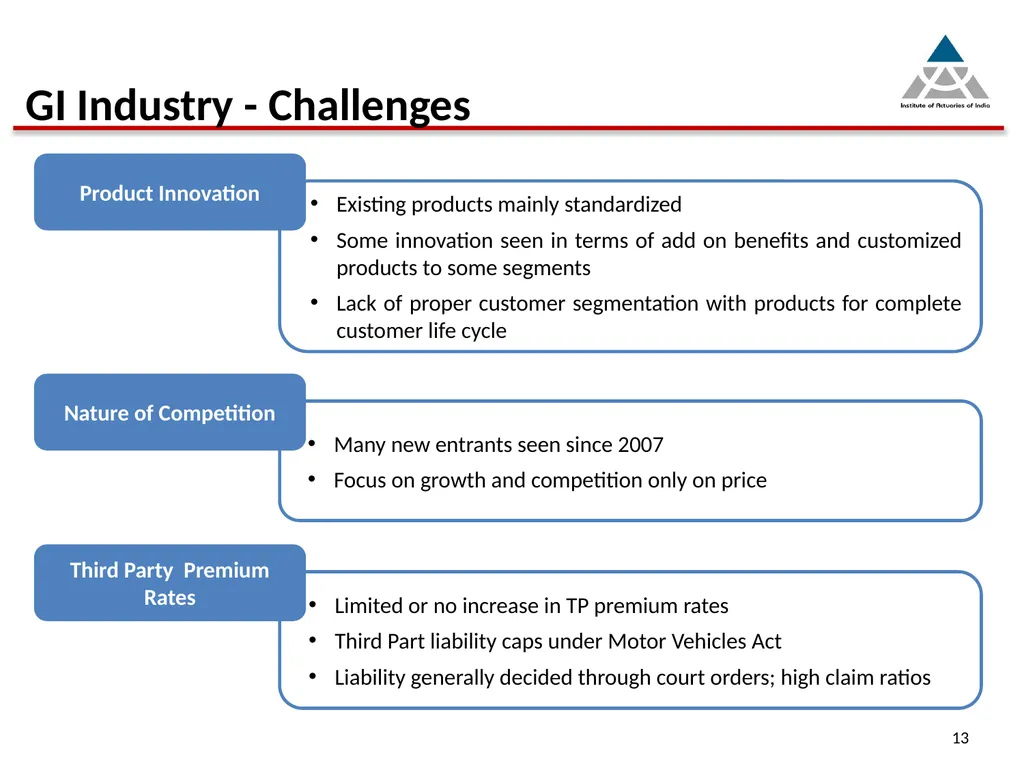
slide13. GI Industry - Challenges 13<br>
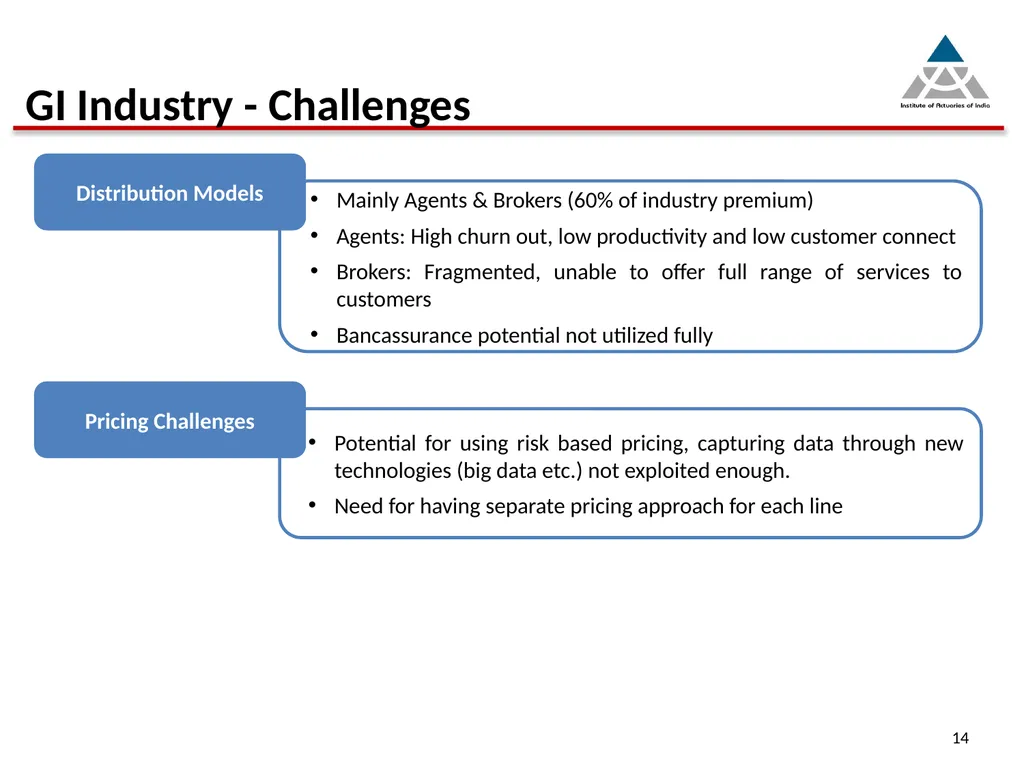
slide14. 14 GI Industry - Challenges<br>
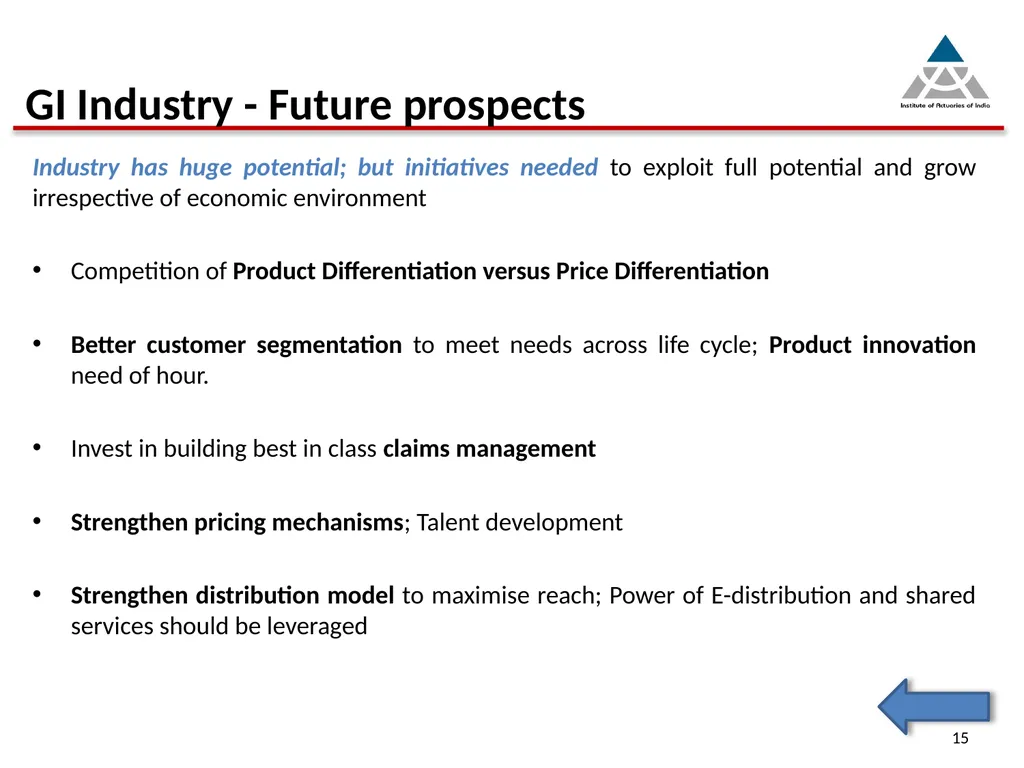
slide15. GI Industry - Future prospects 15 Industry has huge potential; but initiatives needed to exploit full potential and grow irrespective of economic environment
Competition of Product Differentiation versus Price Differentiation
Better customer segmentation to meet needs across life cycle; Product innovation need of hour.
Invest in building best in class claims management
Strengthen pricing mechanisms; Talent development
Strengthen distribution model to maximise reach; Power of E-distribution and shared services should be leveraged<br>
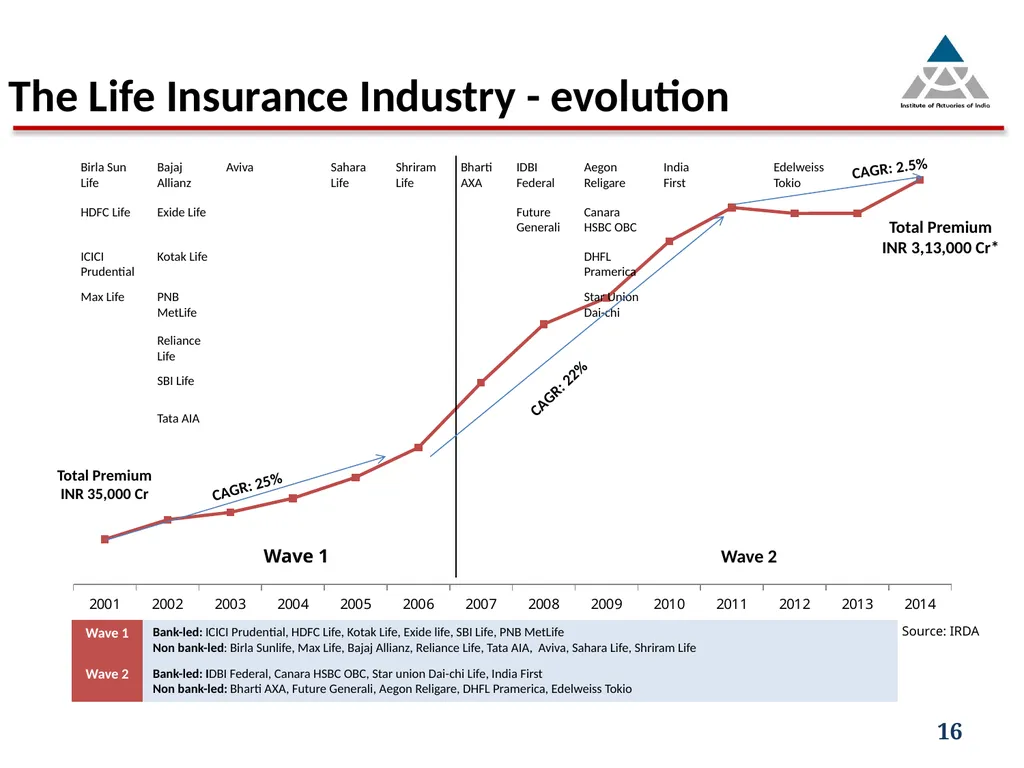
slide16. The Life Insurance Industry - evolution Source: IRDA Wave 1 Total Premium
INR 3,13,000 Cr* Total Premium
INR 35,000 Cr Wave 2 CAGR: 25% CAGR: 22% CAGR: 2.5% 16<br>
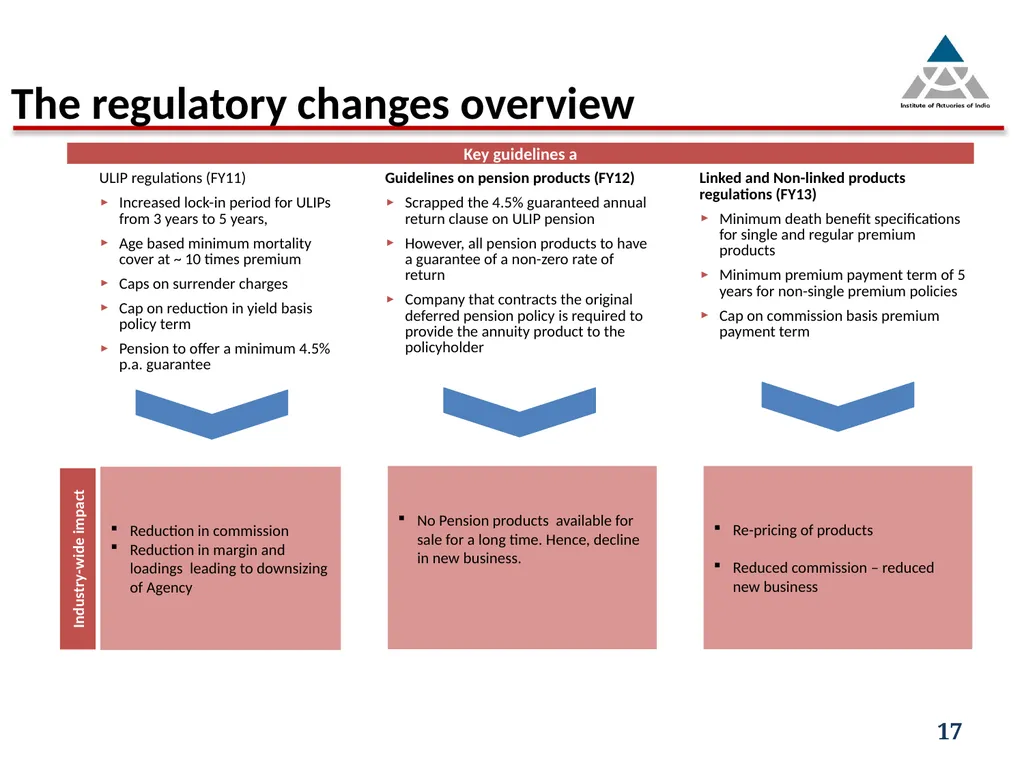
slide17. The regulatory changes overview ULIP regulations (FY11)
Increased lock-in period for ULIPs from 3 years to 5 years,
Age based minimum mortality cover at ~ 10 times premium
Caps on surrender charges
Cap on reduction in yield basis policy term
Pension to offer a minimum 4.5% p.a. guarantee Linked and Non-linked products regulations (FY13)
Minimum death benefit specifications for single and regular premium products
Minimum premium payment term of 5 years for non-single premium policies
Cap on commission basis premium payment term Guidelines on pension products (FY12)
Scrapped the 4.5% guaranteed annual return clause on ULIP pension
However, all pension products to have a guarantee of a non-zero rate of return
Company that contracts the original deferred pension policy is required to provide the annuity product to the policyholder Key guidelines a Industry-wide impact Reduction in commission
Reduction in margin and loadings leading to downsizing of Agency No Pension products available for sale for a long time. Hence, decline in new business. Re-pricing of products
Reduced commission – reduced new business 17<br>
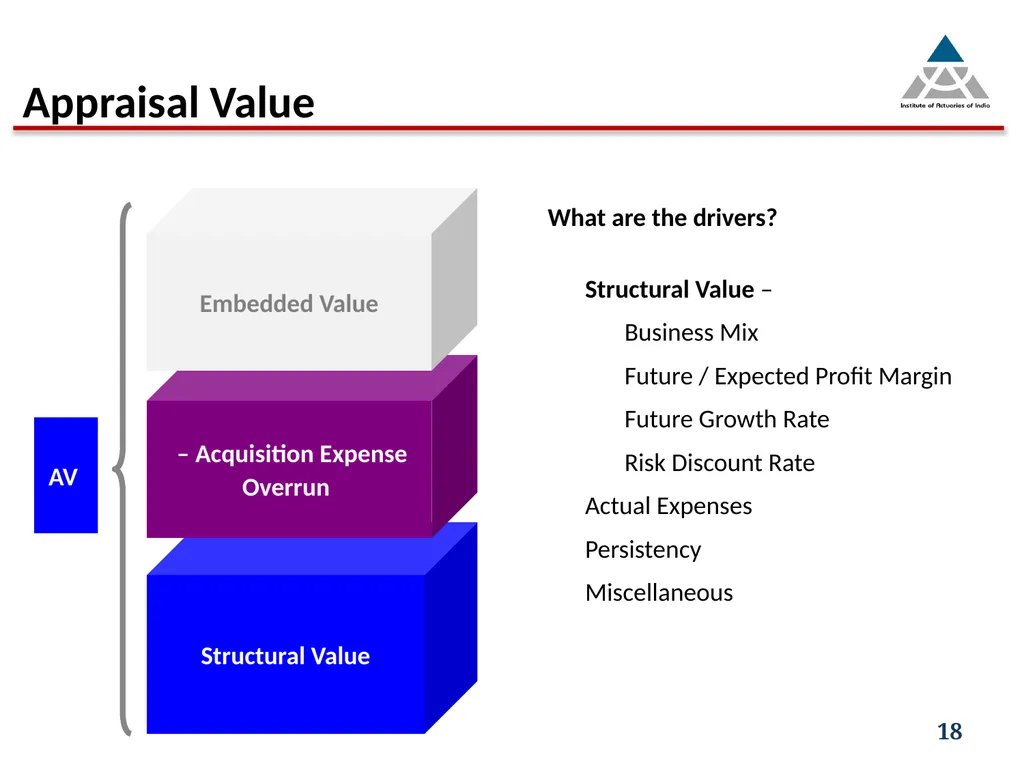
slide18. What are the drivers?
Structural Value –
Business Mix
Future / Expected Profit Margin
Future Growth Rate
Risk Discount Rate
Actual Expenses
Persistency
Miscellaneous Appraisal Value 18<br>
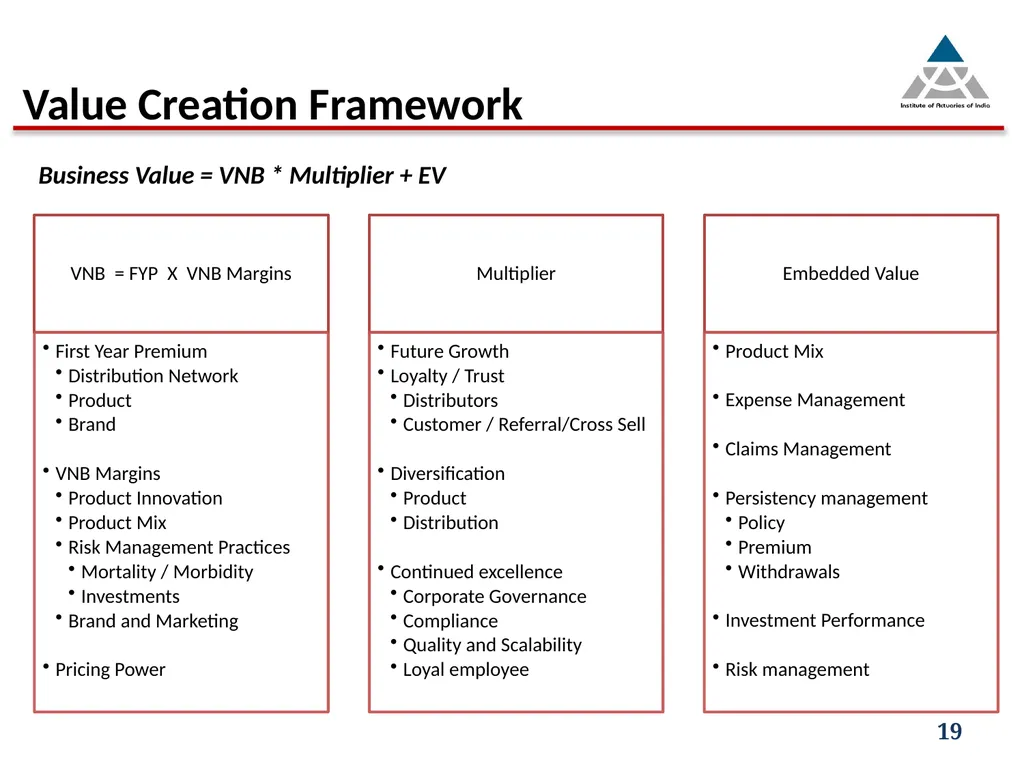
slide19. Business Value = VNB * Multiplier + EV Value Creation Framework 19<br>
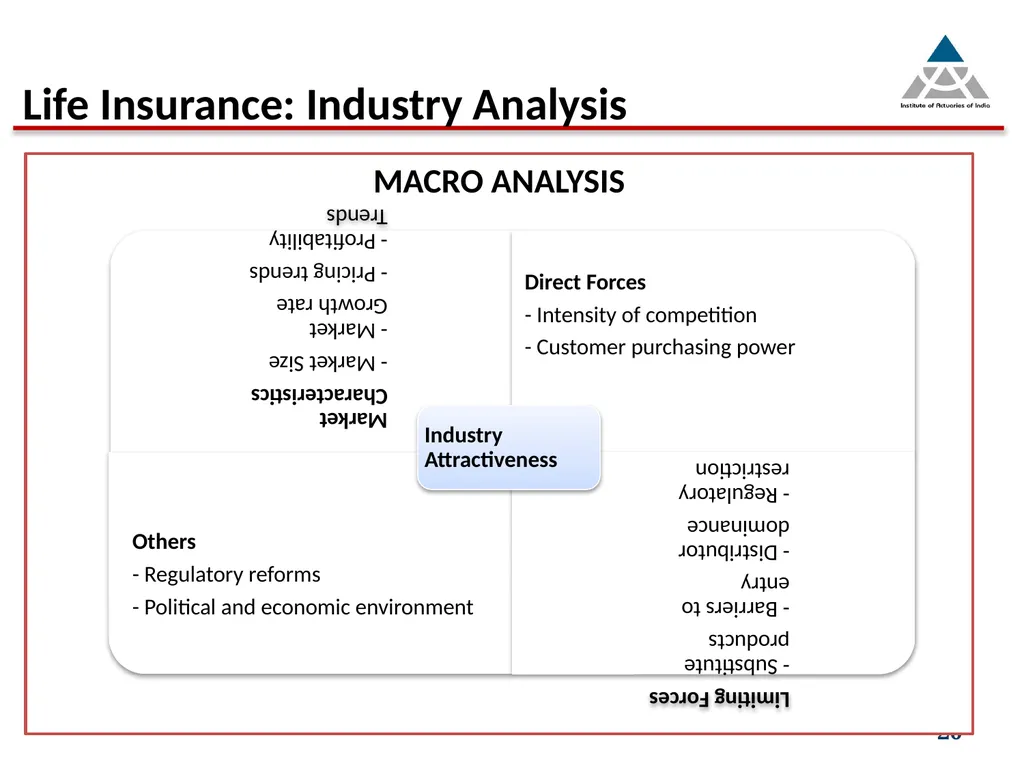
slide20. MACRO ANALYSIS Life Insurance: Industry Analysis 20<br>
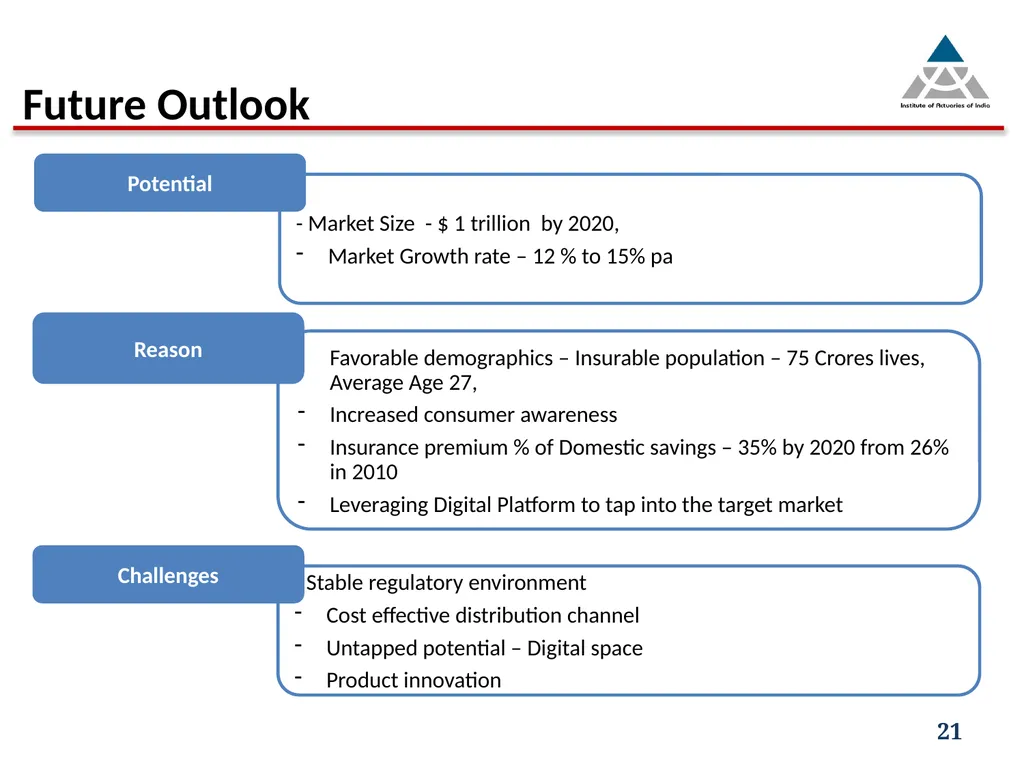
slide21. 21 Future Outlook<br>
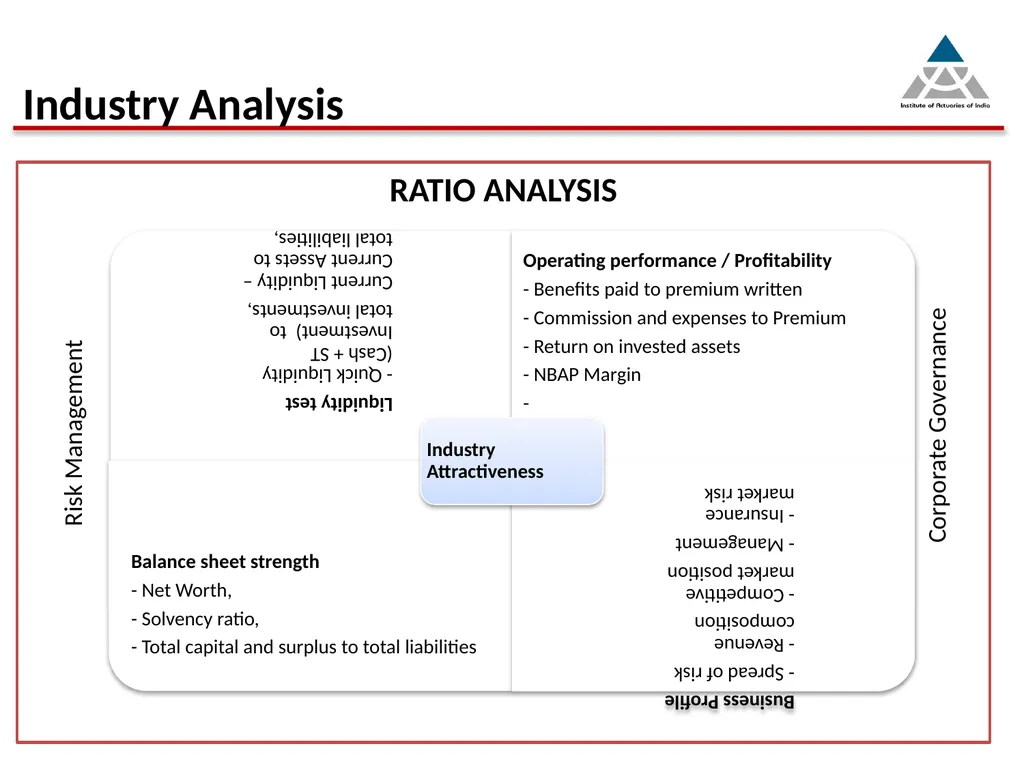
slide22. RATIO ANALYSIS Risk Management Corporate Governance Industry Analysis 22<br>
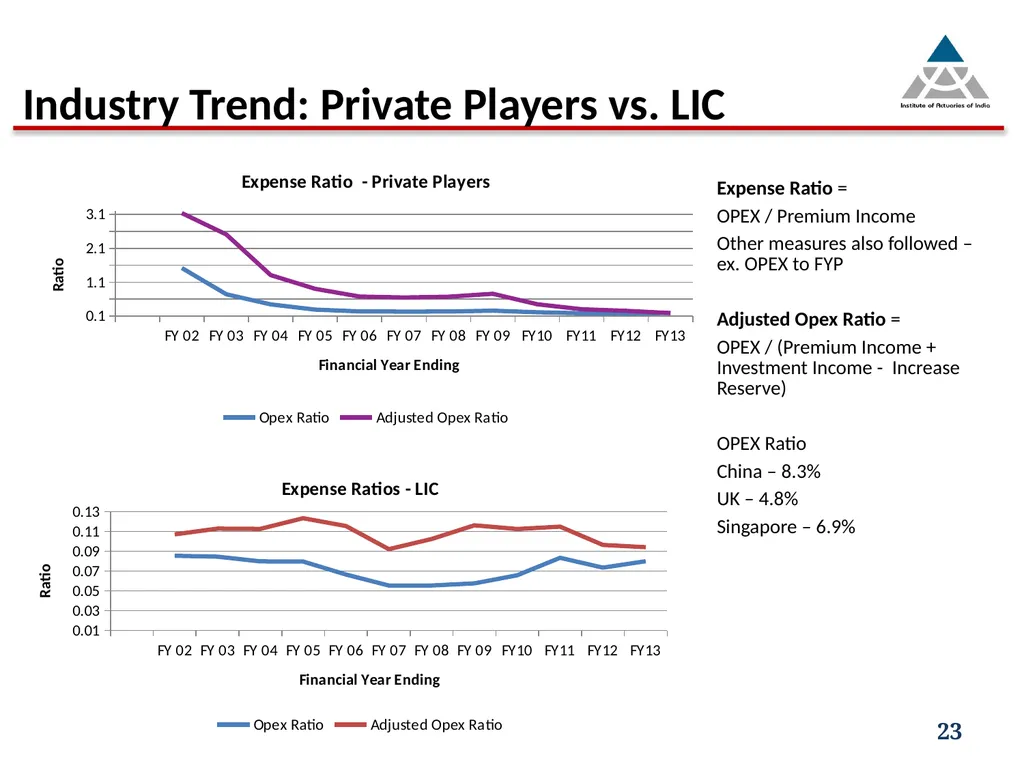
slide23. Expense Ratio =
OPEX / Premium Income
Other measures also followed – ex. OPEX to FYP
Adjusted Opex Ratio =
OPEX / (Premium Income + Investment Income - Increase Reserve)
OPEX Ratio
China – 8.3%
UK – 4.8%
Singapore – 6.9% Industry Trend: Private Players vs. LIC 23<br>
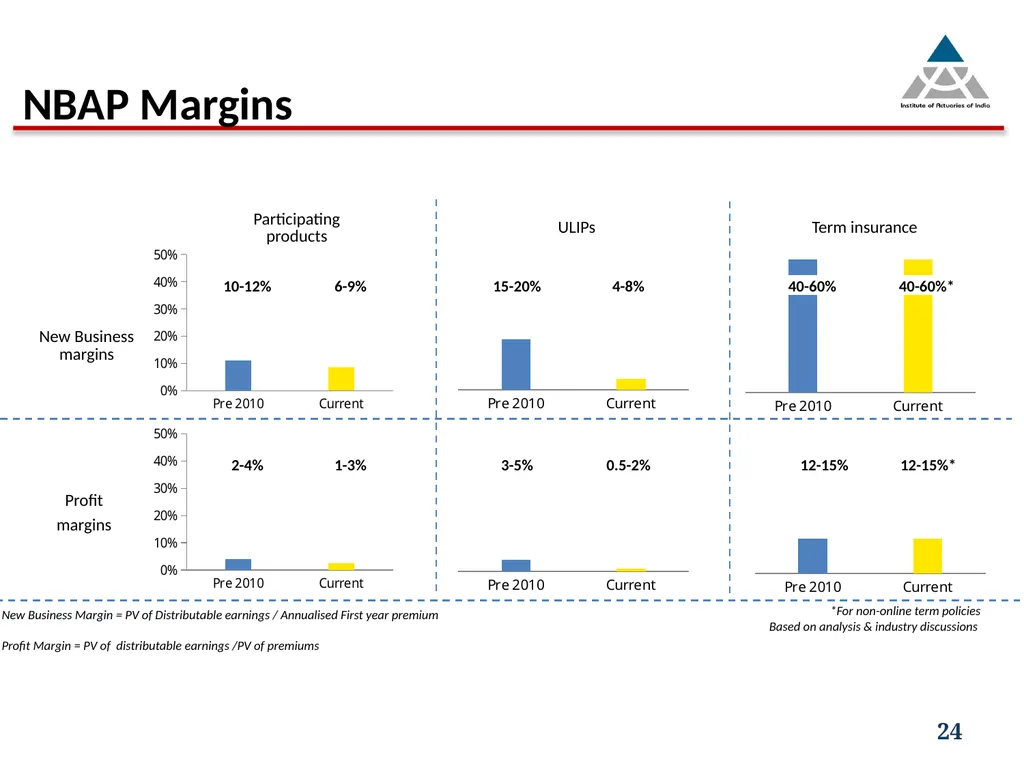
slide24. New Business margins Profit
margins Participating
products ULIPs Term insurance 10-12% 6-9% 15-20% 4-8% 40-60% 40-60%* 2-4% 1-3% 3-5% 0.5-2% 12-15% 12-15%* *For non-online term policies
Based on analysis & industry discussions New Business Margin = PV of Distributable earnings / Annualised First year premium
Profit Margin = PV of distributable earnings /PV of premiums NBAP Margins 24<br>
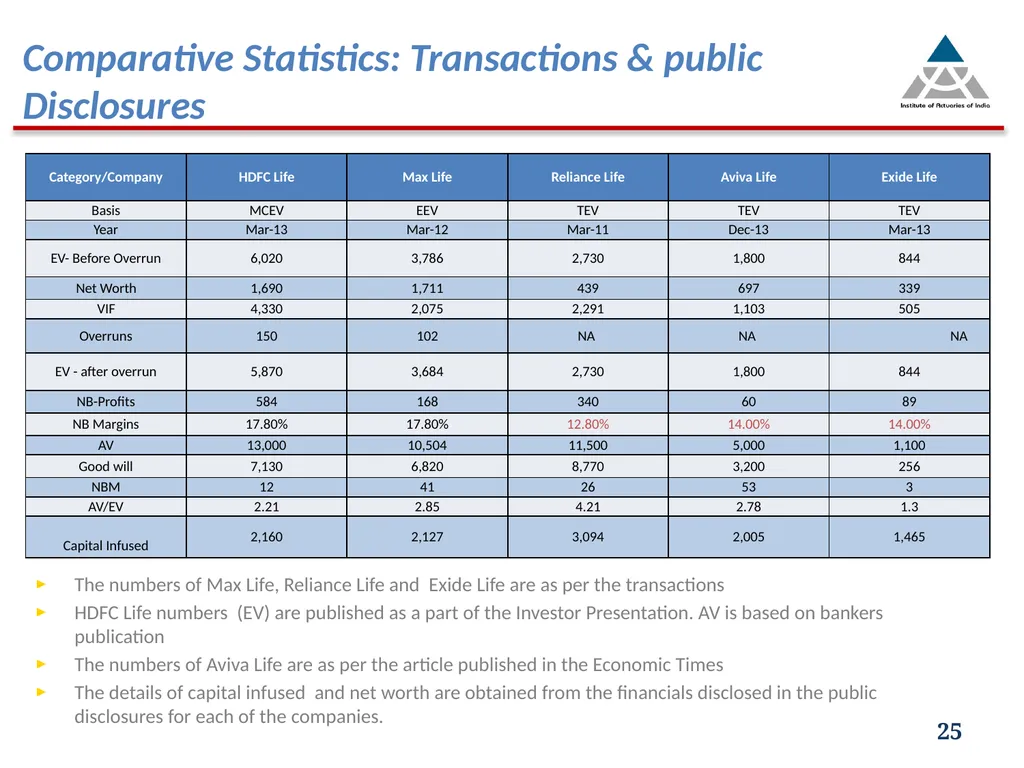
slide25. The numbers of Max Life, Reliance Life and Exide Life are as per the transactions
HDFC Life numbers (EV) are published as a part of the Investor Presentation. AV is based on bankers publication
The numbers of Aviva Life are as per the article published in the Economic Times
The details of capital infused and net worth are obtained from the financials disclosed in the public disclosures for each of the companies. Comparative Statistics: Transactions & public Disclosures 25<br>
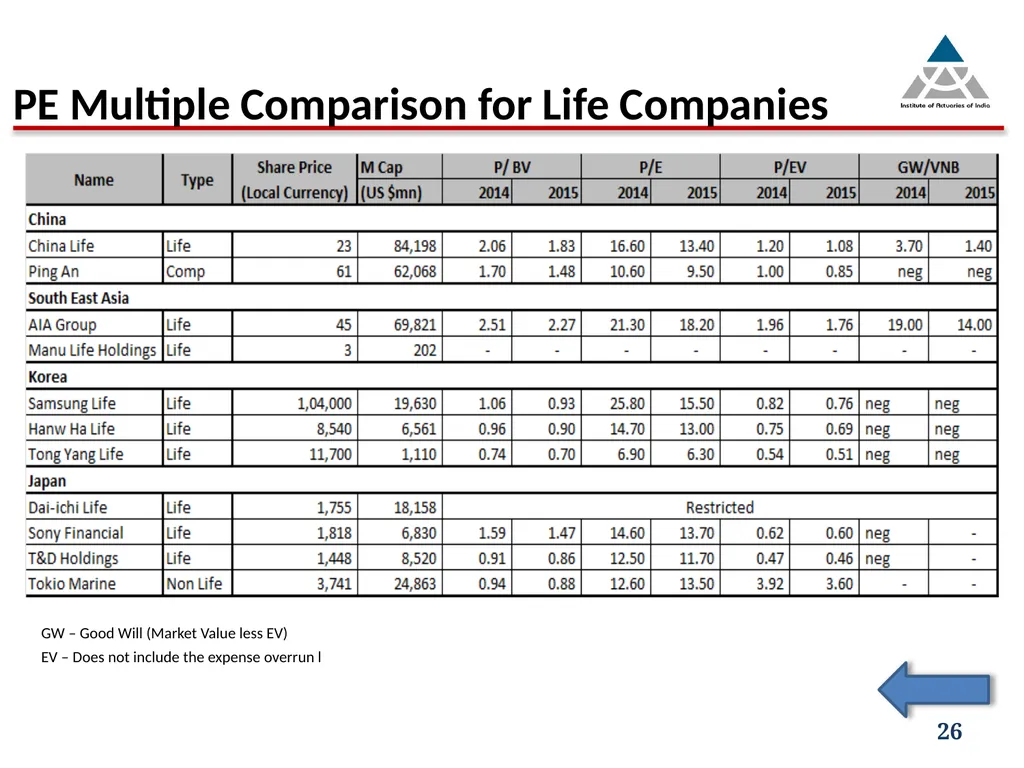
slide26. 26 GW – Good Will (Market Value less EV)
EV – Does not include the expense overrun l PE Multiple Comparison for Life Companies<br>
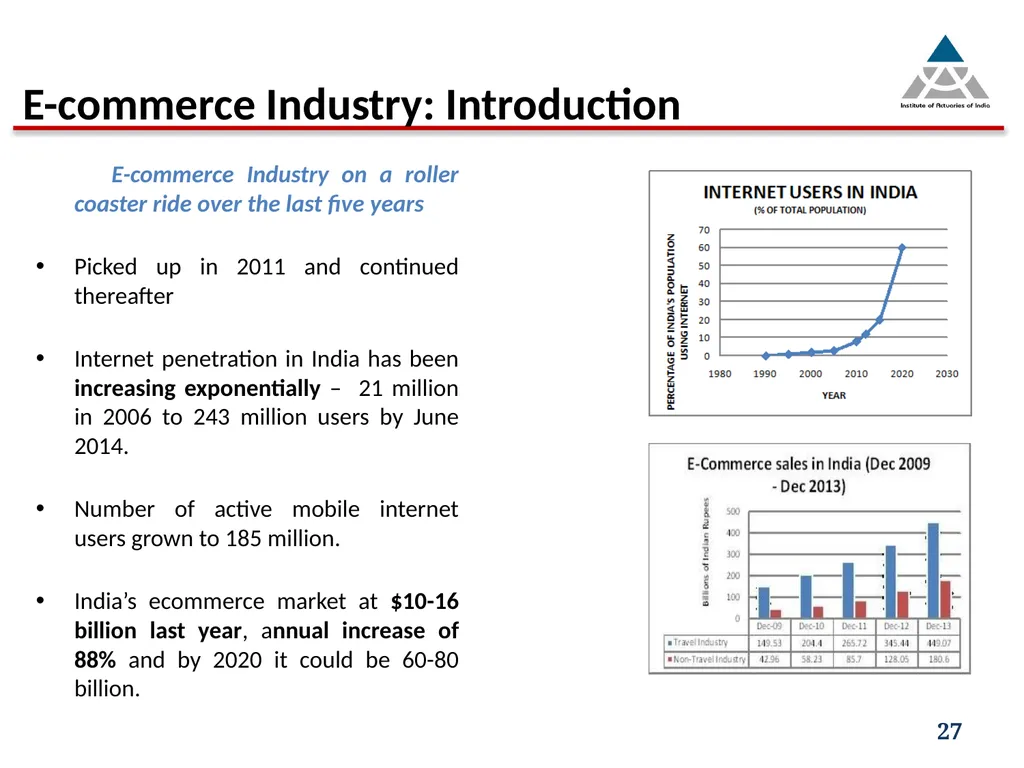
slide27. E-commerce Industry on a roller coaster ride over the last five years
Picked up in 2011 and continued thereafter
Internet penetration in India has been increasing exponentially – 21 million in 2006 to 243 million users by June 2014.
Number of active mobile internet users grown to 185 million.
India’s ecommerce market at $10-16 billion last year, annual increase of 88% and by 2020 it could be 60-80 billion. E-commerce Industry: Introduction 27<br>
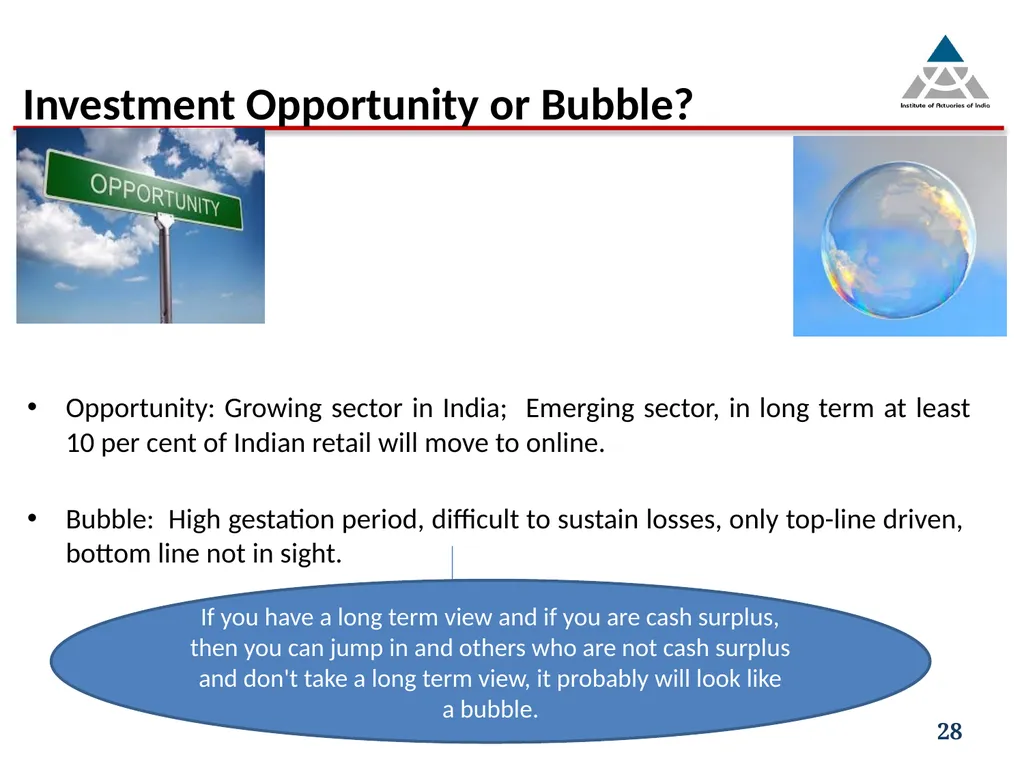
slide28. Opportunity: Growing sector in India; Emerging sector, in long term at least 10 per cent of Indian retail will move to online.
Bubble: High gestation period, difficult to sustain losses, only top-line driven, bottom line not in sight. Investment Opportunity or Bubble? If you have a long term view and if you are cash surplus, then you can jump in and others who are not cash surplus and don't take a long term view, it probably will look like a bubble. 28<br>
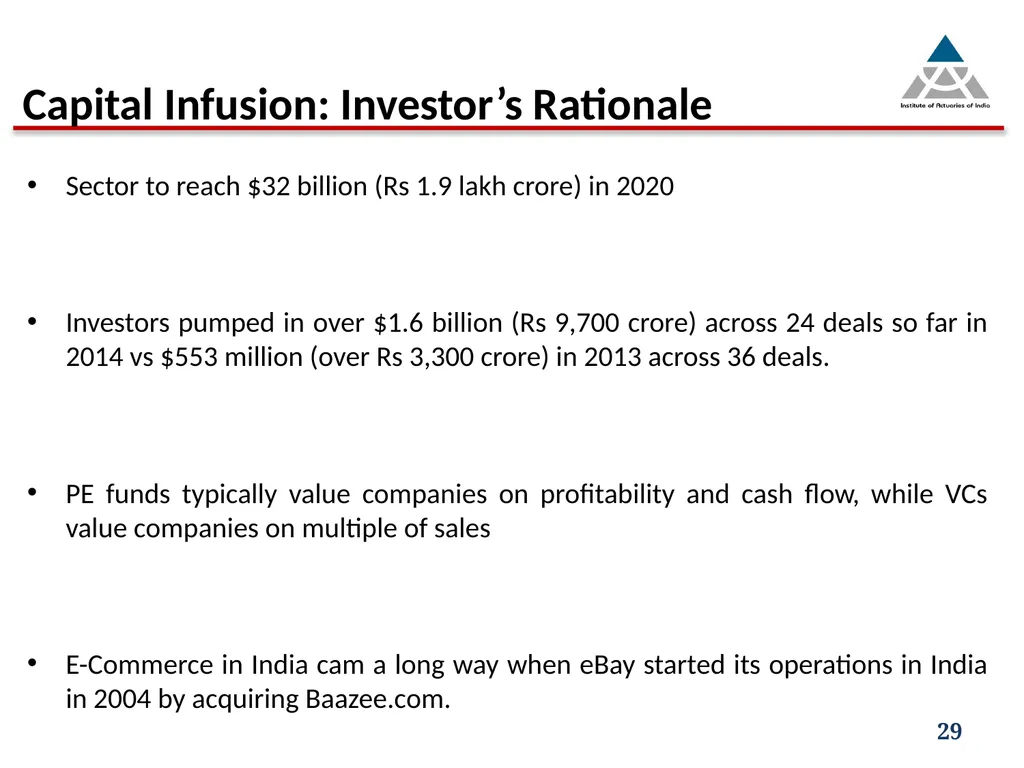
slide29. Sector to reach $32 billion (Rs 1.9 lakh crore) in 2020
Investors pumped in over $1.6 billion (Rs 9,700 crore) across 24 deals so far in 2014 vs $553 million (over Rs 3,300 crore) in 2013 across 36 deals.
PE funds typically value companies on profitability and cash flow, while VCs value companies on multiple of sales
E-Commerce in India cam a long way when eBay started its operations in India in 2004 by acquiring Baazee.com. Capital Infusion: Investor’s Rationale 29<br>
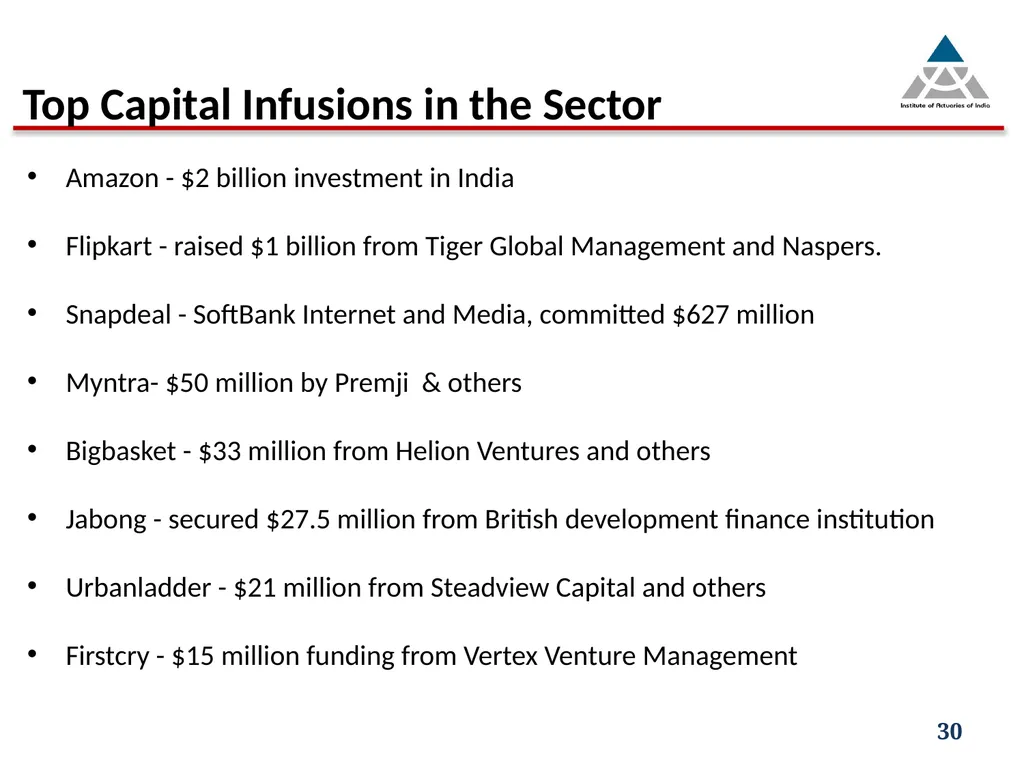
slide30. Amazon - $2 billion investment in India
Flipkart - raised $1 billion from Tiger Global Management and Naspers.
Snapdeal - SoftBank Internet and Media, committed $627 million
Myntra- $50 million by Premji & others
Bigbasket - $33 million from Helion Ventures and others
Jabong - secured $27.5 million from British development finance institution
Urbanladder - $21 million from Steadview Capital and others
Firstcry - $15 million funding from Vertex Venture Management Top Capital Infusions in the Sector 30<br>
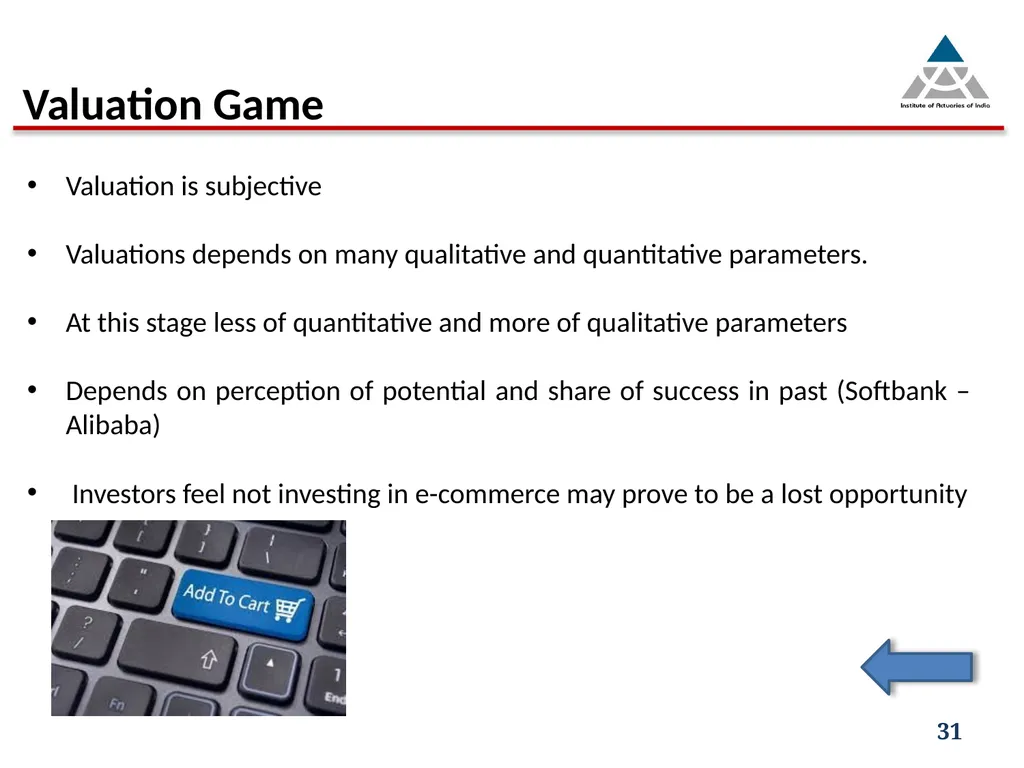
slide31. Valuation is subjective
Valuations depends on many qualitative and quantitative parameters.
At this stage less of quantitative and more of qualitative parameters
Depends on perception of potential and share of success in past (Softbank – Alibaba)
 Investors feel not investing in e-commerce may prove to be a lost opportunity Valuation Game 31<br>

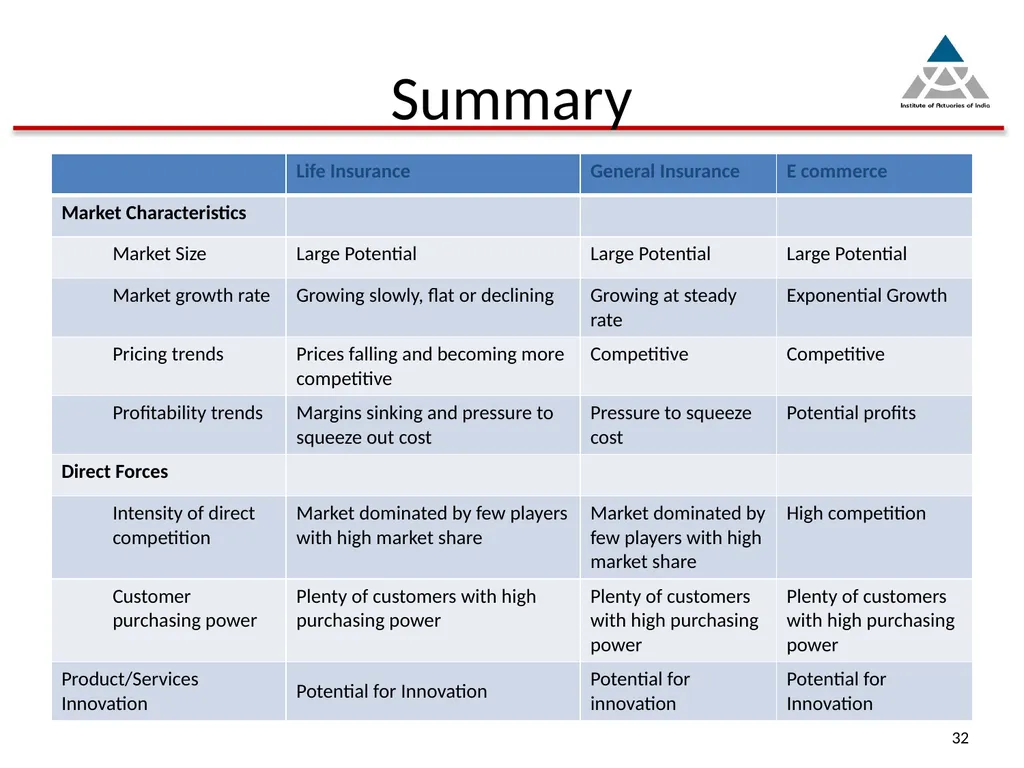
slide32. Summary 32<br>
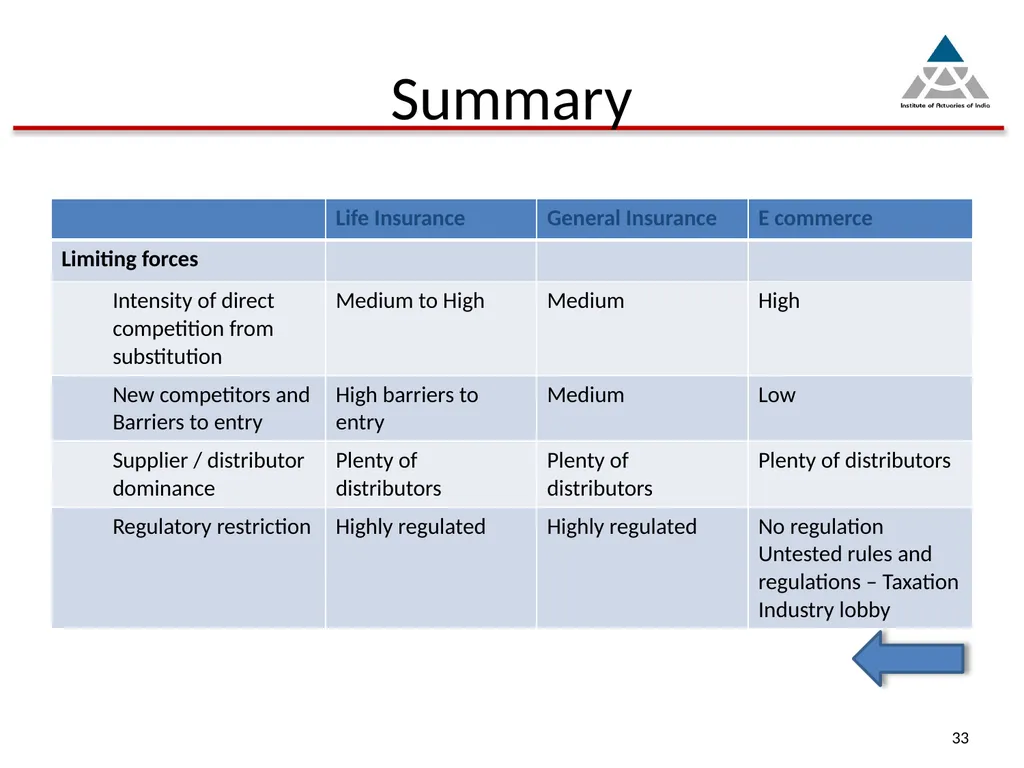
slide33. Summary 33<br>
slide34. 34<br>
Gopal Kumar
Ishwar Gopashetti
Guide: Mayur Ankolekar<br>
slide2. Agenda 2 Introduction
Industry Analysis
General Insurance
Life Insurance
E-Commerce
Summary
Questions<br>
slide3. Introduction - Appeal to Investors 3 From purely economic view point, business which earns
highest risk adjusted return
compared to other investment opportunities (opportunity cost)
is most appealing to investors.<br>
slide4. Introduction – Appeal to investors SURPLUS CAPITAL & OPPORTUNITY COST INVESTMENT TIME HORIZON & PAST EXPERIENCE RISK APPETITE & VALUE Business Appealing
or Not ? Business Appealing also depends on investors’ 4<br>
slide5. Introduction – Industry attractiveness Determining if the option at hand is the best depends on various factors: 5<br>
slide6. Introduction – Industry attractiveness 6<br>
slide7. 7 Alternative analysis Introduction – Industry attractiveness<br>
slide8. Introduction – Industry valuation Future Oriented Measure
Problem
Forecast accuracy 8<br>
slide9. GI Industry – Growth & Market Size 9 Significant top line growth – EXPECTED TO CONTINUE IN FUTURE
From a Rs 12,000 crore top-line industry in 2001–02, today it is worth 70,000 crore, clocking an annual growth rate of 17% over the last decade.
The industry today provides a cover of Rs 1,000 lakh crore.
GI penetration still on the lower side. GI Industry, with low startup capital, is projected to grow at 16% in medium to long term mainly on account of economic growth, socio economic drivers and greater penetration. Source: KPMG Analysis, IRDA Annual Report 2012 16%<br>
slide10. GI Industry – Profitability (low and fluctuating) Profitability low – driven by intense competition and regulated Motor TP prices.
De-tariffication has resulted in prices being cut significantly. 10<br>
slide11. GI Industry – Profitability (low and fluctuating) 11<br>
slide12. GI Industry – Regulatory update 12 Key Regulatory Changes Change in Industry 2007 Price Detariffication Creation of Indian Motor Third Party Insurance Pool Mechanism to equitably share CVTP losses Significant change in premium rates for commercial lines 2011 Merger and Acquisition Guidelines Enabled consolidations, inorganic transactions in the industry 2012 Introduction of declined risk pool, TP premium rates increase Improvement in overall profitability of the CV segment 2013 New health insurance guidelines introduced Streamlining of products<br>
slide13. GI Industry - Challenges 13<br>
slide14. 14 GI Industry - Challenges<br>
slide15. GI Industry - Future prospects 15 Industry has huge potential; but initiatives needed to exploit full potential and grow irrespective of economic environment
Competition of Product Differentiation versus Price Differentiation
Better customer segmentation to meet needs across life cycle; Product innovation need of hour.
Invest in building best in class claims management
Strengthen pricing mechanisms; Talent development
Strengthen distribution model to maximise reach; Power of E-distribution and shared services should be leveraged<br>
slide16. The Life Insurance Industry - evolution Source: IRDA Wave 1 Total Premium
INR 3,13,000 Cr* Total Premium
INR 35,000 Cr Wave 2 CAGR: 25% CAGR: 22% CAGR: 2.5% 16<br>
slide17. The regulatory changes overview ULIP regulations (FY11)
Increased lock-in period for ULIPs from 3 years to 5 years,
Age based minimum mortality cover at ~ 10 times premium
Caps on surrender charges
Cap on reduction in yield basis policy term
Pension to offer a minimum 4.5% p.a. guarantee Linked and Non-linked products regulations (FY13)
Minimum death benefit specifications for single and regular premium products
Minimum premium payment term of 5 years for non-single premium policies
Cap on commission basis premium payment term Guidelines on pension products (FY12)
Scrapped the 4.5% guaranteed annual return clause on ULIP pension
However, all pension products to have a guarantee of a non-zero rate of return
Company that contracts the original deferred pension policy is required to provide the annuity product to the policyholder Key guidelines a Industry-wide impact Reduction in commission
Reduction in margin and loadings leading to downsizing of Agency No Pension products available for sale for a long time. Hence, decline in new business. Re-pricing of products
Reduced commission – reduced new business 17<br>
slide18. What are the drivers?
Structural Value –
Business Mix
Future / Expected Profit Margin
Future Growth Rate
Risk Discount Rate
Actual Expenses
Persistency
Miscellaneous Appraisal Value 18<br>
slide19. Business Value = VNB * Multiplier + EV Value Creation Framework 19<br>
slide20. MACRO ANALYSIS Life Insurance: Industry Analysis 20<br>
slide21. 21 Future Outlook<br>
slide22. RATIO ANALYSIS Risk Management Corporate Governance Industry Analysis 22<br>
slide23. Expense Ratio =
OPEX / Premium Income
Other measures also followed – ex. OPEX to FYP
Adjusted Opex Ratio =
OPEX / (Premium Income + Investment Income - Increase Reserve)
OPEX Ratio
China – 8.3%
UK – 4.8%
Singapore – 6.9% Industry Trend: Private Players vs. LIC 23<br>
slide24. New Business margins Profit
margins Participating
products ULIPs Term insurance 10-12% 6-9% 15-20% 4-8% 40-60% 40-60%* 2-4% 1-3% 3-5% 0.5-2% 12-15% 12-15%* *For non-online term policies
Based on analysis & industry discussions New Business Margin = PV of Distributable earnings / Annualised First year premium
Profit Margin = PV of distributable earnings /PV of premiums NBAP Margins 24<br>
slide25. The numbers of Max Life, Reliance Life and Exide Life are as per the transactions
HDFC Life numbers (EV) are published as a part of the Investor Presentation. AV is based on bankers publication
The numbers of Aviva Life are as per the article published in the Economic Times
The details of capital infused and net worth are obtained from the financials disclosed in the public disclosures for each of the companies. Comparative Statistics: Transactions & public Disclosures 25<br>
slide26. 26 GW – Good Will (Market Value less EV)
EV – Does not include the expense overrun l PE Multiple Comparison for Life Companies<br>
slide27. E-commerce Industry on a roller coaster ride over the last five years
Picked up in 2011 and continued thereafter
Internet penetration in India has been increasing exponentially – 21 million in 2006 to 243 million users by June 2014.
Number of active mobile internet users grown to 185 million.
India’s ecommerce market at $10-16 billion last year, annual increase of 88% and by 2020 it could be 60-80 billion. E-commerce Industry: Introduction 27<br>
slide28. Opportunity: Growing sector in India; Emerging sector, in long term at least 10 per cent of Indian retail will move to online.
Bubble: High gestation period, difficult to sustain losses, only top-line driven, bottom line not in sight. Investment Opportunity or Bubble? If you have a long term view and if you are cash surplus, then you can jump in and others who are not cash surplus and don't take a long term view, it probably will look like a bubble. 28<br>
slide29. Sector to reach $32 billion (Rs 1.9 lakh crore) in 2020
Investors pumped in over $1.6 billion (Rs 9,700 crore) across 24 deals so far in 2014 vs $553 million (over Rs 3,300 crore) in 2013 across 36 deals.
PE funds typically value companies on profitability and cash flow, while VCs value companies on multiple of sales
E-Commerce in India cam a long way when eBay started its operations in India in 2004 by acquiring Baazee.com. Capital Infusion: Investor’s Rationale 29<br>
slide30. Amazon - $2 billion investment in India
Flipkart - raised $1 billion from Tiger Global Management and Naspers.
Snapdeal - SoftBank Internet and Media, committed $627 million
Myntra- $50 million by Premji & others
Bigbasket - $33 million from Helion Ventures and others
Jabong - secured $27.5 million from British development finance institution
Urbanladder - $21 million from Steadview Capital and others
Firstcry - $15 million funding from Vertex Venture Management Top Capital Infusions in the Sector 30<br>
slide31. Valuation is subjective
Valuations depends on many qualitative and quantitative parameters.
At this stage less of quantitative and more of qualitative parameters
Depends on perception of potential and share of success in past (Softbank – Alibaba)
 Investors feel not investing in e-commerce may prove to be a lost opportunity Valuation Game 31<br>
slide32. Summary 32<br>

slide33. Summary 33<br>
slide34. 34<br>