
Capstone Project: Grocery Shopping Assistant
LD
Published · 15 slides · 0 views
1 / 1
Description
Capstone Project: Grocery Shopping Assistant Proof-of concept prototype Olivia Elmiger Torin Gilkey Isaac Walrath Brian T Di Bella Instructions In the project portion of this course, you will work in small teams to design and develop a new
Related Topics
Download this presentation From Below
"Capstone Project: Grocery Shopping Assistant" is the property of its rightful owner. Permission is granted to download and print the materials on this website for personal, non-commercial use only, and to display it on your personal computer provided you do not modify the materials and that you retain all copyright notices contained in the materials. By downloading content from our website, you accept the terms of this agreement.
Share
Embed code
Presentation Transcript
01
Capstone Project:
Grocery Shopping Assistant Proof-of concept prototype Olivia Elmiger
Torin Gilkey
Isaac Walrath
Brian T Di Bella<br>
Grocery Shopping Assistant Proof-of concept prototype Olivia Elmiger
Torin Gilkey
Isaac Walrath
Brian T Di Bella<br>
02
Instructions In the project portion of this course, you will work in small teams to design and develop a new digital product. By the end of the course, teams will have produced a prototype version of their product, at a proof-of-concept level.
The goal will be to gain hands-on experience in applying the methods and principles of product development to address a realistic problem that will deliver actual customer value.
Teams are encouraged to schedule weekly Zoom calls to complete the project milestones. Each milestone is outlined in this PowerPoint slide deck. Teams will be asked to upload a progressively complete deck for the weekly Milestones, and a finalized presentation by the end of Module 5 when teams will use these slides to record a video presentation of their work.
Teams should actively seek to incorporate feedback from the course facilitators and peers throughout the course and make frequent iterations of each Milestone, which should be reflected in the final submission of this deck at the end of Module 6.<br>
The goal will be to gain hands-on experience in applying the methods and principles of product development to address a realistic problem that will deliver actual customer value.
Teams are encouraged to schedule weekly Zoom calls to complete the project milestones. Each milestone is outlined in this PowerPoint slide deck. Teams will be asked to upload a progressively complete deck for the weekly Milestones, and a finalized presentation by the end of Module 5 when teams will use these slides to record a video presentation of their work.
Teams should actively seek to incorporate feedback from the course facilitators and peers throughout the course and make frequent iterations of each Milestone, which should be reflected in the final submission of this deck at the end of Module 6.<br>
03
Timeline Creating a mission statement (Milestone 2|Part 1)
Discovering potential customer needs (Milestone 2|Part 2)
Conducting a competitive analysis (Milestone 2|Part 3)
Setting product specifications (Milestone 3|Part 1)
Generating, selecting, and developing product concepts (Milestone 3|Part 2)
Prototyping status and plans (Milestone 4|Part 1)
User testing (Milestone 4|Part 2)<br>
Discovering potential customer needs (Milestone 2|Part 2)
Conducting a competitive analysis (Milestone 2|Part 3)
Setting product specifications (Milestone 3|Part 1)
Generating, selecting, and developing product concepts (Milestone 3|Part 2)
Prototyping status and plans (Milestone 4|Part 1)
User testing (Milestone 4|Part 2)<br>
04
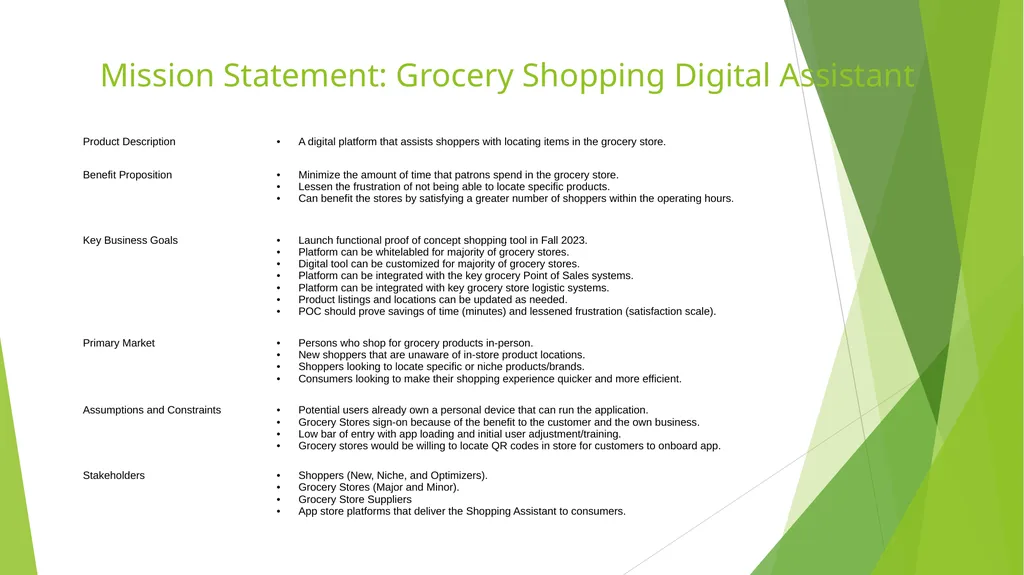
Mission Statement: Grocery Shopping Digital Assistant<br>
05
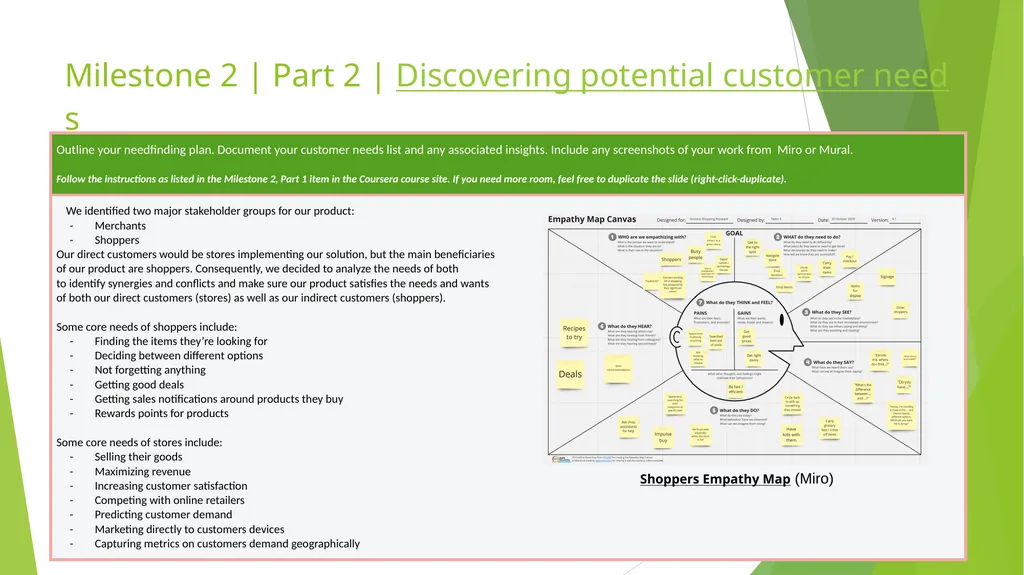
Milestone 2 | Part 2 | Discovering potential customer needs Shoppers Empathy Map (Miro)<br>
06
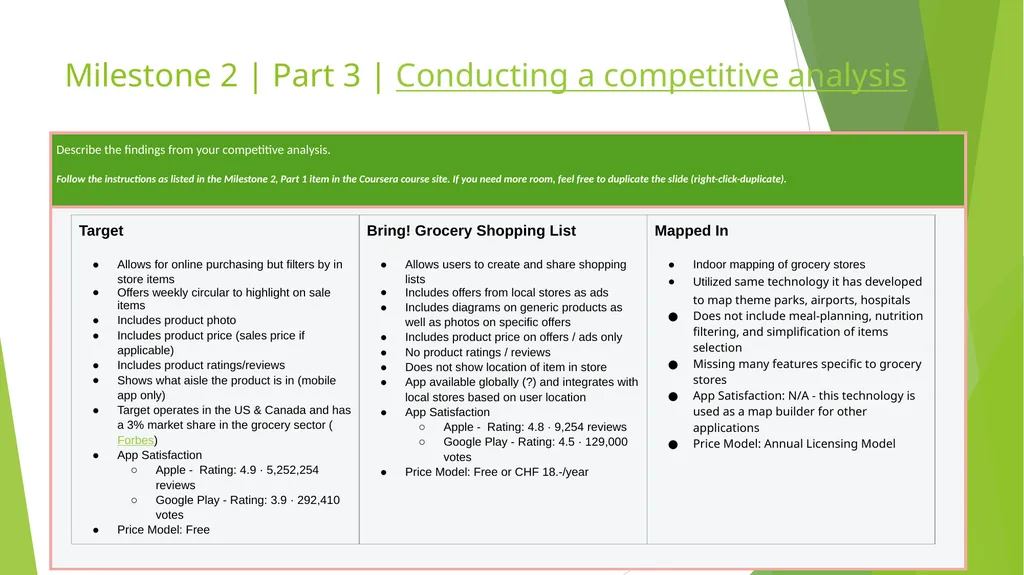
Milestone 2 | Part 3 | Conducting a competitive analysis<br>
07
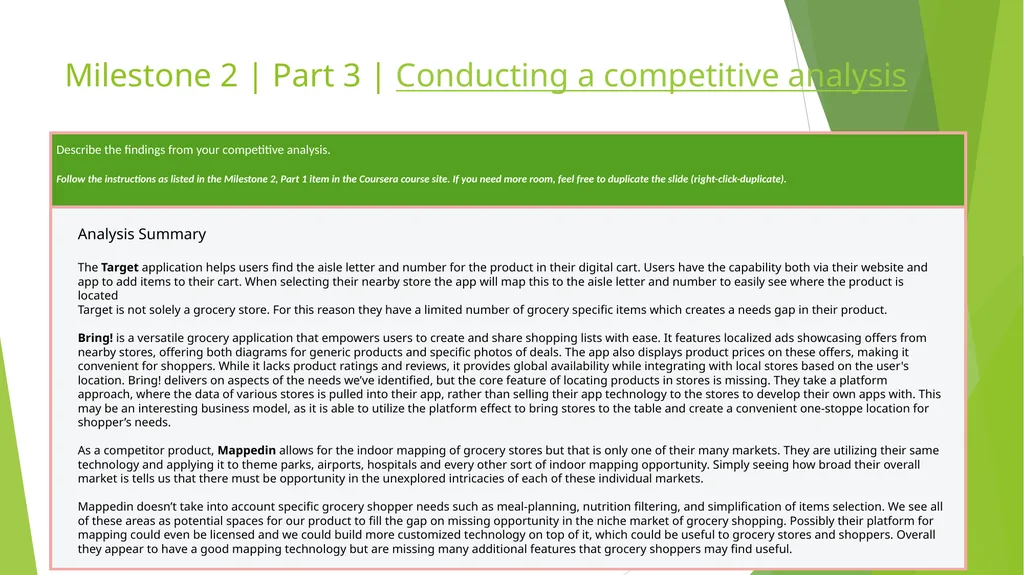
Milestone 2 | Part 3 | Conducting a competitive analysis Analysis Summary
The Target application helps users find the aisle letter and number for the product in their digital cart. Users have the capability both via their website and app to add items to their cart. When selecting their nearby store the app will map this to the aisle letter and number to easily see where the product is located
Target is not solely a grocery store. For this reason they have a limited number of grocery specific items which creates a needs gap in their product.
Bring! is a versatile grocery application that empowers users to create and share shopping lists with ease. It features localized ads showcasing offers from nearby stores, offering both diagrams for generic products and specific photos of deals. The app also displays product prices on these offers, making it convenient for shoppers. While it lacks product ratings and reviews, it provides global availability while integrating with local stores based on the user's location. Bring! delivers on aspects of the needs we’ve identified, but the core feature of locating products in stores is missing. They take a platform approach, where the data of various stores is pulled into their app, rather than selling their app technology to the stores to develop their own apps with. This may be an interesting business model, as it is able to utilize the platform effect to bring stores to the table and create a convenient one-stoppe location for shopper’s needs.
As a competitor product, Mappedin allows for the indoor mapping of grocery stores but that is only one of their many markets. They are utilizing their same technology and applying it to theme parks, airports, hospitals and every other sort of indoor mapping opportunity. Simply seeing how broad their overall market is tells us that there must be opportunity in the unexplored intricacies of each of these individual markets.
Mappedin doesn’t take into account specific grocery shopper needs such as meal-planning, nutrition filtering, and simplification of items selection. We see all of these areas as potential spaces for our product to fill the gap on missing opportunity in the niche market of grocery shopping. Possibly their platform for mapping could even be licensed and we could build more customized technology on top of it, which could be useful to grocery stores and shoppers. Overall they appear to have a good mapping technology but are missing many additional features that grocery shoppers may find useful.<br>
The Target application helps users find the aisle letter and number for the product in their digital cart. Users have the capability both via their website and app to add items to their cart. When selecting their nearby store the app will map this to the aisle letter and number to easily see where the product is located
Target is not solely a grocery store. For this reason they have a limited number of grocery specific items which creates a needs gap in their product.
Bring! is a versatile grocery application that empowers users to create and share shopping lists with ease. It features localized ads showcasing offers from nearby stores, offering both diagrams for generic products and specific photos of deals. The app also displays product prices on these offers, making it convenient for shoppers. While it lacks product ratings and reviews, it provides global availability while integrating with local stores based on the user's location. Bring! delivers on aspects of the needs we’ve identified, but the core feature of locating products in stores is missing. They take a platform approach, where the data of various stores is pulled into their app, rather than selling their app technology to the stores to develop their own apps with. This may be an interesting business model, as it is able to utilize the platform effect to bring stores to the table and create a convenient one-stoppe location for shopper’s needs.
As a competitor product, Mappedin allows for the indoor mapping of grocery stores but that is only one of their many markets. They are utilizing their same technology and applying it to theme parks, airports, hospitals and every other sort of indoor mapping opportunity. Simply seeing how broad their overall market is tells us that there must be opportunity in the unexplored intricacies of each of these individual markets.
Mappedin doesn’t take into account specific grocery shopper needs such as meal-planning, nutrition filtering, and simplification of items selection. We see all of these areas as potential spaces for our product to fill the gap on missing opportunity in the niche market of grocery shopping. Possibly their platform for mapping could even be licensed and we could build more customized technology on top of it, which could be useful to grocery stores and shoppers. Overall they appear to have a good mapping technology but are missing many additional features that grocery shoppers may find useful.<br>
08
Milestone 3 | Step 1 | Setting product specifications<br>
09
Milestone 3 | Step 1 | Setting product specifications Shoppers
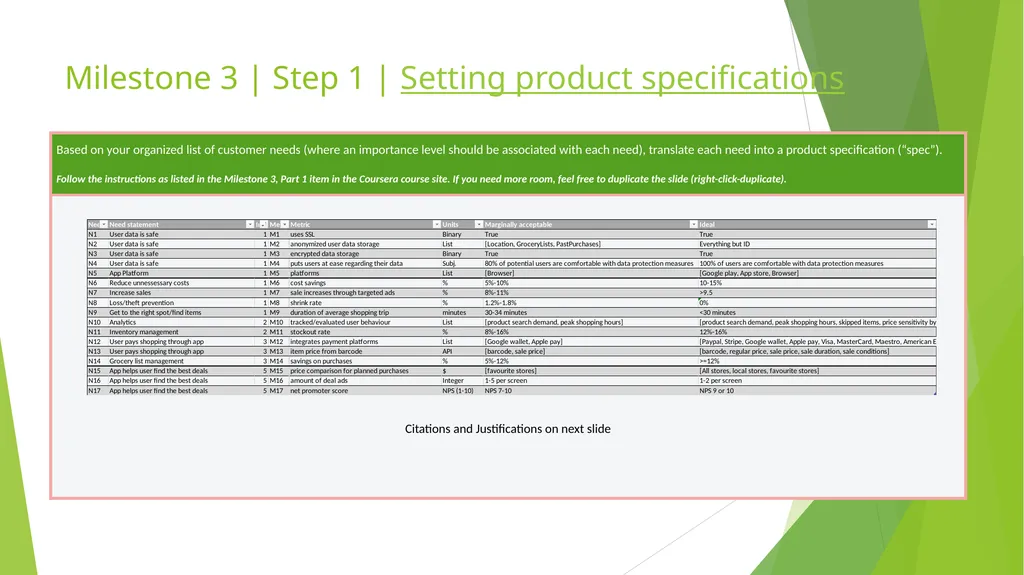
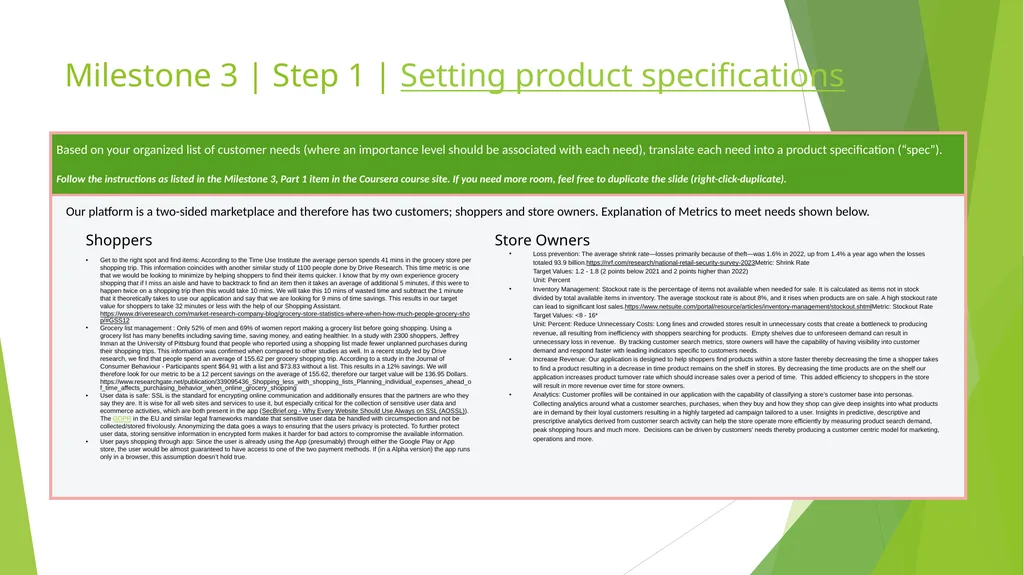
Get to the right spot and find items: According to the Time Use Institute the average person spends 41 mins in the grocery store per shopping trip. This information coincides with another similar study of 1100 people done by Drive Research. This time metric is one that we would be looking to minimize by helping shoppers to find their items quicker. I know that by my own experience grocery shopping that if I miss an aisle and have to backtrack to find an item then it takes an average of additional 5 minutes, if this were to happen twice on a shopping trip then this would take 10 mins. We will take this 10 mins of wasted time and subtract the 1 minute that it theoretically takes to use our application and say that we are looking for 9 mins of time savings. This results in our target value for shoppers to take 32 minutes or less with the help of our Shopping Assistant. https://www.driveresearch.com/market-research-company-blog/grocery-store-statistics-where-when-how-much-people-grocery-shop/#GSS12
Grocery list management : Only 52% of men and 69% of women report making a grocery list before going shopping. Using a grocery list has many benefits including saving time, saving money, and eating healthier. In a study with 2300 shoppers, Jeffrey Inman at the University of Pittsburg found that people who reported using a shopping list made fewer unplanned purchases during their shopping trips. This information was confirmed when compared to other studies as well. In a recent study led by Drive research, we find that people spend an average of 155.62 per grocery shopping trip. According to a study in the Journal of Consumer Behaviour - Participants spent $64.91 with a list and $73.83 without a list. This results in a 12% savings. We will therefore look for our metric to be a 12 percent savings on the average of 155.62, therefore our target value will be 136.95 Dollars. https://www.researchgate.net/publication/339095436_Shopping_less_with_shopping_lists_Planning_individual_expenses_ahead_of_time_affects_purchasing_behavior_when_online_grocery_shopping
User data is safe: SSL is the standard for encrypting online communication and additionally ensures that the partners are who they say they are. It is wise for all web sites and services to use it, but especially critical for the collection of sensitive user data and ecommerce activities, which are both present in the app (SecBrief.org - Why Every Website Should Use Always on SSL (AOSSL)). The GDPR in the EU and similar legal frameworks mandate that sensitive user data be handled with circumspection and not be collected/stored frivolously. Anonymizing the data goes a ways to ensuring that the users privacy is protected. To further protect user data, storing sensitive information in encrypted form makes it harder for bad actors to compromise the available information.
User pays shopping through app: Since the user is already using the App (presumably) through either the Google Play or App store, the user would be almost guaranteed to have access to one of the two payment methods. If (in a Alpha version) the app runs only in a browser, this assumption doesn’t hold true. Store Owners
Loss prevention: The average shrink rate—losses primarily because of theft—was 1.6% in 2022, up from 1.4% a year ago when the losses totaled 93.9 billion.https://nrf.com/research/national-retail-security-survey-2023Metric: Shrink Rate Target Values: 1.2 - 1.8 (2 points below 2021 and 2 points higher than 2022) Unit: Percent
Inventory Management: Stockout rate is the percentage of items not available when needed for sale. It is calculated as items not in stock divided by total available items in inventory. The average stockout rate is about 8%, and it rises when products are on sale. A high stockout rate can lead to significant lost sales.https://www.netsuite.com/portal/resource/articles/inventory-management/stockout.shtmlMetric: Stockout Rate Target Values: <8 - 16* Unit: Percent: Reduce Unnecessary Costs: Long lines and crowded stores result in unnecessary costs that create a bottleneck to producing revenue, all resulting from inefficiency with shoppers searching for products. Empty shelves due to unforeseen demand can result in unnecessary loss in revenue. By tracking customer search metrics, store owners will have the capability of having visibility into customer demand and respond faster with leading indicators specific to customers needs.
Increase Revenue: Our application is designed to help shoppers find products within a store faster thereby decreasing the time a shopper takes to find a product resulting in a decrease in time product remains on the shelf in stores. By decreasing the time products are on the shelf our application increases product turnover rate which should increase sales over a period of time. This added efficiency to shoppers in the store will result in more revenue over time for store owners.
Analytics: Customer profiles will be contained in our application with the capability of classifying a store’s customer base into personas. Collecting analytics around what a customer searches, purchases, when they buy and how they shop can give deep insights into what products are in demand by their loyal customers resulting in a highly targeted ad campaign tailored to a user. Insights in predictive, descriptive and prescriptive analytics derived from customer search activity can help the store operate more efficiently by measuring product search demand, peak shopping hours and much more. Decisions can be driven by customers' needs thereby producing a customer centric model for marketing, operations and more.<br>
Get to the right spot and find items: According to the Time Use Institute the average person spends 41 mins in the grocery store per shopping trip. This information coincides with another similar study of 1100 people done by Drive Research. This time metric is one that we would be looking to minimize by helping shoppers to find their items quicker. I know that by my own experience grocery shopping that if I miss an aisle and have to backtrack to find an item then it takes an average of additional 5 minutes, if this were to happen twice on a shopping trip then this would take 10 mins. We will take this 10 mins of wasted time and subtract the 1 minute that it theoretically takes to use our application and say that we are looking for 9 mins of time savings. This results in our target value for shoppers to take 32 minutes or less with the help of our Shopping Assistant. https://www.driveresearch.com/market-research-company-blog/grocery-store-statistics-where-when-how-much-people-grocery-shop/#GSS12
Grocery list management : Only 52% of men and 69% of women report making a grocery list before going shopping. Using a grocery list has many benefits including saving time, saving money, and eating healthier. In a study with 2300 shoppers, Jeffrey Inman at the University of Pittsburg found that people who reported using a shopping list made fewer unplanned purchases during their shopping trips. This information was confirmed when compared to other studies as well. In a recent study led by Drive research, we find that people spend an average of 155.62 per grocery shopping trip. According to a study in the Journal of Consumer Behaviour - Participants spent $64.91 with a list and $73.83 without a list. This results in a 12% savings. We will therefore look for our metric to be a 12 percent savings on the average of 155.62, therefore our target value will be 136.95 Dollars. https://www.researchgate.net/publication/339095436_Shopping_less_with_shopping_lists_Planning_individual_expenses_ahead_of_time_affects_purchasing_behavior_when_online_grocery_shopping
User data is safe: SSL is the standard for encrypting online communication and additionally ensures that the partners are who they say they are. It is wise for all web sites and services to use it, but especially critical for the collection of sensitive user data and ecommerce activities, which are both present in the app (SecBrief.org - Why Every Website Should Use Always on SSL (AOSSL)). The GDPR in the EU and similar legal frameworks mandate that sensitive user data be handled with circumspection and not be collected/stored frivolously. Anonymizing the data goes a ways to ensuring that the users privacy is protected. To further protect user data, storing sensitive information in encrypted form makes it harder for bad actors to compromise the available information.
User pays shopping through app: Since the user is already using the App (presumably) through either the Google Play or App store, the user would be almost guaranteed to have access to one of the two payment methods. If (in a Alpha version) the app runs only in a browser, this assumption doesn’t hold true. Store Owners
Loss prevention: The average shrink rate—losses primarily because of theft—was 1.6% in 2022, up from 1.4% a year ago when the losses totaled 93.9 billion.https://nrf.com/research/national-retail-security-survey-2023Metric: Shrink Rate Target Values: 1.2 - 1.8 (2 points below 2021 and 2 points higher than 2022) Unit: Percent
Inventory Management: Stockout rate is the percentage of items not available when needed for sale. It is calculated as items not in stock divided by total available items in inventory. The average stockout rate is about 8%, and it rises when products are on sale. A high stockout rate can lead to significant lost sales.https://www.netsuite.com/portal/resource/articles/inventory-management/stockout.shtmlMetric: Stockout Rate Target Values: <8 - 16* Unit: Percent: Reduce Unnecessary Costs: Long lines and crowded stores result in unnecessary costs that create a bottleneck to producing revenue, all resulting from inefficiency with shoppers searching for products. Empty shelves due to unforeseen demand can result in unnecessary loss in revenue. By tracking customer search metrics, store owners will have the capability of having visibility into customer demand and respond faster with leading indicators specific to customers needs.
Increase Revenue: Our application is designed to help shoppers find products within a store faster thereby decreasing the time a shopper takes to find a product resulting in a decrease in time product remains on the shelf in stores. By decreasing the time products are on the shelf our application increases product turnover rate which should increase sales over a period of time. This added efficiency to shoppers in the store will result in more revenue over time for store owners.
Analytics: Customer profiles will be contained in our application with the capability of classifying a store’s customer base into personas. Collecting analytics around what a customer searches, purchases, when they buy and how they shop can give deep insights into what products are in demand by their loyal customers resulting in a highly targeted ad campaign tailored to a user. Insights in predictive, descriptive and prescriptive analytics derived from customer search activity can help the store operate more efficiently by measuring product search demand, peak shopping hours and much more. Decisions can be driven by customers' needs thereby producing a customer centric model for marketing, operations and more.<br>
10
Milestone 3 | Step 2 | Generating, selecting, and developing product concepts Process Explained
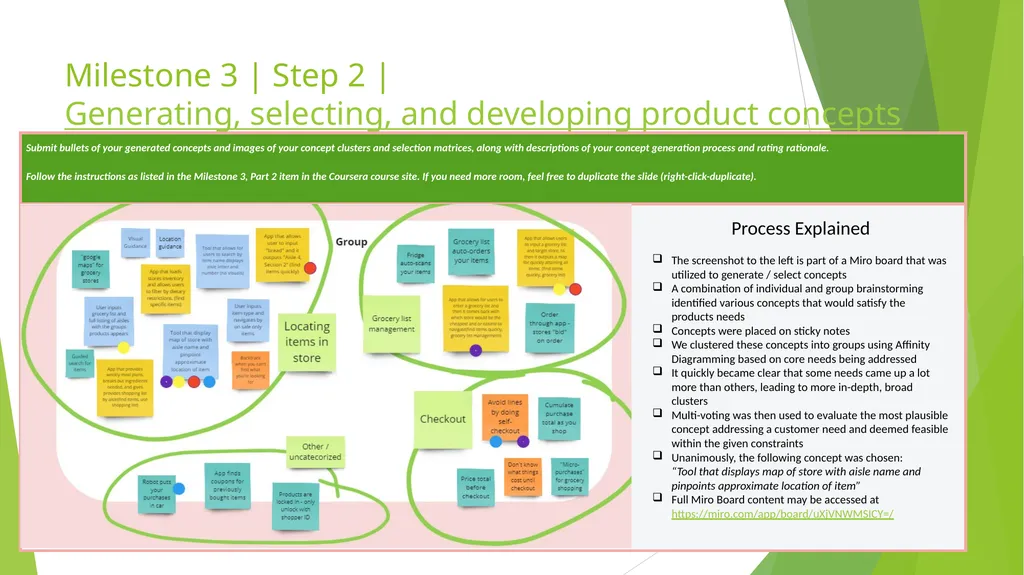
The screenshot to the left is part of a Miro board that was utilized to generate / select concepts
A combination of individual and group brainstorming identified various concepts that would satisfy the products needs
Concepts were placed on sticky notes
We clustered these concepts into groups using Affinity Diagramming based on core needs being addressed
It quickly became clear that some needs came up a lot more than others, leading to more in-depth, broad clusters
Multi-voting was then used to evaluate the most plausible concept addressing a customer need and deemed feasible within the given constraints
Unanimously, the following concept was chosen: “Tool that displays map of store with aisle name and pinpoints approximate location of item”
Full Miro Board content may be accessed at https://miro.com/app/board/uXjVNWMSICY=/<br>
The screenshot to the left is part of a Miro board that was utilized to generate / select concepts
A combination of individual and group brainstorming identified various concepts that would satisfy the products needs
Concepts were placed on sticky notes
We clustered these concepts into groups using Affinity Diagramming based on core needs being addressed
It quickly became clear that some needs came up a lot more than others, leading to more in-depth, broad clusters
Multi-voting was then used to evaluate the most plausible concept addressing a customer need and deemed feasible within the given constraints
Unanimously, the following concept was chosen: “Tool that displays map of store with aisle name and pinpoints approximate location of item”
Full Miro Board content may be accessed at https://miro.com/app/board/uXjVNWMSICY=/<br>
11
Milestone 4 | Step 1 | Prototyping status and plans<br>
12
Milestone 4 | Step 2 | User testing<br>
13
Appendix and works cited<br>
14
Appendix<br>
15
Works cited<br>