
CESIM Global Challenge Universe 1 • Round 1





Description: CESIM Global Challenge Universe 1 Round 1 Debrief GL Sec C Group July 2026 Growth, profit conversion, risk, and valuation discipline Core teaching question What did the market reward, what did it punish, and what should each team do
Related Topics
Download Presentation
"CESIM Global Challenge Universe 1 • Round 1" is the property of its rightful owner. Permission is granted to download and print the materials on this website for personal, non-commercial use only, and to display it on your personal computer provided you do not modify the materials and that you retain all copyright notices contained in the materials. By downloading content from our website, you accept the terms of this agreement.
Presentation Transcript
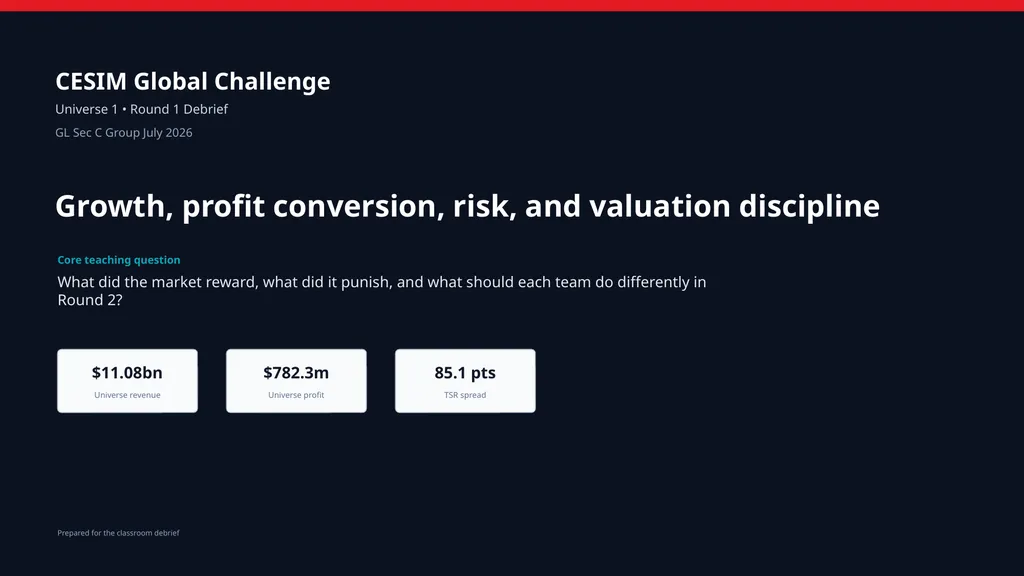
slide1. CESIM Global Challenge Universe 1 • Round 1 Debrief GL Sec C Group July 2026 Growth, profit conversion, risk, and valuation discipline Core teaching question What did the market reward, what did it punish, and what should each team do differently in Round 2? $11.08bn Universe revenue $782.3m Universe profit 85.1 pts TSR spread Prepared for the classroom debrief<br>
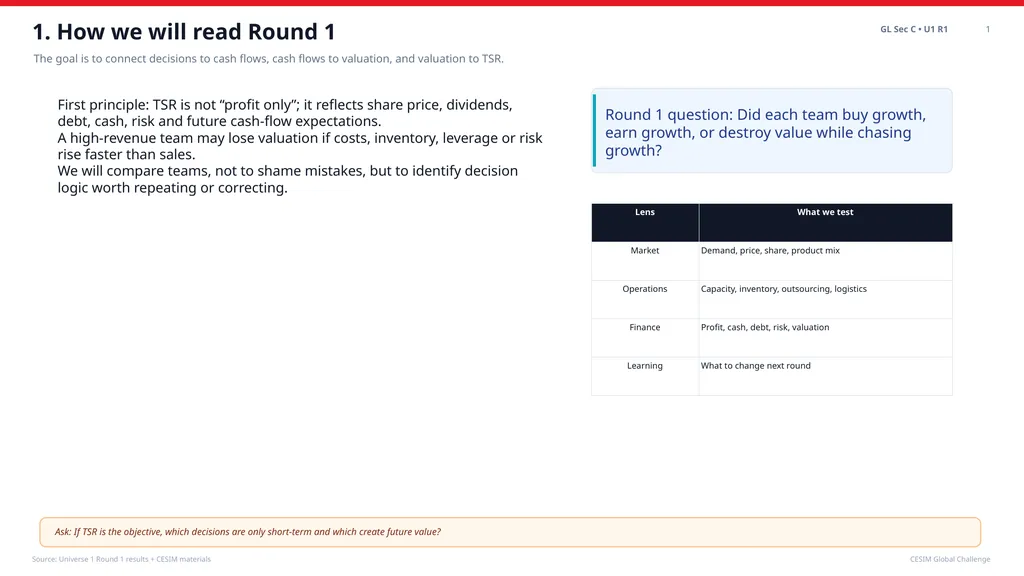
slide2. 1. How we will read Round 1 GL Sec C • U1 R1 1 The goal is to connect decisions to cash flows, cash flows to valuation, and valuation to TSR. Source: Universe 1 Round 1 results + CESIM materials CESIM Global Challenge First principle: TSR is not “profit only”; it reflects share price, dividends, debt, cash, risk and future cash-flow expectations.
A high-revenue team may lose valuation if costs, inventory, leverage or risk rise faster than sales.
We will compare teams, not to shame mistakes, but to identify decision logic worth repeating or correcting. Round 1 question: Did each team buy growth, earn growth, or destroy value while chasing growth? Ask: If TSR is the objective, which decisions are only short-term and which create future value?<br>
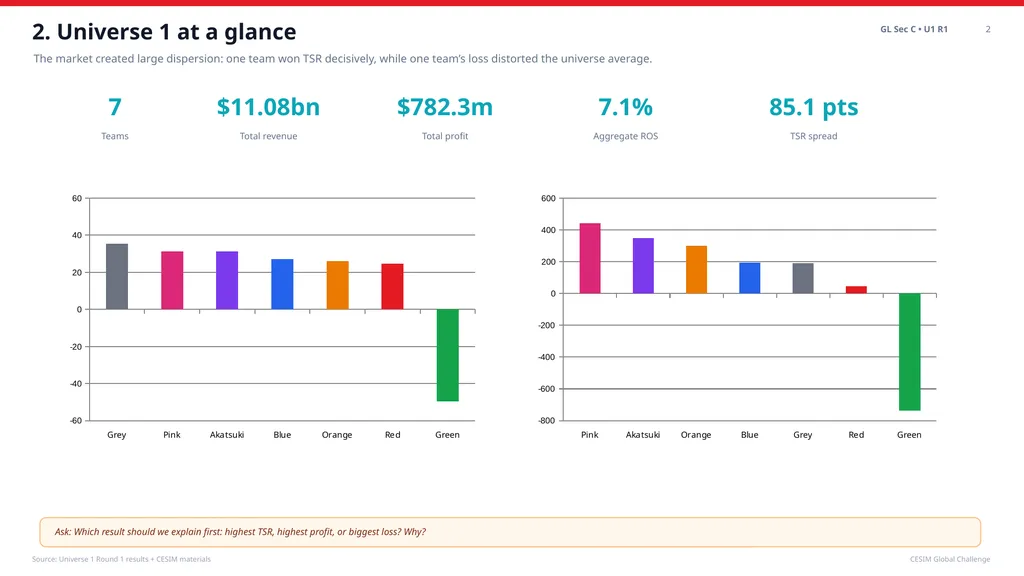
slide3. 2. Universe 1 at a glance GL Sec C • U1 R1 2 The market created large dispersion: one team won TSR decisively, while one team’s loss distorted the universe average. Source: Universe 1 Round 1 results + CESIM materials CESIM Global Challenge 7 Teams $11.08bn Total revenue $782.3m Total profit 7.1% Aggregate ROS 85.1 pts TSR spread Ask: Which result should we explain first: highest TSR, highest profit, or biggest loss? Why?<br>
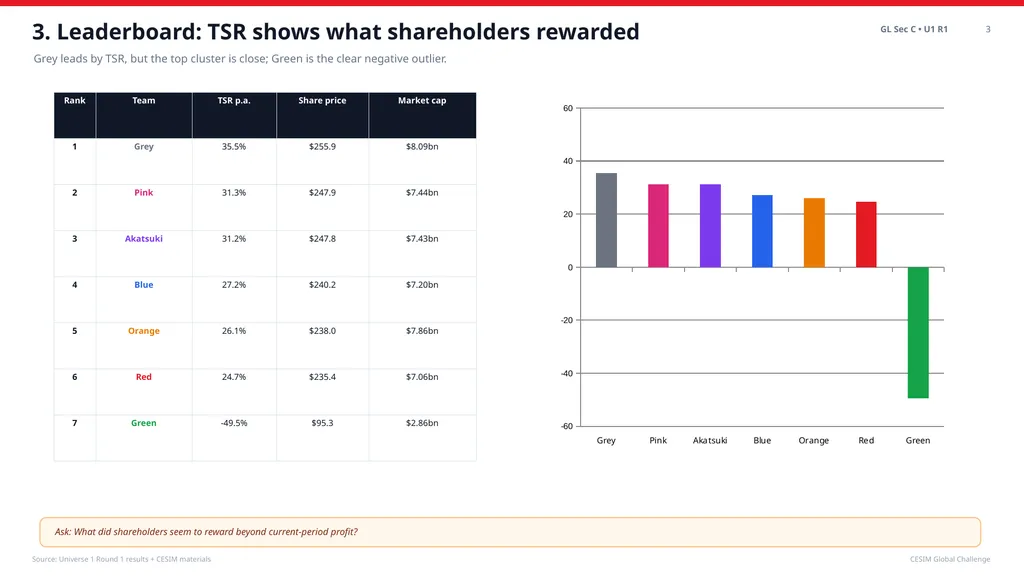
slide4. 3. Leaderboard: TSR shows what shareholders rewarded GL Sec C • U1 R1 3 Grey leads by TSR, but the top cluster is close; Green is the clear negative outlier. Source: Universe 1 Round 1 results + CESIM materials CESIM Global Challenge Ask: What did shareholders seem to reward beyond current-period profit?<br>
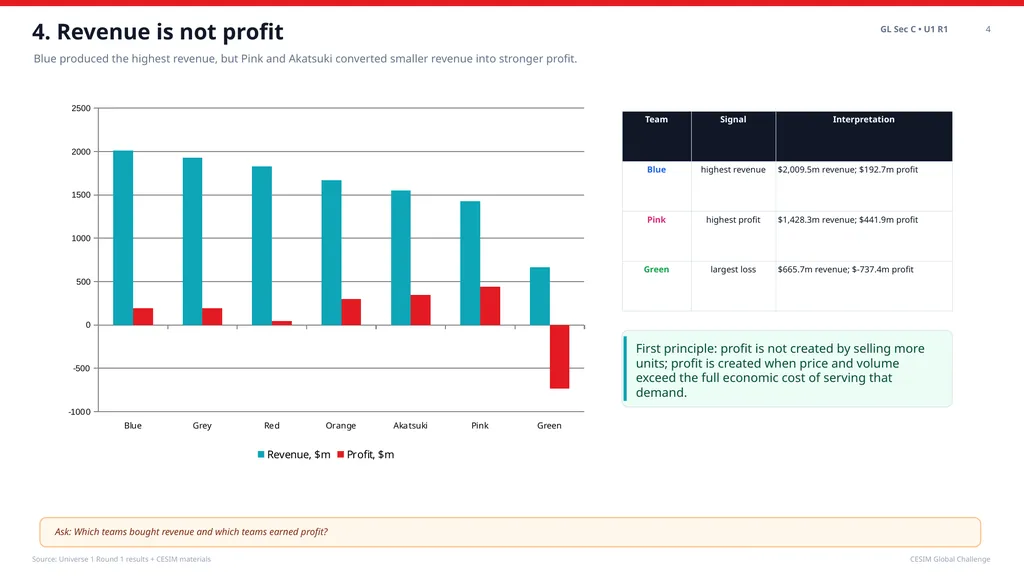
slide5. 4. Revenue is not profit GL Sec C • U1 R1 4 Blue produced the highest revenue, but Pink and Akatsuki converted smaller revenue into stronger profit. Source: Universe 1 Round 1 results + CESIM materials CESIM Global Challenge First principle: profit is not created by selling more units; profit is created when price and volume exceed the full economic cost of serving that demand. Ask: Which teams bought revenue and which teams earned profit?<br>
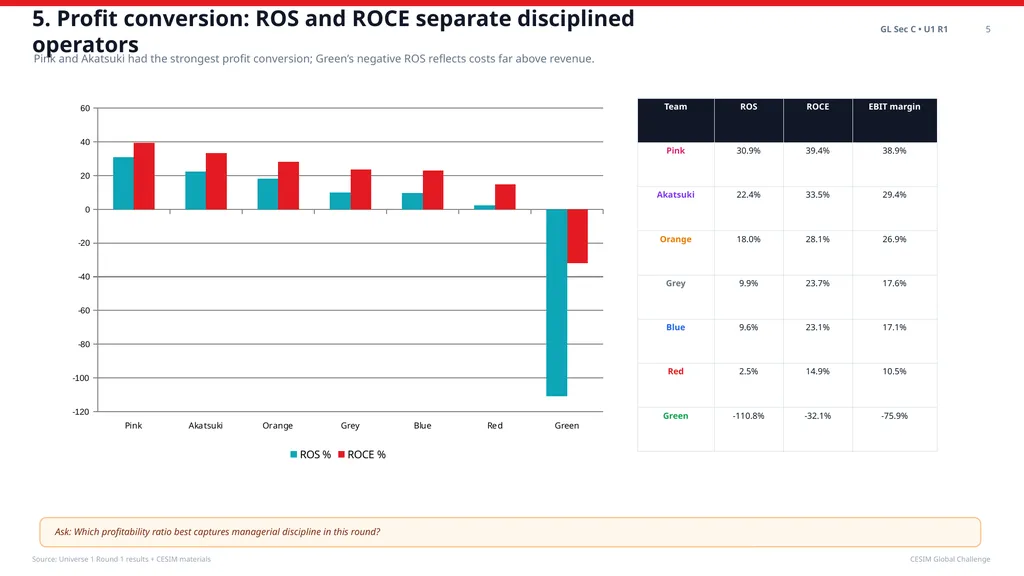
slide6. 5. Profit conversion: ROS and ROCE separate disciplined operators GL Sec C • U1 R1 5 Pink and Akatsuki had the strongest profit conversion; Green’s negative ROS reflects costs far above revenue. Source: Universe 1 Round 1 results + CESIM materials CESIM Global Challenge Ask: Which profitability ratio best captures managerial discipline in this round?<br>
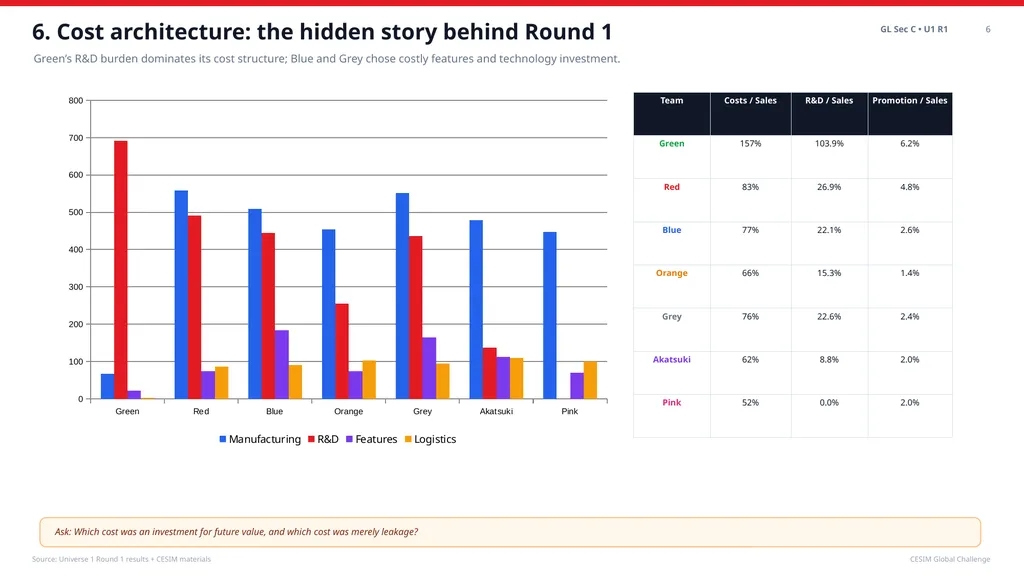
slide7. 6. Cost architecture: the hidden story behind Round 1 GL Sec C • U1 R1 6 Green’s R&D burden dominates its cost structure; Blue and Grey chose costly features and technology investment. Source: Universe 1 Round 1 results + CESIM materials CESIM Global Challenge Ask: Which cost was an investment for future value, and which cost was merely leakage?<br>
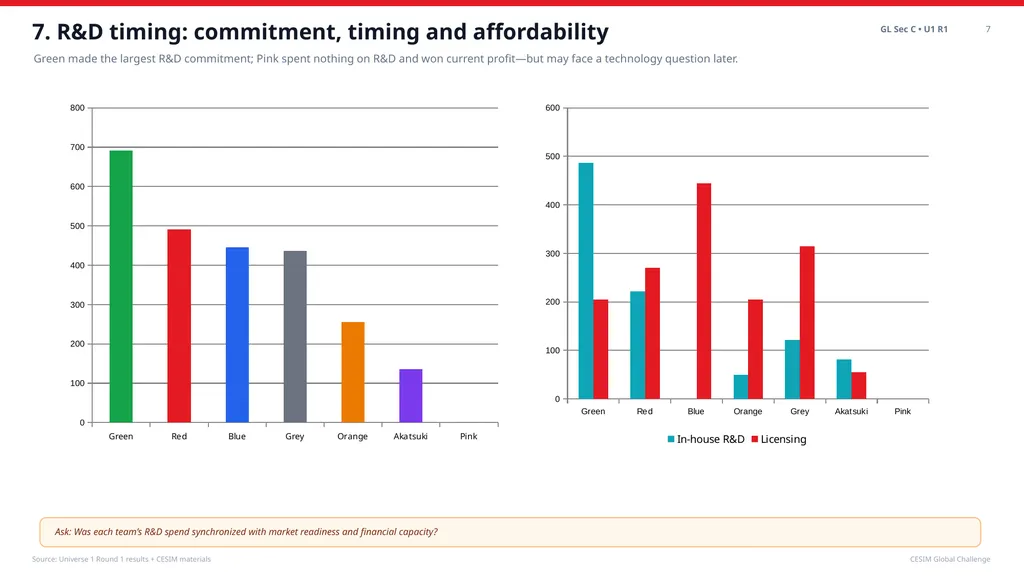
slide8. 7. R&D timing: commitment, timing and affordability GL Sec C • U1 R1 7 Green made the largest R&D commitment; Pink spent nothing on R&D and won current profit—but may face a technology question later. Source: Universe 1 Round 1 results + CESIM materials CESIM Global Challenge Ask: Was each team’s R&D spend synchronized with market readiness and financial capacity?<br>
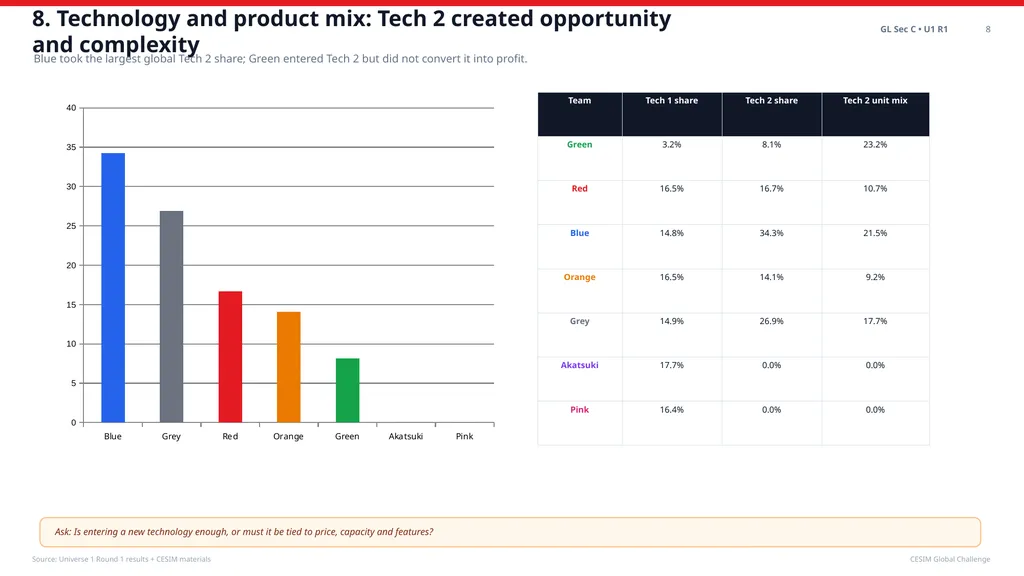
slide9. 8. Technology and product mix: Tech 2 created opportunity and complexity GL Sec C • U1 R1 8 Blue took the largest global Tech 2 share; Green entered Tech 2 but did not convert it into profit. Source: Universe 1 Round 1 results + CESIM materials CESIM Global Challenge Ask: Is entering a new technology enough, or must it be tied to price, capacity and features?<br>
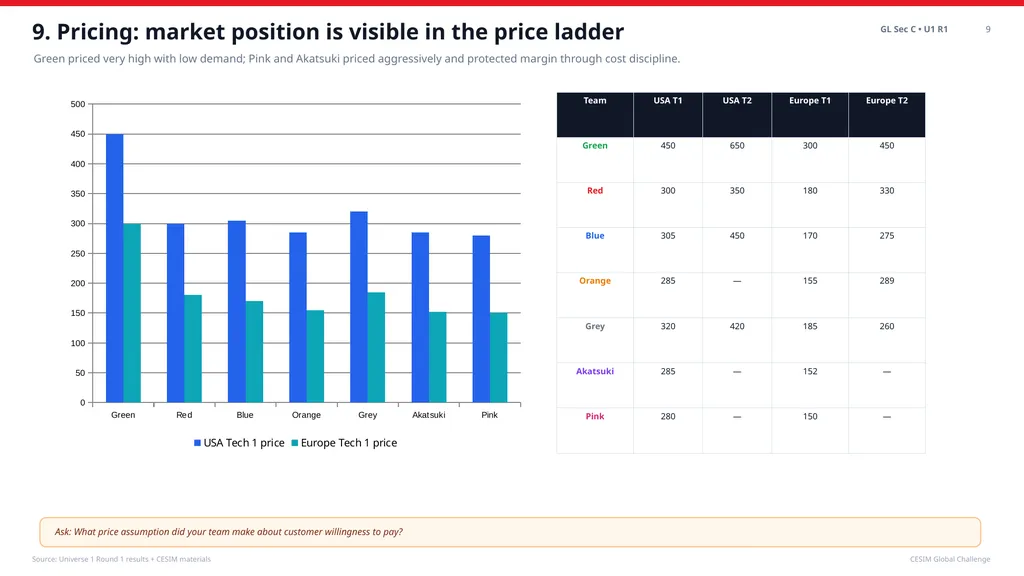
slide10. 9. Pricing: market position is visible in the price ladder GL Sec C • U1 R1 9 Green priced very high with low demand; Pink and Akatsuki priced aggressively and protected margin through cost discipline. Source: Universe 1 Round 1 results + CESIM materials CESIM Global Challenge Ask: What price assumption did your team make about customer willingness to pay?<br>
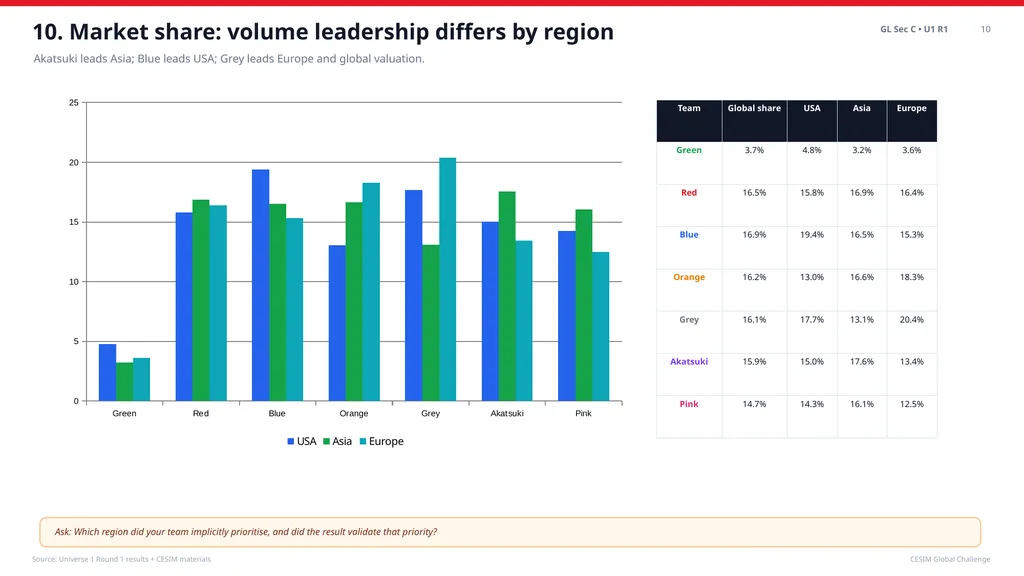
slide11. 10. Market share: volume leadership differs by region GL Sec C • U1 R1 10 Akatsuki leads Asia; Blue leads USA; Grey leads Europe and global valuation. Source: Universe 1 Round 1 results + CESIM materials CESIM Global Challenge Ask: Which region did your team implicitly prioritise, and did the result validate that priority?<br>
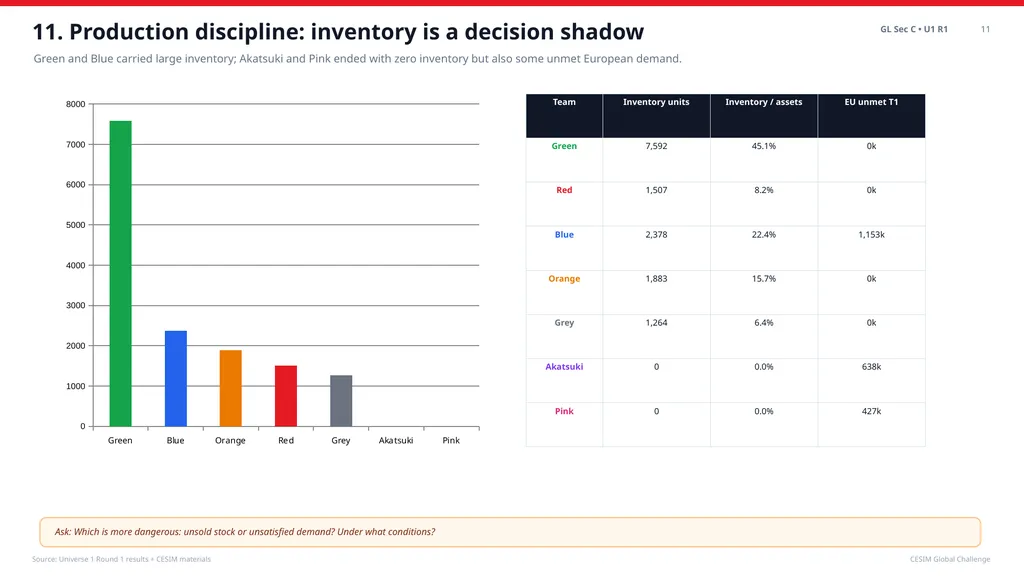
slide12. 11. Production discipline: inventory is a decision shadow GL Sec C • U1 R1 11 Green and Blue carried large inventory; Akatsuki and Pink ended with zero inventory but also some unmet European demand. Source: Universe 1 Round 1 results + CESIM materials CESIM Global Challenge Ask: Which is more dangerous: unsold stock or unsatisfied demand? Under what conditions?<br>
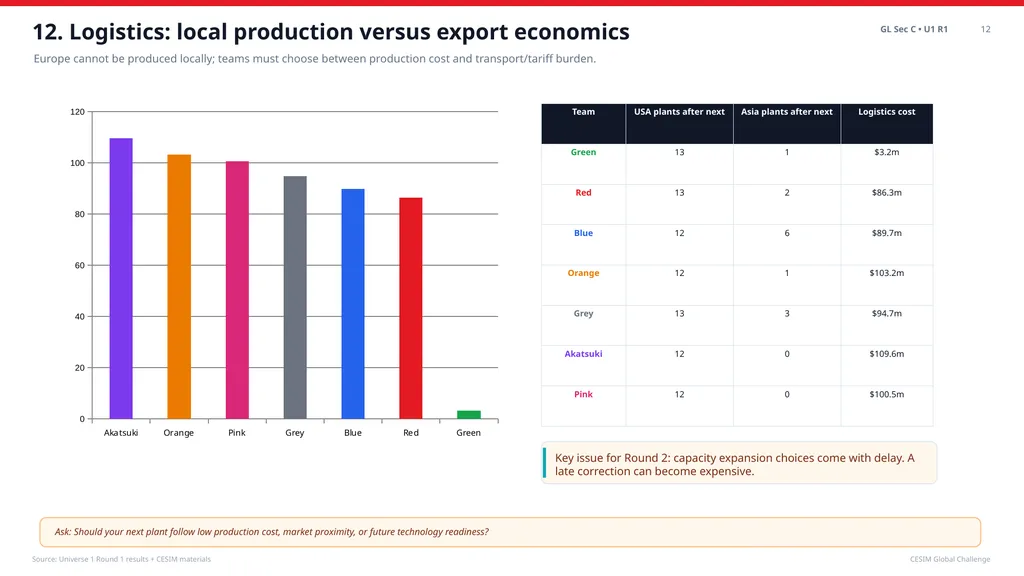
slide13. 12. Logistics: local production versus export economics GL Sec C • U1 R1 12 Europe cannot be produced locally; teams must choose between production cost and transport/tariff burden. Source: Universe 1 Round 1 results + CESIM materials CESIM Global Challenge Key issue for Round 2: capacity expansion choices come with delay. A late correction can become expensive. Ask: Should your next plant follow low production cost, market proximity, or future technology readiness?<br>
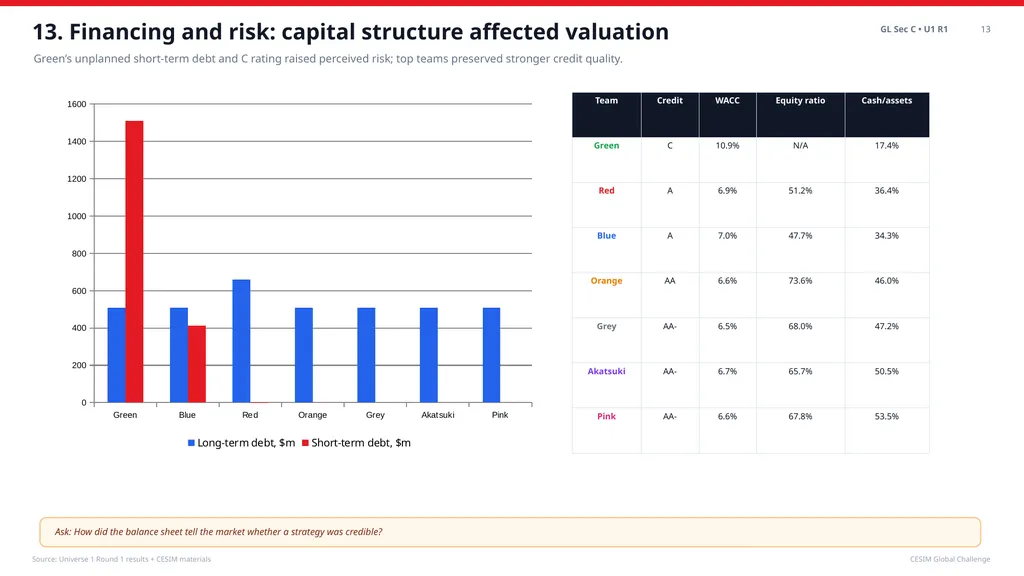
slide14. 13. Financing and risk: capital structure affected valuation GL Sec C • U1 R1 13 Green’s unplanned short-term debt and C rating raised perceived risk; top teams preserved stronger credit quality. Source: Universe 1 Round 1 results + CESIM materials CESIM Global Challenge Ask: How did the balance sheet tell the market whether a strategy was credible?<br>
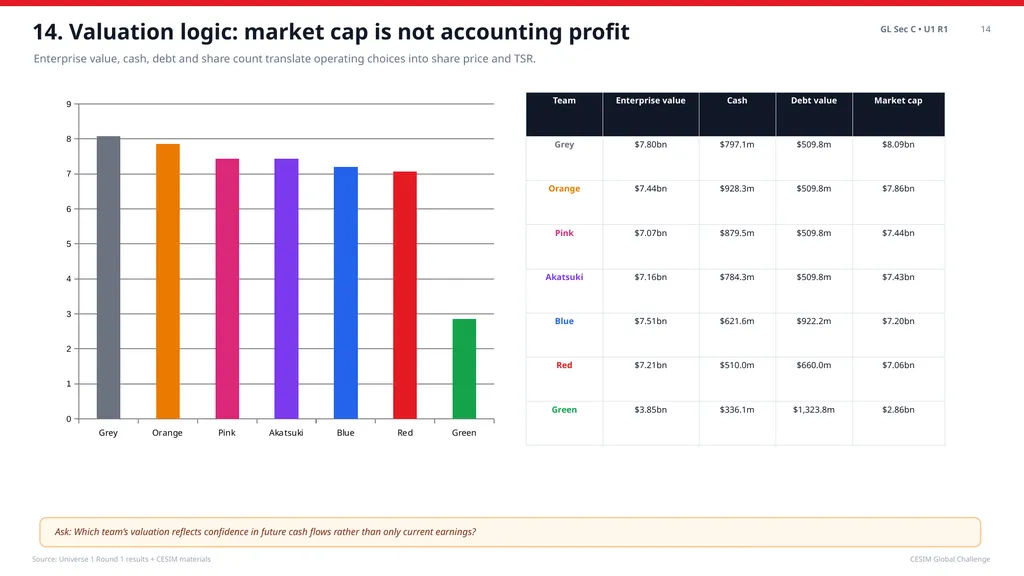
slide15. 14. Valuation logic: market cap is not accounting profit GL Sec C • U1 R1 14 Enterprise value, cash, debt and share count translate operating choices into share price and TSR. Source: Universe 1 Round 1 results + CESIM materials CESIM Global Challenge Ask: Which team’s valuation reflects confidence in future cash flows rather than only current earnings?<br>
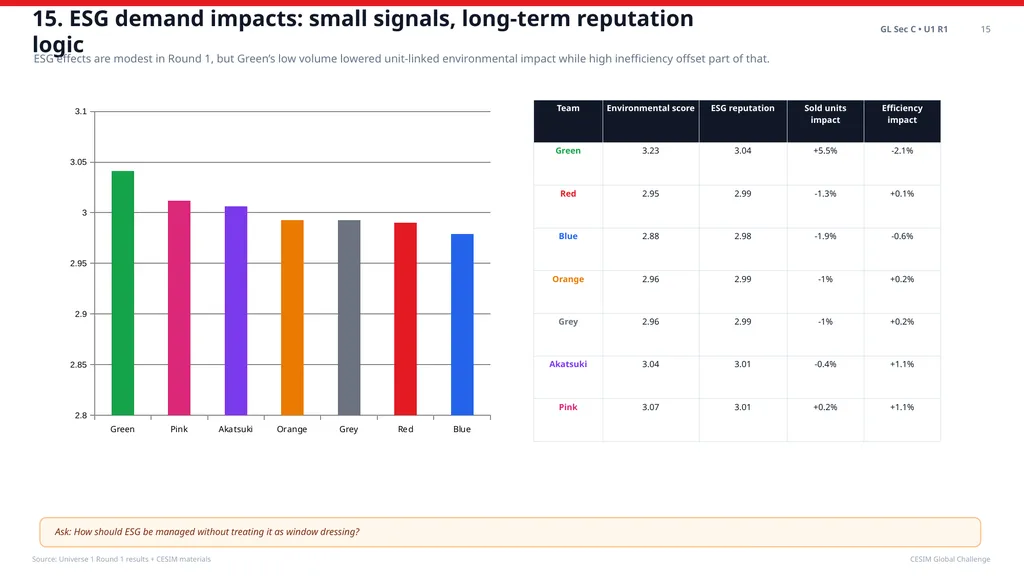
slide16. 15. ESG demand impacts: small signals, long-term reputation logic GL Sec C • U1 R1 15 ESG effects are modest in Round 1, but Green’s low volume lowered unit-linked environmental impact while high inefficiency offset part of that. Source: Universe 1 Round 1 results + CESIM materials CESIM Global Challenge Ask: How should ESG be managed without treating it as window dressing?<br>
slide17. 16. Diagnostic: Green’s loss is a system failure, not one bad number GL Sec C • U1 R1 16 High R&D, weak sales conversion, massive inventory and unplanned debt combined into negative TSR. Source: Universe 1 Round 1 results + CESIM materials CESIM Global Challenge -49.5% TSR $-737.4m Profit 103.9% R&D / sales 45.1% Inventory/assets $1,510.8m Short debt Ask: If you were Green’s CEO, what one decision would you reverse first?<br>
slide18. 17. Diagnostic: Pink and Akatsuki converted discipline into profit GL Sec C • U1 R1 17 Pink and Akatsuki protected margin with low R&D burden and strong operating conversion; the next question is future readiness. Source: Universe 1 Round 1 results + CESIM materials CESIM Global Challenge Teaching tension: efficiency wins the round, but technology neglect can become future vulnerability if market migration accelerates. Ask: Are Pink and Akatsuki efficient followers, or are they under-investing in the future?<br>
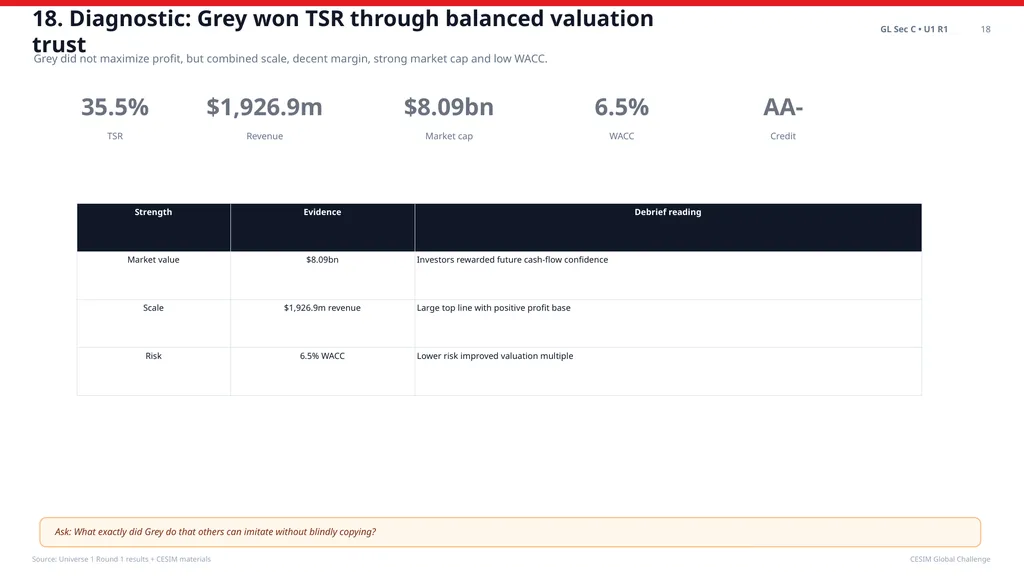
slide19. 18. Diagnostic: Grey won TSR through balanced valuation trust GL Sec C • U1 R1 18 Grey did not maximize profit, but combined scale, decent margin, strong market cap and low WACC. Source: Universe 1 Round 1 results + CESIM materials CESIM Global Challenge 35.5% TSR $1,926.9m Revenue $8.09bn Market cap 6.5% WACC AA- Credit Ask: What exactly did Grey do that others can imitate without blindly copying?<br>
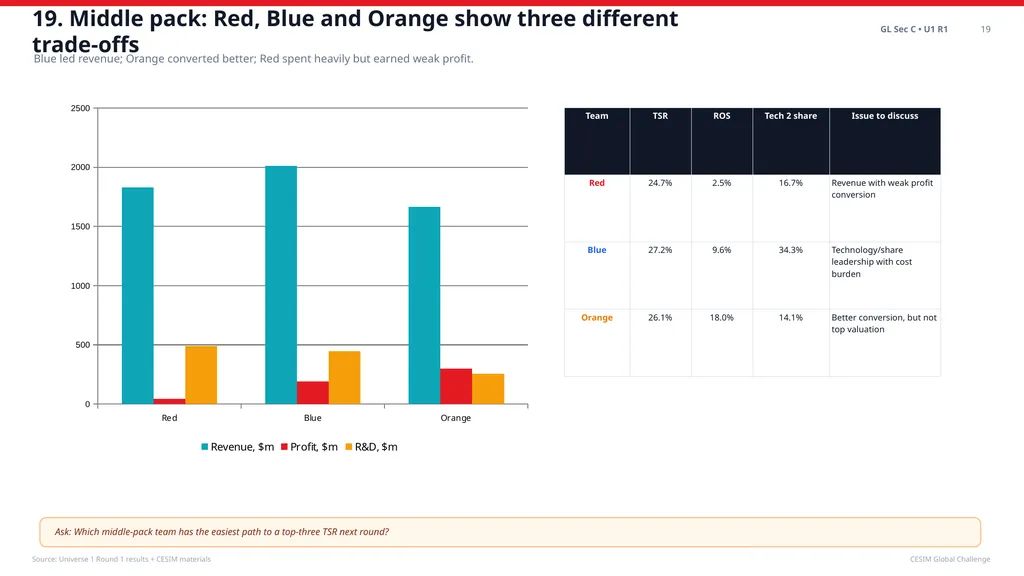
slide20. 19. Middle pack: Red, Blue and Orange show three different trade-offs GL Sec C • U1 R1 19 Blue led revenue; Orange converted better; Red spent heavily but earned weak profit. Source: Universe 1 Round 1 results + CESIM materials CESIM Global Challenge Ask: Which middle-pack team has the easiest path to a top-three TSR next round?<br>
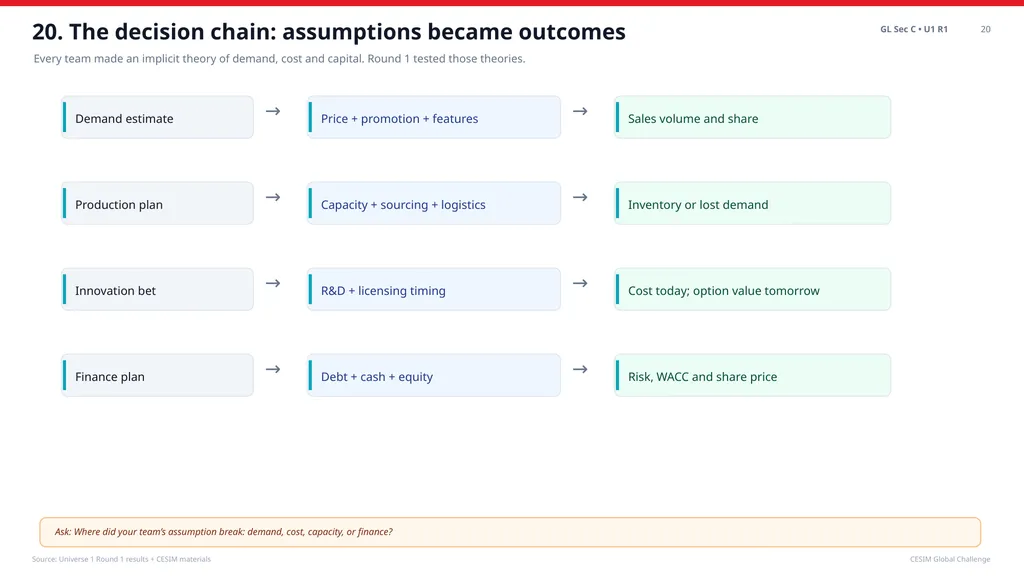
slide21. 20. The decision chain: assumptions became outcomes GL Sec C • U1 R1 20 Every team made an implicit theory of demand, cost and capital. Round 1 tested those theories. Source: Universe 1 Round 1 results + CESIM materials CESIM Global Challenge Demand estimate Price + promotion + features Sales volume and share → → Production plan Capacity + sourcing + logistics Inventory or lost demand → → Innovation bet R&D + licensing timing Cost today; option value tomorrow → → Finance plan Debt + cash + equity Risk, WACC and share price → → Ask: Where did your team’s assumption break: demand, cost, capacity, or finance?<br>
slide22. 21. What the market rewarded GL Sec C • U1 R1 21 The simulation rewarded profit conversion, valuation trust, and risk discipline more than raw volume alone. Source: Universe 1 Round 1 results + CESIM materials CESIM Global Challenge The winner was not merely the team that sold the most; it was the team whose strategy looked financially credible to shareholders. Ask: What did your team do that shareholders would regard as credible?<br>
slide23. 22. What the market punished GL Sec C • U1 R1 22 The market punished mis-timed investment, production-demand mismatch, unplanned debt and weak conversion. Source: Universe 1 Round 1 results + CESIM materials CESIM Global Challenge Ask: Which punished behavior is your team most at risk of repeating?<br>
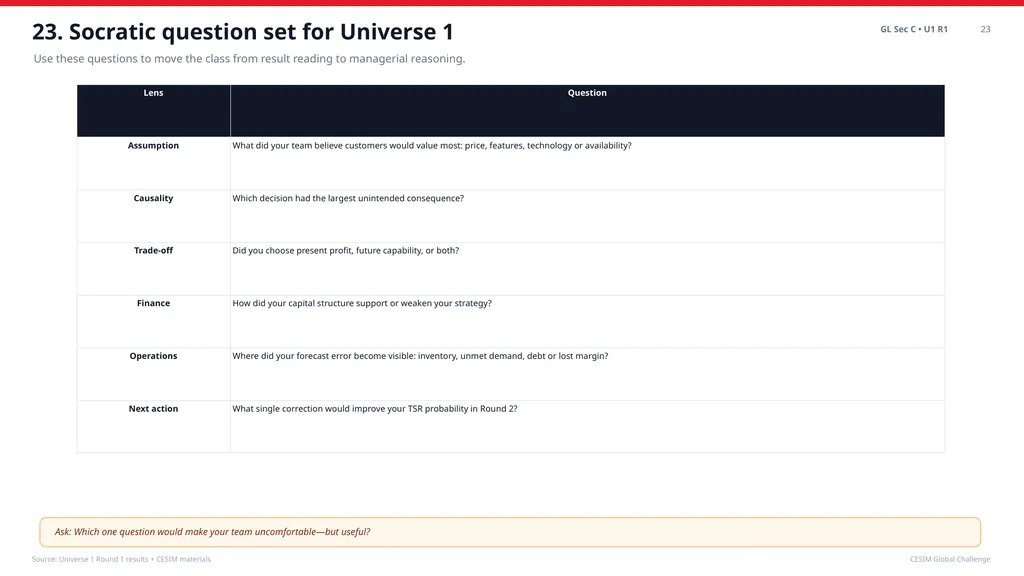
slide24. 23. Socratic question set for Universe 1 GL Sec C • U1 R1 23 Use these questions to move the class from result reading to managerial reasoning. Source: Universe 1 Round 1 results + CESIM materials CESIM Global Challenge Ask: Which one question would make your team uncomfortable—but useful?<br>
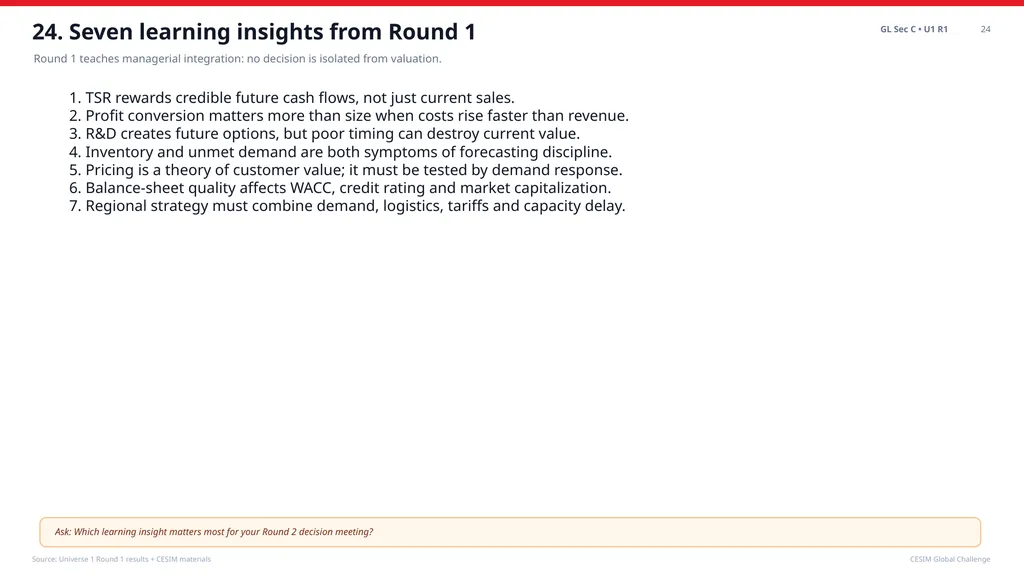
slide25. 24. Seven learning insights from Round 1 GL Sec C • U1 R1 24 Round 1 teaches managerial integration: no decision is isolated from valuation. Source: Universe 1 Round 1 results + CESIM materials CESIM Global Challenge 1. TSR rewards credible future cash flows, not just current sales.
2. Profit conversion matters more than size when costs rise faster than revenue.
3. R&D creates future options, but poor timing can destroy current value.
4. Inventory and unmet demand are both symptoms of forecasting discipline.
5. Pricing is a theory of customer value; it must be tested by demand response.
6. Balance-sheet quality affects WACC, credit rating and market capitalization.
7. Regional strategy must combine demand, logistics, tariffs and capacity delay. Ask: Which learning insight matters most for your Round 2 decision meeting?<br>
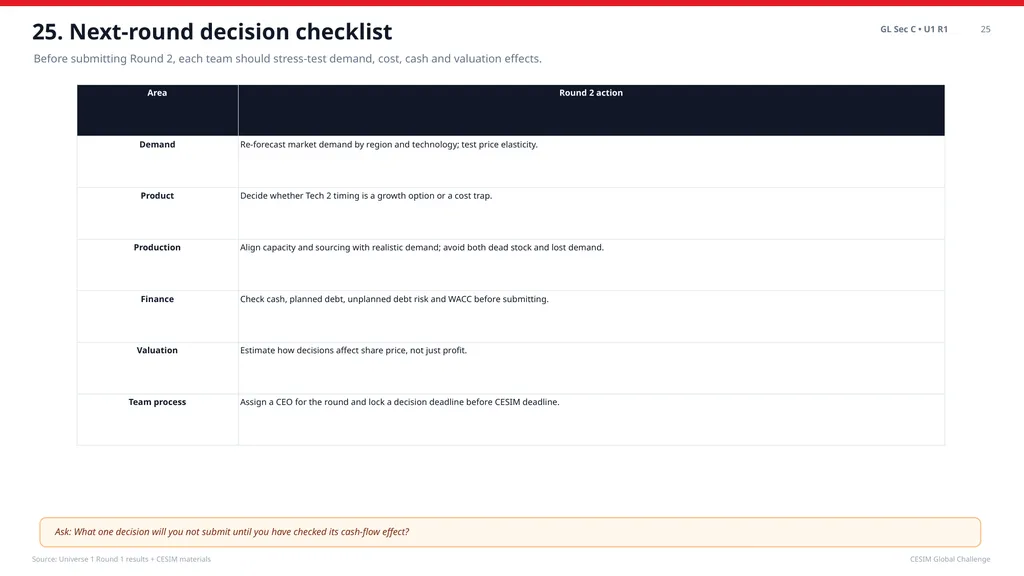
slide26. 25. Next-round decision checklist GL Sec C • U1 R1 25 Before submitting Round 2, each team should stress-test demand, cost, cash and valuation effects. Source: Universe 1 Round 1 results + CESIM materials CESIM Global Challenge Ask: What one decision will you not submit until you have checked its cash-flow effect?<br>
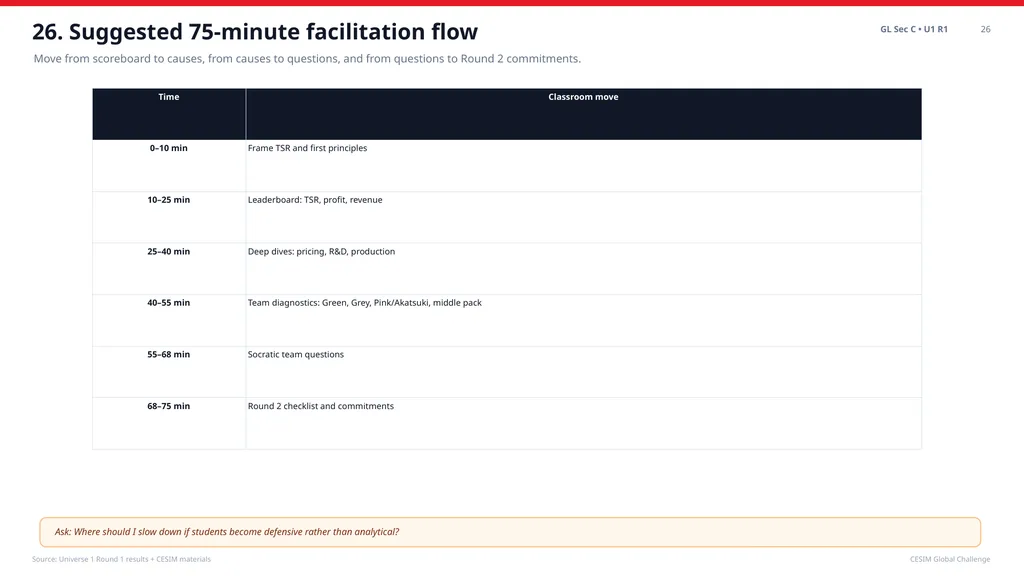
slide27. 26. Suggested 75-minute facilitation flow GL Sec C • U1 R1 26 Move from scoreboard to causes, from causes to questions, and from questions to Round 2 commitments. Source: Universe 1 Round 1 results + CESIM materials CESIM Global Challenge Ask: Where should I slow down if students become defensive rather than analytical?<br>
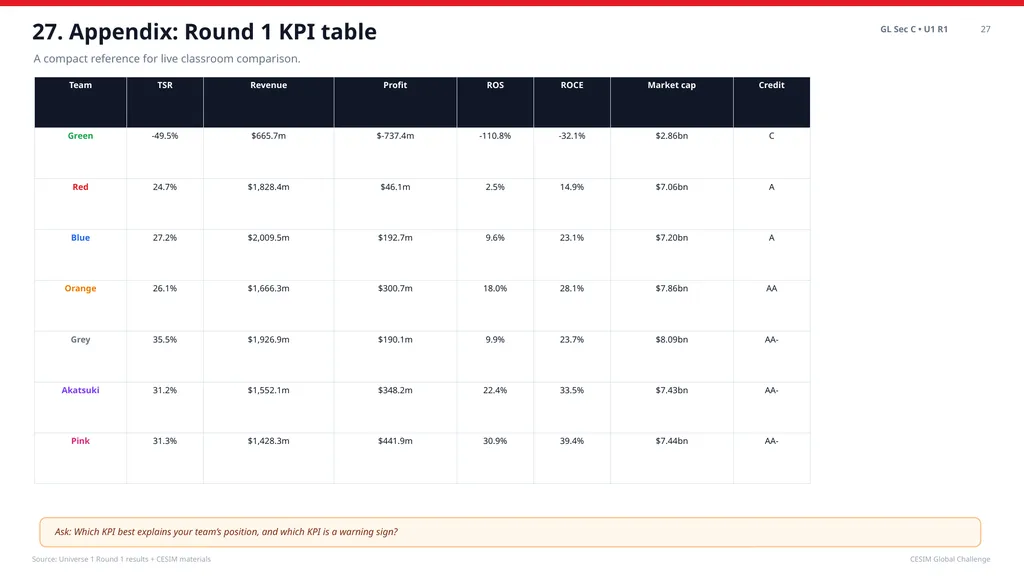
slide28. 27. Appendix: Round 1 KPI table GL Sec C • U1 R1 27 A compact reference for live classroom comparison. Source: Universe 1 Round 1 results + CESIM materials CESIM Global Challenge Ask: Which KPI best explains your team’s position, and which KPI is a warning sign?<br>
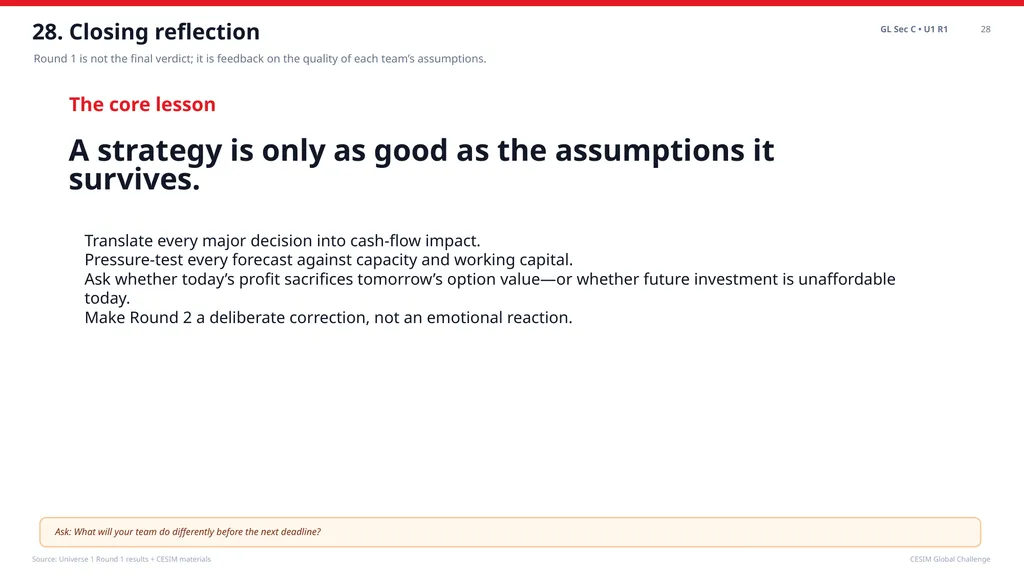
slide29. 28. Closing reflection GL Sec C • U1 R1 28 Round 1 is not the final verdict; it is feedback on the quality of each team’s assumptions. Source: Universe 1 Round 1 results + CESIM materials CESIM Global Challenge The core lesson A strategy is only as good as the assumptions it survives. Translate every major decision into cash-flow impact.
Pressure-test every forecast against capacity and working capital.
Ask whether today’s profit sacrifices tomorrow’s option value—or whether future investment is unaffordable today.
Make Round 2 a deliberate correction, not an emotional reaction. Ask: What will your team do differently before the next deadline?<br>
slide2. 1. How we will read Round 1 GL Sec C • U1 R1 1 The goal is to connect decisions to cash flows, cash flows to valuation, and valuation to TSR. Source: Universe 1 Round 1 results + CESIM materials CESIM Global Challenge First principle: TSR is not “profit only”; it reflects share price, dividends, debt, cash, risk and future cash-flow expectations.
A high-revenue team may lose valuation if costs, inventory, leverage or risk rise faster than sales.
We will compare teams, not to shame mistakes, but to identify decision logic worth repeating or correcting. Round 1 question: Did each team buy growth, earn growth, or destroy value while chasing growth? Ask: If TSR is the objective, which decisions are only short-term and which create future value?<br>
slide3. 2. Universe 1 at a glance GL Sec C • U1 R1 2 The market created large dispersion: one team won TSR decisively, while one team’s loss distorted the universe average. Source: Universe 1 Round 1 results + CESIM materials CESIM Global Challenge 7 Teams $11.08bn Total revenue $782.3m Total profit 7.1% Aggregate ROS 85.1 pts TSR spread Ask: Which result should we explain first: highest TSR, highest profit, or biggest loss? Why?<br>
slide4. 3. Leaderboard: TSR shows what shareholders rewarded GL Sec C • U1 R1 3 Grey leads by TSR, but the top cluster is close; Green is the clear negative outlier. Source: Universe 1 Round 1 results + CESIM materials CESIM Global Challenge Ask: What did shareholders seem to reward beyond current-period profit?<br>
slide5. 4. Revenue is not profit GL Sec C • U1 R1 4 Blue produced the highest revenue, but Pink and Akatsuki converted smaller revenue into stronger profit. Source: Universe 1 Round 1 results + CESIM materials CESIM Global Challenge First principle: profit is not created by selling more units; profit is created when price and volume exceed the full economic cost of serving that demand. Ask: Which teams bought revenue and which teams earned profit?<br>
slide6. 5. Profit conversion: ROS and ROCE separate disciplined operators GL Sec C • U1 R1 5 Pink and Akatsuki had the strongest profit conversion; Green’s negative ROS reflects costs far above revenue. Source: Universe 1 Round 1 results + CESIM materials CESIM Global Challenge Ask: Which profitability ratio best captures managerial discipline in this round?<br>
slide7. 6. Cost architecture: the hidden story behind Round 1 GL Sec C • U1 R1 6 Green’s R&D burden dominates its cost structure; Blue and Grey chose costly features and technology investment. Source: Universe 1 Round 1 results + CESIM materials CESIM Global Challenge Ask: Which cost was an investment for future value, and which cost was merely leakage?<br>
slide8. 7. R&D timing: commitment, timing and affordability GL Sec C • U1 R1 7 Green made the largest R&D commitment; Pink spent nothing on R&D and won current profit—but may face a technology question later. Source: Universe 1 Round 1 results + CESIM materials CESIM Global Challenge Ask: Was each team’s R&D spend synchronized with market readiness and financial capacity?<br>
slide9. 8. Technology and product mix: Tech 2 created opportunity and complexity GL Sec C • U1 R1 8 Blue took the largest global Tech 2 share; Green entered Tech 2 but did not convert it into profit. Source: Universe 1 Round 1 results + CESIM materials CESIM Global Challenge Ask: Is entering a new technology enough, or must it be tied to price, capacity and features?<br>
slide10. 9. Pricing: market position is visible in the price ladder GL Sec C • U1 R1 9 Green priced very high with low demand; Pink and Akatsuki priced aggressively and protected margin through cost discipline. Source: Universe 1 Round 1 results + CESIM materials CESIM Global Challenge Ask: What price assumption did your team make about customer willingness to pay?<br>
slide11. 10. Market share: volume leadership differs by region GL Sec C • U1 R1 10 Akatsuki leads Asia; Blue leads USA; Grey leads Europe and global valuation. Source: Universe 1 Round 1 results + CESIM materials CESIM Global Challenge Ask: Which region did your team implicitly prioritise, and did the result validate that priority?<br>
slide12. 11. Production discipline: inventory is a decision shadow GL Sec C • U1 R1 11 Green and Blue carried large inventory; Akatsuki and Pink ended with zero inventory but also some unmet European demand. Source: Universe 1 Round 1 results + CESIM materials CESIM Global Challenge Ask: Which is more dangerous: unsold stock or unsatisfied demand? Under what conditions?<br>
slide13. 12. Logistics: local production versus export economics GL Sec C • U1 R1 12 Europe cannot be produced locally; teams must choose between production cost and transport/tariff burden. Source: Universe 1 Round 1 results + CESIM materials CESIM Global Challenge Key issue for Round 2: capacity expansion choices come with delay. A late correction can become expensive. Ask: Should your next plant follow low production cost, market proximity, or future technology readiness?<br>
slide14. 13. Financing and risk: capital structure affected valuation GL Sec C • U1 R1 13 Green’s unplanned short-term debt and C rating raised perceived risk; top teams preserved stronger credit quality. Source: Universe 1 Round 1 results + CESIM materials CESIM Global Challenge Ask: How did the balance sheet tell the market whether a strategy was credible?<br>
slide15. 14. Valuation logic: market cap is not accounting profit GL Sec C • U1 R1 14 Enterprise value, cash, debt and share count translate operating choices into share price and TSR. Source: Universe 1 Round 1 results + CESIM materials CESIM Global Challenge Ask: Which team’s valuation reflects confidence in future cash flows rather than only current earnings?<br>
slide16. 15. ESG demand impacts: small signals, long-term reputation logic GL Sec C • U1 R1 15 ESG effects are modest in Round 1, but Green’s low volume lowered unit-linked environmental impact while high inefficiency offset part of that. Source: Universe 1 Round 1 results + CESIM materials CESIM Global Challenge Ask: How should ESG be managed without treating it as window dressing?<br>
slide17. 16. Diagnostic: Green’s loss is a system failure, not one bad number GL Sec C • U1 R1 16 High R&D, weak sales conversion, massive inventory and unplanned debt combined into negative TSR. Source: Universe 1 Round 1 results + CESIM materials CESIM Global Challenge -49.5% TSR $-737.4m Profit 103.9% R&D / sales 45.1% Inventory/assets $1,510.8m Short debt Ask: If you were Green’s CEO, what one decision would you reverse first?<br>
slide18. 17. Diagnostic: Pink and Akatsuki converted discipline into profit GL Sec C • U1 R1 17 Pink and Akatsuki protected margin with low R&D burden and strong operating conversion; the next question is future readiness. Source: Universe 1 Round 1 results + CESIM materials CESIM Global Challenge Teaching tension: efficiency wins the round, but technology neglect can become future vulnerability if market migration accelerates. Ask: Are Pink and Akatsuki efficient followers, or are they under-investing in the future?<br>
slide19. 18. Diagnostic: Grey won TSR through balanced valuation trust GL Sec C • U1 R1 18 Grey did not maximize profit, but combined scale, decent margin, strong market cap and low WACC. Source: Universe 1 Round 1 results + CESIM materials CESIM Global Challenge 35.5% TSR $1,926.9m Revenue $8.09bn Market cap 6.5% WACC AA- Credit Ask: What exactly did Grey do that others can imitate without blindly copying?<br>
slide20. 19. Middle pack: Red, Blue and Orange show three different trade-offs GL Sec C • U1 R1 19 Blue led revenue; Orange converted better; Red spent heavily but earned weak profit. Source: Universe 1 Round 1 results + CESIM materials CESIM Global Challenge Ask: Which middle-pack team has the easiest path to a top-three TSR next round?<br>
slide21. 20. The decision chain: assumptions became outcomes GL Sec C • U1 R1 20 Every team made an implicit theory of demand, cost and capital. Round 1 tested those theories. Source: Universe 1 Round 1 results + CESIM materials CESIM Global Challenge Demand estimate Price + promotion + features Sales volume and share → → Production plan Capacity + sourcing + logistics Inventory or lost demand → → Innovation bet R&D + licensing timing Cost today; option value tomorrow → → Finance plan Debt + cash + equity Risk, WACC and share price → → Ask: Where did your team’s assumption break: demand, cost, capacity, or finance?<br>
slide22. 21. What the market rewarded GL Sec C • U1 R1 21 The simulation rewarded profit conversion, valuation trust, and risk discipline more than raw volume alone. Source: Universe 1 Round 1 results + CESIM materials CESIM Global Challenge The winner was not merely the team that sold the most; it was the team whose strategy looked financially credible to shareholders. Ask: What did your team do that shareholders would regard as credible?<br>
slide23. 22. What the market punished GL Sec C • U1 R1 22 The market punished mis-timed investment, production-demand mismatch, unplanned debt and weak conversion. Source: Universe 1 Round 1 results + CESIM materials CESIM Global Challenge Ask: Which punished behavior is your team most at risk of repeating?<br>
slide24. 23. Socratic question set for Universe 1 GL Sec C • U1 R1 23 Use these questions to move the class from result reading to managerial reasoning. Source: Universe 1 Round 1 results + CESIM materials CESIM Global Challenge Ask: Which one question would make your team uncomfortable—but useful?<br>
slide25. 24. Seven learning insights from Round 1 GL Sec C • U1 R1 24 Round 1 teaches managerial integration: no decision is isolated from valuation. Source: Universe 1 Round 1 results + CESIM materials CESIM Global Challenge 1. TSR rewards credible future cash flows, not just current sales.
2. Profit conversion matters more than size when costs rise faster than revenue.
3. R&D creates future options, but poor timing can destroy current value.
4. Inventory and unmet demand are both symptoms of forecasting discipline.
5. Pricing is a theory of customer value; it must be tested by demand response.
6. Balance-sheet quality affects WACC, credit rating and market capitalization.
7. Regional strategy must combine demand, logistics, tariffs and capacity delay. Ask: Which learning insight matters most for your Round 2 decision meeting?<br>
slide26. 25. Next-round decision checklist GL Sec C • U1 R1 25 Before submitting Round 2, each team should stress-test demand, cost, cash and valuation effects. Source: Universe 1 Round 1 results + CESIM materials CESIM Global Challenge Ask: What one decision will you not submit until you have checked its cash-flow effect?<br>
slide27. 26. Suggested 75-minute facilitation flow GL Sec C • U1 R1 26 Move from scoreboard to causes, from causes to questions, and from questions to Round 2 commitments. Source: Universe 1 Round 1 results + CESIM materials CESIM Global Challenge Ask: Where should I slow down if students become defensive rather than analytical?<br>
slide28. 27. Appendix: Round 1 KPI table GL Sec C • U1 R1 27 A compact reference for live classroom comparison. Source: Universe 1 Round 1 results + CESIM materials CESIM Global Challenge Ask: Which KPI best explains your team’s position, and which KPI is a warning sign?<br>
slide29. 28. Closing reflection GL Sec C • U1 R1 28 Round 1 is not the final verdict; it is feedback on the quality of each team’s assumptions. Source: Universe 1 Round 1 results + CESIM materials CESIM Global Challenge The core lesson A strategy is only as good as the assumptions it survives. Translate every major decision into cash-flow impact.
Pressure-test every forecast against capacity and working capital.
Ask whether today’s profit sacrifices tomorrow’s option value—or whether future investment is unaffordable today.
Make Round 2 a deliberate correction, not an emotional reaction. Ask: What will your team do differently before the next deadline?<br>