Chapter 14 Bond Prices and Yields INVESTMENTS |
Description: Chapter 14 Bond Prices and Yields INVESTMENTS BODIE, KANE, MARCUS McGraw-Hill Education. All rights reserved. Authorized only for instructor use in the classroom. No reproduction or further distribution permitted without the prior
Related Topics
Download Presentation
"Chapter 14 Bond Prices and Yields INVESTMENTS |" is the property of its rightful owner. Permission is granted to download and print the materials on this website for personal, non-commercial use only, and to display it on your personal computer provided you do not modify the materials and that you retain all copyright notices contained in the materials. By downloading content from our website, you accept the terms of this agreement.
Presentation Transcript
slide1. Chapter 14 Bond Prices and Yields INVESTMENTS | BODIE, KANE, MARCUS © McGraw-Hill Education. All rights reserved. Authorized only for instructor use in the classroom. No reproduction or further distribution permitted without the prior written consent of McGraw-Hill Education.<br>
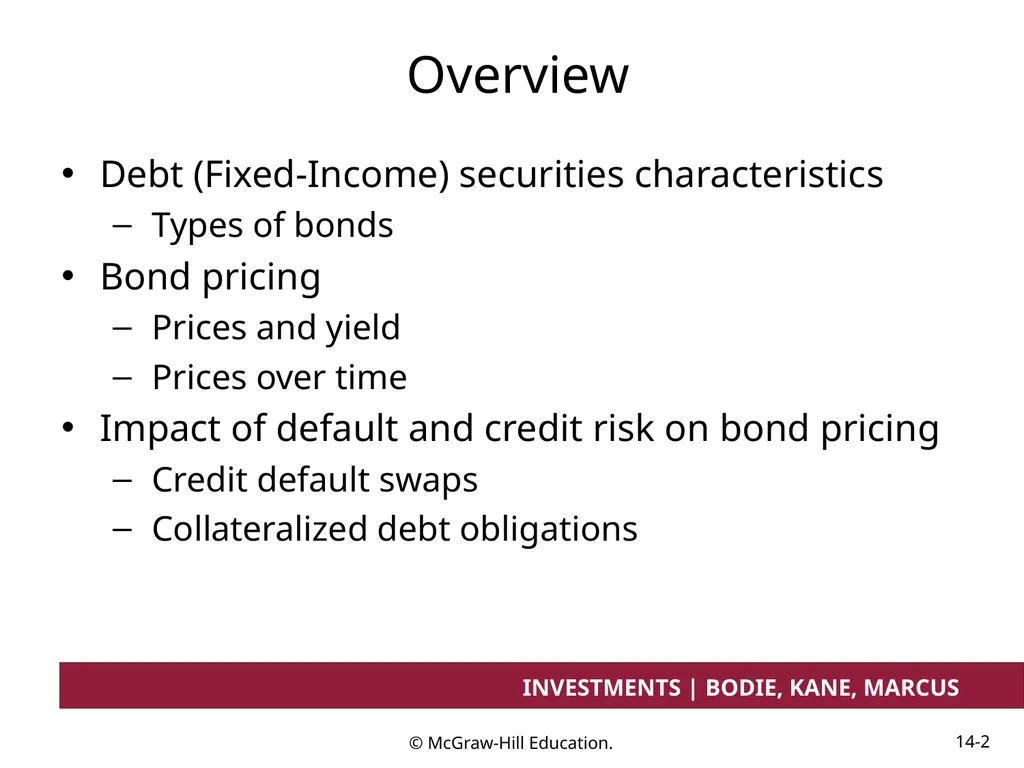
slide2. Overview Debt (Fixed-Income) securities characteristics
Types of bonds
Bond pricing
Prices and yield
Prices over time
Impact of default and credit risk on bond pricing
Credit default swaps
Collateralized debt obligations<br>
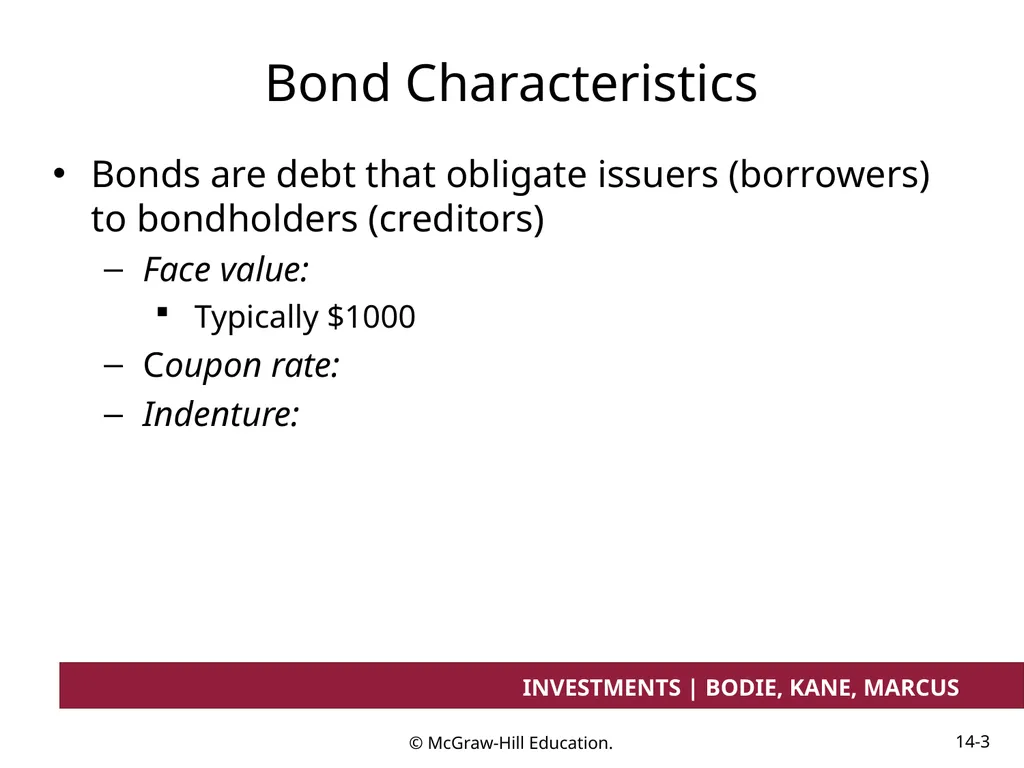
slide3. Bond Characteristics Bonds are debt that obligate issuers (borrowers) to bondholders (creditors)
Face value:
Typically $1000
Coupon rate:
Indenture:<br>
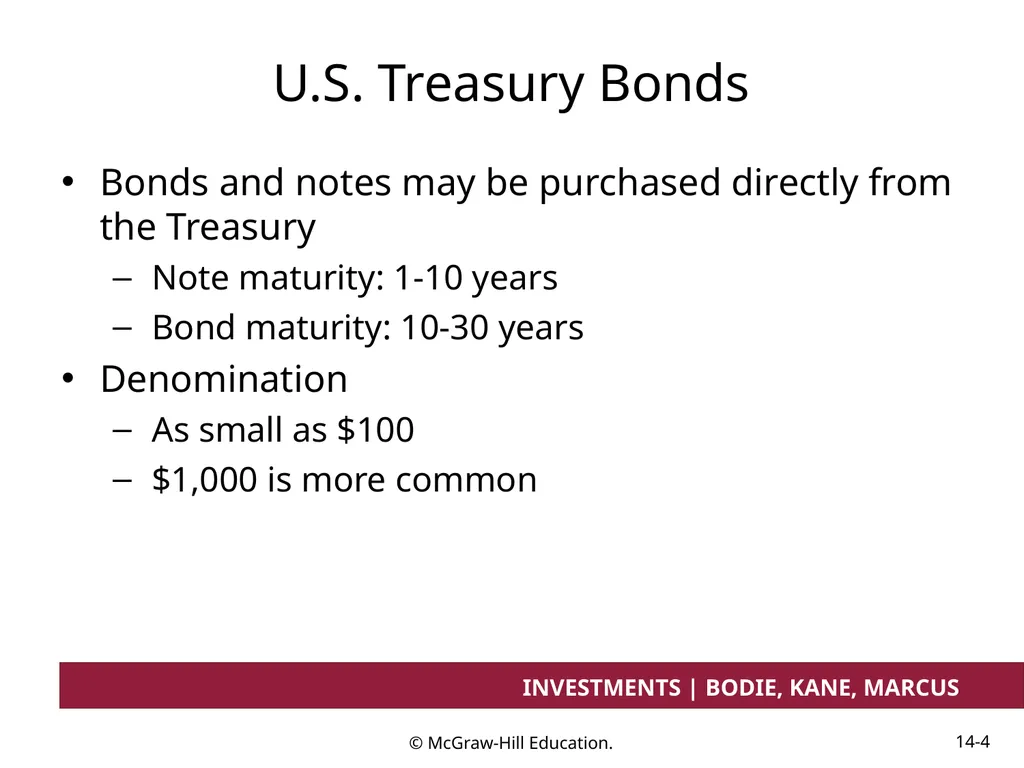
slide4. U.S. Treasury Bonds Bonds and notes may be purchased directly from the Treasury
Note maturity: 1-10 years
Bond maturity: 10-30 years
Denomination
As small as $100
$1,000 is more common<br>
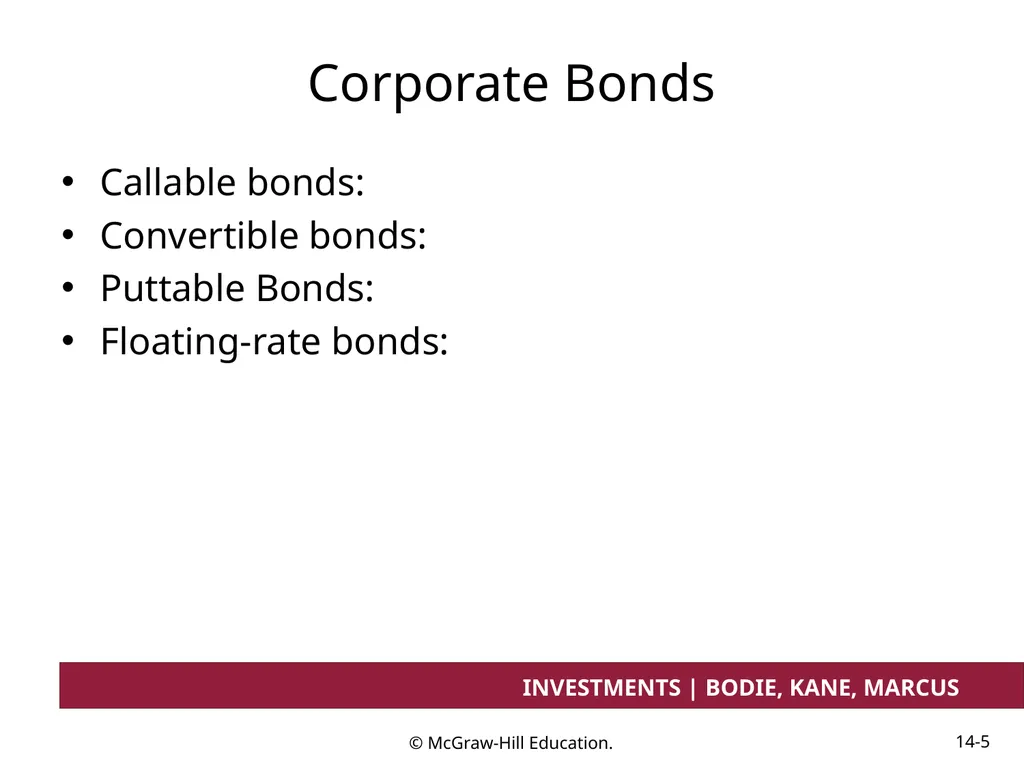
slide5. Corporate Bonds Callable bonds:
Convertible bonds:
Puttable Bonds:
Floating-rate bonds:<br>
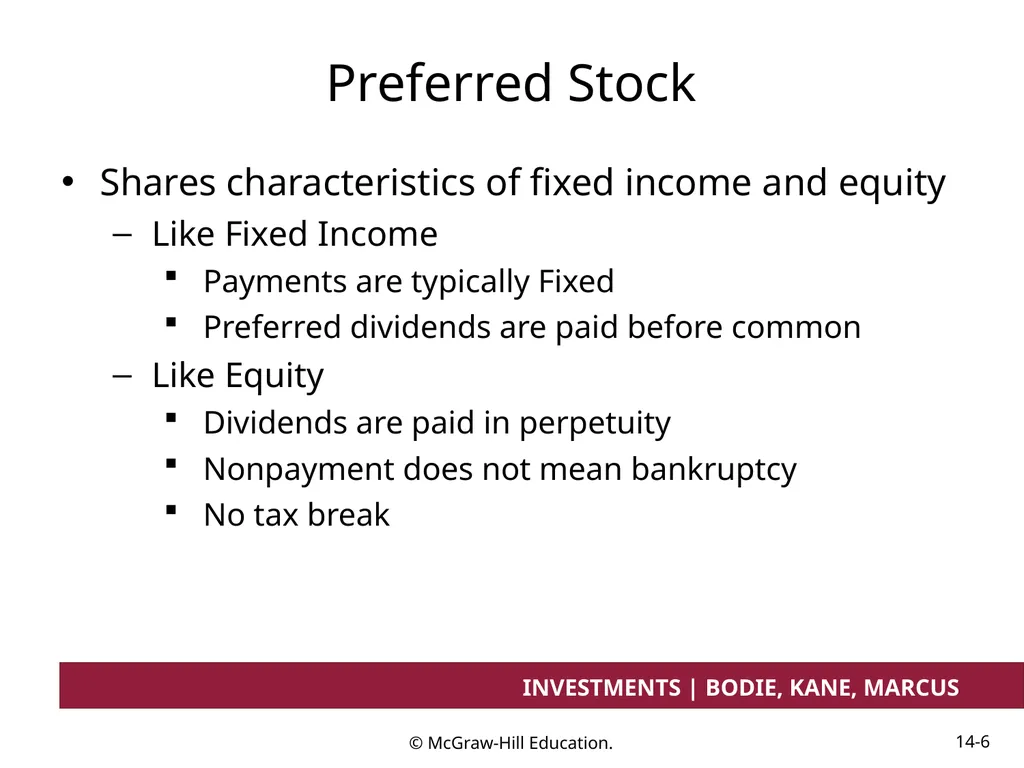
slide6. Preferred Stock Shares characteristics of fixed income and equity
Like Fixed Income
Payments are typically Fixed
Preferred dividends are paid before common
Like Equity
Dividends are paid in perpetuity
Nonpayment does not mean bankruptcy
No tax break<br>
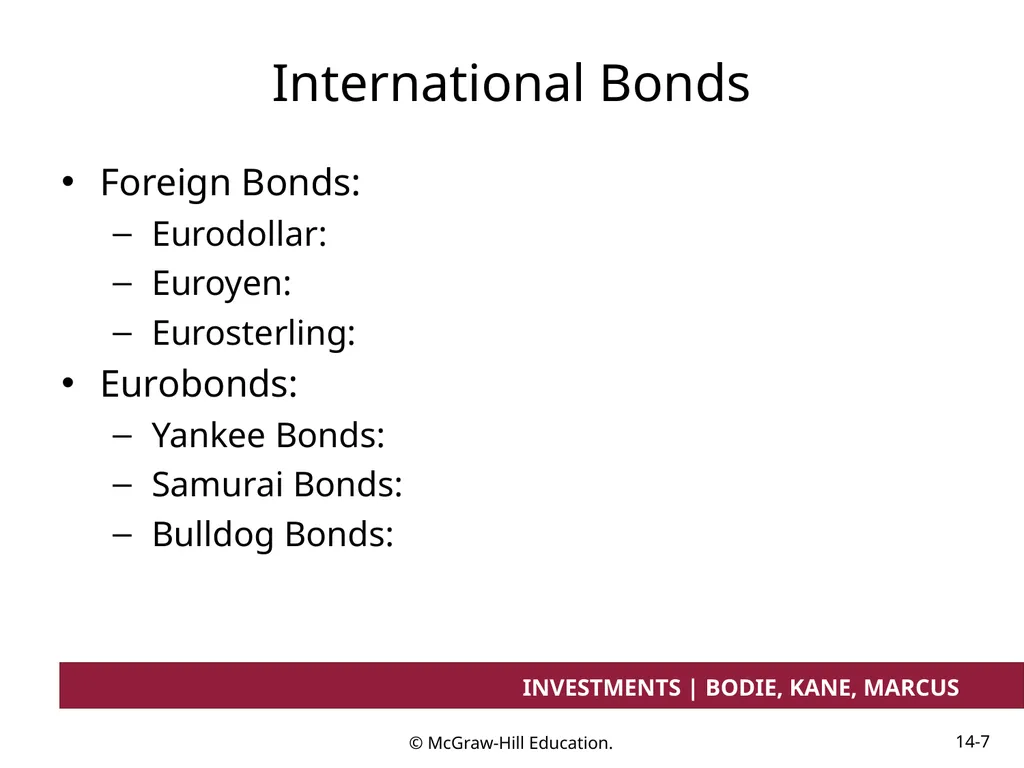
slide7. International Bonds Foreign Bonds:
Eurodollar:
Euroyen:
Eurosterling:
Eurobonds:
Yankee Bonds:
Samurai Bonds:
Bulldog Bonds:<br>
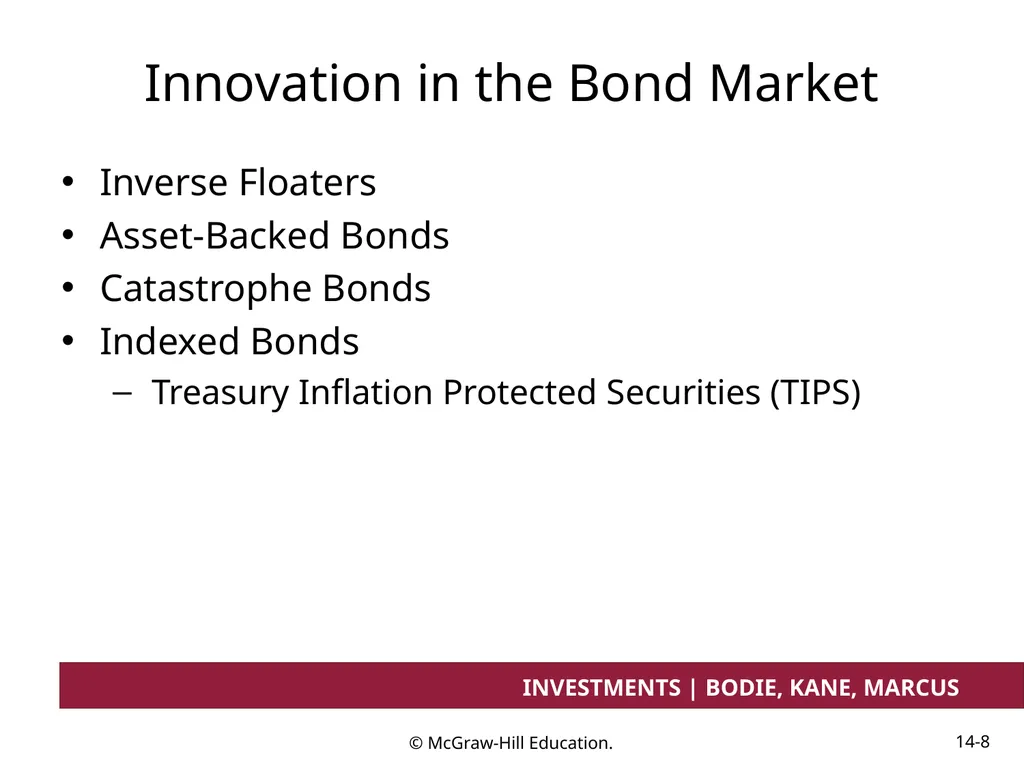
slide8. Innovation in the Bond Market Inverse Floaters
Asset-Backed Bonds
Catastrophe Bonds
Indexed Bonds
Treasury Inflation Protected Securities (TIPS)<br>
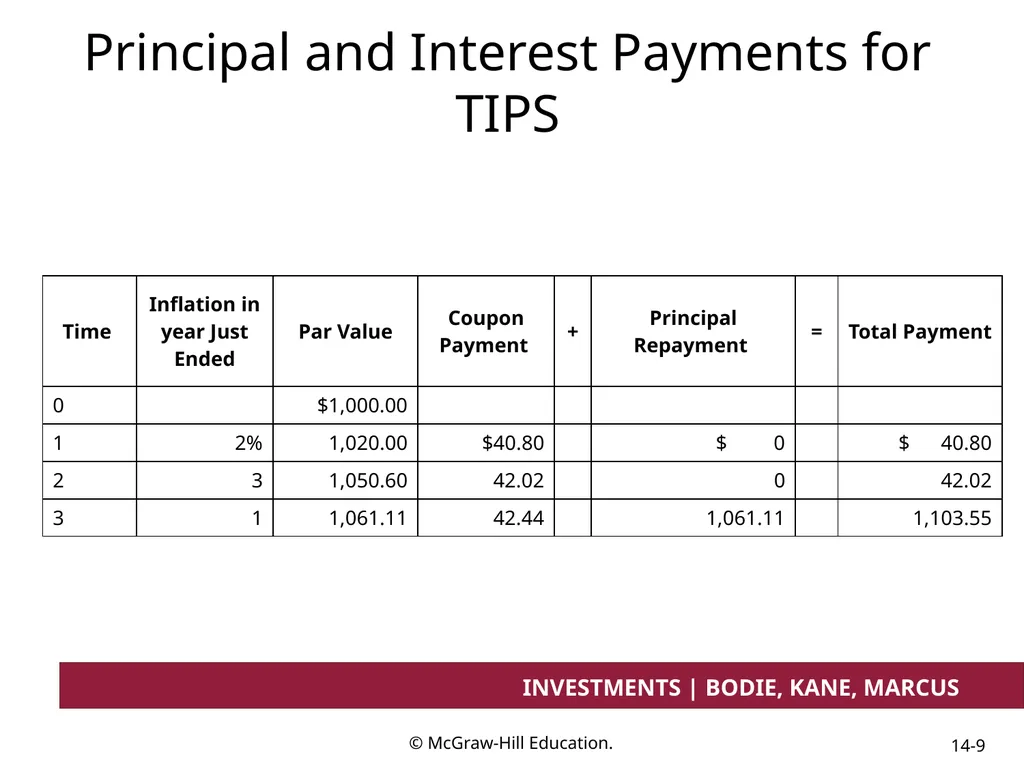
slide9. Principal and Interest Payments for TIPS<br>
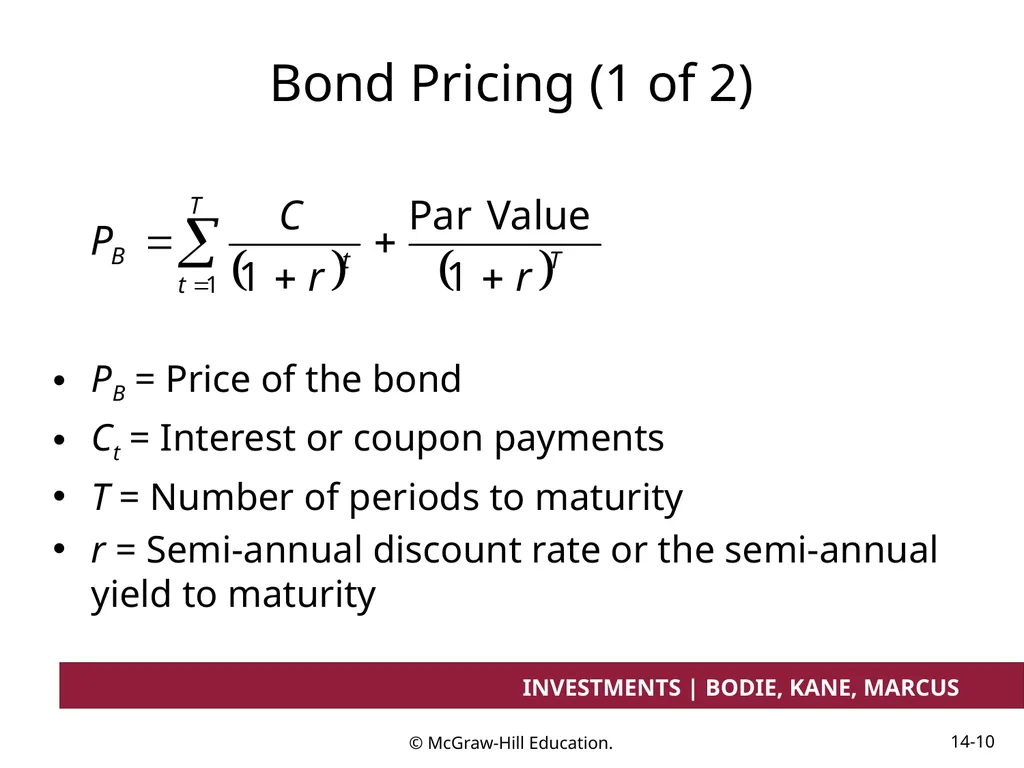
slide10. Bond Pricing (1 of 2) PB = Price of the bond
Ct = Interest or coupon payments
T = Number of periods to maturity
r = Semi-annual discount rate or the semi-annual yield to maturity<br>
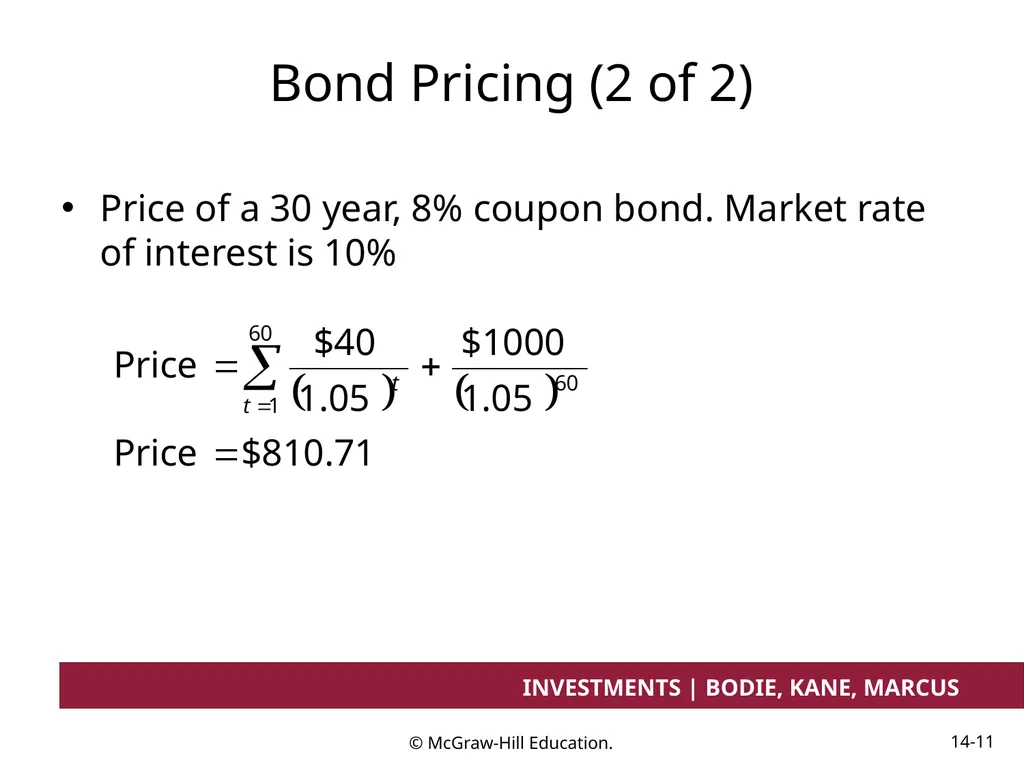
slide11. Bond Pricing (2 of 2) Price of a 30 year, 8% coupon bond. Market rate of interest is 10%<br>
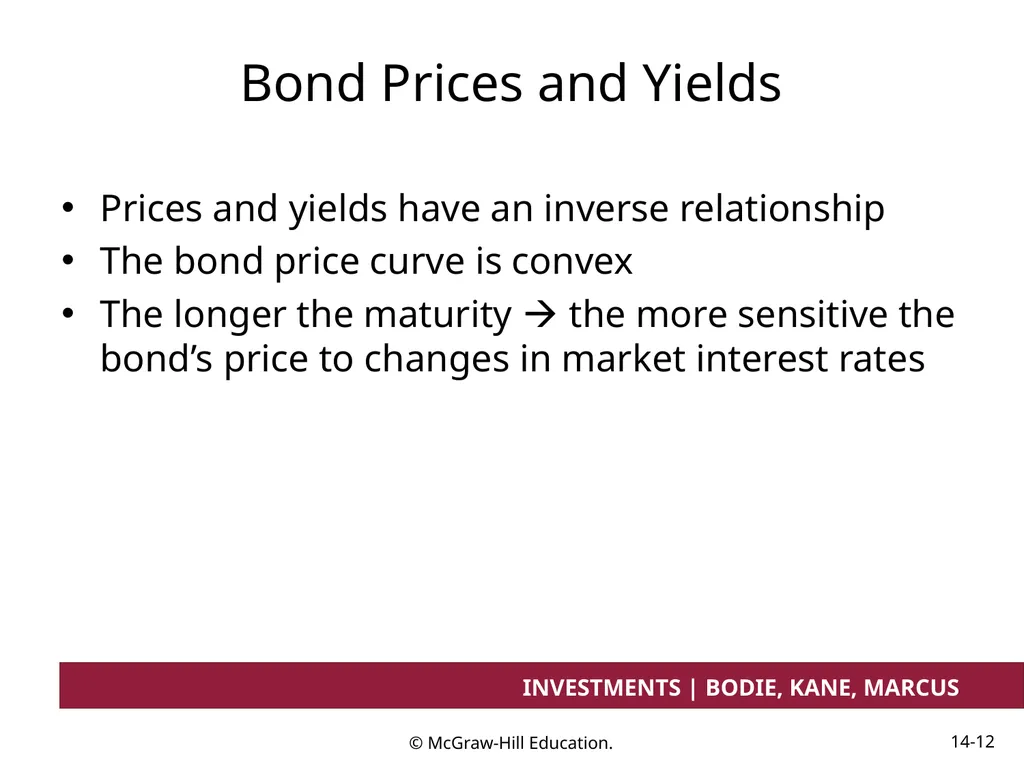
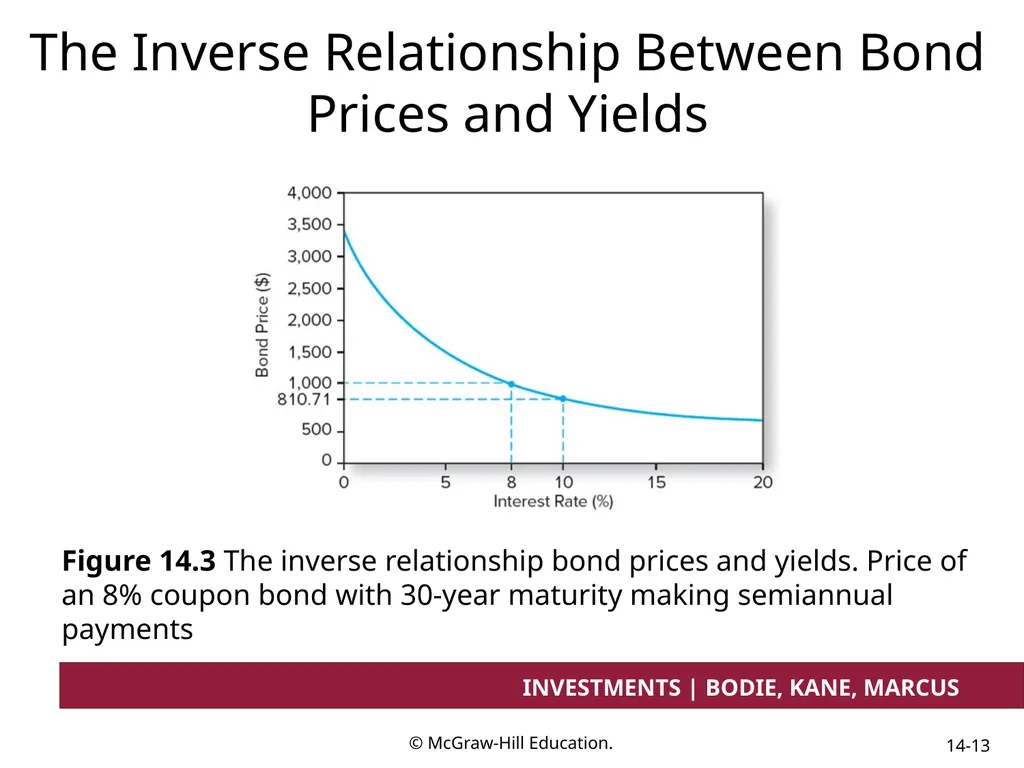
slide12. Bond Prices and Yields Prices and yields have an inverse relationship
The bond price curve is convex
The longer the maturity ïƒ the more sensitive the bond’s price to changes in market interest rates<br>
slide13. The Inverse Relationship Between Bond Prices and Yields Figure 14.3 The inverse relationship bond prices and yields. Price of an 8% coupon bond with 30-year maturity making semiannual payments<br>
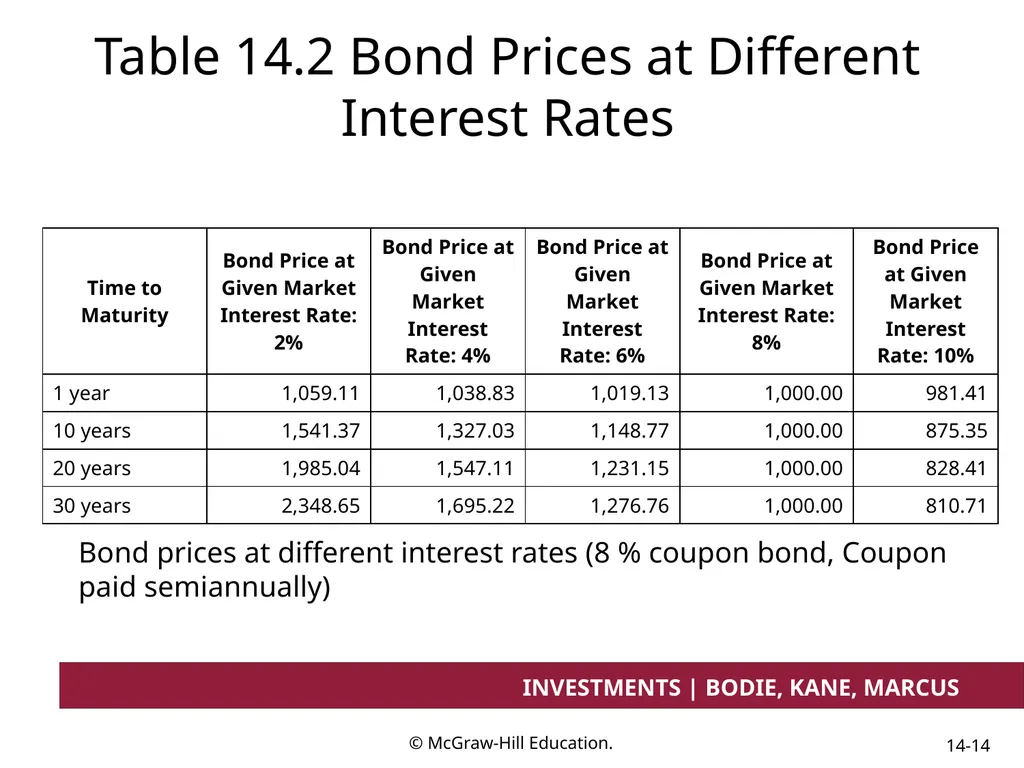
slide14. Table 14.2 Bond Prices at Different Interest Rates Bond prices at different interest rates (8 % coupon bond, Coupon paid semiannually)<br>
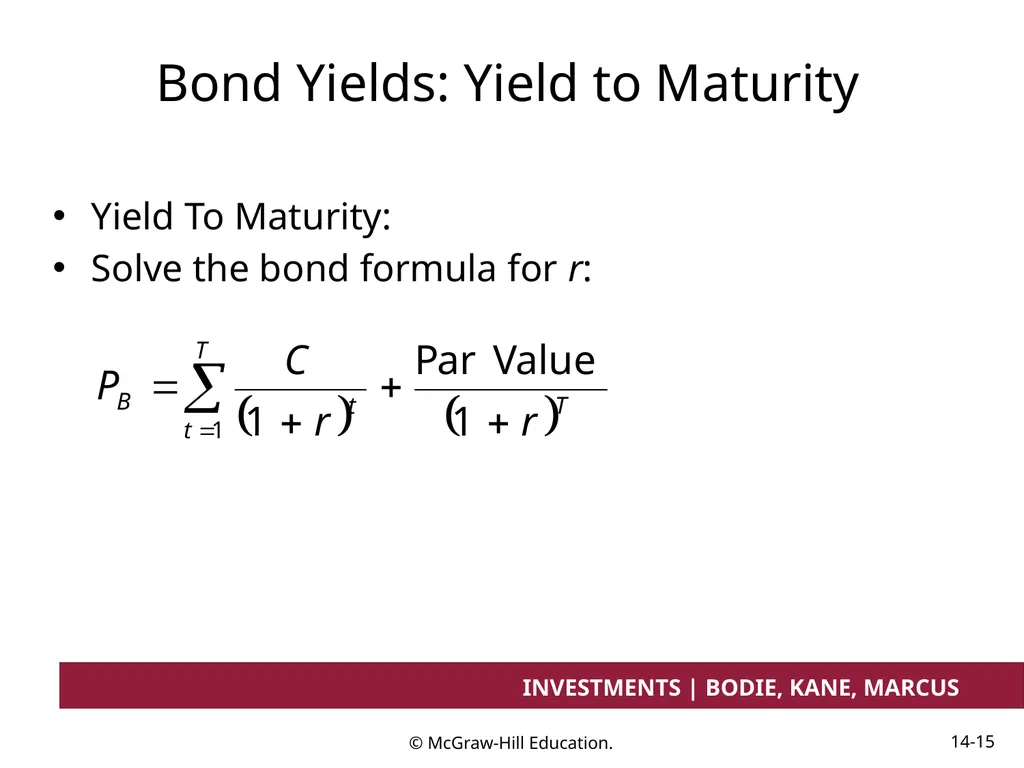
slide15. Bond Yields: Yield to Maturity Yield To Maturity:
Solve the bond formula for r:<br>
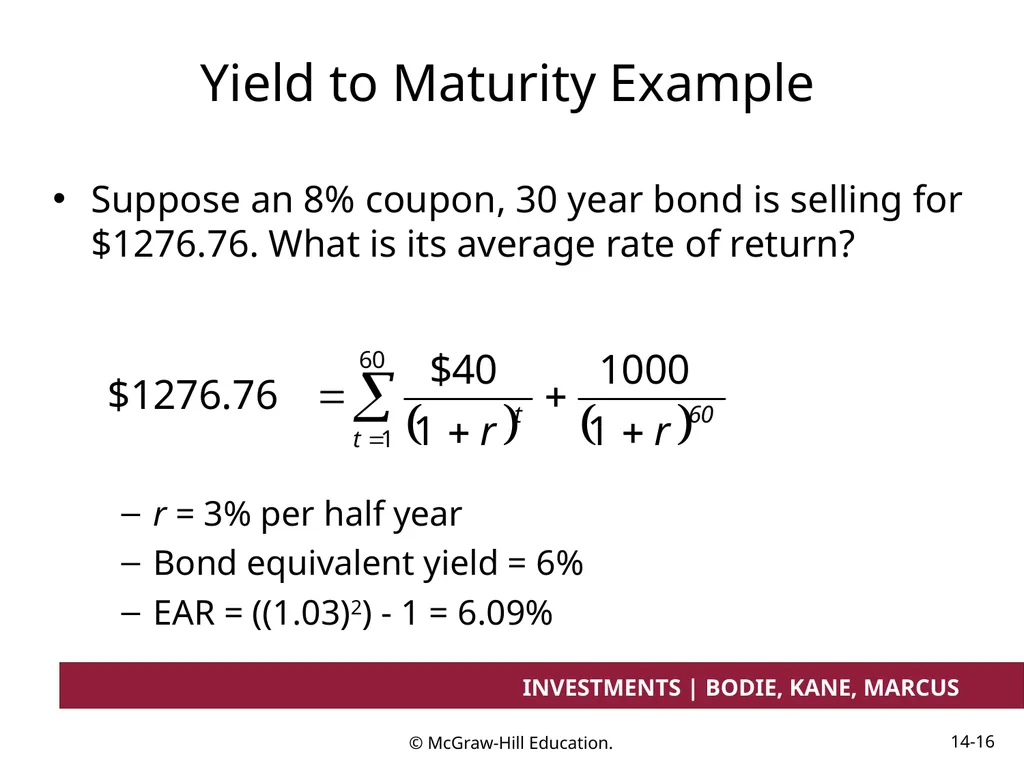
slide16. Yield to Maturity Example Suppose an 8% coupon, 30 year bond is selling for $1276.76. What is its average rate of return? r = 3% per half year
Bond equivalent yield = 6%
EAR = ((1.03)2) - 1 = 6.09%<br>
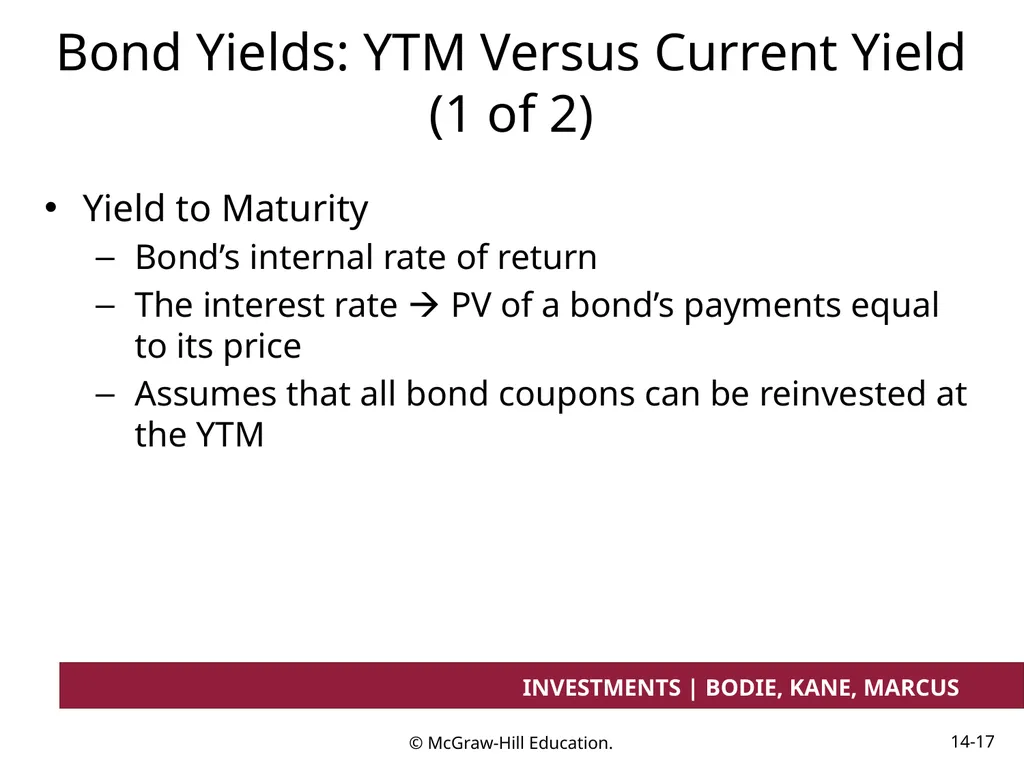
slide17. Bond Yields: YTM Versus Current Yield (1 of 2) Yield to Maturity
Bond’s internal rate of return
The interest rate ïƒ PV of a bond’s payments equal to its price
Assumes that all bond coupons can be reinvested at the YTM<br>
slide18. Bond Yields: YTM Versus Current Yield (2 of 2) Current Yield:
Bond’s annual coupon payment divided by the bond price
Premium Bonds: Coupon rate > Current yield > YTM
Discount Bonds: Coupon rate < Current yield < YTM<br>
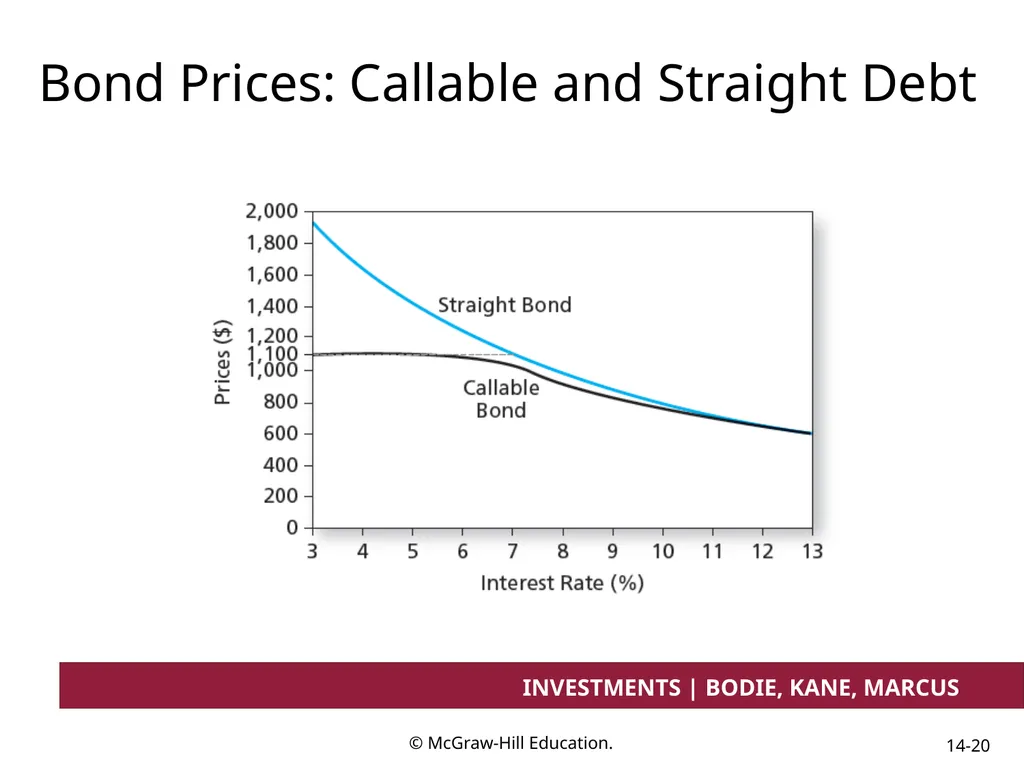
slide19. Bond Yields: Yield to Call Low Interest Rates: The price of the callable bond is flat since the risk of repurchase or call is high
High Interest Rates: The price of the callable bond converges to that of a normal bond since the risk of call is negligible<br>
slide20. Bond Prices: Callable and Straight Debt<br>
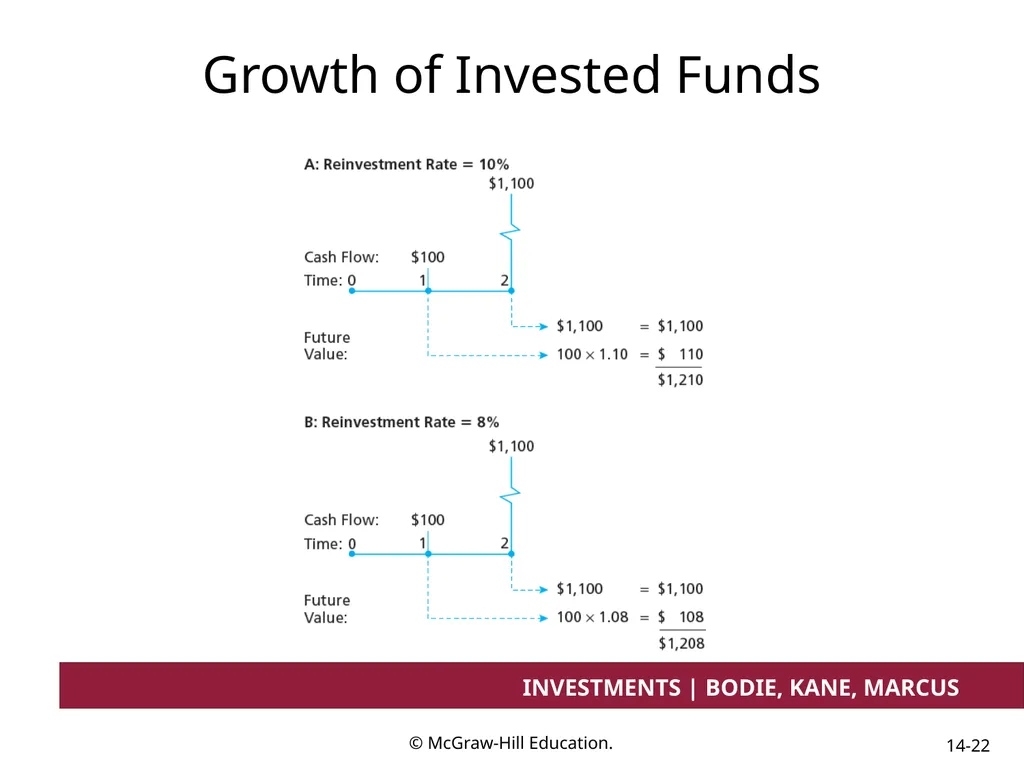
slide21. Bond Yields: Realized Yield versus YTM Reinvestment Assumptions
Holding Period Return
Changes in rates affect returns
Reinvestment of coupon payments
Change in price of the bond<br>
slide22. Growth of Invested Funds<br>
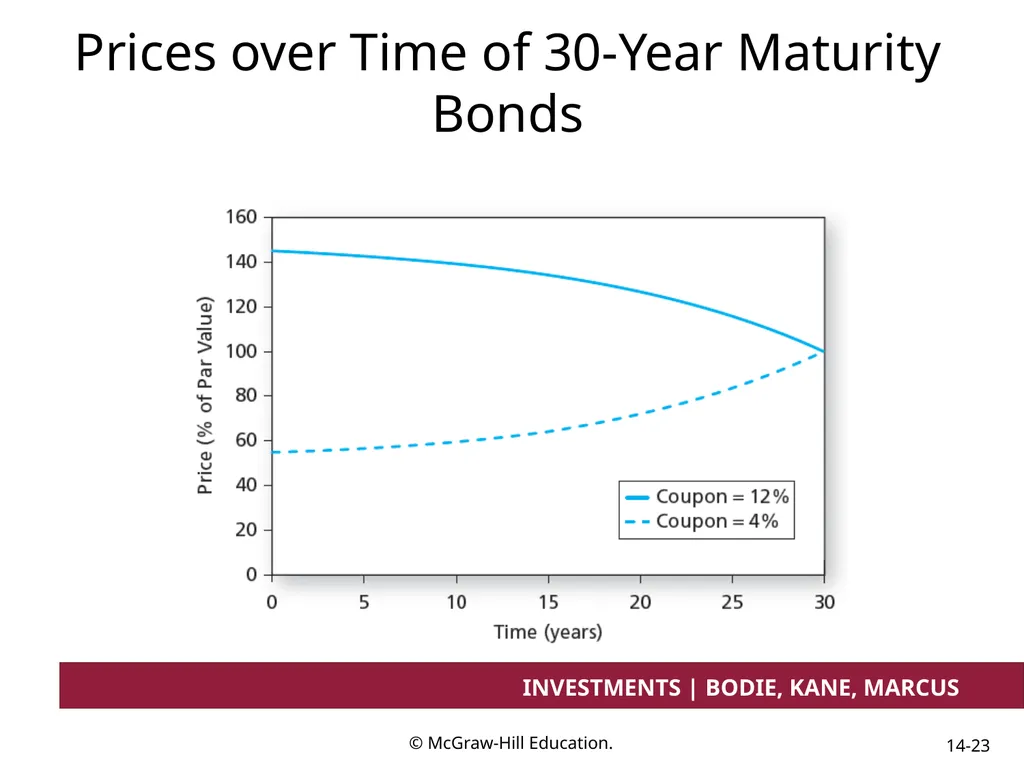
slide23. Prices over Time of 30-Year Maturity Bonds<br>
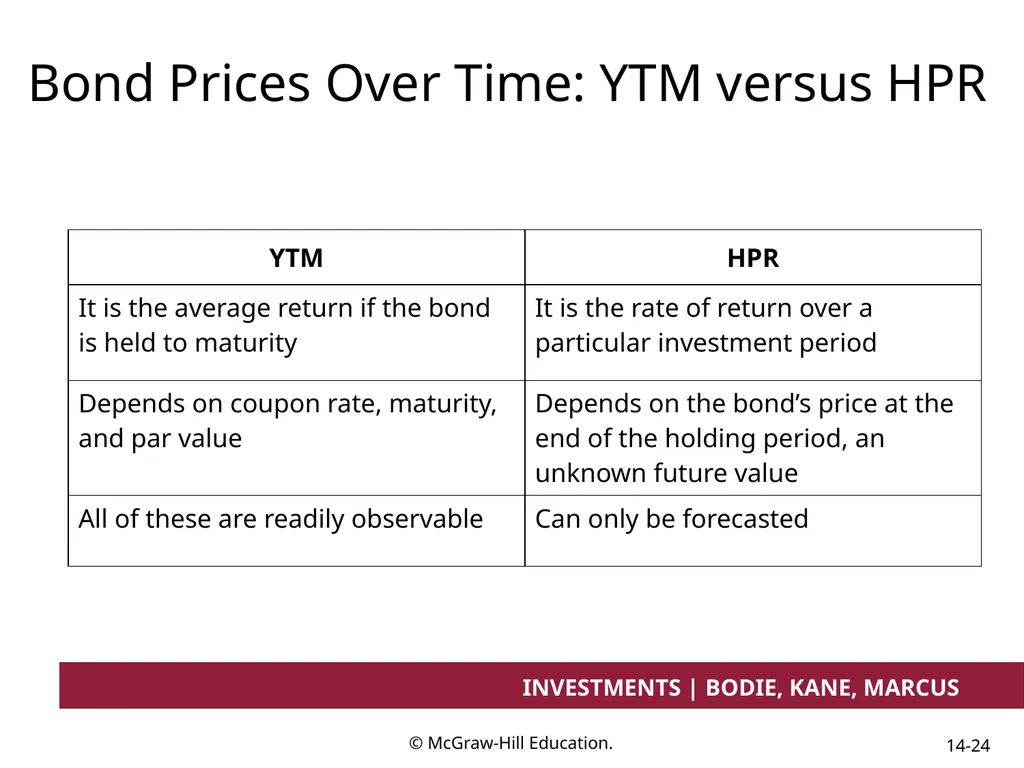
slide24. Bond Prices Over Time: YTM versus HPR<br>
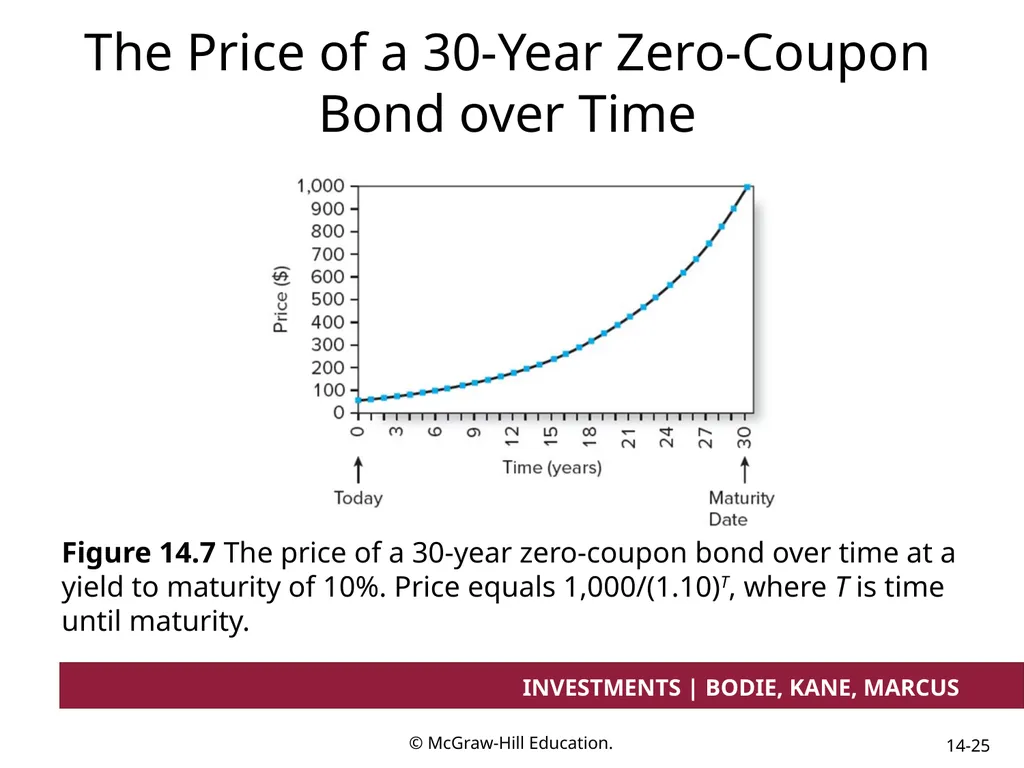
slide25. The Price of a 30-Year Zero-Coupon Bond over Time Figure 14.7 The price of a 30-year zero-coupon bond over time at a yield to maturity of 10%. Price equals 1,000/(1.10)T, where T is time until maturity.<br>
slide26. Default Risk and Bond Pricing (1 of 2) Rating companies
Moody’s Investor Service, Standard & Poor’s, Fitch
Rating Categories
Highest rating is AAA or Aaa
Investment grade bonds: Rated BBB/Baa and above
Speculative grade/junk bonds: Ratings below BBB or Baa<br>
slide27. Default Risk and Bond Pricing (2 of 2) Determinants of bond Safety
Coverage ratios
Leverage ratios, debt-to-equity ratio
Liquidity ratios
Profitability ratios
Cash flow-to-debt ratio<br>
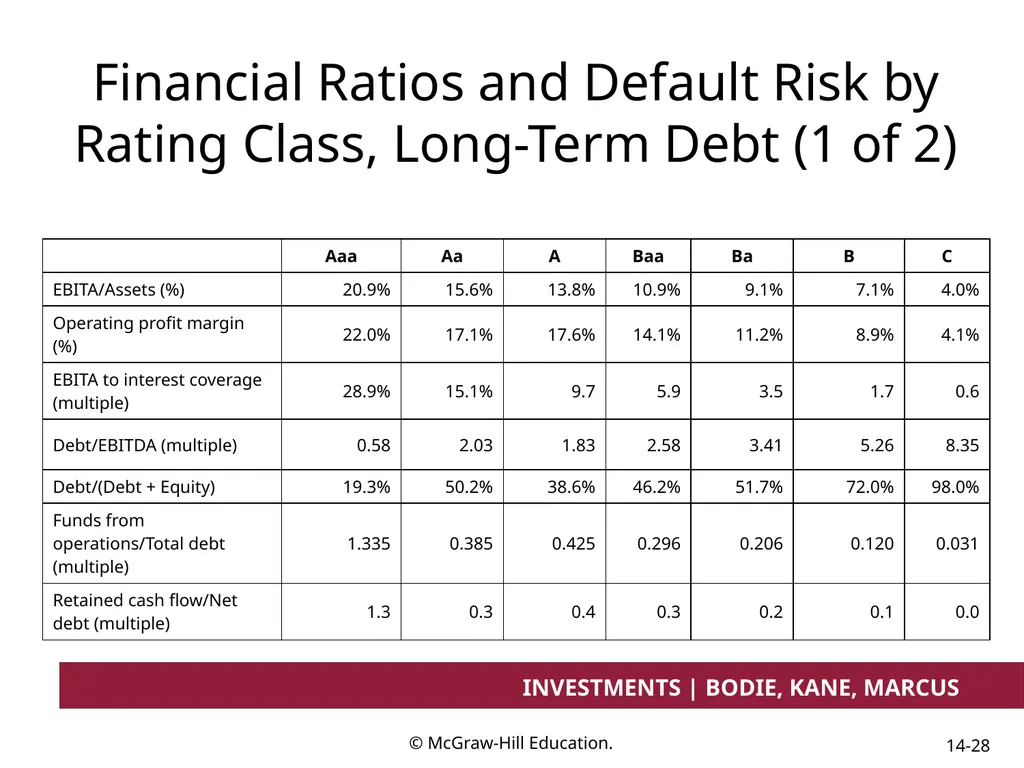
slide28. Financial Ratios and Default Risk by Rating Class, Long-Term Debt (1 of 2)<br>
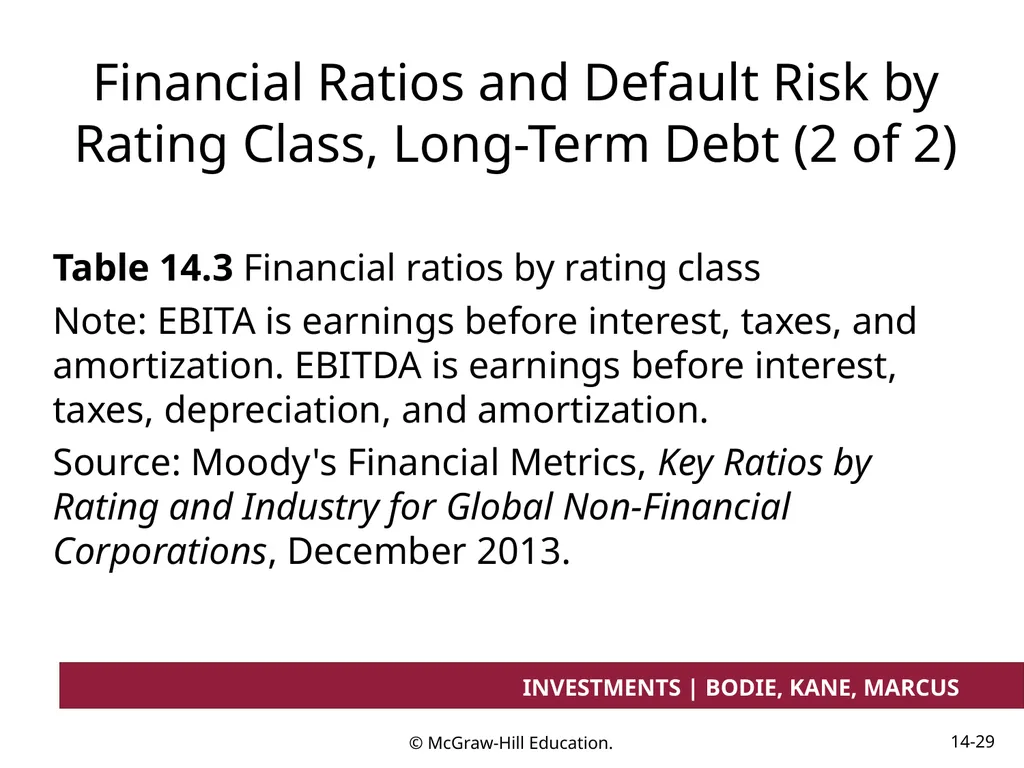
slide29. Financial Ratios and Default Risk by Rating Class, Long-Term Debt (2 of 2) Table 14.3 Financial ratios by rating class
Note: EBITA is earnings before interest, taxes, and amortization. EBITDA is earnings before interest, taxes, depreciation, and amortization.
Source: Moody's Financial Metrics, Key Ratios by Rating and Industry for Global Non-Financial Corporations, December 2013.<br>
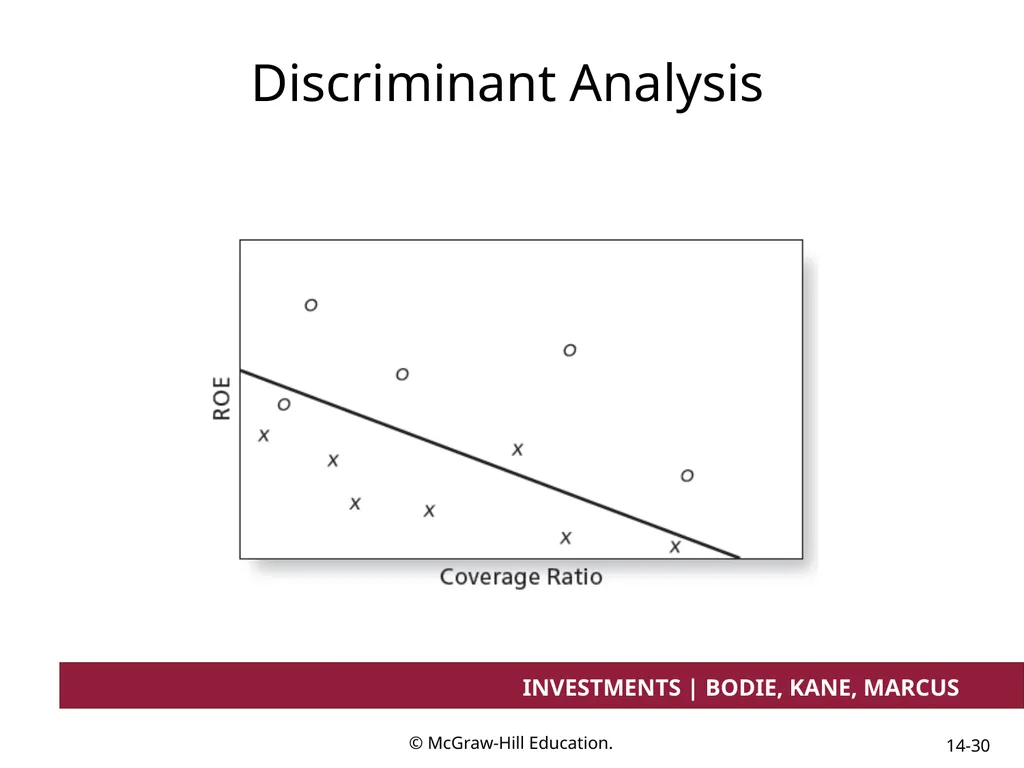
slide30. Discriminant Analysis<br>
slide31. Default Risk and Bond Pricing: Bond Indentures Sinking funds: A way to call bonds early
Subordination of future debt: Restrict additional borrowing
Dividend restrictions: Force firm to retain assets rather than paying them out to shareholders
Collateral: A particular asset bondholders receive if the firm defaults<br>
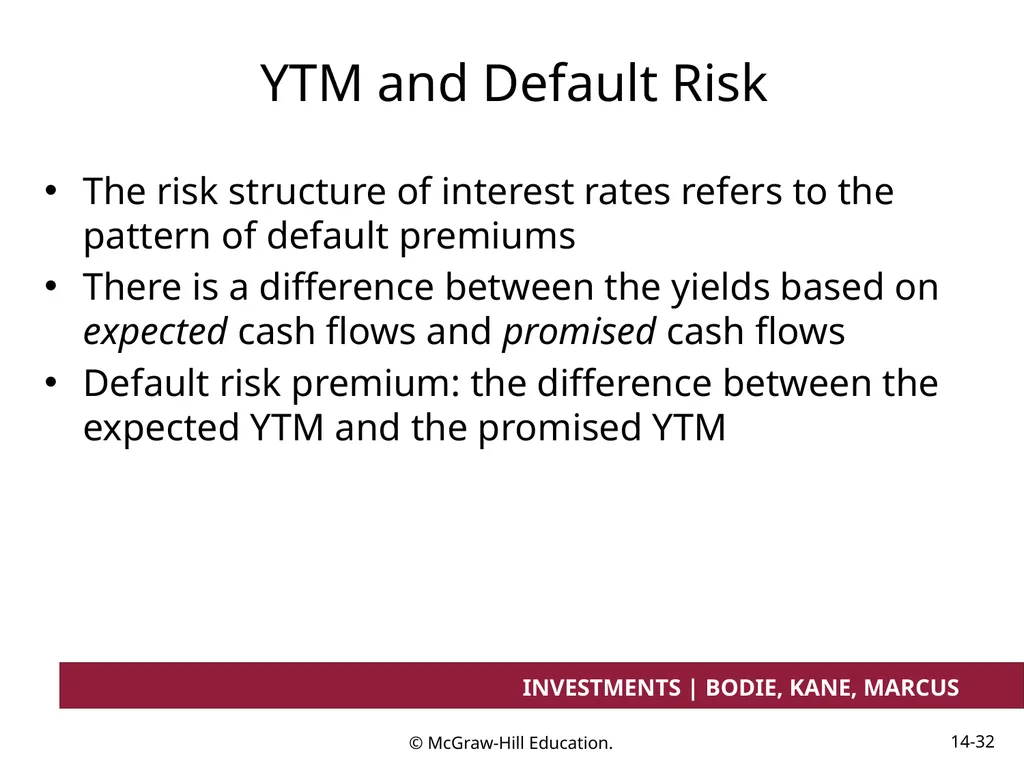
slide32. YTM and Default Risk The risk structure of interest rates refers to the pattern of default premiums
There is a difference between the yields based on expected cash flows and promised cash flows
Default risk premium: the difference between the expected YTM and the promised YTM<br>
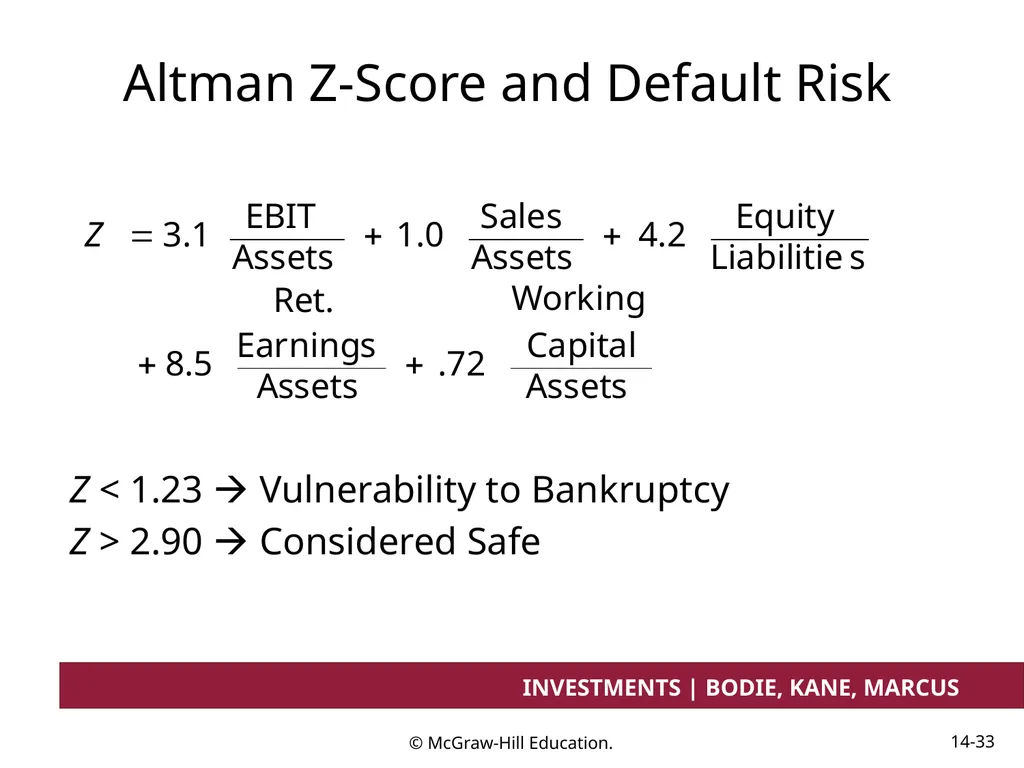
slide33. Altman Z-Score and Default Risk Z < 1.23 ïƒ Vulnerability to Bankruptcy
Z > 2.90 ïƒ Considered Safe<br>
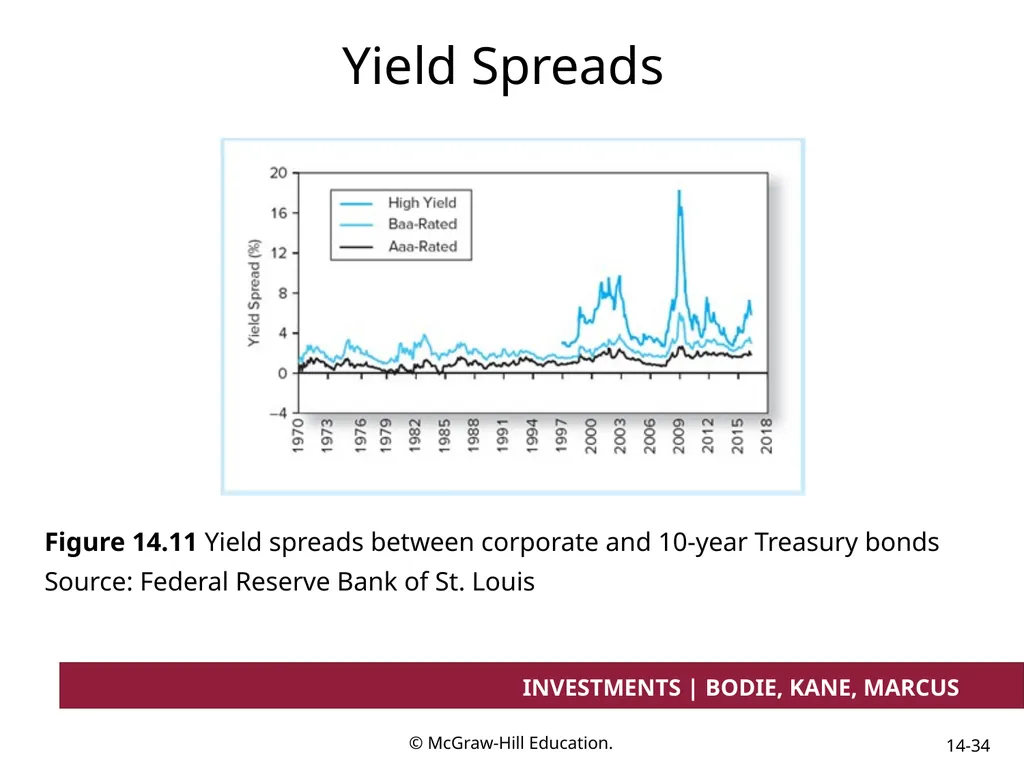
slide34. Yield Spreads Figure 14.11 Yield spreads between corporate and 10-year Treasury bonds
Source: Federal Reserve Bank of St. Louis<br>
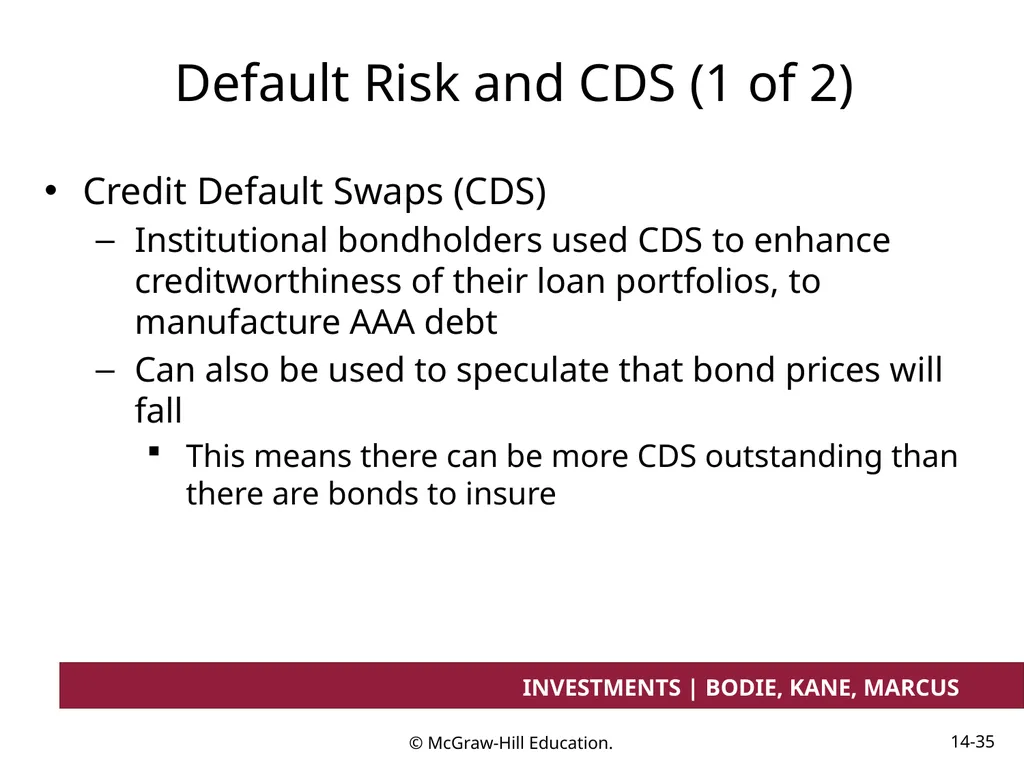
slide35. Default Risk and CDS (1 of 2) Credit Default Swaps (CDS)
Institutional bondholders used CDS to enhance creditworthiness of their loan portfolios, to manufacture AAA debt
Can also be used to speculate that bond prices will fall
This means there can be more CDS outstanding than there are bonds to insure<br>
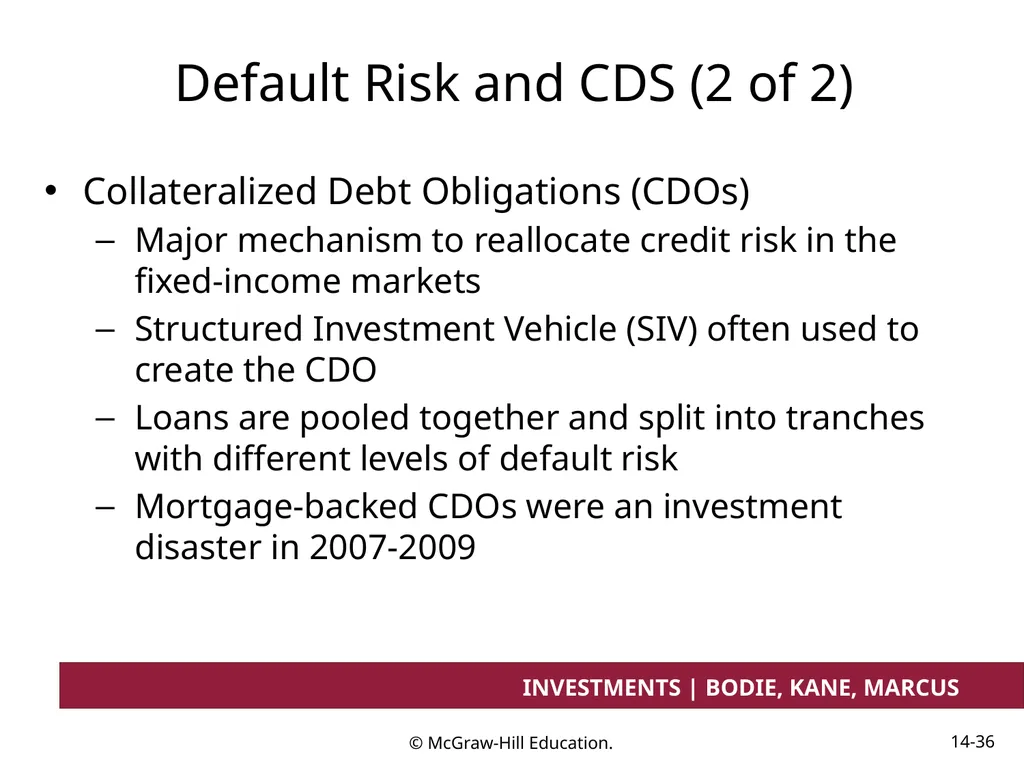
slide36. Default Risk and CDS (2 of 2) Collateralized Debt Obligations (CDOs)
Major mechanism to reallocate credit risk in the fixed-income markets
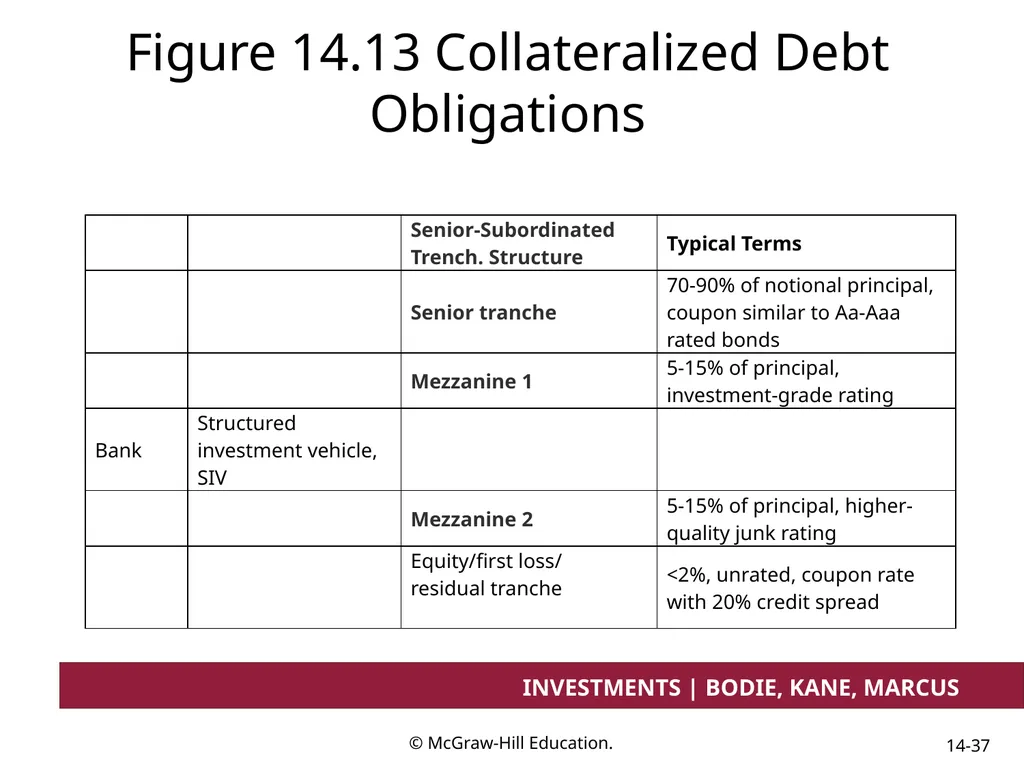
Structured Investment Vehicle (SIV) often used to create the CDO
Loans are pooled together and split into tranches with different levels of default risk
Mortgage-backed CDOs were an investment disaster in 2007-2009<br>
slide37. Figure 14.13 Collateralized Debt Obligations<br>
slide38. End of Presentation<br>
slide2. Overview Debt (Fixed-Income) securities characteristics
Types of bonds
Bond pricing
Prices and yield
Prices over time
Impact of default and credit risk on bond pricing
Credit default swaps
Collateralized debt obligations<br>
slide3. Bond Characteristics Bonds are debt that obligate issuers (borrowers) to bondholders (creditors)
Face value:
Typically $1000
Coupon rate:
Indenture:<br>
slide4. U.S. Treasury Bonds Bonds and notes may be purchased directly from the Treasury
Note maturity: 1-10 years
Bond maturity: 10-30 years
Denomination
As small as $100
$1,000 is more common<br>
slide5. Corporate Bonds Callable bonds:
Convertible bonds:
Puttable Bonds:
Floating-rate bonds:<br>
slide6. Preferred Stock Shares characteristics of fixed income and equity
Like Fixed Income
Payments are typically Fixed
Preferred dividends are paid before common
Like Equity
Dividends are paid in perpetuity
Nonpayment does not mean bankruptcy
No tax break<br>
slide7. International Bonds Foreign Bonds:
Eurodollar:
Euroyen:
Eurosterling:
Eurobonds:
Yankee Bonds:
Samurai Bonds:
Bulldog Bonds:<br>
slide8. Innovation in the Bond Market Inverse Floaters
Asset-Backed Bonds
Catastrophe Bonds
Indexed Bonds
Treasury Inflation Protected Securities (TIPS)<br>
slide9. Principal and Interest Payments for TIPS<br>
slide10. Bond Pricing (1 of 2) PB = Price of the bond
Ct = Interest or coupon payments
T = Number of periods to maturity
r = Semi-annual discount rate or the semi-annual yield to maturity<br>
slide11. Bond Pricing (2 of 2) Price of a 30 year, 8% coupon bond. Market rate of interest is 10%<br>
slide12. Bond Prices and Yields Prices and yields have an inverse relationship
The bond price curve is convex
The longer the maturity ïƒ the more sensitive the bond’s price to changes in market interest rates<br>
slide13. The Inverse Relationship Between Bond Prices and Yields Figure 14.3 The inverse relationship bond prices and yields. Price of an 8% coupon bond with 30-year maturity making semiannual payments<br>
slide14. Table 14.2 Bond Prices at Different Interest Rates Bond prices at different interest rates (8 % coupon bond, Coupon paid semiannually)<br>
slide15. Bond Yields: Yield to Maturity Yield To Maturity:
Solve the bond formula for r:<br>
slide16. Yield to Maturity Example Suppose an 8% coupon, 30 year bond is selling for $1276.76. What is its average rate of return? r = 3% per half year
Bond equivalent yield = 6%
EAR = ((1.03)2) - 1 = 6.09%<br>
slide17. Bond Yields: YTM Versus Current Yield (1 of 2) Yield to Maturity
Bond’s internal rate of return
The interest rate ïƒ PV of a bond’s payments equal to its price
Assumes that all bond coupons can be reinvested at the YTM<br>
slide18. Bond Yields: YTM Versus Current Yield (2 of 2) Current Yield:
Bond’s annual coupon payment divided by the bond price
Premium Bonds: Coupon rate > Current yield > YTM
Discount Bonds: Coupon rate < Current yield < YTM<br>
slide19. Bond Yields: Yield to Call Low Interest Rates: The price of the callable bond is flat since the risk of repurchase or call is high
High Interest Rates: The price of the callable bond converges to that of a normal bond since the risk of call is negligible<br>
slide20. Bond Prices: Callable and Straight Debt<br>
slide21. Bond Yields: Realized Yield versus YTM Reinvestment Assumptions
Holding Period Return
Changes in rates affect returns
Reinvestment of coupon payments
Change in price of the bond<br>
slide22. Growth of Invested Funds<br>
slide23. Prices over Time of 30-Year Maturity Bonds<br>
slide24. Bond Prices Over Time: YTM versus HPR<br>
slide25. The Price of a 30-Year Zero-Coupon Bond over Time Figure 14.7 The price of a 30-year zero-coupon bond over time at a yield to maturity of 10%. Price equals 1,000/(1.10)T, where T is time until maturity.<br>
slide26. Default Risk and Bond Pricing (1 of 2) Rating companies
Moody’s Investor Service, Standard & Poor’s, Fitch
Rating Categories
Highest rating is AAA or Aaa
Investment grade bonds: Rated BBB/Baa and above
Speculative grade/junk bonds: Ratings below BBB or Baa<br>
slide27. Default Risk and Bond Pricing (2 of 2) Determinants of bond Safety
Coverage ratios
Leverage ratios, debt-to-equity ratio
Liquidity ratios
Profitability ratios
Cash flow-to-debt ratio<br>
slide28. Financial Ratios and Default Risk by Rating Class, Long-Term Debt (1 of 2)<br>
slide29. Financial Ratios and Default Risk by Rating Class, Long-Term Debt (2 of 2) Table 14.3 Financial ratios by rating class
Note: EBITA is earnings before interest, taxes, and amortization. EBITDA is earnings before interest, taxes, depreciation, and amortization.
Source: Moody's Financial Metrics, Key Ratios by Rating and Industry for Global Non-Financial Corporations, December 2013.<br>
slide30. Discriminant Analysis<br>
slide31. Default Risk and Bond Pricing: Bond Indentures Sinking funds: A way to call bonds early
Subordination of future debt: Restrict additional borrowing
Dividend restrictions: Force firm to retain assets rather than paying them out to shareholders
Collateral: A particular asset bondholders receive if the firm defaults<br>
slide32. YTM and Default Risk The risk structure of interest rates refers to the pattern of default premiums
There is a difference between the yields based on expected cash flows and promised cash flows
Default risk premium: the difference between the expected YTM and the promised YTM<br>
slide33. Altman Z-Score and Default Risk Z < 1.23 ïƒ Vulnerability to Bankruptcy
Z > 2.90 ïƒ Considered Safe<br>
slide34. Yield Spreads Figure 14.11 Yield spreads between corporate and 10-year Treasury bonds
Source: Federal Reserve Bank of St. Louis<br>
slide35. Default Risk and CDS (1 of 2) Credit Default Swaps (CDS)
Institutional bondholders used CDS to enhance creditworthiness of their loan portfolios, to manufacture AAA debt
Can also be used to speculate that bond prices will fall
This means there can be more CDS outstanding than there are bonds to insure<br>
slide36. Default Risk and CDS (2 of 2) Collateralized Debt Obligations (CDOs)
Major mechanism to reallocate credit risk in the fixed-income markets
Structured Investment Vehicle (SIV) often used to create the CDO
Loans are pooled together and split into tranches with different levels of default risk
Mortgage-backed CDOs were an investment disaster in 2007-2009<br>
slide37. Figure 14.13 Collateralized Debt Obligations<br>
slide38. End of Presentation<br>