
Chapter 16: Financial Statement Analysis Chapter
Description: Chapter 16: Financial Statement Analysis Chapter 16 Credit Risk Management Analysis Financial Statements Overview There are three primary financial statements: income statements, balance sheets, and cash flow statements. Public traded
Related Topics
Download Presentation
"Chapter 16: Financial Statement Analysis Chapter" is the property of its rightful owner. Permission is granted to download and print the materials on this website for personal, non-commercial use only, and to display it on your personal computer provided you do not modify the materials and that you retain all copyright notices contained in the materials. By downloading content from our website, you accept the terms of this agreement.
Presentation Transcript
slide1. Chapter 16: Financial Statement Analysis Chapter 16
“Credit Risk Management & Analysis”<br>
slide2. Financial Statements Overview There are three primary financial statements: income statements, balance sheets, and cash flow statements.
Public traded companies are required to include audited financial statements in their annual and quarterly reports.
The Securities Exchange Commission (SEC) requires the public traded companies to file one 10K and three 10Q reports per year representing their annual and quarterly performance, respectively.
These detailed statements can be found on the company’s filings in the SEC’s EDGAR system.
They are also usually available on the company’s website under “Investor Relations” and other financial websites such as www.finance.yahoo.com and www.google.com/finance.
In addition to the statements, the company discusses its performance found in the “Management, Discussion, and Analysis” (MD&A) section as well as provides detailed footnotes to each of the statements<br>
slide3. Understanding Financial Statements To evaluate publicly traded companies, analysts who represent different investors need uniform financial standards that are consistent, accurate, and complete.
Public accounting organizations around the world have set up global accounting standards.
The biggest organization, the International Financial Reporting Standards (IFRS), is gradually replacing country-specific standards.
Developed by the Financial Accounting Standard Board (FASB), the United States still recognizes generally accepted accounting principles (GAAP) regulated by the SEC.
However, the United States is gradually unifying to the IFRS standards.<br>
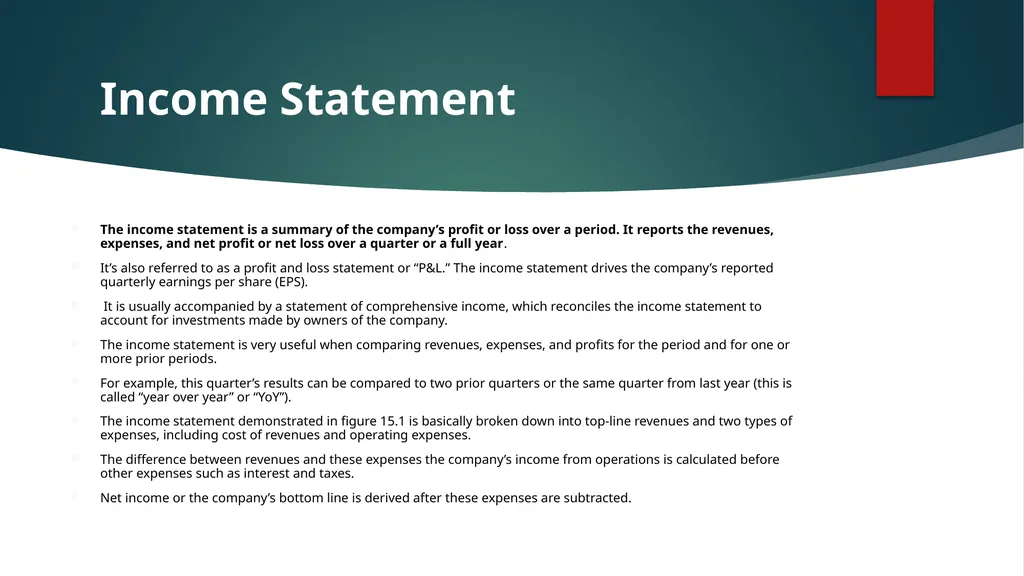
slide4. Income Statement The income statement is a summary of the company’s profit or loss over a period. It reports the revenues, expenses, and net profit or net loss over a quarter or a full year.
It’s also referred to as a profit and loss statement or “P&L.” The income statement drives the company’s reported quarterly earnings per share (EPS).
It is usually accompanied by a statement of comprehensive income, which reconciles the income statement to account for investments made by owners of the company.
The income statement is very useful when comparing revenues, expenses, and profits for the period and for one or more prior periods.
For example, this quarter’s results can be compared to two prior quarters or the same quarter from last year (this is called “year over year” or “YoY”).
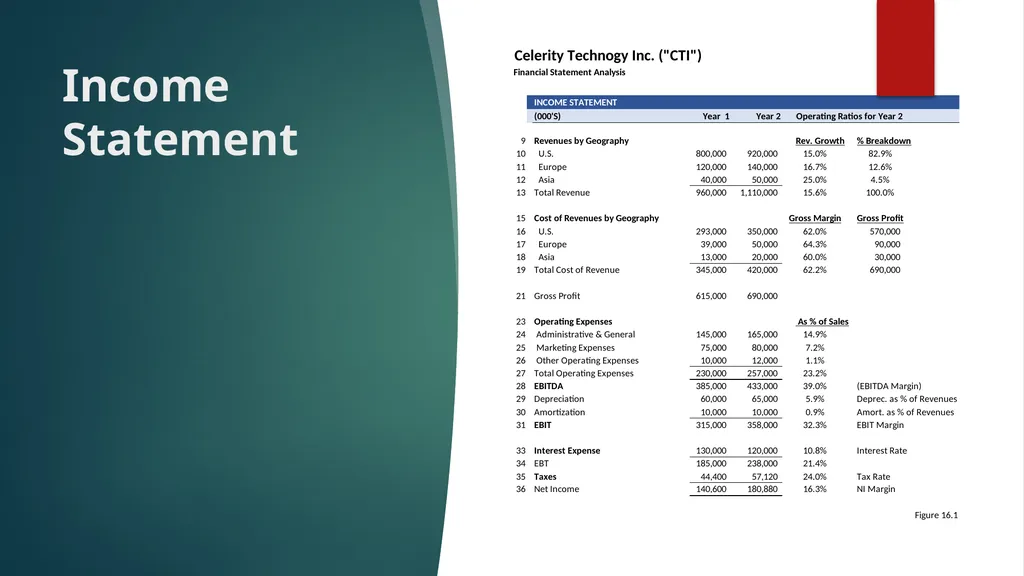
The income statement demonstrated in figure 15.1 is basically broken down into top-line revenues and two types of expenses, including cost of revenues and operating expenses.
The difference between revenues and these expenses the company’s income from operations is calculated before other expenses such as interest and taxes.
Net income or the company’s bottom line is derived after these expenses are subtracted.<br>
slide5. Income Statement<br>
slide6. Income Statement Revenues
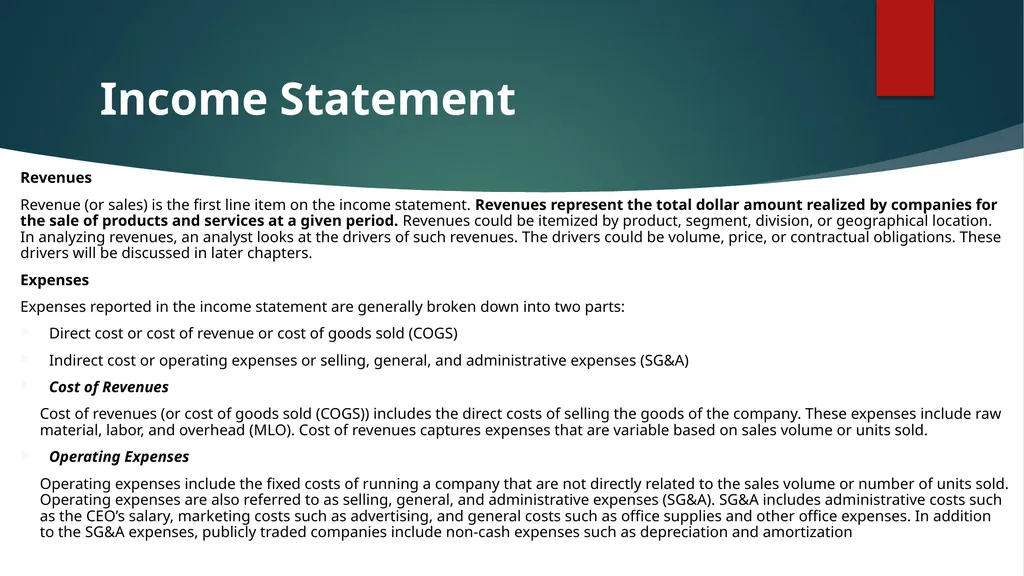
Revenue (or sales) is the first line item on the income statement. Revenues represent the total dollar amount realized by companies for the sale of products and services at a given period. Revenues could be itemized by product, segment, division, or geographical location. In analyzing revenues, an analyst looks at the drivers of such revenues. The drivers could be volume, price, or contractual obligations. These drivers will be discussed in later chapters.
Expenses
Expenses reported in the income statement are generally broken down into two parts:
Direct cost or cost of revenue or cost of goods sold (COGS)
Indirect cost or operating expenses or selling, general, and administrative expenses (SG&A)
Cost of Revenues
Cost of revenues (or cost of goods sold (COGS)) includes the direct costs of selling the goods of the company. These expenses include raw material, labor, and overhead (MLO). Cost of revenues captures expenses that are variable based on sales volume or units sold.
Operating Expenses
Operating expenses include the fixed costs of running a company that are not directly related to the sales volume or number of units sold. Operating expenses are also referred to as selling, general, and administrative expenses (SG&A). SG&A includes administrative costs such as the CEO’s salary, marketing costs such as advertising, and general costs such as office supplies and other office expenses. In addition to the SG&A expenses, publicly traded companies include non-cash expenses such as depreciation and amortization<br>
slide7. Income Statement Operating Income or EBIT
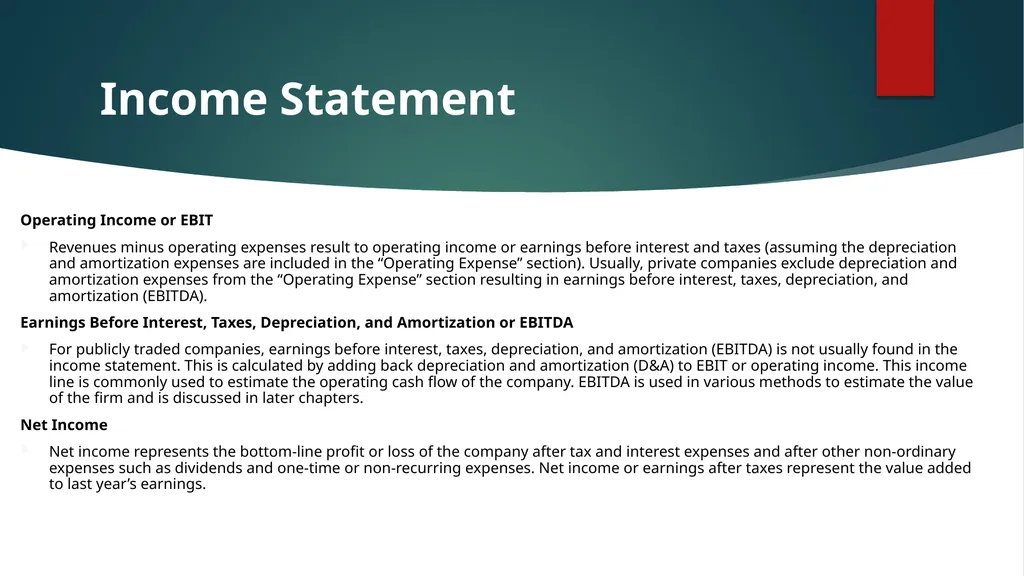
Revenues minus operating expenses result to operating income or earnings before interest and taxes (assuming the depreciation and amortization expenses are included in the “Operating Expense” section). Usually, private companies exclude depreciation and amortization expenses from the “Operating Expense” section resulting in earnings before interest, taxes, depreciation, and amortization (EBITDA).
Earnings Before Interest, Taxes, Depreciation, and Amortization or EBITDA
For publicly traded companies, earnings before interest, taxes, depreciation, and amortization (EBITDA) is not usually found in the income statement. This is calculated by adding back depreciation and amortization (D&A) to EBIT or operating income. This income line is commonly used to estimate the operating cash flow of the company. EBITDA is used in various methods to estimate the value of the firm and is discussed in later chapters.
Net Income
Net income represents the bottom-line profit or loss of the company after tax and interest expenses and after other non-ordinary expenses such as dividends and one-time or non-recurring expenses. Net income or earnings after taxes represent the value added to last year’s earnings.<br>
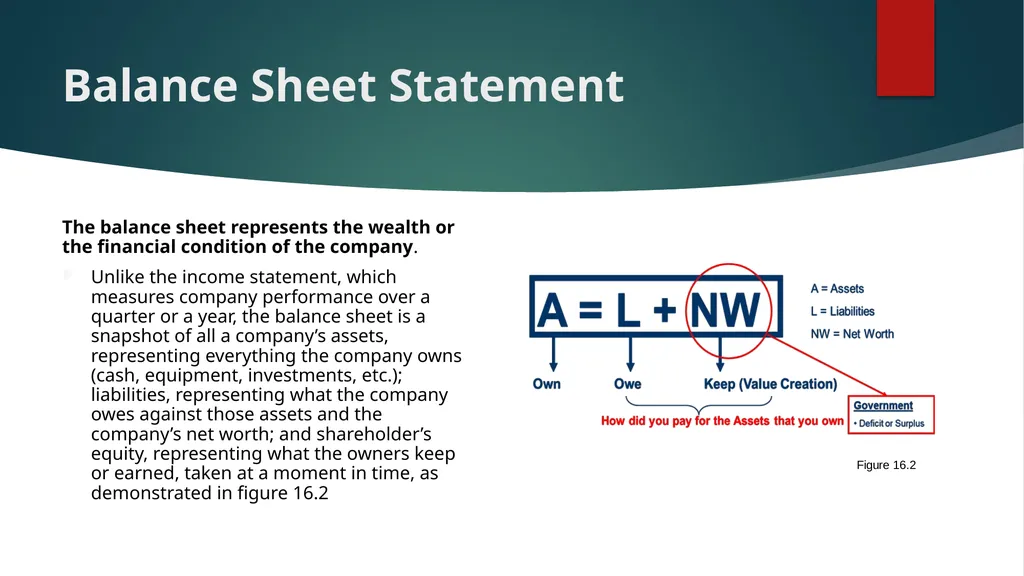
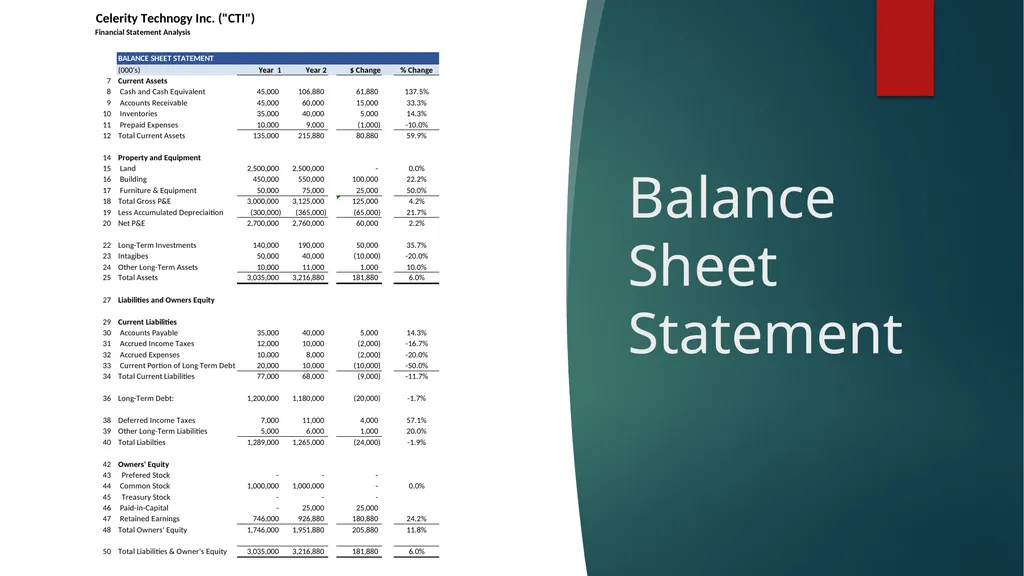
slide8. Balance Sheet Statement The balance sheet represents the wealth or the financial condition of the company.
Unlike the income statement, which measures company performance over a quarter or a year, the balance sheet is a snapshot of all a company’s assets, representing everything the company owns (cash, equipment, investments, etc.); liabilities, representing what the company owes against those assets and the company’s net worth; and shareholder’s equity, representing what the owners keep or earned, taken at a moment in time, as demonstrated in figure 16.2<br>
slide9. Balance Sheet Statement Assets
This section of the balance sheet gives a list of the assets of the company. The statement is formatted to start from the most liquid assets to the least liquid. The first section is current assets, representing assets that should turn to cash within the next 12 months. These are followed by non-current assets that includes tangible and intangible assets such as goodwill.
Current Assets
Current assets include cash and cash equivalents, accounts receivable, inventory and other current assets.
Cash and cash equivalents: Cash and cash equivalents represent the deposit account and/or short-term investments of the company. This cash is accessible within a day or two.
Accounts receivable: Accounts receivable represent the money owed to the company by the customer and are considered the second-most liquid item on the balance sheet as the customers typically have 30–60 days to pay the company for goods they bought.
Inventory: Inventory represents the cost of raw materials, work in process (WIP), and finished goods that are ready to be shipped. Inventory will usually turn into cash in 30–120 days, depending of the type of the inventory the company buys, develops, and sells.
Other current assets: Other current assets include money owed to the company for reasons other than customers. It also includes prepaid expenses, which are expenses that are prepaid upfront such as insurance fees and annual license fees.<br>
slide10. Balance Sheet Statement Non-Current Assets
Non-current assets include both tangible and non-tangible assets. Tangible assets include property, plant, and equipment; long-term investments; and other long-term assets. Intangible assets include goodwill and other intangible assets such as patterns and trademarks.
Gross property, plant, and equipment (PP&E): PP&E represent tangible assets such as buildings, land, equipment, cars, and trucks at their book value. The balance sheet ignores any appreciation in asset value. Sometimes the company reports the net PP&E, which represents the value of these assets after all depreciation is subtracted from the gross amount.
Long-term investments: These could be investments such as joint ventures or other long-term investments.
Goodwill: Goodwill is created when the company is acquired for a price greater than book value. The difference between the acquisition price and book value is recorded as goodwill.<br>
slide11. Balance Sheet Statement Liabilities
This section of the balance sheet gives a list of the liabilities of the company. The statement is formatted to start from the most liquid to the least liquid. The first section is current liabilities, representing the obligations that the company should pay within the next 12 months. These are followed by long-term liabilities, which are obligations that extend further that a year into the future.
Current Liabilities
Current liabilities include outstanding payments to suppliers, short-term debts and obligations due within one year such as accounts payable, short-term interest and tax payables, current portions of long-term debt, and other accrued expenses.
Accounts payable: These are payment obligations due by the company to suppliers, primarily for purchasing inventory or raw material.
Income tax accruals: These are short-term income-related taxes that are payable within a year.
Accrued expenses: These are expenses that needed to be paid within a year. These accrued expenses do not include any obligations owed to suppliers.
Current portion of long-term debt: This is the company’s debt obligations that are due within a year.<br>
slide12. Balance Sheet Statement Long-Term Liabilities
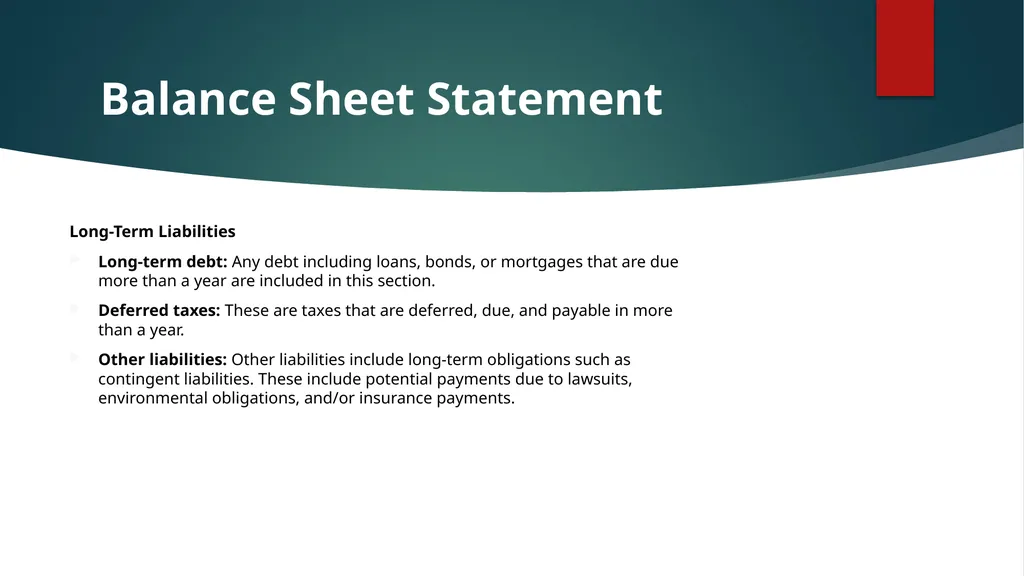
Long-term debt: Any debt including loans, bonds, or mortgages that are due more than a year are included in this section.
Deferred taxes: These are taxes that are deferred, due, and payable in more than a year.
Other liabilities: Other liabilities include long-term obligations such as contingent liabilities. These include potential payments due to lawsuits, environmental obligations, and/or insurance payments.<br>
slide13. Balance Sheet Statement Net Worth or Shareholder’s Equity
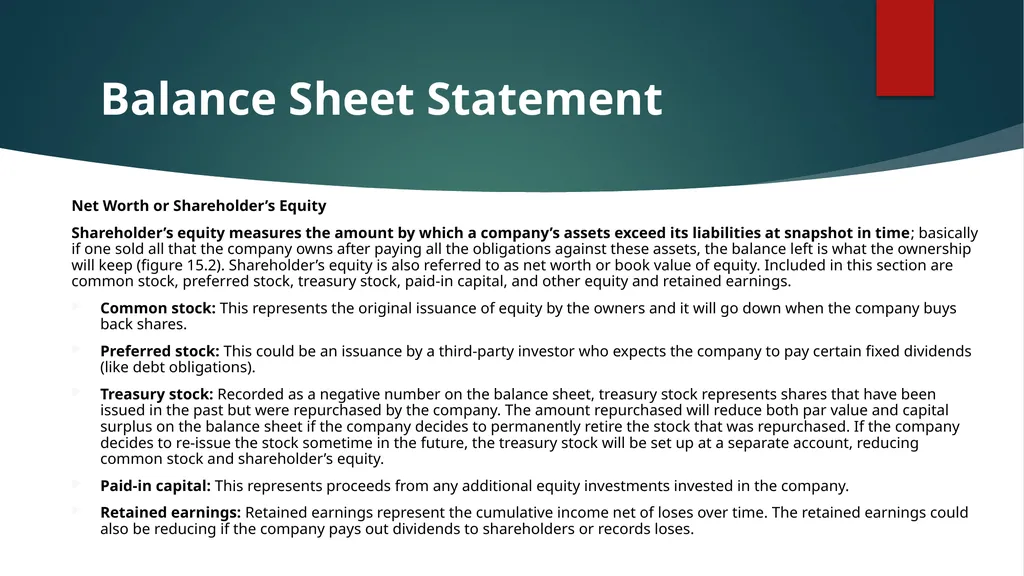
Shareholder’s equity measures the amount by which a company’s assets exceed its liabilities at snapshot in time; basically if one sold all that the company owns after paying all the obligations against these assets, the balance left is what the ownership will keep (figure 15.2). Shareholder’s equity is also referred to as net worth or book value of equity. Included in this section are common stock, preferred stock, treasury stock, paid-in capital, and other equity and retained earnings.
Common stock: This represents the original issuance of equity by the owners and it will go down when the company buys back shares.
Preferred stock: This could be an issuance by a third-party investor who expects the company to pay certain fixed dividends (like debt obligations).
Treasury stock: Recorded as a negative number on the balance sheet, treasury stock represents shares that have been issued in the past but were repurchased by the company. The amount repurchased will reduce both par value and capital surplus on the balance sheet if the company decides to permanently retire the stock that was repurchased. If the company decides to re-issue the stock sometime in the future, the treasury stock will be set up at a separate account, reducing common stock and shareholder’s equity.
Paid-in capital: This represents proceeds from any additional equity investments invested in the company.
Retained earnings: Retained earnings represent the cumulative income net of loses over time. The retained earnings could also be reducing if the company pays out dividends to shareholders or records loses.<br>
slide14. Balance Sheet Statement<br>
slide15. Cash Flow Statement Net Worth or Shareholder’s Equity
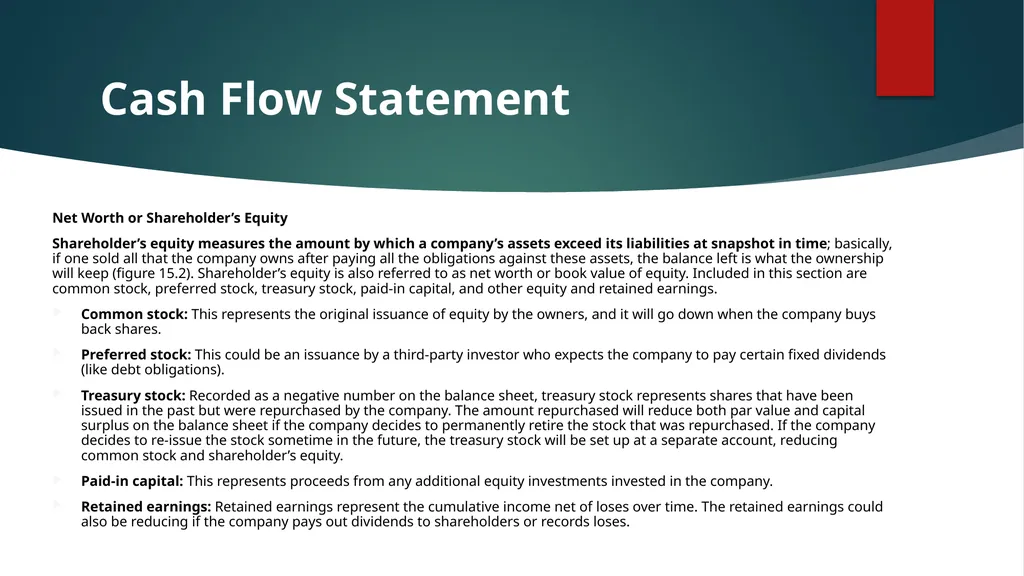
Shareholder’s equity measures the amount by which a company’s assets exceed its liabilities at snapshot in time; basically, if one sold all that the company owns after paying all the obligations against these assets, the balance left is what the ownership will keep (figure 15.2). Shareholder’s equity is also referred to as net worth or book value of equity. Included in this section are common stock, preferred stock, treasury stock, paid-in capital, and other equity and retained earnings.
Common stock: This represents the original issuance of equity by the owners, and it will go down when the company buys back shares.
Preferred stock: This could be an issuance by a third-party investor who expects the company to pay certain fixed dividends (like debt obligations).
Treasury stock: Recorded as a negative number on the balance sheet, treasury stock represents shares that have been issued in the past but were repurchased by the company. The amount repurchased will reduce both par value and capital surplus on the balance sheet if the company decides to permanently retire the stock that was repurchased. If the company decides to re-issue the stock sometime in the future, the treasury stock will be set up at a separate account, reducing common stock and shareholder’s equity.
Paid-in capital: This represents proceeds from any additional equity investments invested in the company.
Retained earnings: Retained earnings represent the cumulative income net of loses over time. The retained earnings could also be reducing if the company pays out dividends to shareholders or records loses.<br>
slide16. Cash Flow Statement The cash flow statement represents the cash inflow and outflow of the company.
The cash statement is like the income statement when it comes to measuring performance over a period of time.
However, it focuses on the actual cash generated or spent by the business.
In a perfect world you might not need both the income and cash flow statements.
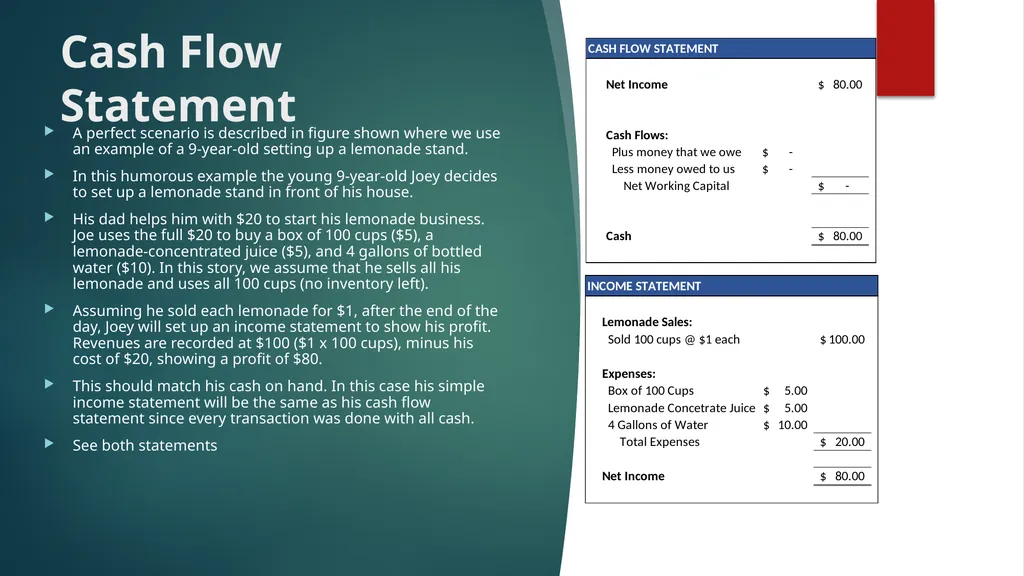
A perfect scenario is described in figure 15.4 where we use an example of a 9-year-old setting up a lemonade stand. In this humorous example the young 9-year-old Joey decides to set up a lemonade stand in front of his house. His dad helps him with $20 to start his lemonade business. Joe uses the full $20 to buy a box of 100 cups ($5), a lemonade-concentrated juice ($5), and 4 gallons of bottled water ($10). In this story, we assume that he sells all his lemonade and uses all 100 cups (no inventory left). Assuming he sold each lemonade for $1, after the end of the day, Joey will set up an income statement to show his profit. Revenues are recorded at $100 ($1 x 100 cups), minus his cost of $20, showing a profit of $80. This should match his cash on hand. In this case his simple income statement will be the same as his cash flow statement since every transaction was done with all cash. See both statements (figure 16.4).<br>
slide17. Cash Flow Statement A perfect scenario is described in figure shown where we use an example of a 9-year-old setting up a lemonade stand.
In this humorous example the young 9-year-old Joey decides to set up a lemonade stand in front of his house.
His dad helps him with $20 to start his lemonade business. Joe uses the full $20 to buy a box of 100 cups ($5), a lemonade-concentrated juice ($5), and 4 gallons of bottled water ($10). In this story, we assume that he sells all his lemonade and uses all 100 cups (no inventory left).
Assuming he sold each lemonade for $1, after the end of the day, Joey will set up an income statement to show his profit. Revenues are recorded at $100 ($1 x 100 cups), minus his cost of $20, showing a profit of $80.
This should match his cash on hand. In this case his simple income statement will be the same as his cash flow statement since every transaction was done with all cash.
See both statements<br>
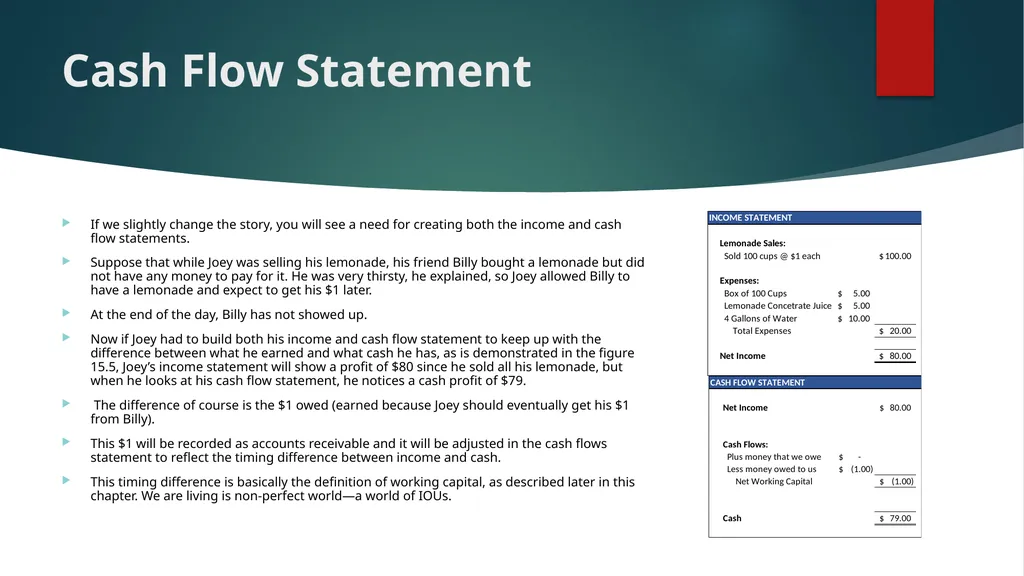
slide18. Cash Flow Statement If we slightly change the story, you will see a need for creating both the income and cash flow statements.
Suppose that while Joey was selling his lemonade, his friend Billy bought a lemonade but did not have any money to pay for it. He was very thirsty, he explained, so Joey allowed Billy to have a lemonade and expect to get his $1 later.
At the end of the day, Billy has not showed up.
Now if Joey had to build both his income and cash flow statement to keep up with the difference between what he earned and what cash he has, as is demonstrated in the figure 15.5, Joey’s income statement will show a profit of $80 since he sold all his lemonade, but when he looks at his cash flow statement, he notices a cash profit of $79.
The difference of course is the $1 owed (earned because Joey should eventually get his $1 from Billy).
This $1 will be recorded as accounts receivable and it will be adjusted in the cash flows statement to reflect the timing difference between income and cash.
This timing difference is basically the definition of working capital, as described later in this chapter. We are living is non-perfect world—a world of IOUs.<br>
slide19. Cash Flow Statement The cash flow statement also reflects the fact that the company receives and spends cash other than its primary business (these transactions are not recorded in the income statement which represents the company’s direct or primary operations). For example, a company may spend money on new equipment, conduct improvements of manufacturing facilities, or decide to issue bonds in the capital markets.
The company’s cash position per period (going up or down) does not necessarily represent the company’s operating health. For example, the company might decide to use extra cash to repay debt. This decision will result in a lower cash outflow, even though it may be positive over time, reducing interest obligations.
The cash flow statement, which represents the change in position from one period to the next, has three primary sections:
Cash Flow from Operating Activities
Cash Flow from Investment Activities
Cash Flow from Financing Activities
It is important to realize that one could build an entire cash flow statement by looking at 2 years of balance sheets. The difference of each item on the balance sheet from one year to the next represents the activity for that year and can been seen on the cash flow statement.<br>
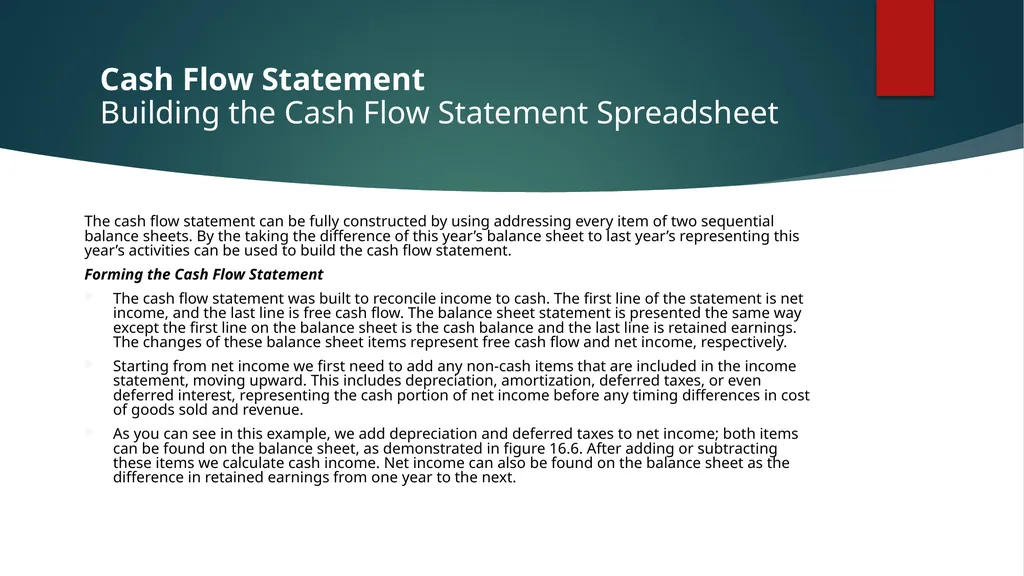
slide20. Cash Flow Statement Building the Cash Flow Statement Spreadsheet The cash flow statement can be fully constructed by using addressing every item of two sequential balance sheets. By the taking the difference of this year’s balance sheet to last year’s representing this year’s activities can be used to build the cash flow statement.
Forming the Cash Flow Statement
The cash flow statement was built to reconcile income to cash. The first line of the statement is net income, and the last line is free cash flow. The balance sheet statement is presented the same way except the first line on the balance sheet is the cash balance and the last line is retained earnings. The changes of these balance sheet items represent free cash flow and net income, respectively.
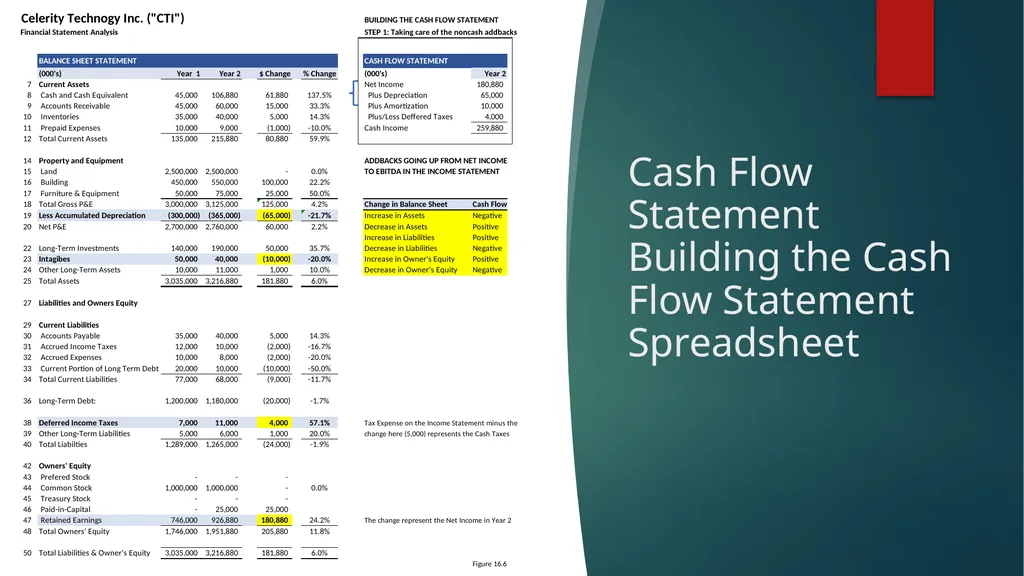
Starting from net income we first need to add any non-cash items that are included in the income statement, moving upward. This includes depreciation, amortization, deferred taxes, or even deferred interest, representing the cash portion of net income before any timing differences in cost of goods sold and revenue.
As you can see in this example, we add depreciation and deferred taxes to net income; both items can be found on the balance sheet, as demonstrated in figure 16.6. After adding or subtracting these items we calculate cash income. Net income can also be found on the balance sheet as the difference in retained earnings from one year to the next.<br>
slide21. Cash Flow Statement Building the Cash Flow Statement Spreadsheet<br>
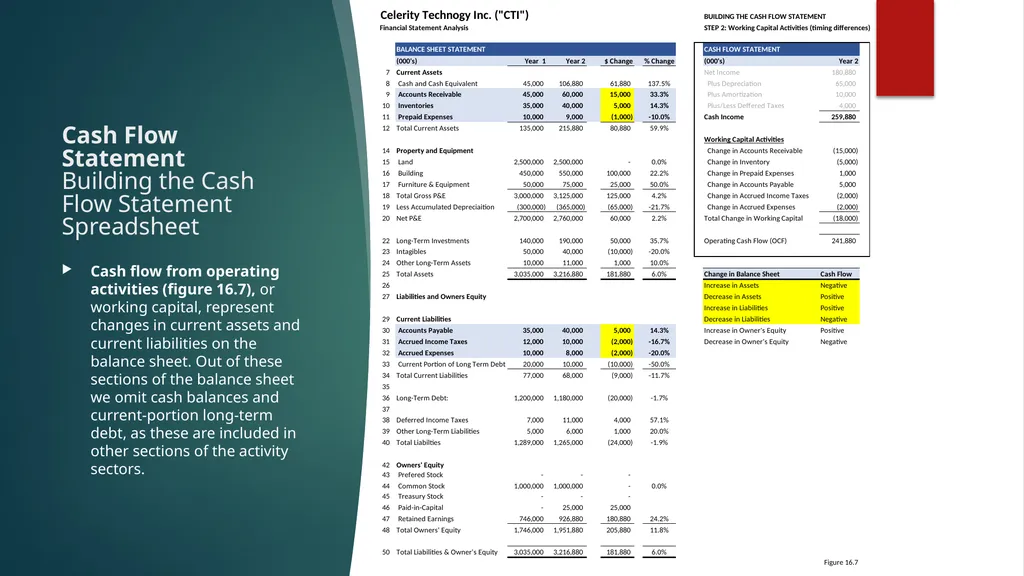
slide22. Cash Flow Statement Building the Cash Flow Statement Spreadsheet Cash flow from operating activities (figure 16.7), or working capital, represent changes in current assets and current liabilities on the balance sheet. Out of these sections of the balance sheet we omit cash balances and current-portion long-term debt, as these are included in other sections of the activity sectors.<br>
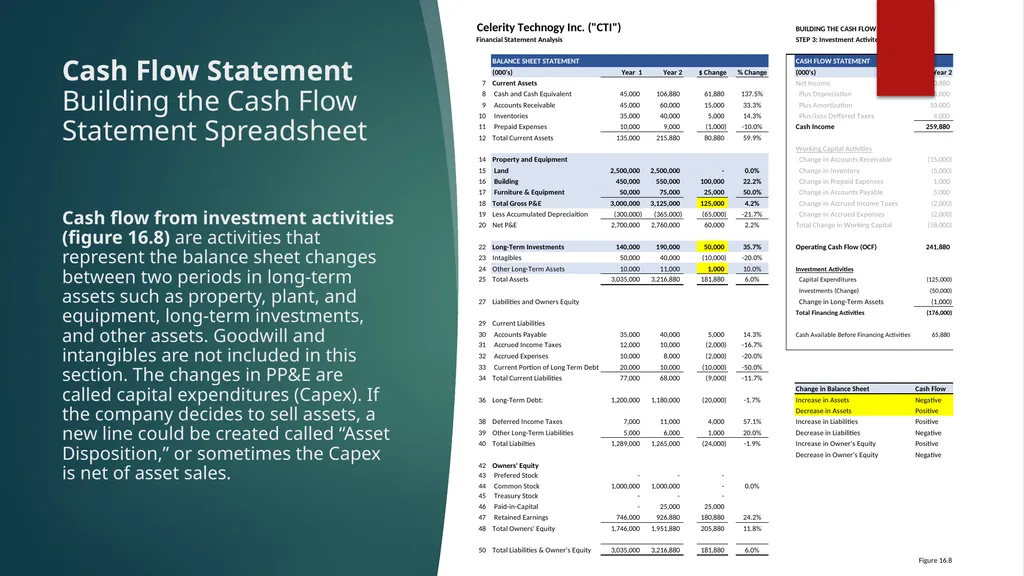
slide23. Cash Flow Statement Building the Cash Flow Statement Spreadsheet Cash flow from investment activities (figure 16.8) are activities that represent the balance sheet changes between two periods in long-term assets such as property, plant, and equipment, long-term investments, and other assets. Goodwill and intangibles are not included in this section. The changes in PP&E are called capital expenditures (Capex). If the company decides to sell assets, a new line could be created called “Asset Disposition,” or sometimes the Capex is net of asset sales.<br>
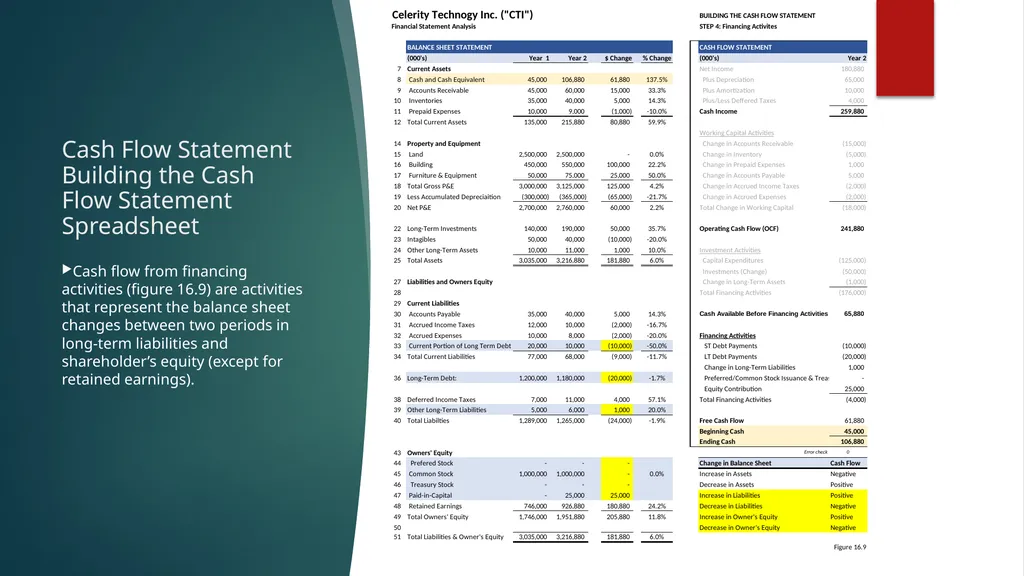
slide24. Cash Flow Statement Building the Cash Flow Statement Spreadsheet Cash flow from financing activities (figure 16.9) are activities that represent the balance sheet changes between two periods in long-term liabilities and shareholder’s equity (except for retained earnings).<br>
slide25. Financial Ratio Analysis Understanding how to interpret financial statements does not purely involve looking at the trends between years such as revenue growth to determine how the company is performing.
Though this approach is usually the first line of every financial analysis, the analyst needs to get deeper in the analysis to determine specific results that should enhance the assessment of the company’s performance.
For example, by combining a few items from the income statement and the balance sheet, or by comparing cash flow statement and income statement lines, the analyst could better interpret the company’s performance.
This process is called ratio analysis and is designed to give the analyst a better story about the performance of the company.
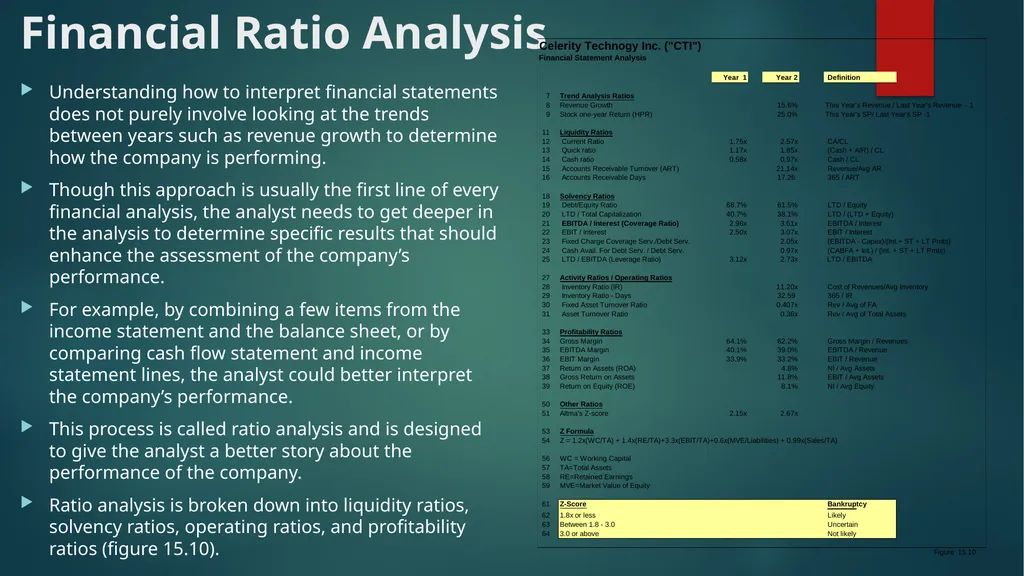
Ratio analysis is broken down into liquidity ratios, solvency ratios, operating ratios, and profitability ratios (figure 15.10).<br>
slide26. Financial Ratio Analysis Understanding how to interpret financial statements does not purely involve looking at the trends between years such as revenue growth to determine how the company is performing.
Though this approach is usually the first line of every financial analysis, the analyst needs to get deeper in the analysis to determine specific results that should enhance the assessment of the company’s performance.
For example, by combining a few items from the income statement and the balance sheet, or by comparing cash flow statement and income statement lines, the analyst could better interpret the company’s performance.
This process is called ratio analysis and is designed to give the analyst a better story about the performance of the company.
Ratio analysis is broken down into liquidity ratios, solvency ratios, operating ratios, and profitability ratios (figure 15.10).<br>
slide27. Financial Ratio Analysis Liquidity Ratios
Liquidity ratios measure how the company manages cash.
This of course is more relevant when the company is in distress and having liquidity is its top priority.
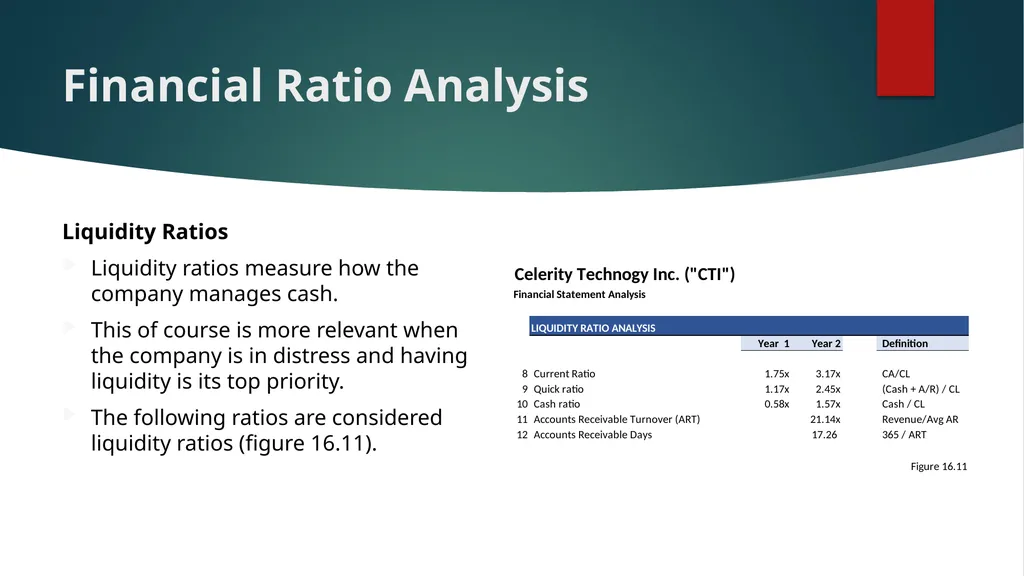
The following ratios are considered liquidity ratios (figure 16.11).<br>
slide28. Financial Ratio Analysis Liquidity Ratios
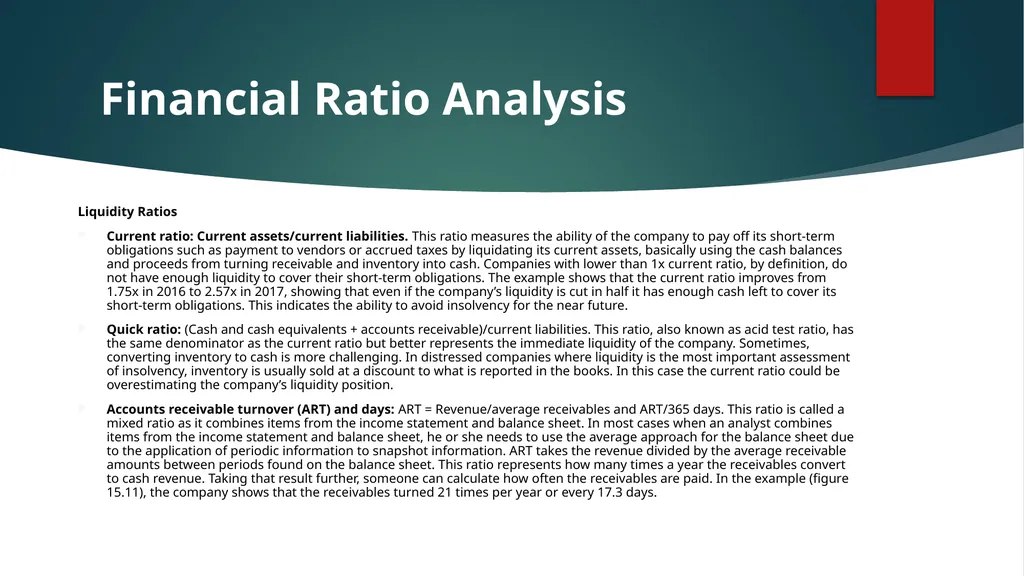
Current ratio: Current assets/current liabilities. This ratio measures the ability of the company to pay off its short-term obligations such as payment to vendors or accrued taxes by liquidating its current assets, basically using the cash balances and proceeds from turning receivable and inventory into cash. Companies with lower than 1x current ratio, by definition, do not have enough liquidity to cover their short-term obligations. The example shows that the current ratio improves from 1.75x in 2016 to 2.57x in 2017, showing that even if the company’s liquidity is cut in half it has enough cash left to cover its short-term obligations. This indicates the ability to avoid insolvency for the near future.
Quick ratio: (Cash and cash equivalents + accounts receivable)/current liabilities. This ratio, also known as acid test ratio, has the same denominator as the current ratio but better represents the immediate liquidity of the company. Sometimes, converting inventory to cash is more challenging. In distressed companies where liquidity is the most important assessment of insolvency, inventory is usually sold at a discount to what is reported in the books. In this case the current ratio could be overestimating the company’s liquidity position.
Accounts receivable turnover (ART) and days: ART = Revenue/average receivables and ART/365 days. This ratio is called a mixed ratio as it combines items from the income statement and balance sheet. In most cases when an analyst combines items from the income statement and balance sheet, he or she needs to use the average approach for the balance sheet due to the application of periodic information to snapshot information. ART takes the revenue divided by the average receivable amounts between periods found on the balance sheet. This ratio represents how many times a year the receivables convert to cash revenue. Taking that result further, someone can calculate how often the receivables are paid. In the example (figure 15.11), the company shows that the receivables turned 21 times per year or every 17.3 days.<br>
slide29. Financial Ratio Analysis Solvency Ratios
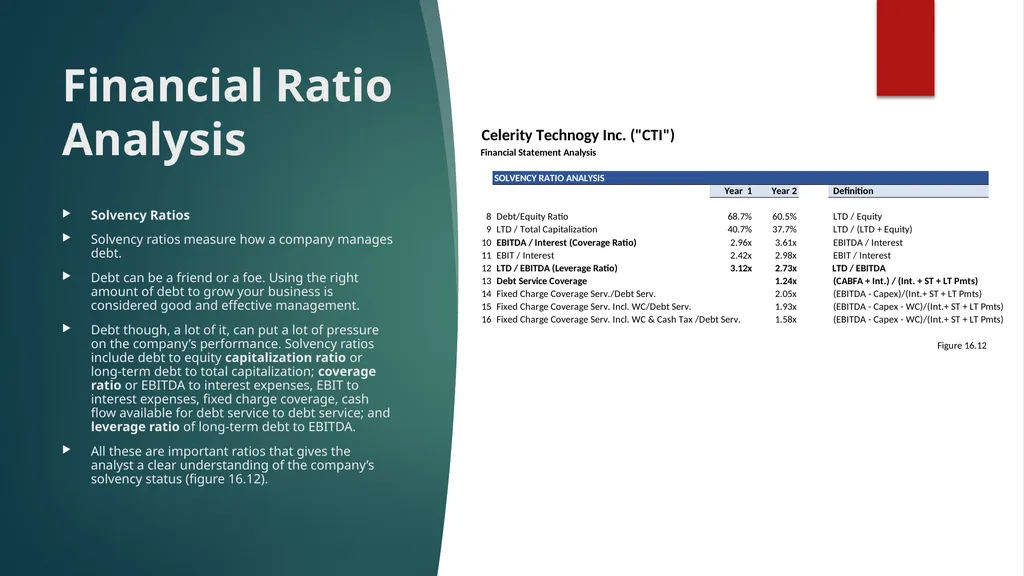
Solvency ratios measure how a company manages debt.
Debt can be a friend or a foe. Using the right amount of debt to grow your business is considered good and effective management.
Debt though, a lot of it, can put a lot of pressure on the company’s performance. Solvency ratios include debt to equity capitalization ratio or long-term debt to total capitalization; coverage ratio or EBITDA to interest expenses, EBIT to interest expenses, fixed charge coverage, cash flow available for debt service to debt service; and leverage ratio of long-term debt to EBITDA.
All these are important ratios that gives the analyst a clear understanding of the company’s solvency status (figure 16.12).<br>
slide30. Financial Ratio Analysis Solvency Ratios
Debt to equity: Debt/equity. This ratio is generally used for comparing the strength of the equity as it compares to its debt, essentially for investment-grade companies (BBB+ and better under Standards & Poor’s grading system) that have a debt-to-equity ratio of less than 1x, showing that the composition of book value of equity is higher than the value of debt. Companies with higher than 1x are considered riskier as the debt is higher than the equity.
Total capitalization: Total debt/(Total debt + shareholders’ equity) or long-term debt/(Long-term debt + shareholders’ equity): This ratio measures the proportion of debt in the company’s capital structure. This ratio is a very common ratio to measure balance sheet leverage, an important measurement for a company to effectively access the capital markets.
Coverage ratios: EBITDA/interest expense and EBIT/interest, Both ratios could be found in many loan agreements as financial covenant. This covenant measures how much cushion a company needs to be able to make its periodical debt obligations such as interest expenses. Other coverage ratios are fixed-charge coverage and cash flow available for debt service to debt service. These ratios are more specific to the ability of the company to make its debt obligations, both principal and interest payments.<br>
slide31. Financial Ratio Analysis Solvency Ratios
Leverage ratio:
Total debt/EBITDA or long-term debt/EBITDA: This one of the most popular solvency ratios.
This ratio is typically included as a covenant in many loan agreements, primarily for companies that are non-investment grade (BB- or below rated by Standard & Poor).
It’s also a market benchmark for raising debt in the loan and bond markets. Even the government, after the financial crisis, implemented guidelines to discourage regulated banks to lend money to companies that had a ratio higher than 6x. In 2013, the federal government published the Leveraged Lending Guidelines to guide banks to run debt capacity measurements before providing credit.
This ratio measures how long it will take a company to pay off its debt. In a later chapter regarding debt capacity, this ratio is one of the ratios that we will use to derive debt capacity at certain transactions.<br>
slide32. Financial Ratio Analysis Solvency Ratios
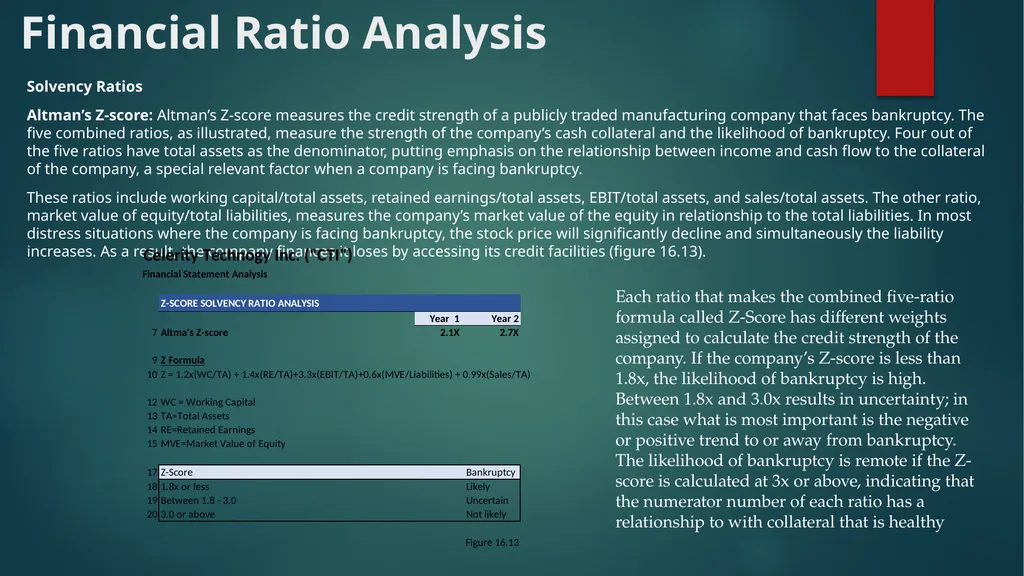
Altman’s Z-score: Altman’s Z-score measures the credit strength of a publicly traded manufacturing company that faces bankruptcy. The five combined ratios, as illustrated, measure the strength of the company’s cash collateral and the likelihood of bankruptcy. Four out of the five ratios have total assets as the denominator, putting emphasis on the relationship between income and cash flow to the collateral of the company, a special relevant factor when a company is facing bankruptcy.
These ratios include working capital/total assets, retained earnings/total assets, EBIT/total assets, and sales/total assets. The other ratio, market value of equity/total liabilities, measures the company’s market value of the equity in relationship to the total liabilities. In most distress situations where the company is facing bankruptcy, the stock price will significantly decline and simultaneously the liability increases. As a result, the company finances it loses by accessing its credit facilities (figure 16.13). Each ratio that makes the combined five-ratio formula called Z-Score has different weights assigned to calculate the credit strength of the company. If the company’s Z-score is less than 1.8x, the likelihood of bankruptcy is high. Between 1.8x and 3.0x results in uncertainty; in this case what is most important is the negative or positive trend to or away from bankruptcy. The likelihood of bankruptcy is remote if the Z-score is calculated at 3x or above, indicating that the numerator number of each ratio has a relationship to with collateral that is healthy<br>
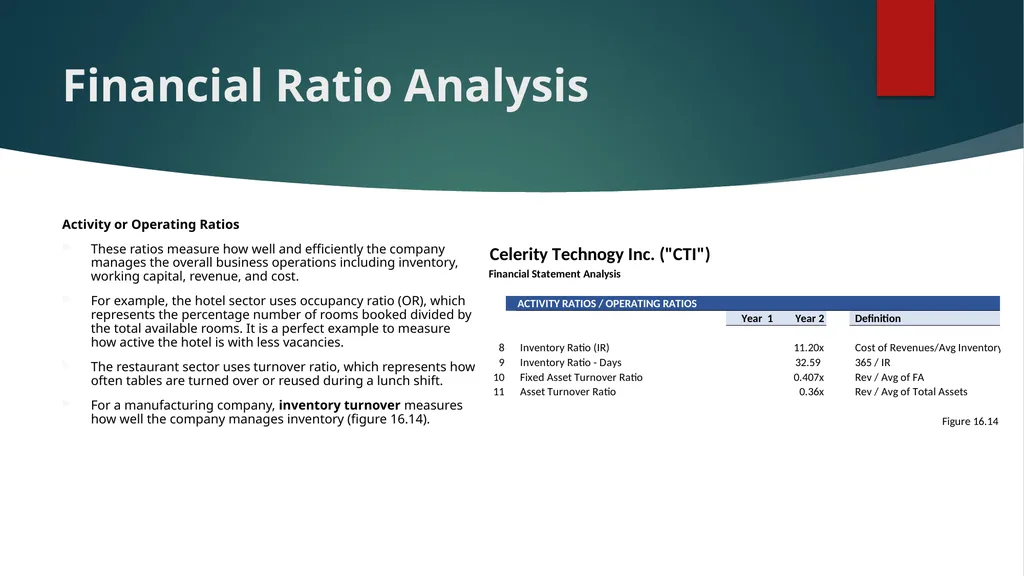
slide33. Financial Ratio Analysis Activity or Operating Ratios
These ratios measure how well and efficiently the company manages the overall business operations including inventory, working capital, revenue, and cost.
For example, the hotel sector uses occupancy ratio (OR), which represents the percentage number of rooms booked divided by the total available rooms. It is a perfect example to measure how active the hotel is with less vacancies.
The restaurant sector uses turnover ratio, which represents how often tables are turned over or reused during a lunch shift.
For a manufacturing company, inventory turnover measures how well the company manages inventory (figure 16.14).<br>
slide34. Financial Ratio Analysis Activity or Operating Ratios
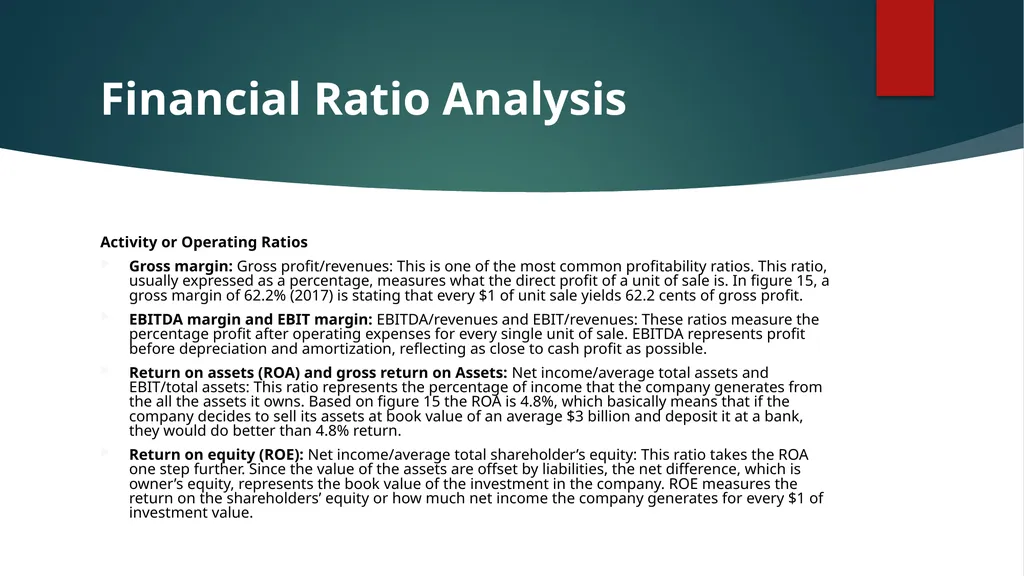
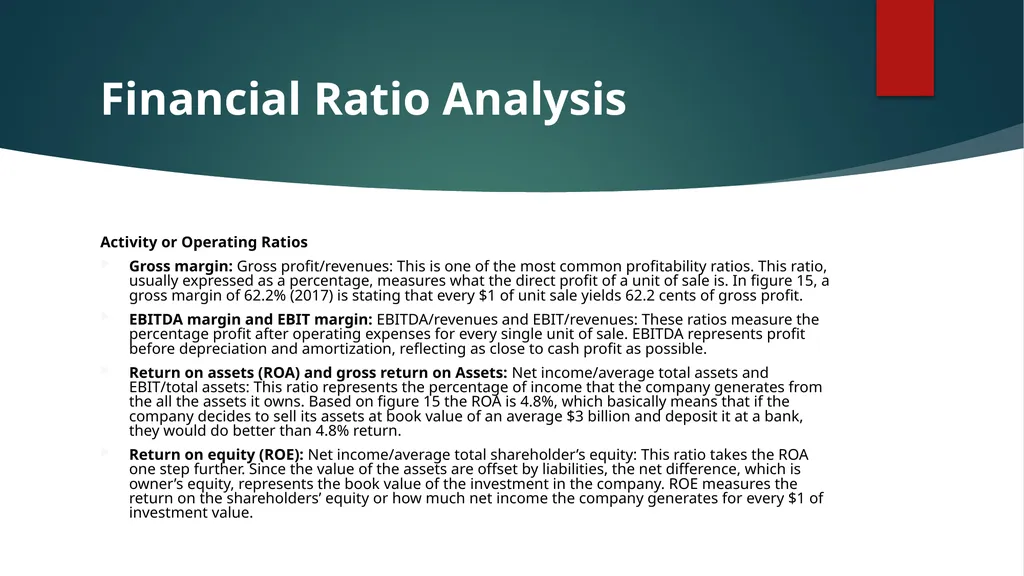
Gross margin: Gross profit/revenues: This is one of the most common profitability ratios. This ratio, usually expressed as a percentage, measures what the direct profit of a unit of sale is. In figure 15, a gross margin of 62.2% (2017) is stating that every $1 of unit sale yields 62.2 cents of gross profit.
EBITDA margin and EBIT margin: EBITDA/revenues and EBIT/revenues: These ratios measure the percentage profit after operating expenses for every single unit of sale. EBITDA represents profit before depreciation and amortization, reflecting as close to cash profit as possible.
Return on assets (ROA) and gross return on Assets: Net income/average total assets and EBIT/total assets: This ratio represents the percentage of income that the company generates from the all the assets it owns. Based on figure 15 the ROA is 4.8%, which basically means that if the company decides to sell its assets at book value of an average $3 billion and deposit it at a bank, they would do better than 4.8% return.
Return on equity (ROE): Net income/average total shareholder’s equity: This ratio takes the ROA one step further. Since the value of the assets are offset by liabilities, the net difference, which is owner’s equity, represents the book value of the investment in the company. ROE measures the return on the shareholders’ equity or how much net income the company generates for every $1 of investment value.<br>
slide35. Financial Ratio Analysis Activity or Operating Ratios
Gross margin: Gross profit/revenues: This is one of the most common profitability ratios. This ratio, usually expressed as a percentage, measures what the direct profit of a unit of sale is. In figure 15, a gross margin of 62.2% (2017) is stating that every $1 of unit sale yields 62.2 cents of gross profit.
EBITDA margin and EBIT margin: EBITDA/revenues and EBIT/revenues: These ratios measure the percentage profit after operating expenses for every single unit of sale. EBITDA represents profit before depreciation and amortization, reflecting as close to cash profit as possible.
Return on assets (ROA) and gross return on Assets: Net income/average total assets and EBIT/total assets: This ratio represents the percentage of income that the company generates from the all the assets it owns. Based on figure 15 the ROA is 4.8%, which basically means that if the company decides to sell its assets at book value of an average $3 billion and deposit it at a bank, they would do better than 4.8% return.
Return on equity (ROE): Net income/average total shareholder’s equity: This ratio takes the ROA one step further. Since the value of the assets are offset by liabilities, the net difference, which is owner’s equity, represents the book value of the investment in the company. ROE measures the return on the shareholders’ equity or how much net income the company generates for every $1 of investment value.<br>
“Credit Risk Management & Analysis”<br>
slide2. Financial Statements Overview There are three primary financial statements: income statements, balance sheets, and cash flow statements.
Public traded companies are required to include audited financial statements in their annual and quarterly reports.
The Securities Exchange Commission (SEC) requires the public traded companies to file one 10K and three 10Q reports per year representing their annual and quarterly performance, respectively.
These detailed statements can be found on the company’s filings in the SEC’s EDGAR system.
They are also usually available on the company’s website under “Investor Relations” and other financial websites such as www.finance.yahoo.com and www.google.com/finance.
In addition to the statements, the company discusses its performance found in the “Management, Discussion, and Analysis” (MD&A) section as well as provides detailed footnotes to each of the statements<br>
slide3. Understanding Financial Statements To evaluate publicly traded companies, analysts who represent different investors need uniform financial standards that are consistent, accurate, and complete.
Public accounting organizations around the world have set up global accounting standards.
The biggest organization, the International Financial Reporting Standards (IFRS), is gradually replacing country-specific standards.
Developed by the Financial Accounting Standard Board (FASB), the United States still recognizes generally accepted accounting principles (GAAP) regulated by the SEC.
However, the United States is gradually unifying to the IFRS standards.<br>
slide4. Income Statement The income statement is a summary of the company’s profit or loss over a period. It reports the revenues, expenses, and net profit or net loss over a quarter or a full year.
It’s also referred to as a profit and loss statement or “P&L.” The income statement drives the company’s reported quarterly earnings per share (EPS).
It is usually accompanied by a statement of comprehensive income, which reconciles the income statement to account for investments made by owners of the company.
The income statement is very useful when comparing revenues, expenses, and profits for the period and for one or more prior periods.
For example, this quarter’s results can be compared to two prior quarters or the same quarter from last year (this is called “year over year” or “YoY”).
The income statement demonstrated in figure 15.1 is basically broken down into top-line revenues and two types of expenses, including cost of revenues and operating expenses.
The difference between revenues and these expenses the company’s income from operations is calculated before other expenses such as interest and taxes.
Net income or the company’s bottom line is derived after these expenses are subtracted.<br>
slide5. Income Statement<br>
slide6. Income Statement Revenues
Revenue (or sales) is the first line item on the income statement. Revenues represent the total dollar amount realized by companies for the sale of products and services at a given period. Revenues could be itemized by product, segment, division, or geographical location. In analyzing revenues, an analyst looks at the drivers of such revenues. The drivers could be volume, price, or contractual obligations. These drivers will be discussed in later chapters.
Expenses
Expenses reported in the income statement are generally broken down into two parts:
Direct cost or cost of revenue or cost of goods sold (COGS)
Indirect cost or operating expenses or selling, general, and administrative expenses (SG&A)
Cost of Revenues
Cost of revenues (or cost of goods sold (COGS)) includes the direct costs of selling the goods of the company. These expenses include raw material, labor, and overhead (MLO). Cost of revenues captures expenses that are variable based on sales volume or units sold.
Operating Expenses
Operating expenses include the fixed costs of running a company that are not directly related to the sales volume or number of units sold. Operating expenses are also referred to as selling, general, and administrative expenses (SG&A). SG&A includes administrative costs such as the CEO’s salary, marketing costs such as advertising, and general costs such as office supplies and other office expenses. In addition to the SG&A expenses, publicly traded companies include non-cash expenses such as depreciation and amortization<br>
slide7. Income Statement Operating Income or EBIT
Revenues minus operating expenses result to operating income or earnings before interest and taxes (assuming the depreciation and amortization expenses are included in the “Operating Expense” section). Usually, private companies exclude depreciation and amortization expenses from the “Operating Expense” section resulting in earnings before interest, taxes, depreciation, and amortization (EBITDA).
Earnings Before Interest, Taxes, Depreciation, and Amortization or EBITDA
For publicly traded companies, earnings before interest, taxes, depreciation, and amortization (EBITDA) is not usually found in the income statement. This is calculated by adding back depreciation and amortization (D&A) to EBIT or operating income. This income line is commonly used to estimate the operating cash flow of the company. EBITDA is used in various methods to estimate the value of the firm and is discussed in later chapters.
Net Income
Net income represents the bottom-line profit or loss of the company after tax and interest expenses and after other non-ordinary expenses such as dividends and one-time or non-recurring expenses. Net income or earnings after taxes represent the value added to last year’s earnings.<br>
slide8. Balance Sheet Statement The balance sheet represents the wealth or the financial condition of the company.
Unlike the income statement, which measures company performance over a quarter or a year, the balance sheet is a snapshot of all a company’s assets, representing everything the company owns (cash, equipment, investments, etc.); liabilities, representing what the company owes against those assets and the company’s net worth; and shareholder’s equity, representing what the owners keep or earned, taken at a moment in time, as demonstrated in figure 16.2<br>
slide9. Balance Sheet Statement Assets
This section of the balance sheet gives a list of the assets of the company. The statement is formatted to start from the most liquid assets to the least liquid. The first section is current assets, representing assets that should turn to cash within the next 12 months. These are followed by non-current assets that includes tangible and intangible assets such as goodwill.
Current Assets
Current assets include cash and cash equivalents, accounts receivable, inventory and other current assets.
Cash and cash equivalents: Cash and cash equivalents represent the deposit account and/or short-term investments of the company. This cash is accessible within a day or two.
Accounts receivable: Accounts receivable represent the money owed to the company by the customer and are considered the second-most liquid item on the balance sheet as the customers typically have 30–60 days to pay the company for goods they bought.
Inventory: Inventory represents the cost of raw materials, work in process (WIP), and finished goods that are ready to be shipped. Inventory will usually turn into cash in 30–120 days, depending of the type of the inventory the company buys, develops, and sells.
Other current assets: Other current assets include money owed to the company for reasons other than customers. It also includes prepaid expenses, which are expenses that are prepaid upfront such as insurance fees and annual license fees.<br>
slide10. Balance Sheet Statement Non-Current Assets
Non-current assets include both tangible and non-tangible assets. Tangible assets include property, plant, and equipment; long-term investments; and other long-term assets. Intangible assets include goodwill and other intangible assets such as patterns and trademarks.
Gross property, plant, and equipment (PP&E): PP&E represent tangible assets such as buildings, land, equipment, cars, and trucks at their book value. The balance sheet ignores any appreciation in asset value. Sometimes the company reports the net PP&E, which represents the value of these assets after all depreciation is subtracted from the gross amount.
Long-term investments: These could be investments such as joint ventures or other long-term investments.
Goodwill: Goodwill is created when the company is acquired for a price greater than book value. The difference between the acquisition price and book value is recorded as goodwill.<br>
slide11. Balance Sheet Statement Liabilities
This section of the balance sheet gives a list of the liabilities of the company. The statement is formatted to start from the most liquid to the least liquid. The first section is current liabilities, representing the obligations that the company should pay within the next 12 months. These are followed by long-term liabilities, which are obligations that extend further that a year into the future.
Current Liabilities
Current liabilities include outstanding payments to suppliers, short-term debts and obligations due within one year such as accounts payable, short-term interest and tax payables, current portions of long-term debt, and other accrued expenses.
Accounts payable: These are payment obligations due by the company to suppliers, primarily for purchasing inventory or raw material.
Income tax accruals: These are short-term income-related taxes that are payable within a year.
Accrued expenses: These are expenses that needed to be paid within a year. These accrued expenses do not include any obligations owed to suppliers.
Current portion of long-term debt: This is the company’s debt obligations that are due within a year.<br>
slide12. Balance Sheet Statement Long-Term Liabilities
Long-term debt: Any debt including loans, bonds, or mortgages that are due more than a year are included in this section.
Deferred taxes: These are taxes that are deferred, due, and payable in more than a year.
Other liabilities: Other liabilities include long-term obligations such as contingent liabilities. These include potential payments due to lawsuits, environmental obligations, and/or insurance payments.<br>
slide13. Balance Sheet Statement Net Worth or Shareholder’s Equity
Shareholder’s equity measures the amount by which a company’s assets exceed its liabilities at snapshot in time; basically if one sold all that the company owns after paying all the obligations against these assets, the balance left is what the ownership will keep (figure 15.2). Shareholder’s equity is also referred to as net worth or book value of equity. Included in this section are common stock, preferred stock, treasury stock, paid-in capital, and other equity and retained earnings.
Common stock: This represents the original issuance of equity by the owners and it will go down when the company buys back shares.
Preferred stock: This could be an issuance by a third-party investor who expects the company to pay certain fixed dividends (like debt obligations).
Treasury stock: Recorded as a negative number on the balance sheet, treasury stock represents shares that have been issued in the past but were repurchased by the company. The amount repurchased will reduce both par value and capital surplus on the balance sheet if the company decides to permanently retire the stock that was repurchased. If the company decides to re-issue the stock sometime in the future, the treasury stock will be set up at a separate account, reducing common stock and shareholder’s equity.
Paid-in capital: This represents proceeds from any additional equity investments invested in the company.
Retained earnings: Retained earnings represent the cumulative income net of loses over time. The retained earnings could also be reducing if the company pays out dividends to shareholders or records loses.<br>
slide14. Balance Sheet Statement<br>
slide15. Cash Flow Statement Net Worth or Shareholder’s Equity
Shareholder’s equity measures the amount by which a company’s assets exceed its liabilities at snapshot in time; basically, if one sold all that the company owns after paying all the obligations against these assets, the balance left is what the ownership will keep (figure 15.2). Shareholder’s equity is also referred to as net worth or book value of equity. Included in this section are common stock, preferred stock, treasury stock, paid-in capital, and other equity and retained earnings.
Common stock: This represents the original issuance of equity by the owners, and it will go down when the company buys back shares.
Preferred stock: This could be an issuance by a third-party investor who expects the company to pay certain fixed dividends (like debt obligations).
Treasury stock: Recorded as a negative number on the balance sheet, treasury stock represents shares that have been issued in the past but were repurchased by the company. The amount repurchased will reduce both par value and capital surplus on the balance sheet if the company decides to permanently retire the stock that was repurchased. If the company decides to re-issue the stock sometime in the future, the treasury stock will be set up at a separate account, reducing common stock and shareholder’s equity.
Paid-in capital: This represents proceeds from any additional equity investments invested in the company.
Retained earnings: Retained earnings represent the cumulative income net of loses over time. The retained earnings could also be reducing if the company pays out dividends to shareholders or records loses.<br>
slide16. Cash Flow Statement The cash flow statement represents the cash inflow and outflow of the company.
The cash statement is like the income statement when it comes to measuring performance over a period of time.
However, it focuses on the actual cash generated or spent by the business.
In a perfect world you might not need both the income and cash flow statements.
A perfect scenario is described in figure 15.4 where we use an example of a 9-year-old setting up a lemonade stand. In this humorous example the young 9-year-old Joey decides to set up a lemonade stand in front of his house. His dad helps him with $20 to start his lemonade business. Joe uses the full $20 to buy a box of 100 cups ($5), a lemonade-concentrated juice ($5), and 4 gallons of bottled water ($10). In this story, we assume that he sells all his lemonade and uses all 100 cups (no inventory left). Assuming he sold each lemonade for $1, after the end of the day, Joey will set up an income statement to show his profit. Revenues are recorded at $100 ($1 x 100 cups), minus his cost of $20, showing a profit of $80. This should match his cash on hand. In this case his simple income statement will be the same as his cash flow statement since every transaction was done with all cash. See both statements (figure 16.4).<br>
slide17. Cash Flow Statement A perfect scenario is described in figure shown where we use an example of a 9-year-old setting up a lemonade stand.
In this humorous example the young 9-year-old Joey decides to set up a lemonade stand in front of his house.
His dad helps him with $20 to start his lemonade business. Joe uses the full $20 to buy a box of 100 cups ($5), a lemonade-concentrated juice ($5), and 4 gallons of bottled water ($10). In this story, we assume that he sells all his lemonade and uses all 100 cups (no inventory left).
Assuming he sold each lemonade for $1, after the end of the day, Joey will set up an income statement to show his profit. Revenues are recorded at $100 ($1 x 100 cups), minus his cost of $20, showing a profit of $80.
This should match his cash on hand. In this case his simple income statement will be the same as his cash flow statement since every transaction was done with all cash.
See both statements<br>
slide18. Cash Flow Statement If we slightly change the story, you will see a need for creating both the income and cash flow statements.
Suppose that while Joey was selling his lemonade, his friend Billy bought a lemonade but did not have any money to pay for it. He was very thirsty, he explained, so Joey allowed Billy to have a lemonade and expect to get his $1 later.
At the end of the day, Billy has not showed up.
Now if Joey had to build both his income and cash flow statement to keep up with the difference between what he earned and what cash he has, as is demonstrated in the figure 15.5, Joey’s income statement will show a profit of $80 since he sold all his lemonade, but when he looks at his cash flow statement, he notices a cash profit of $79.
The difference of course is the $1 owed (earned because Joey should eventually get his $1 from Billy).
This $1 will be recorded as accounts receivable and it will be adjusted in the cash flows statement to reflect the timing difference between income and cash.
This timing difference is basically the definition of working capital, as described later in this chapter. We are living is non-perfect world—a world of IOUs.<br>
slide19. Cash Flow Statement The cash flow statement also reflects the fact that the company receives and spends cash other than its primary business (these transactions are not recorded in the income statement which represents the company’s direct or primary operations). For example, a company may spend money on new equipment, conduct improvements of manufacturing facilities, or decide to issue bonds in the capital markets.
The company’s cash position per period (going up or down) does not necessarily represent the company’s operating health. For example, the company might decide to use extra cash to repay debt. This decision will result in a lower cash outflow, even though it may be positive over time, reducing interest obligations.
The cash flow statement, which represents the change in position from one period to the next, has three primary sections:
Cash Flow from Operating Activities
Cash Flow from Investment Activities
Cash Flow from Financing Activities
It is important to realize that one could build an entire cash flow statement by looking at 2 years of balance sheets. The difference of each item on the balance sheet from one year to the next represents the activity for that year and can been seen on the cash flow statement.<br>
slide20. Cash Flow Statement Building the Cash Flow Statement Spreadsheet The cash flow statement can be fully constructed by using addressing every item of two sequential balance sheets. By the taking the difference of this year’s balance sheet to last year’s representing this year’s activities can be used to build the cash flow statement.
Forming the Cash Flow Statement
The cash flow statement was built to reconcile income to cash. The first line of the statement is net income, and the last line is free cash flow. The balance sheet statement is presented the same way except the first line on the balance sheet is the cash balance and the last line is retained earnings. The changes of these balance sheet items represent free cash flow and net income, respectively.
Starting from net income we first need to add any non-cash items that are included in the income statement, moving upward. This includes depreciation, amortization, deferred taxes, or even deferred interest, representing the cash portion of net income before any timing differences in cost of goods sold and revenue.
As you can see in this example, we add depreciation and deferred taxes to net income; both items can be found on the balance sheet, as demonstrated in figure 16.6. After adding or subtracting these items we calculate cash income. Net income can also be found on the balance sheet as the difference in retained earnings from one year to the next.<br>
slide21. Cash Flow Statement Building the Cash Flow Statement Spreadsheet<br>
slide22. Cash Flow Statement Building the Cash Flow Statement Spreadsheet Cash flow from operating activities (figure 16.7), or working capital, represent changes in current assets and current liabilities on the balance sheet. Out of these sections of the balance sheet we omit cash balances and current-portion long-term debt, as these are included in other sections of the activity sectors.<br>
slide23. Cash Flow Statement Building the Cash Flow Statement Spreadsheet Cash flow from investment activities (figure 16.8) are activities that represent the balance sheet changes between two periods in long-term assets such as property, plant, and equipment, long-term investments, and other assets. Goodwill and intangibles are not included in this section. The changes in PP&E are called capital expenditures (Capex). If the company decides to sell assets, a new line could be created called “Asset Disposition,” or sometimes the Capex is net of asset sales.<br>
slide24. Cash Flow Statement Building the Cash Flow Statement Spreadsheet Cash flow from financing activities (figure 16.9) are activities that represent the balance sheet changes between two periods in long-term liabilities and shareholder’s equity (except for retained earnings).<br>
slide25. Financial Ratio Analysis Understanding how to interpret financial statements does not purely involve looking at the trends between years such as revenue growth to determine how the company is performing.
Though this approach is usually the first line of every financial analysis, the analyst needs to get deeper in the analysis to determine specific results that should enhance the assessment of the company’s performance.
For example, by combining a few items from the income statement and the balance sheet, or by comparing cash flow statement and income statement lines, the analyst could better interpret the company’s performance.
This process is called ratio analysis and is designed to give the analyst a better story about the performance of the company.
Ratio analysis is broken down into liquidity ratios, solvency ratios, operating ratios, and profitability ratios (figure 15.10).<br>
slide26. Financial Ratio Analysis Understanding how to interpret financial statements does not purely involve looking at the trends between years such as revenue growth to determine how the company is performing.
Though this approach is usually the first line of every financial analysis, the analyst needs to get deeper in the analysis to determine specific results that should enhance the assessment of the company’s performance.
For example, by combining a few items from the income statement and the balance sheet, or by comparing cash flow statement and income statement lines, the analyst could better interpret the company’s performance.
This process is called ratio analysis and is designed to give the analyst a better story about the performance of the company.
Ratio analysis is broken down into liquidity ratios, solvency ratios, operating ratios, and profitability ratios (figure 15.10).<br>
slide27. Financial Ratio Analysis Liquidity Ratios
Liquidity ratios measure how the company manages cash.
This of course is more relevant when the company is in distress and having liquidity is its top priority.
The following ratios are considered liquidity ratios (figure 16.11).<br>
slide28. Financial Ratio Analysis Liquidity Ratios
Current ratio: Current assets/current liabilities. This ratio measures the ability of the company to pay off its short-term obligations such as payment to vendors or accrued taxes by liquidating its current assets, basically using the cash balances and proceeds from turning receivable and inventory into cash. Companies with lower than 1x current ratio, by definition, do not have enough liquidity to cover their short-term obligations. The example shows that the current ratio improves from 1.75x in 2016 to 2.57x in 2017, showing that even if the company’s liquidity is cut in half it has enough cash left to cover its short-term obligations. This indicates the ability to avoid insolvency for the near future.
Quick ratio: (Cash and cash equivalents + accounts receivable)/current liabilities. This ratio, also known as acid test ratio, has the same denominator as the current ratio but better represents the immediate liquidity of the company. Sometimes, converting inventory to cash is more challenging. In distressed companies where liquidity is the most important assessment of insolvency, inventory is usually sold at a discount to what is reported in the books. In this case the current ratio could be overestimating the company’s liquidity position.
Accounts receivable turnover (ART) and days: ART = Revenue/average receivables and ART/365 days. This ratio is called a mixed ratio as it combines items from the income statement and balance sheet. In most cases when an analyst combines items from the income statement and balance sheet, he or she needs to use the average approach for the balance sheet due to the application of periodic information to snapshot information. ART takes the revenue divided by the average receivable amounts between periods found on the balance sheet. This ratio represents how many times a year the receivables convert to cash revenue. Taking that result further, someone can calculate how often the receivables are paid. In the example (figure 15.11), the company shows that the receivables turned 21 times per year or every 17.3 days.<br>
slide29. Financial Ratio Analysis Solvency Ratios
Solvency ratios measure how a company manages debt.
Debt can be a friend or a foe. Using the right amount of debt to grow your business is considered good and effective management.
Debt though, a lot of it, can put a lot of pressure on the company’s performance. Solvency ratios include debt to equity capitalization ratio or long-term debt to total capitalization; coverage ratio or EBITDA to interest expenses, EBIT to interest expenses, fixed charge coverage, cash flow available for debt service to debt service; and leverage ratio of long-term debt to EBITDA.
All these are important ratios that gives the analyst a clear understanding of the company’s solvency status (figure 16.12).<br>
slide30. Financial Ratio Analysis Solvency Ratios
Debt to equity: Debt/equity. This ratio is generally used for comparing the strength of the equity as it compares to its debt, essentially for investment-grade companies (BBB+ and better under Standards & Poor’s grading system) that have a debt-to-equity ratio of less than 1x, showing that the composition of book value of equity is higher than the value of debt. Companies with higher than 1x are considered riskier as the debt is higher than the equity.
Total capitalization: Total debt/(Total debt + shareholders’ equity) or long-term debt/(Long-term debt + shareholders’ equity): This ratio measures the proportion of debt in the company’s capital structure. This ratio is a very common ratio to measure balance sheet leverage, an important measurement for a company to effectively access the capital markets.
Coverage ratios: EBITDA/interest expense and EBIT/interest, Both ratios could be found in many loan agreements as financial covenant. This covenant measures how much cushion a company needs to be able to make its periodical debt obligations such as interest expenses. Other coverage ratios are fixed-charge coverage and cash flow available for debt service to debt service. These ratios are more specific to the ability of the company to make its debt obligations, both principal and interest payments.<br>
slide31. Financial Ratio Analysis Solvency Ratios
Leverage ratio:
Total debt/EBITDA or long-term debt/EBITDA: This one of the most popular solvency ratios.
This ratio is typically included as a covenant in many loan agreements, primarily for companies that are non-investment grade (BB- or below rated by Standard & Poor).
It’s also a market benchmark for raising debt in the loan and bond markets. Even the government, after the financial crisis, implemented guidelines to discourage regulated banks to lend money to companies that had a ratio higher than 6x. In 2013, the federal government published the Leveraged Lending Guidelines to guide banks to run debt capacity measurements before providing credit.
This ratio measures how long it will take a company to pay off its debt. In a later chapter regarding debt capacity, this ratio is one of the ratios that we will use to derive debt capacity at certain transactions.<br>
slide32. Financial Ratio Analysis Solvency Ratios
Altman’s Z-score: Altman’s Z-score measures the credit strength of a publicly traded manufacturing company that faces bankruptcy. The five combined ratios, as illustrated, measure the strength of the company’s cash collateral and the likelihood of bankruptcy. Four out of the five ratios have total assets as the denominator, putting emphasis on the relationship between income and cash flow to the collateral of the company, a special relevant factor when a company is facing bankruptcy.
These ratios include working capital/total assets, retained earnings/total assets, EBIT/total assets, and sales/total assets. The other ratio, market value of equity/total liabilities, measures the company’s market value of the equity in relationship to the total liabilities. In most distress situations where the company is facing bankruptcy, the stock price will significantly decline and simultaneously the liability increases. As a result, the company finances it loses by accessing its credit facilities (figure 16.13). Each ratio that makes the combined five-ratio formula called Z-Score has different weights assigned to calculate the credit strength of the company. If the company’s Z-score is less than 1.8x, the likelihood of bankruptcy is high. Between 1.8x and 3.0x results in uncertainty; in this case what is most important is the negative or positive trend to or away from bankruptcy. The likelihood of bankruptcy is remote if the Z-score is calculated at 3x or above, indicating that the numerator number of each ratio has a relationship to with collateral that is healthy<br>
slide33. Financial Ratio Analysis Activity or Operating Ratios
These ratios measure how well and efficiently the company manages the overall business operations including inventory, working capital, revenue, and cost.
For example, the hotel sector uses occupancy ratio (OR), which represents the percentage number of rooms booked divided by the total available rooms. It is a perfect example to measure how active the hotel is with less vacancies.
The restaurant sector uses turnover ratio, which represents how often tables are turned over or reused during a lunch shift.
For a manufacturing company, inventory turnover measures how well the company manages inventory (figure 16.14).<br>
slide34. Financial Ratio Analysis Activity or Operating Ratios
Gross margin: Gross profit/revenues: This is one of the most common profitability ratios. This ratio, usually expressed as a percentage, measures what the direct profit of a unit of sale is. In figure 15, a gross margin of 62.2% (2017) is stating that every $1 of unit sale yields 62.2 cents of gross profit.
EBITDA margin and EBIT margin: EBITDA/revenues and EBIT/revenues: These ratios measure the percentage profit after operating expenses for every single unit of sale. EBITDA represents profit before depreciation and amortization, reflecting as close to cash profit as possible.
Return on assets (ROA) and gross return on Assets: Net income/average total assets and EBIT/total assets: This ratio represents the percentage of income that the company generates from the all the assets it owns. Based on figure 15 the ROA is 4.8%, which basically means that if the company decides to sell its assets at book value of an average $3 billion and deposit it at a bank, they would do better than 4.8% return.
Return on equity (ROE): Net income/average total shareholder’s equity: This ratio takes the ROA one step further. Since the value of the assets are offset by liabilities, the net difference, which is owner’s equity, represents the book value of the investment in the company. ROE measures the return on the shareholders’ equity or how much net income the company generates for every $1 of investment value.<br>
slide35. Financial Ratio Analysis Activity or Operating Ratios
Gross margin: Gross profit/revenues: This is one of the most common profitability ratios. This ratio, usually expressed as a percentage, measures what the direct profit of a unit of sale is. In figure 15, a gross margin of 62.2% (2017) is stating that every $1 of unit sale yields 62.2 cents of gross profit.
EBITDA margin and EBIT margin: EBITDA/revenues and EBIT/revenues: These ratios measure the percentage profit after operating expenses for every single unit of sale. EBITDA represents profit before depreciation and amortization, reflecting as close to cash profit as possible.
Return on assets (ROA) and gross return on Assets: Net income/average total assets and EBIT/total assets: This ratio represents the percentage of income that the company generates from the all the assets it owns. Based on figure 15 the ROA is 4.8%, which basically means that if the company decides to sell its assets at book value of an average $3 billion and deposit it at a bank, they would do better than 4.8% return.
Return on equity (ROE): Net income/average total shareholder’s equity: This ratio takes the ROA one step further. Since the value of the assets are offset by liabilities, the net difference, which is owner’s equity, represents the book value of the investment in the company. ROE measures the return on the shareholders’ equity or how much net income the company generates for every $1 of investment value.<br>