
chapter 4 Evaluating a Company’s Resources,
T
Published · 62 slides · 0 views
1 / 1

Description
chapter 4 Evaluating a Companys Resources, Capabilities, and Competitiveness 2022 McGraw Hill. All rights reserved. Authorized only for instructor use in the classroom. No reproduction or further distribution permitted without the prior
Related Topics
Share
Embed code
Download this presentation From Below
"chapter 4 Evaluating a Company’s Resources," is the property of its rightful owner. Permission is granted to download and print the materials on this website for personal, non-commercial use only, and to display it on your personal computer provided you do not modify the materials and that you retain all copyright notices contained in the materials. By downloading content from our website, you accept the terms of this agreement.
Presentation Transcript
01
chapter 4 Evaluating a Company’s Resources, Capabilities, and
Competitiveness © 2022 McGraw Hill. All rights reserved. Authorized only for instructor use in the classroom.
No reproduction or further distribution permitted without the prior written consent of McGraw Hill. Copyright Image Source/Getty Images<br>
No reproduction or further distribution permitted without the prior written consent of McGraw Hill. Copyright Image Source/Getty Images<br>
02
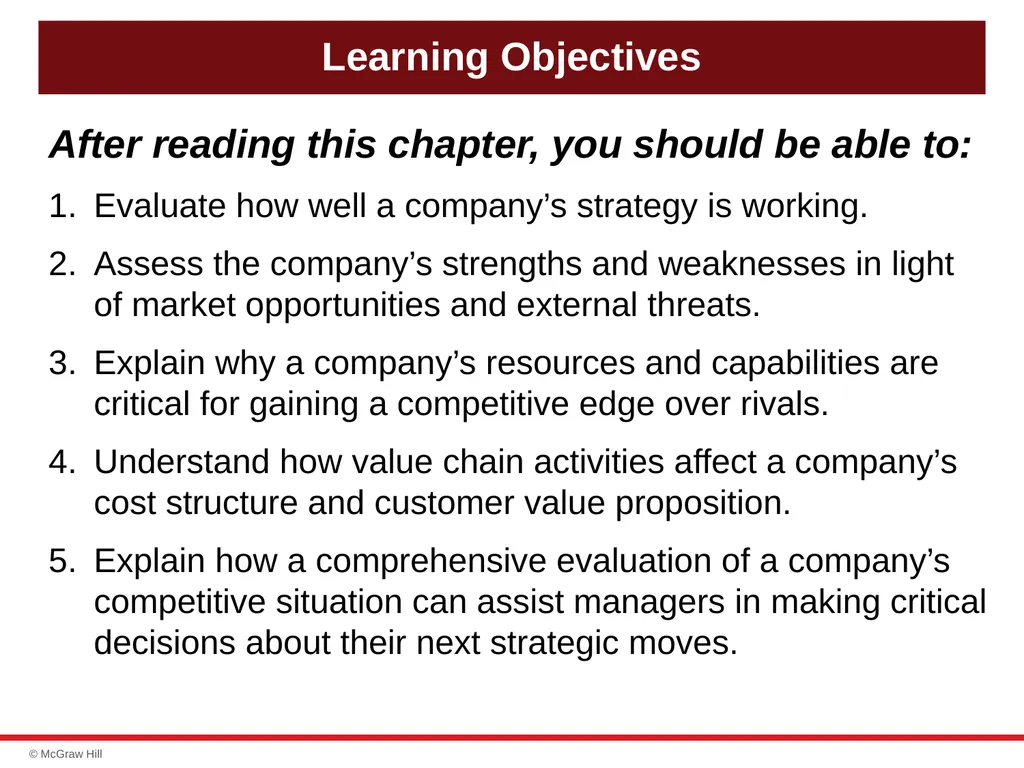
Learning Objectives After reading this chapter, you should be able to:
Evaluate how well a company’s strategy is working.
Assess the company’s strengths and weaknesses in light of market opportunities and external threats.
Explain why a company’s resources and capabilities are critical for gaining a competitive edge over rivals.
Understand how value chain activities affect a company’s cost structure and customer value proposition.
Explain how a comprehensive evaluation of a company’s competitive situation can assist managers in making critical decisions about their next strategic moves.<br>
Evaluate how well a company’s strategy is working.
Assess the company’s strengths and weaknesses in light of market opportunities and external threats.
Explain why a company’s resources and capabilities are critical for gaining a competitive edge over rivals.
Understand how value chain activities affect a company’s cost structure and customer value proposition.
Explain how a comprehensive evaluation of a company’s competitive situation can assist managers in making critical decisions about their next strategic moves.<br>
03
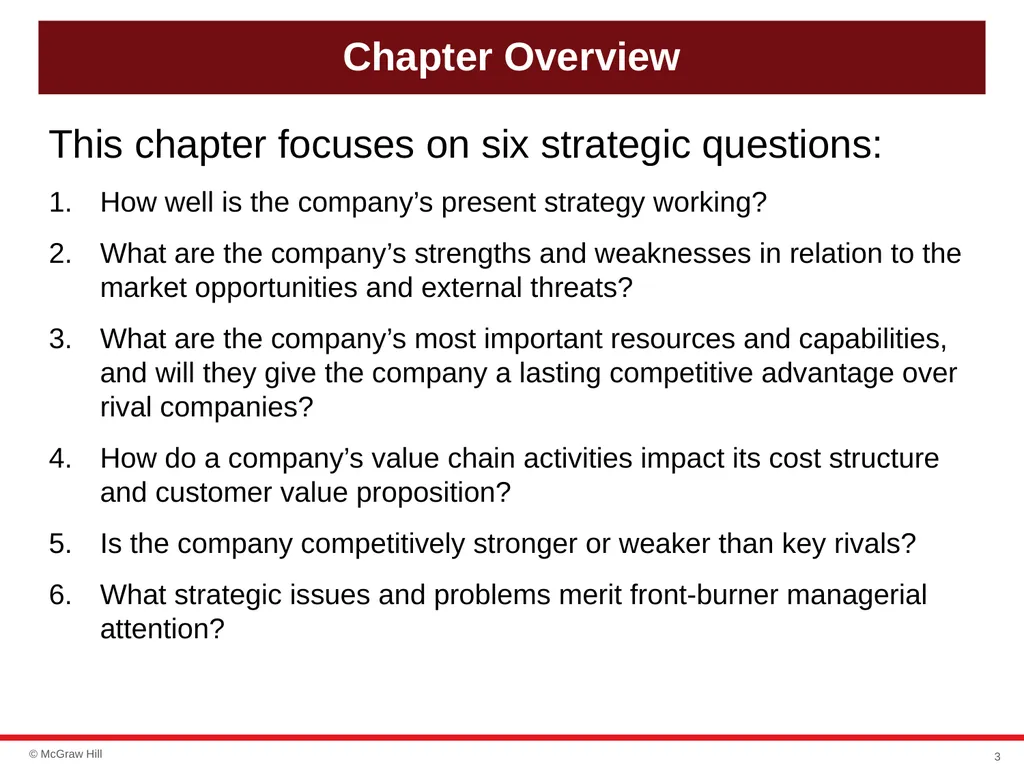
Chapter Overview This chapter focuses on six strategic questions:
How well is the company’s present strategy working?
What are the company’s strengths and weaknesses in relation to the market opportunities and external threats?
What are the company’s most important resources and capabilities, and will they give the company a lasting competitive advantage over rival companies?
How do a company’s value chain activities impact its cost structure and customer value proposition?
Is the company competitively stronger or weaker than key rivals?
What strategic issues and problems merit front-burner managerial attention? 3<br>
How well is the company’s present strategy working?
What are the company’s strengths and weaknesses in relation to the market opportunities and external threats?
What are the company’s most important resources and capabilities, and will they give the company a lasting competitive advantage over rival companies?
How do a company’s value chain activities impact its cost structure and customer value proposition?
Is the company competitively stronger or weaker than key rivals?
What strategic issues and problems merit front-burner managerial attention? 3<br>
04
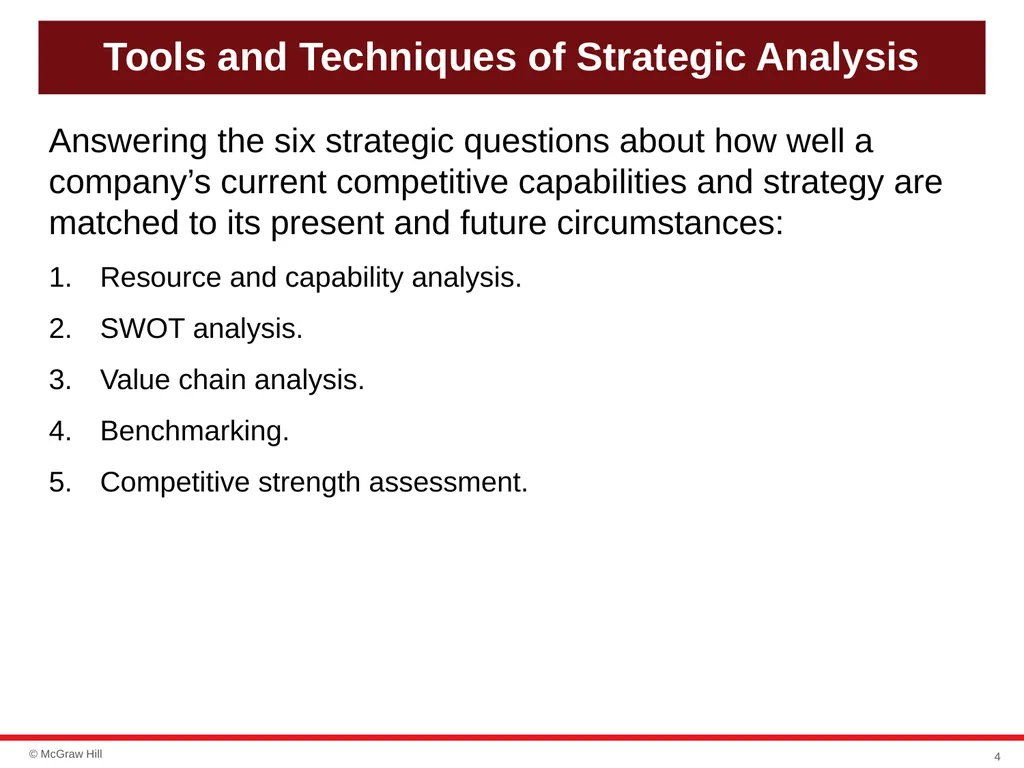
Tools and Techniques of Strategic Analysis Answering the six strategic questions about how well a company’s current competitive capabilities and strategy are matched to its present and future circumstances:
Resource and capability analysis.
SWOT analysis.
Value chain analysis.
Benchmarking.
Competitive strength assessment. 4<br>
Resource and capability analysis.
SWOT analysis.
Value chain analysis.
Benchmarking.
Competitive strength assessment. 4<br>
05
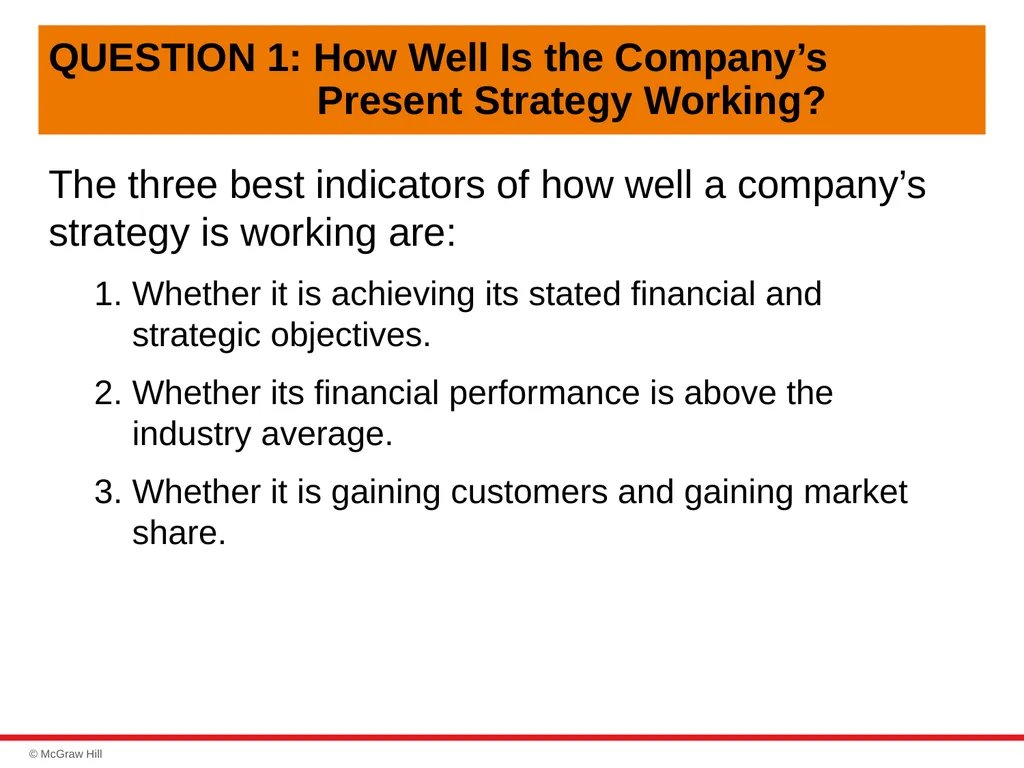
QUESTION 1: How Well Is the Company’s Present Strategy Working? The three best indicators of how well a company’s strategy is working are:
Whether it is achieving its stated financial and strategic objectives.
Whether its financial performance is above the industry average.
Whether it is gaining customers and gaining market share.<br>
Whether it is achieving its stated financial and strategic objectives.
Whether its financial performance is above the industry average.
Whether it is gaining customers and gaining market share.<br>
06
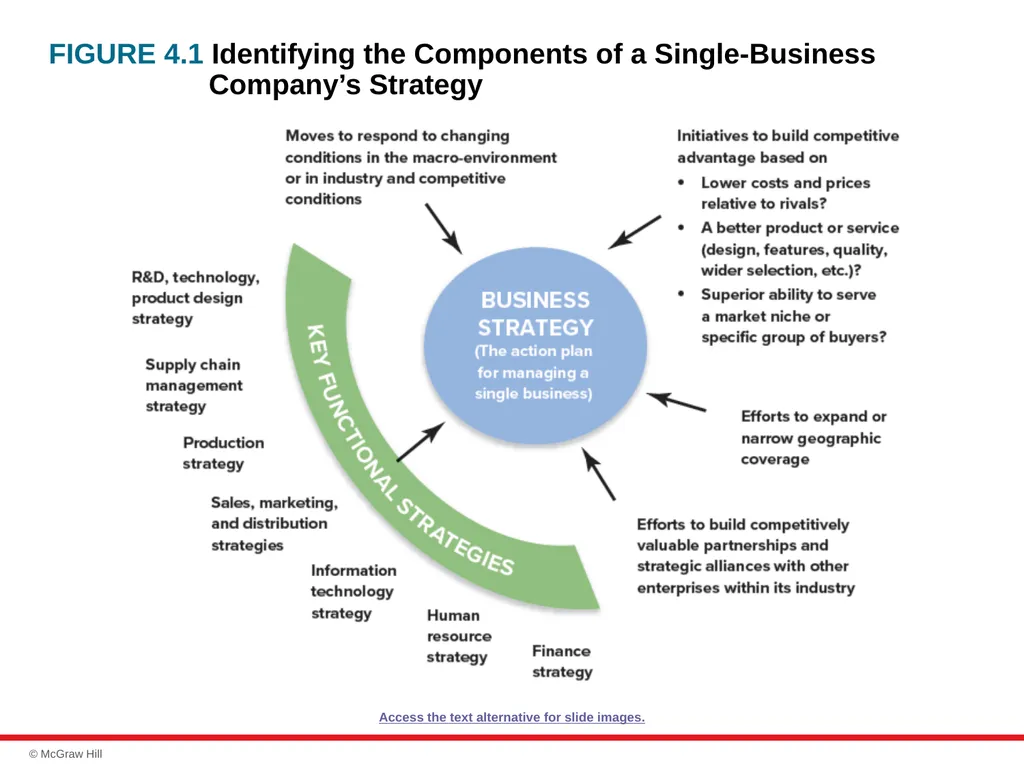
FIGURE 4.1 Identifying the Components of a Single-Business Company’s Strategy Access the text alternative for slide images.<br>
07
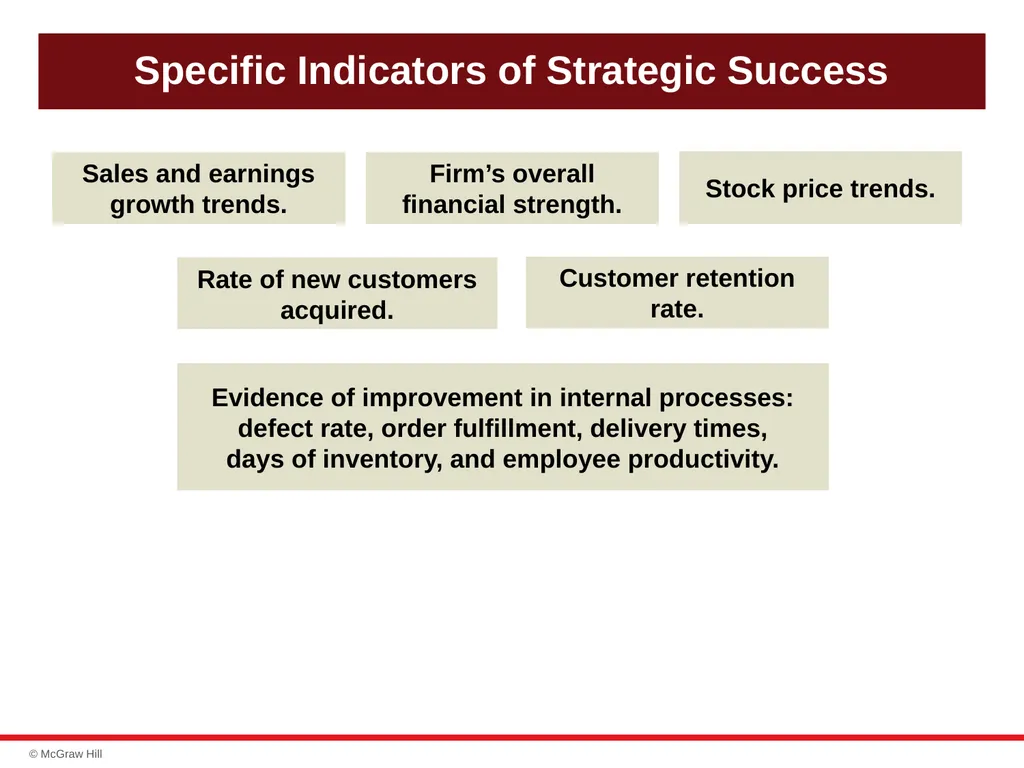
Specific Indicators of Strategic Success Sales and earnings growth trends. Firm’s overall financial strength. Stock price trends. Rate of new customers acquired. Customer retention rate. Evidence of improvement in internal processes: defect rate, order fulfillment, delivery times, days of inventory, and employee productivity.<br>
08
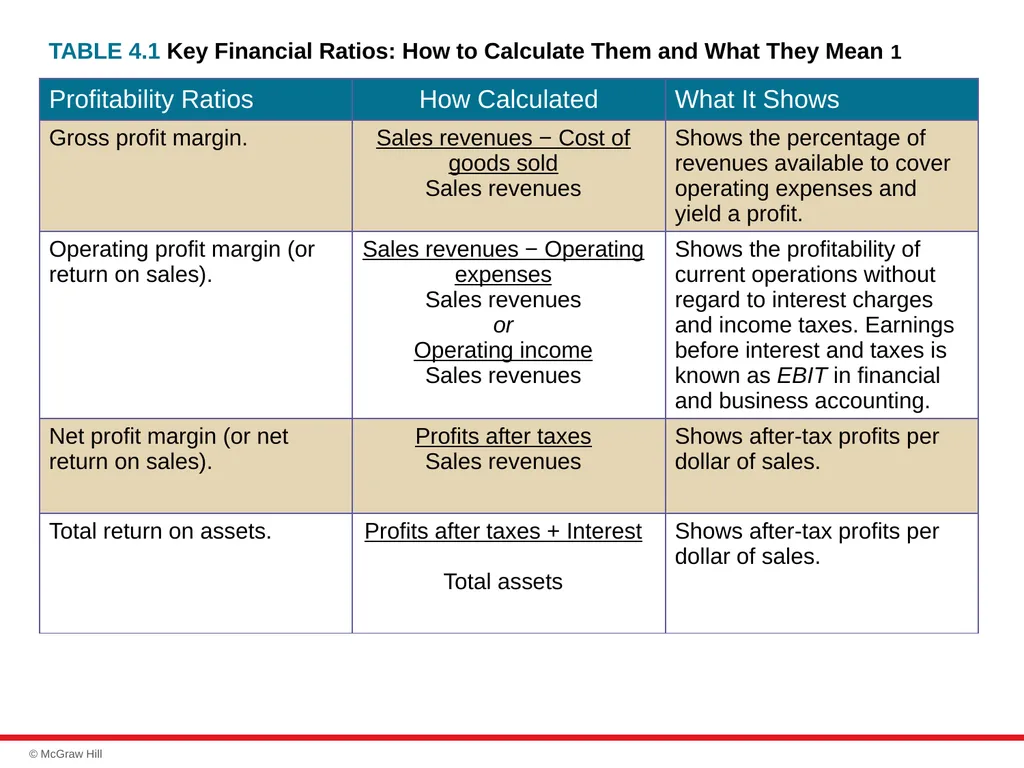
TABLE 4.1 Key Financial Ratios: How to Calculate Them and What They Mean 1<br>
09
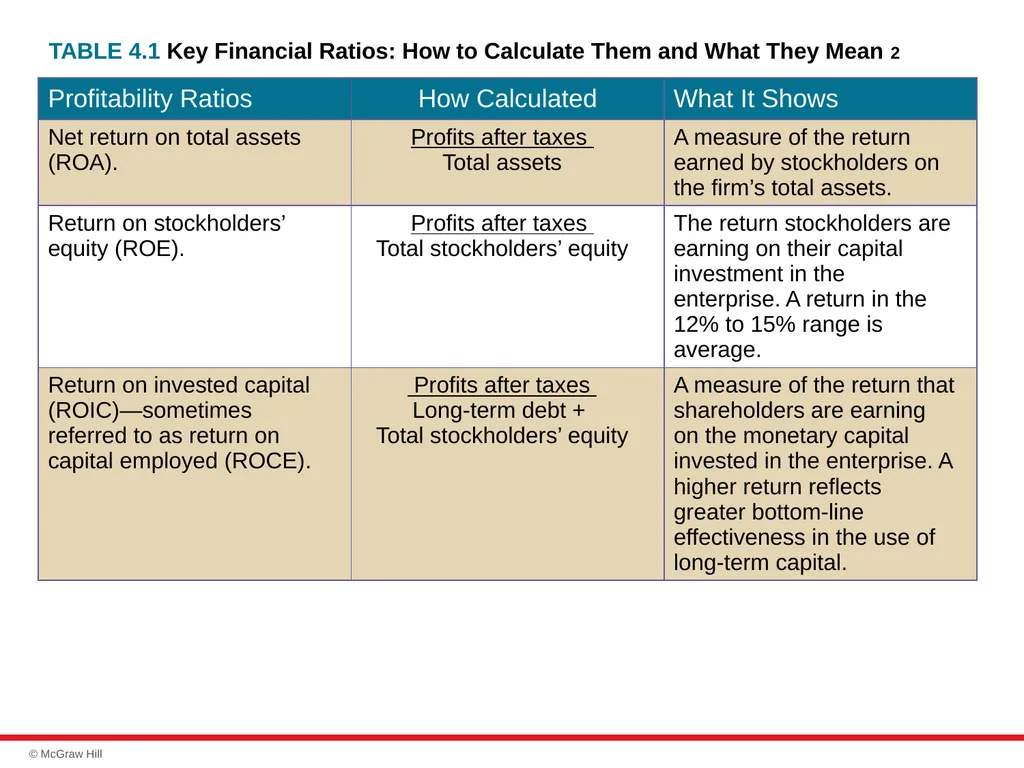
TABLE 4.1 Key Financial Ratios: How to Calculate Them and What They Mean 2<br>
10
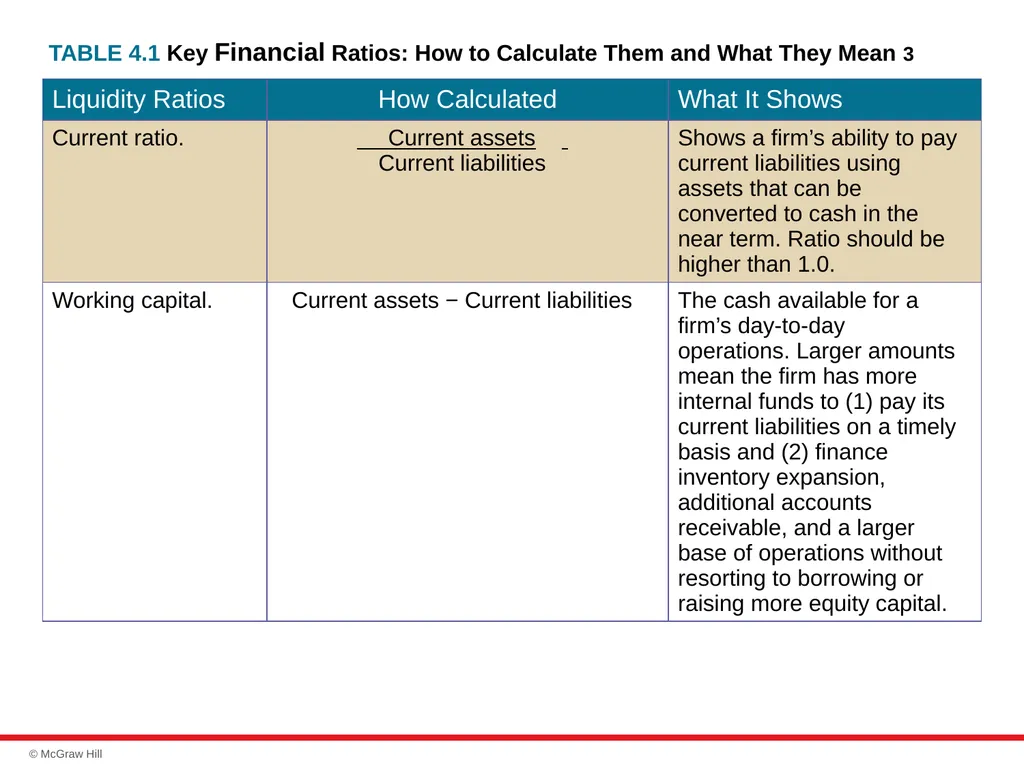
TABLE 4.1 Key Financial Ratios: How to Calculate Them and What They Mean 3<br>
11
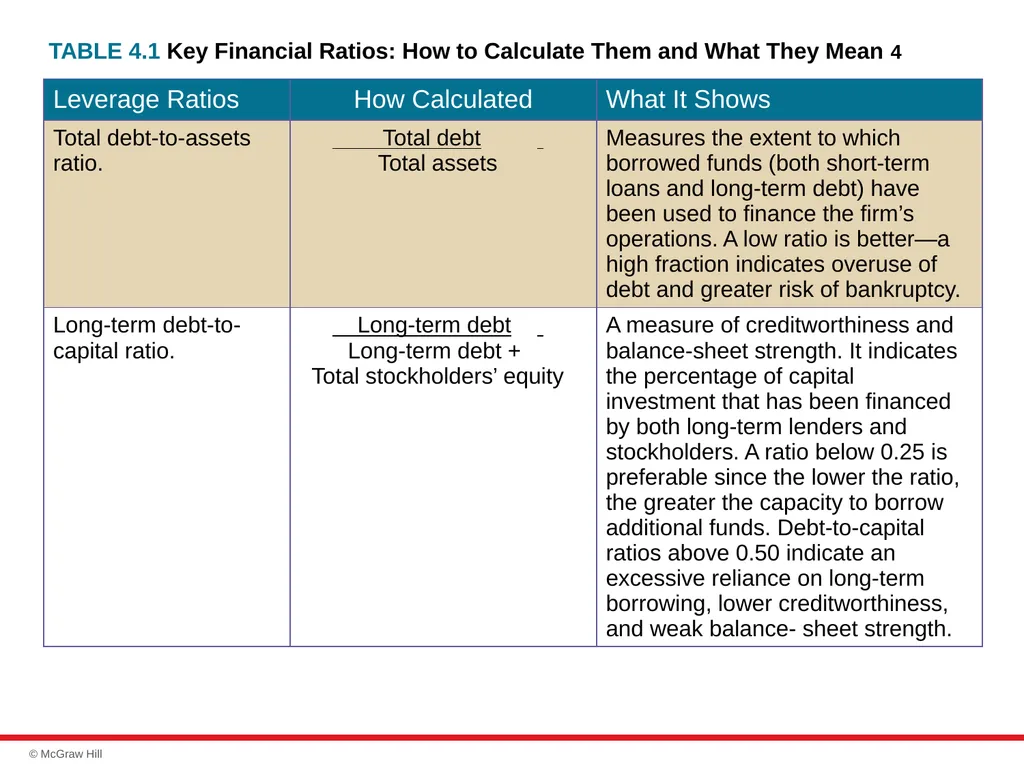
TABLE 4.1 Key Financial Ratios: How to Calculate Them and What They Mean 4<br>
12
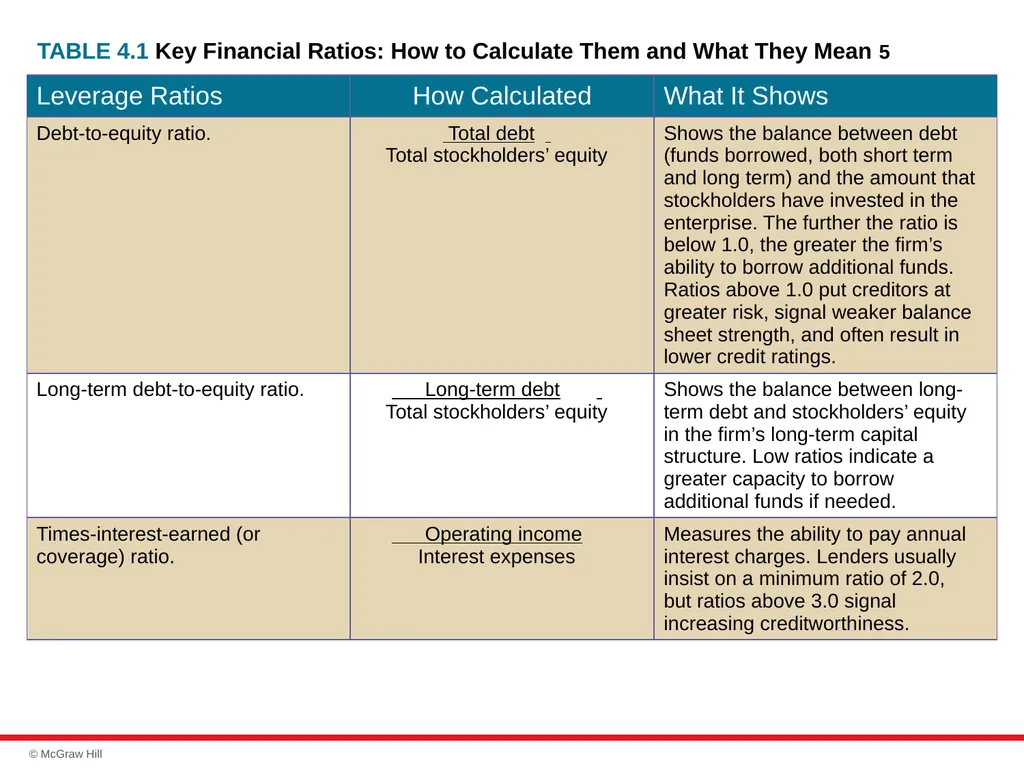
TABLE 4.1 Key Financial Ratios: How to Calculate Them and What They Mean 5<br>
13
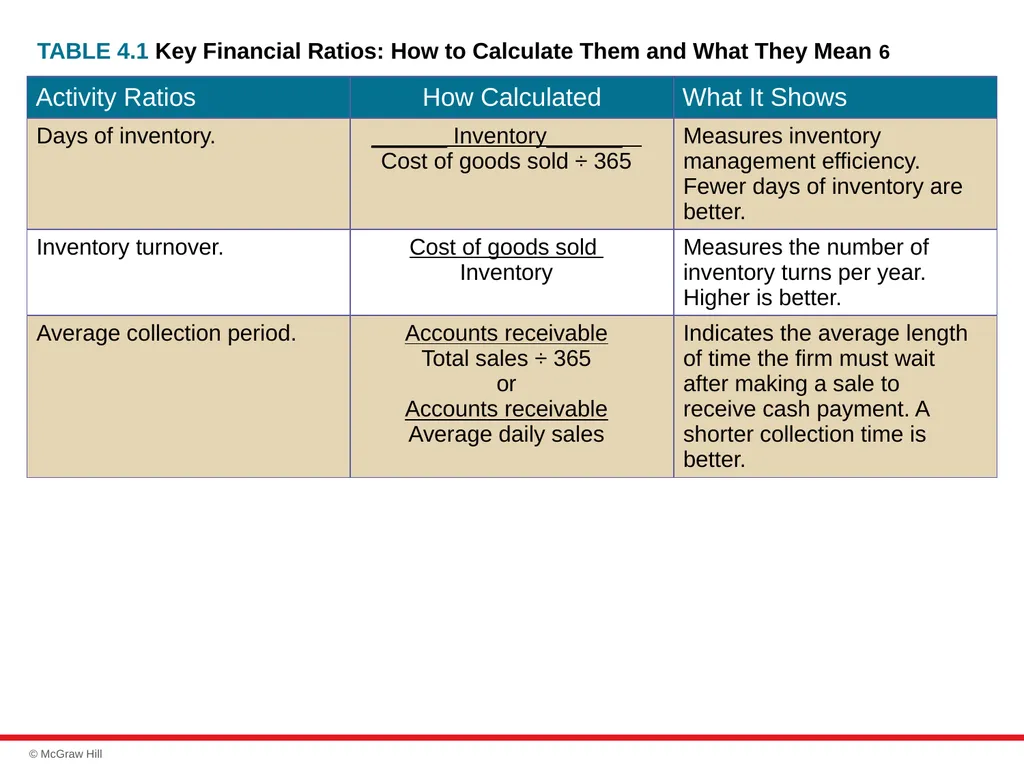
TABLE 4.1 Key Financial Ratios: How to Calculate Them and What They Mean 6<br>
14
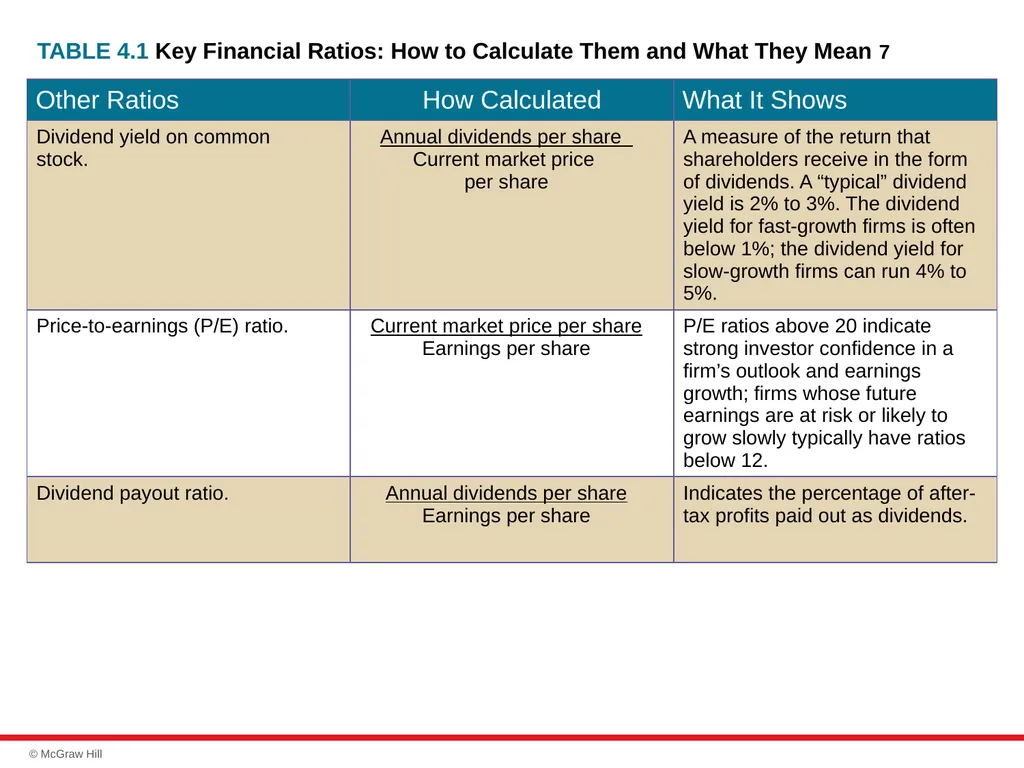
TABLE 4.1 Key Financial Ratios: How to Calculate Them and What They Mean 7<br>
15
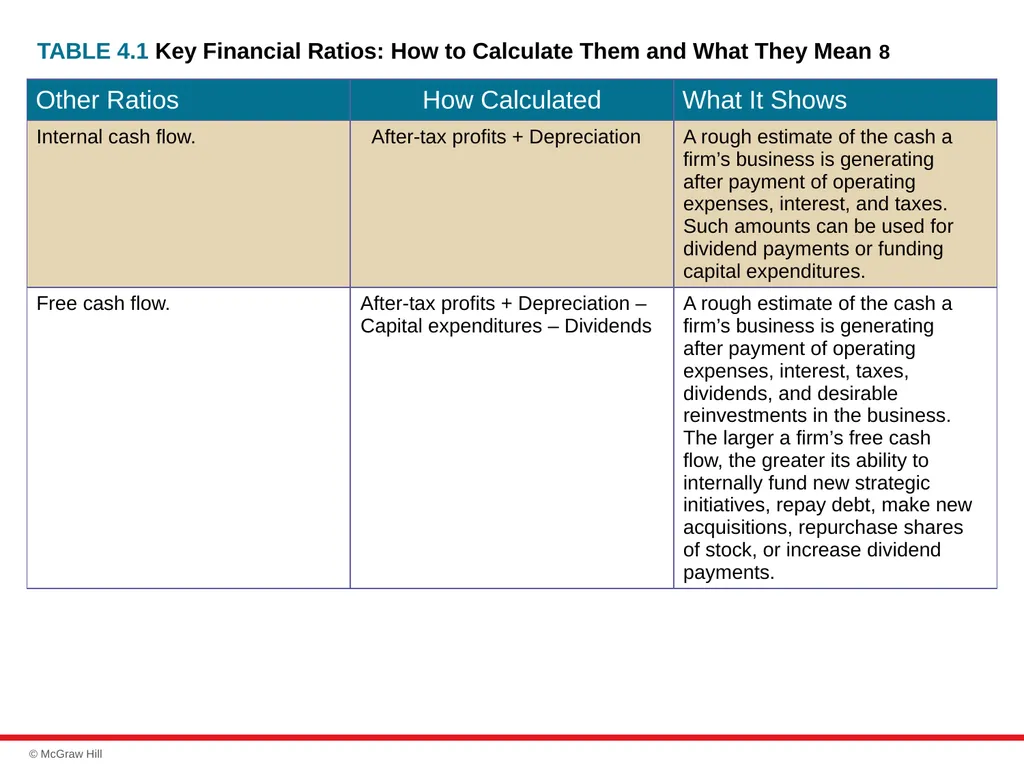
TABLE 4.1 Key Financial Ratios: How to Calculate Them and What They Mean 8<br>
16
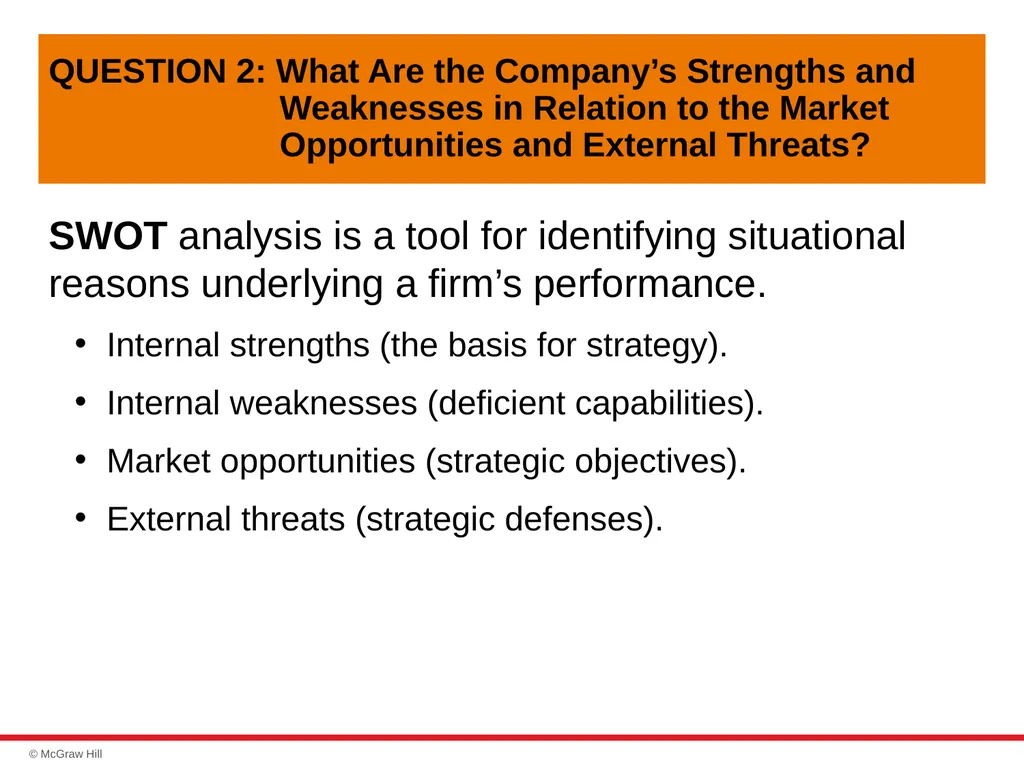
QUESTION 2: What Are the Company’s Strengths and Weaknesses in Relation to the Market Opportunities and External Threats? SWOT analysis is a tool for identifying situational reasons underlying a firm’s performance.
Internal strengths (the basis for strategy).
Internal weaknesses (deficient capabilities).
Market opportunities (strategic objectives).
External threats (strategic defenses).<br>
Internal strengths (the basis for strategy).
Internal weaknesses (deficient capabilities).
Market opportunities (strategic objectives).
External threats (strategic defenses).<br>
17
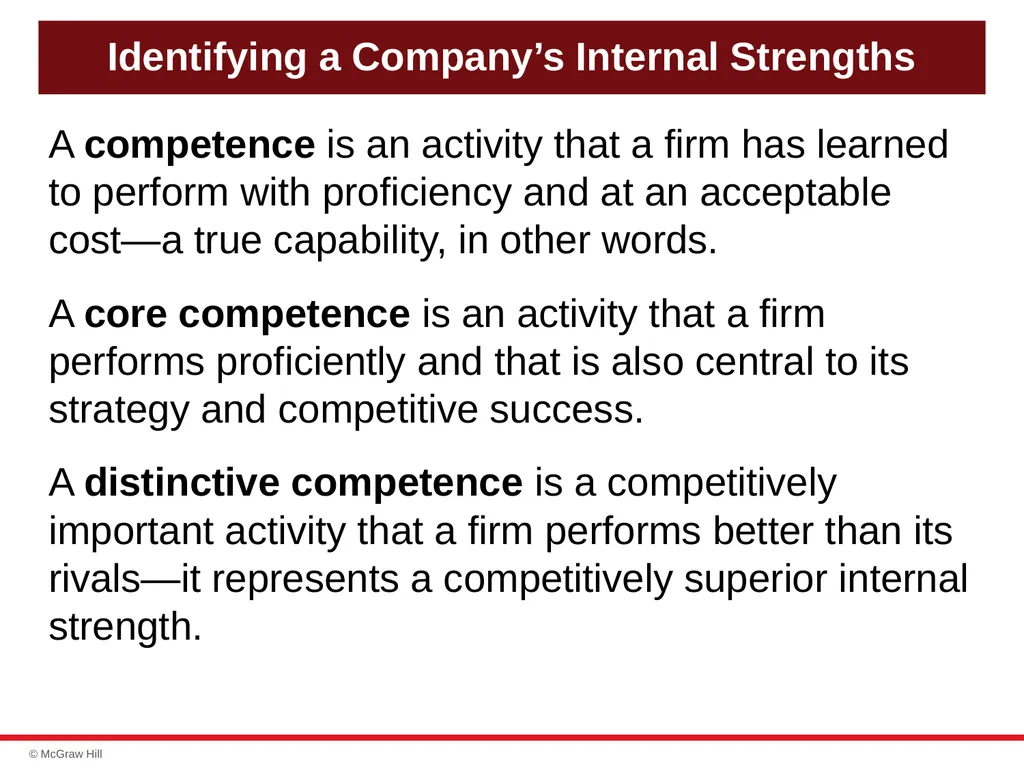
Identifying a Company’s Internal Strengths A competence is an activity that a firm has learned to perform with proficiency and at an acceptable cost—a true capability, in other words.
A core competence is an activity that a firm performs proficiently and that is also central to its strategy and competitive success.
A distinctive competence is a competitively important activity that a firm performs better than its rivals—it represents a competitively superior internal strength.<br>
A core competence is an activity that a firm performs proficiently and that is also central to its strategy and competitive success.
A distinctive competence is a competitively important activity that a firm performs better than its rivals—it represents a competitively superior internal strength.<br>
18
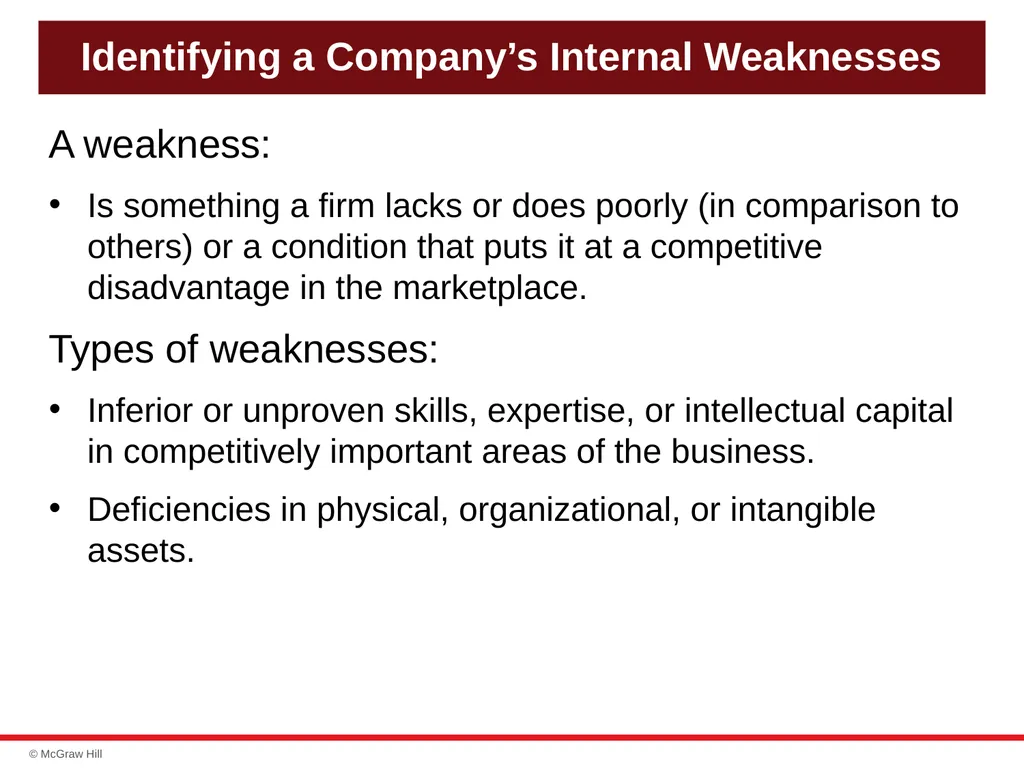
Identifying a Company’s Internal Weaknesses A weakness:
Is something a firm lacks or does poorly (in comparison to others) or a condition that puts it at a competitive disadvantage in the marketplace.
Types of weaknesses:
Inferior or unproven skills, expertise, or intellectual capital in competitively important areas of the business.
Deficiencies in physical, organizational, or intangible assets.<br>
Is something a firm lacks or does poorly (in comparison to others) or a condition that puts it at a competitive disadvantage in the marketplace.
Types of weaknesses:
Inferior or unproven skills, expertise, or intellectual capital in competitively important areas of the business.
Deficiencies in physical, organizational, or intangible assets.<br>
19
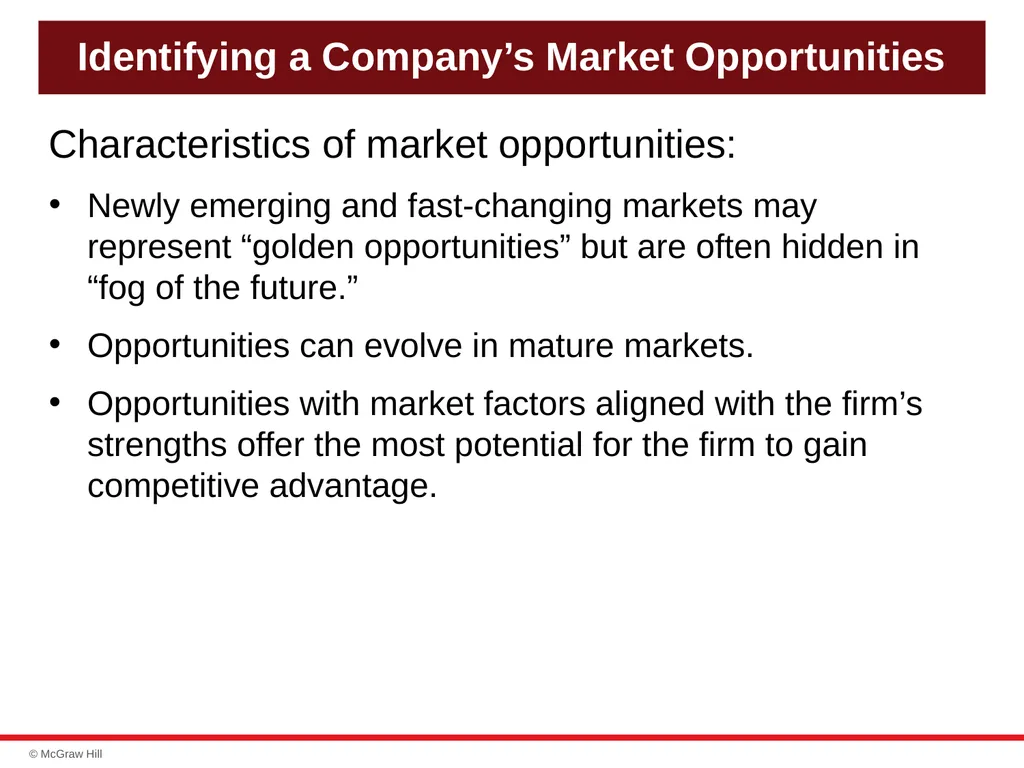
Identifying a Company’s Market Opportunities Characteristics of market opportunities:
Newly emerging and fast-changing markets may represent “golden opportunities” but are often hidden in “fog of the future.”
Opportunities can evolve in mature markets.
Opportunities with market factors aligned with the firm’s strengths offer the most potential for the firm to gain competitive advantage.<br>
Newly emerging and fast-changing markets may represent “golden opportunities” but are often hidden in “fog of the future.”
Opportunities can evolve in mature markets.
Opportunities with market factors aligned with the firm’s strengths offer the most potential for the firm to gain competitive advantage.<br>
20
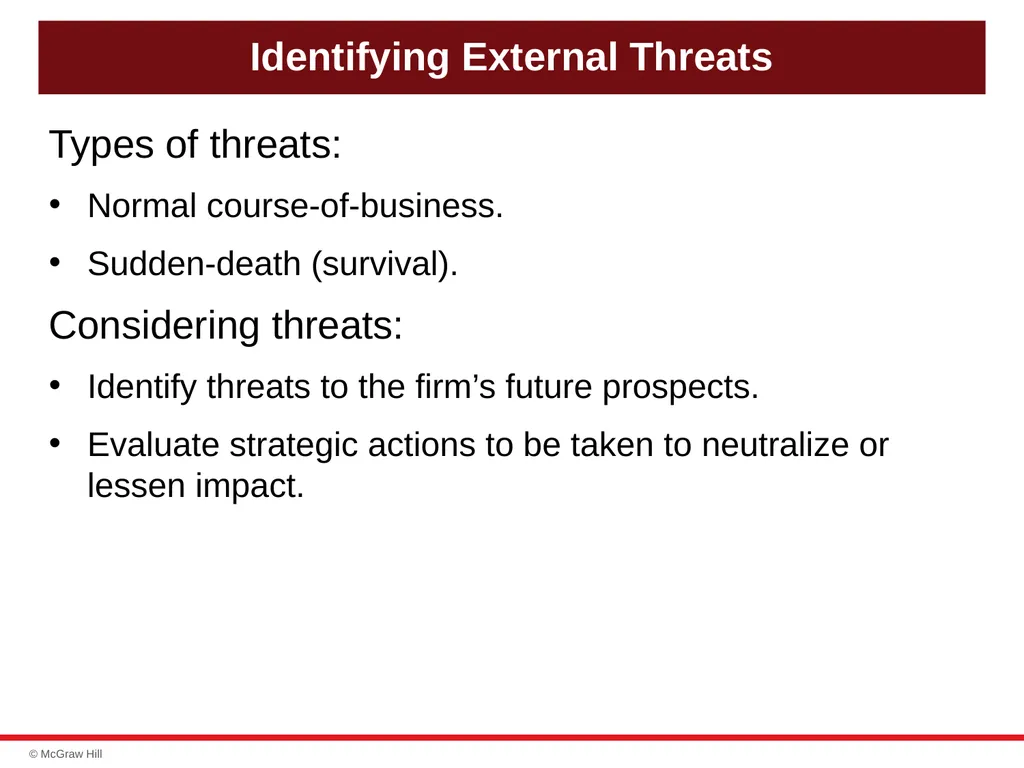
Identifying External Threats Types of threats:
Normal course-of-business.
Sudden-death (survival).
Considering threats:
Identify threats to the firm’s future prospects.
Evaluate strategic actions to be taken to neutralize or lessen impact.<br>
Normal course-of-business.
Sudden-death (survival).
Considering threats:
Identify threats to the firm’s future prospects.
Evaluate strategic actions to be taken to neutralize or lessen impact.<br>
21
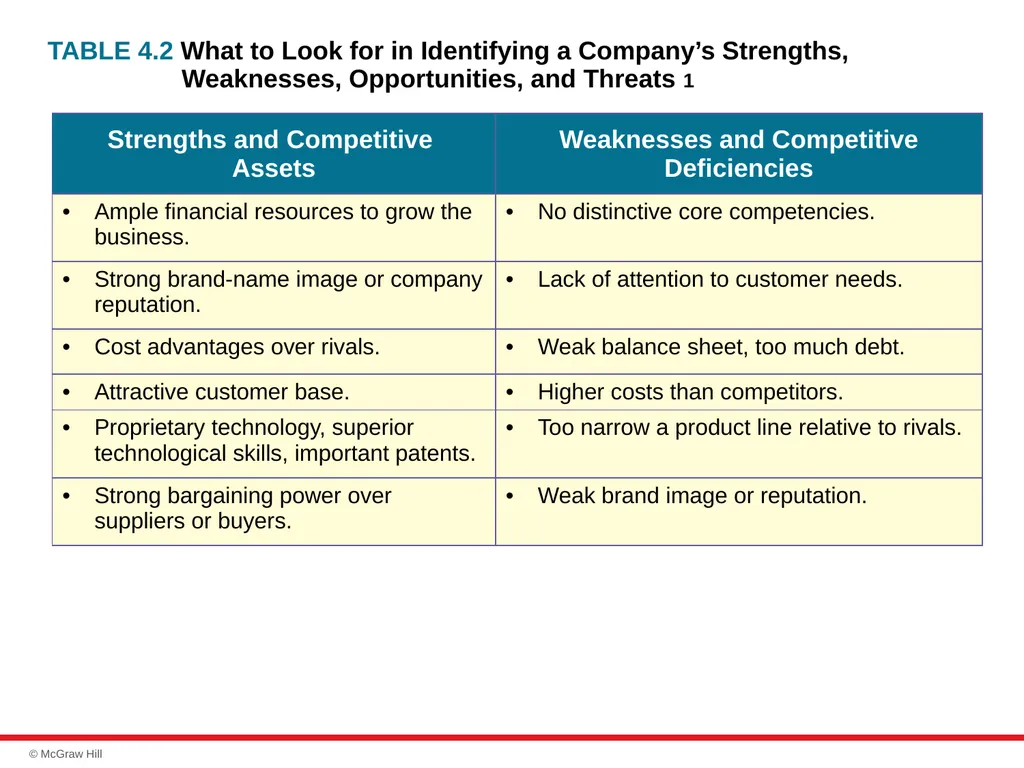
TABLE 4.2 What to Look for in Identifying a Company’s Strengths, Weaknesses, Opportunities, and Threats 1<br>
22
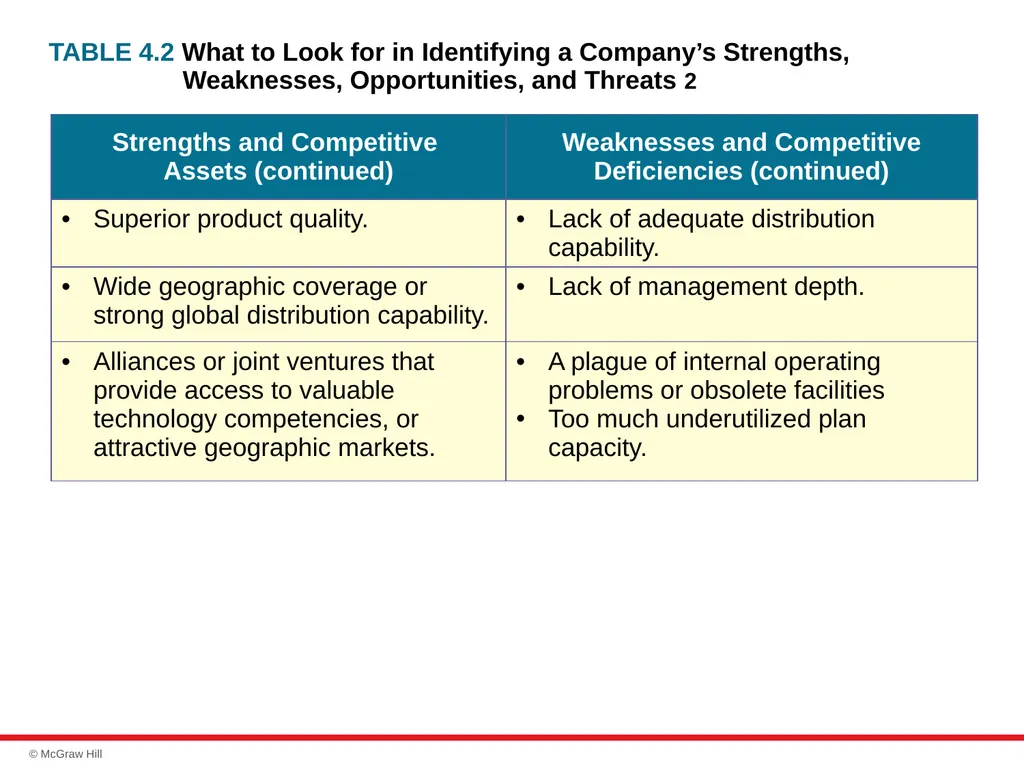
TABLE 4.2 What to Look for in Identifying a Company’s Strengths, Weaknesses, Opportunities, and Threats 2<br>
23
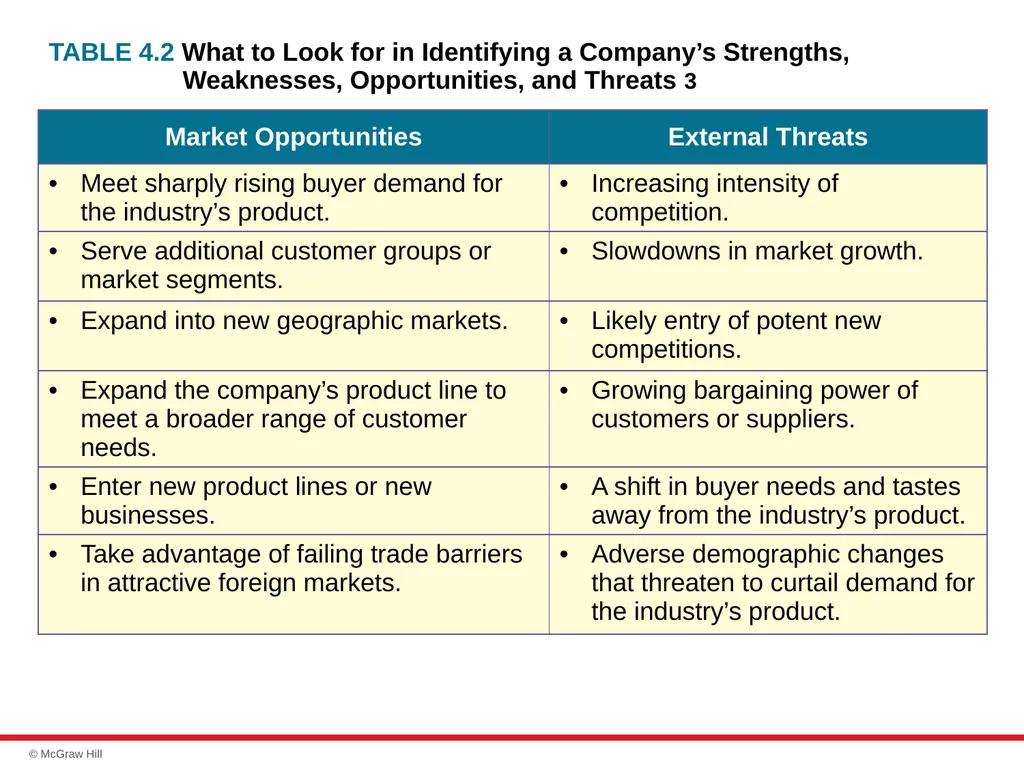
TABLE 4.2 What to Look for in Identifying a Company’s Strengths, Weaknesses, Opportunities, and Threats 3<br>
24
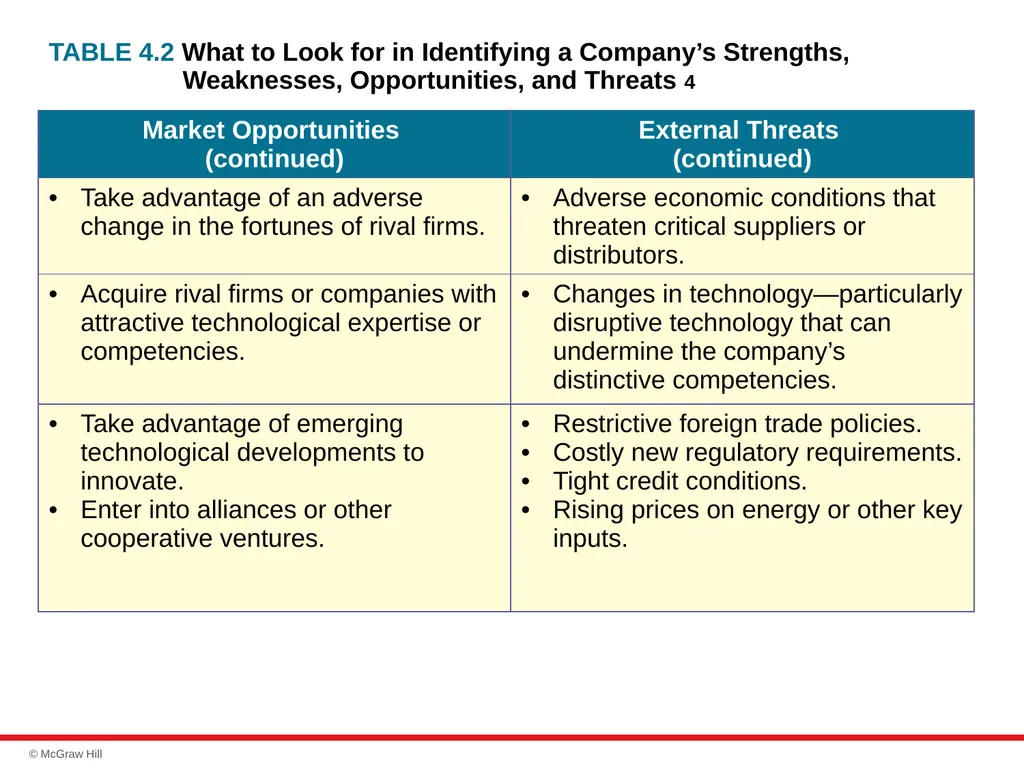
TABLE 4.2 What to Look for in Identifying a Company’s Strengths, Weaknesses, Opportunities, and Threats 4<br>
25
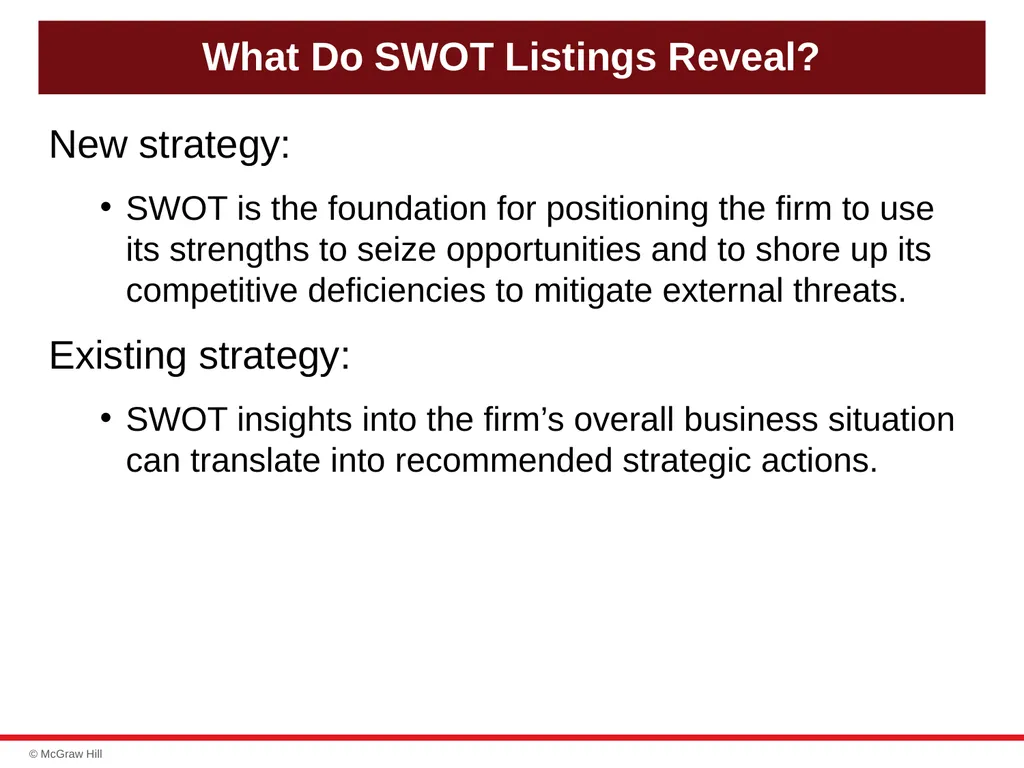
What Do SWOT Listings Reveal? New strategy:
SWOT is the foundation for positioning the firm to use its strengths to seize opportunities and to shore up its competitive deficiencies to mitigate external threats.
Existing strategy:
SWOT insights into the firm’s overall business situation can translate into recommended strategic actions.<br>
SWOT is the foundation for positioning the firm to use its strengths to seize opportunities and to shore up its competitive deficiencies to mitigate external threats.
Existing strategy:
SWOT insights into the firm’s overall business situation can translate into recommended strategic actions.<br>
26
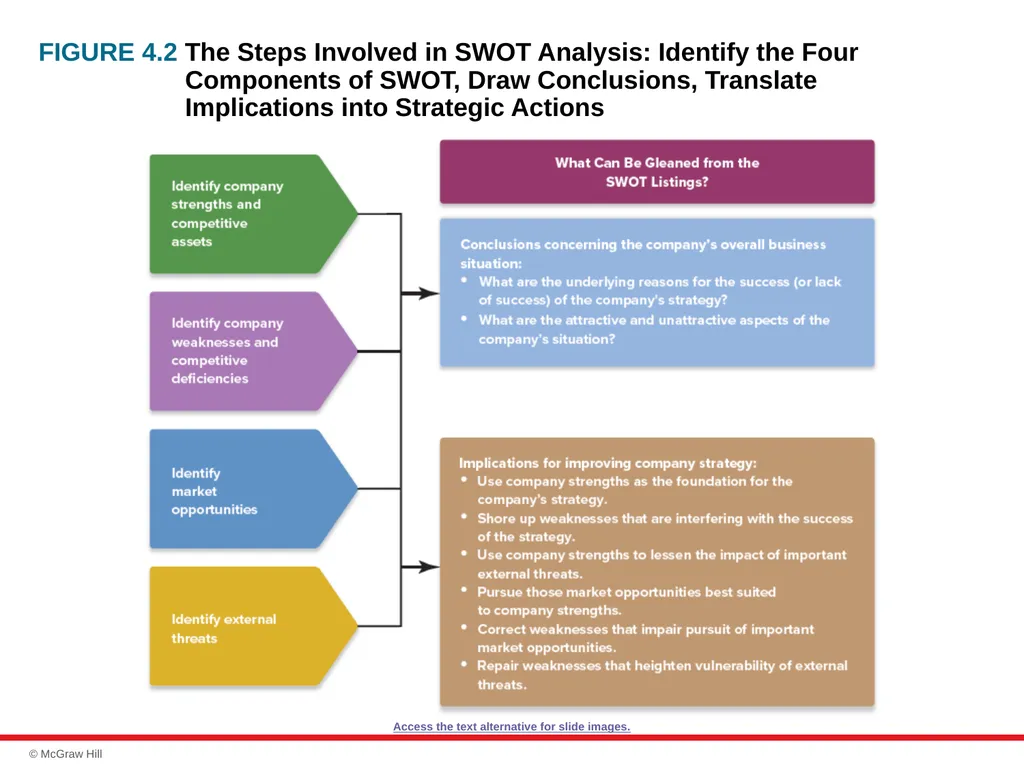
FIGURE 4.2 The Steps Involved in SWOT Analysis: Identify the Four Components of SWOT, Draw Conclusions, Translate Implications into Strategic Actions Access the text alternative for slide images.<br>
27
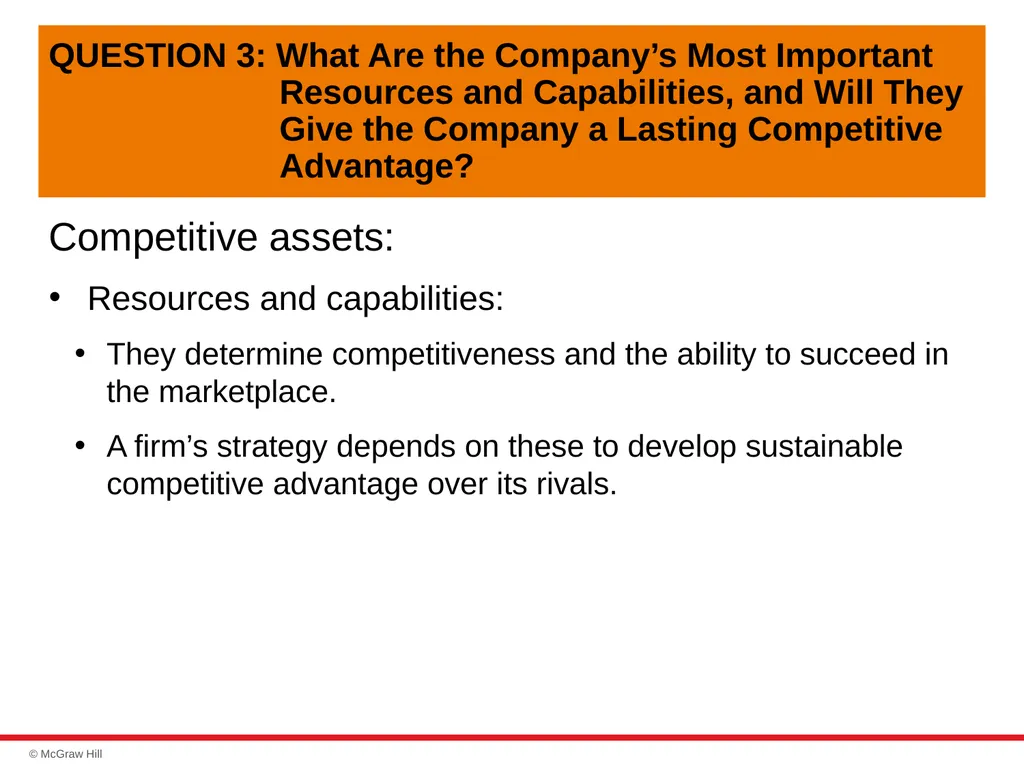
QUESTION 3: What Are the Company’s Most Important Resources and Capabilities, and Will They Give the Company a Lasting Competitive Advantage? Competitive assets:
Resources and capabilities:
They determine competitiveness and the ability to succeed in the marketplace.
A firm’s strategy depends on these to develop sustainable competitive advantage over its rivals.<br>
Resources and capabilities:
They determine competitiveness and the ability to succeed in the marketplace.
A firm’s strategy depends on these to develop sustainable competitive advantage over its rivals.<br>
28
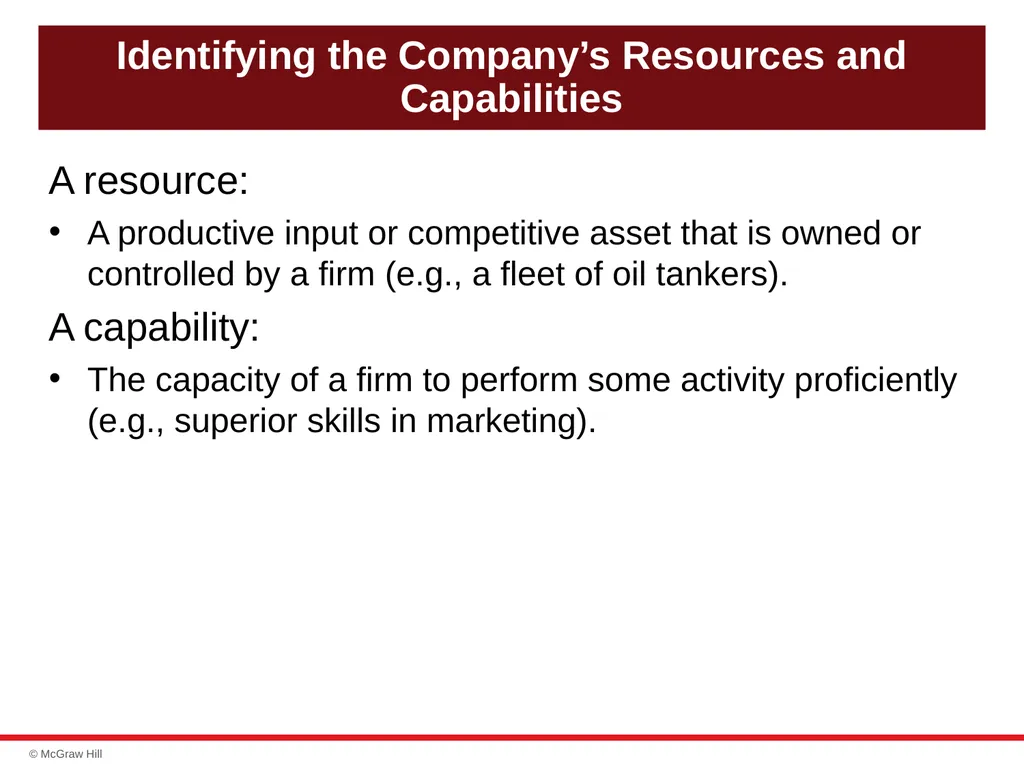
Identifying the Company’s Resources and Capabilities A resource:
A productive input or competitive asset that is owned or controlled by a firm (e.g., a fleet of oil tankers).
A capability:
The capacity of a firm to perform some activity proficiently (e.g., superior skills in marketing).<br>
A productive input or competitive asset that is owned or controlled by a firm (e.g., a fleet of oil tankers).
A capability:
The capacity of a firm to perform some activity proficiently (e.g., superior skills in marketing).<br>
29
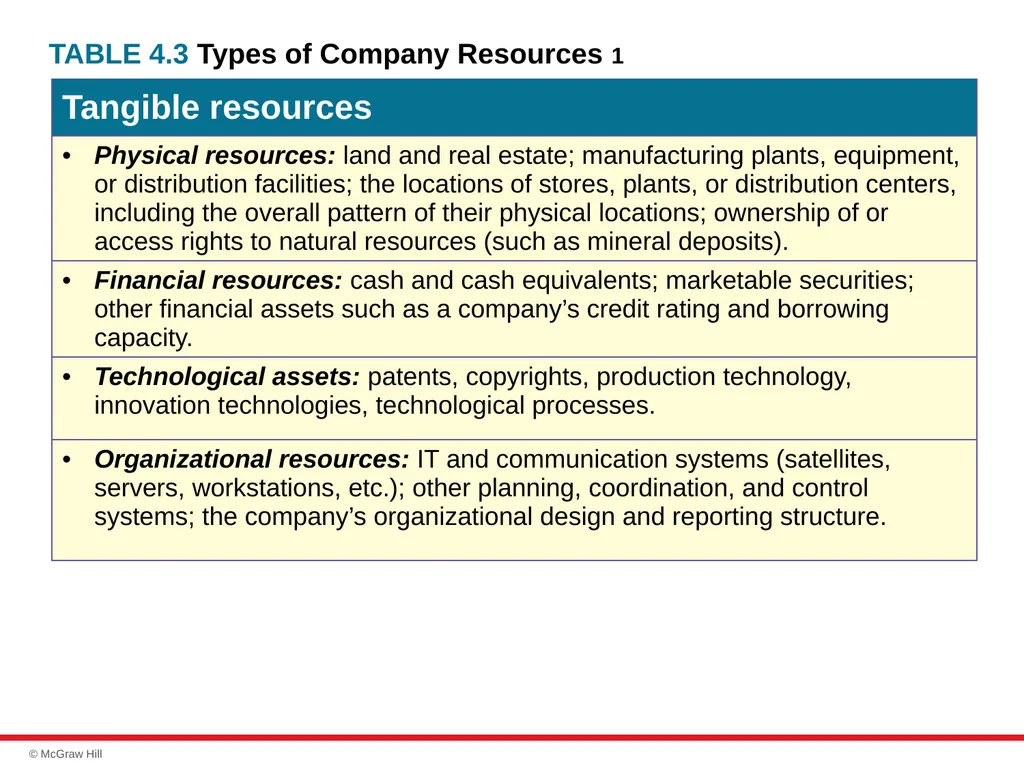
TABLE 4.3 Types of Company Resources 1<br>
30
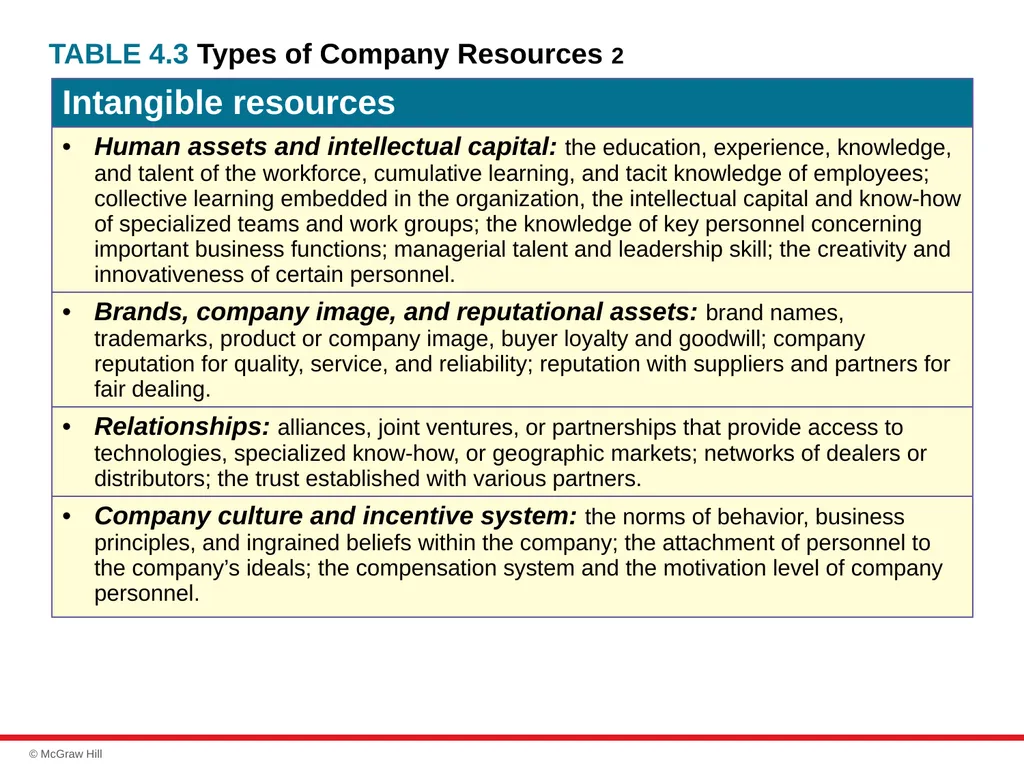
TABLE 4.3 Types of Company Resources 2<br>
31
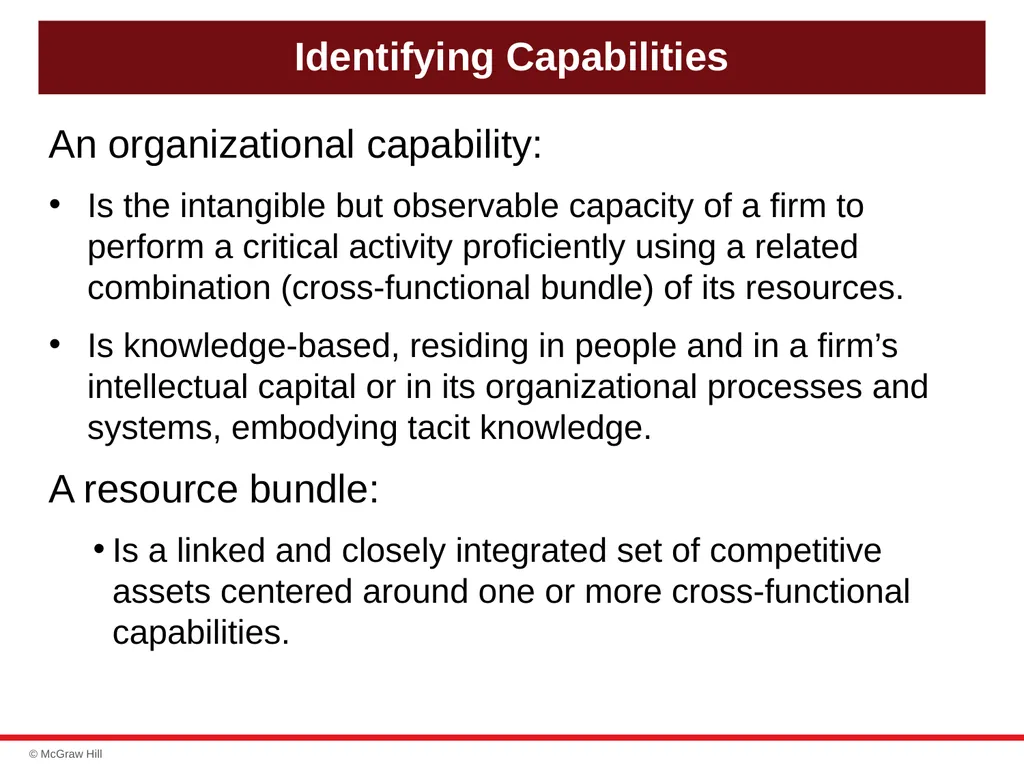
Identifying Capabilities An organizational capability:
Is the intangible but observable capacity of a firm to perform a critical activity proficiently using a related combination (cross-functional bundle) of its resources.
Is knowledge-based, residing in people and in a firm’s intellectual capital or in its organizational processes and systems, embodying tacit knowledge.
A resource bundle:
Is a linked and closely integrated set of competitive assets centered around one or more cross-functional capabilities.<br>
Is the intangible but observable capacity of a firm to perform a critical activity proficiently using a related combination (cross-functional bundle) of its resources.
Is knowledge-based, residing in people and in a firm’s intellectual capital or in its organizational processes and systems, embodying tacit knowledge.
A resource bundle:
Is a linked and closely integrated set of competitive assets centered around one or more cross-functional capabilities.<br>
32
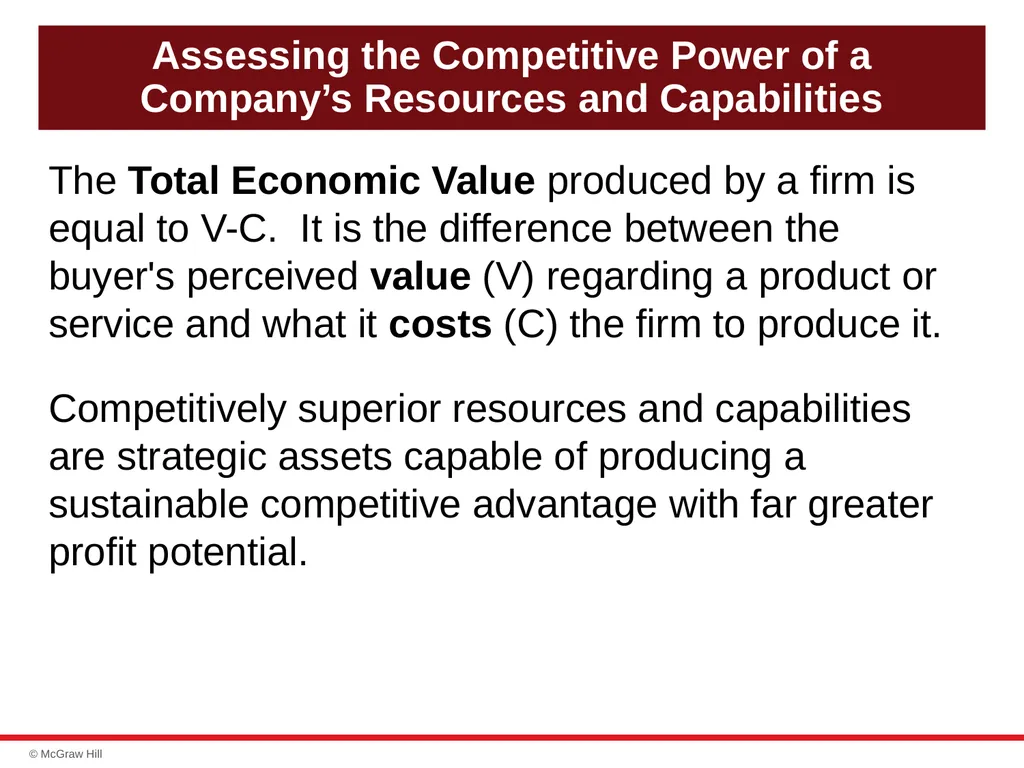
Assessing the Competitive Power of a Company’s Resources and Capabilities The Total Economic Value produced by a firm is equal to V-C. It is the difference between the buyer's perceived value (V) regarding a product or service and what it costs (C) the firm to produce it.
Competitively superior resources and capabilities are strategic assets capable of producing a sustainable competitive advantage with far greater profit potential.<br>
Competitively superior resources and capabilities are strategic assets capable of producing a sustainable competitive advantage with far greater profit potential.<br>
33
VRIN: Four Tests of a Resource’s
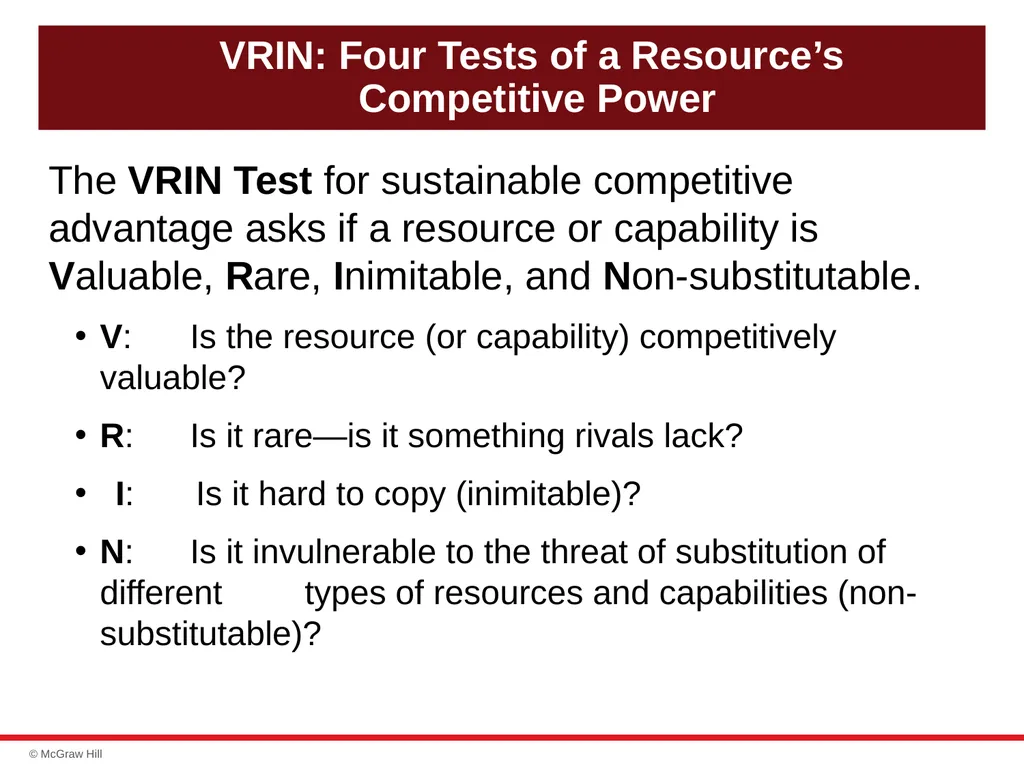
Competitive Power The VRIN Test for sustainable competitive advantage asks if a resource or capability is Valuable, Rare, Inimitable, and Non-substitutable.
V: Is the resource (or capability) competitively valuable?
R: Is it rare—is it something rivals lack?
I: Is it hard to copy (inimitable)?
N: Is it invulnerable to the threat of substitution of different types of resources and capabilities (non-substitutable)?<br>
V: Is the resource (or capability) competitively valuable?
R: Is it rare—is it something rivals lack?
I: Is it hard to copy (inimitable)?
N: Is it invulnerable to the threat of substitution of different types of resources and capabilities (non-substitutable)?<br>
34
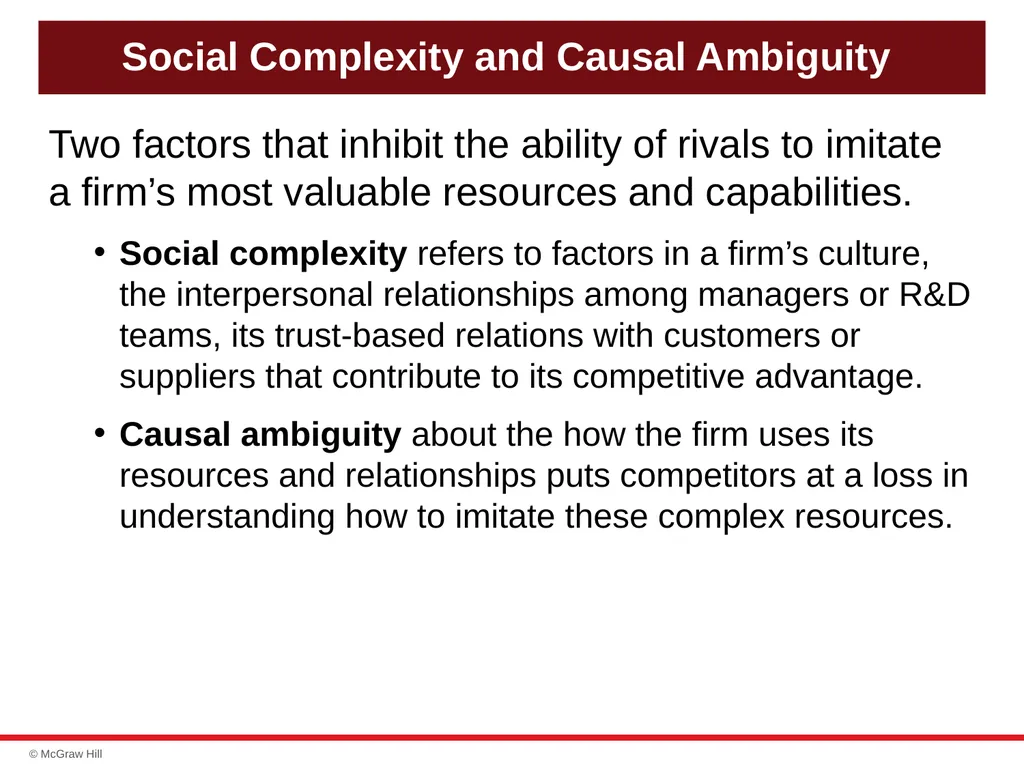
Social Complexity and Causal Ambiguity Two factors that inhibit the ability of rivals to imitate a firm’s most valuable resources and capabilities.
Social complexity refers to factors in a firm’s culture, the interpersonal relationships among managers or R&D teams, its trust-based relations with customers or suppliers that contribute to its competitive advantage.
Causal ambiguity about the how the firm uses its resources and relationships puts competitors at a loss in understanding how to imitate these complex resources.<br>
Social complexity refers to factors in a firm’s culture, the interpersonal relationships among managers or R&D teams, its trust-based relations with customers or suppliers that contribute to its competitive advantage.
Causal ambiguity about the how the firm uses its resources and relationships puts competitors at a loss in understanding how to imitate these complex resources.<br>
35
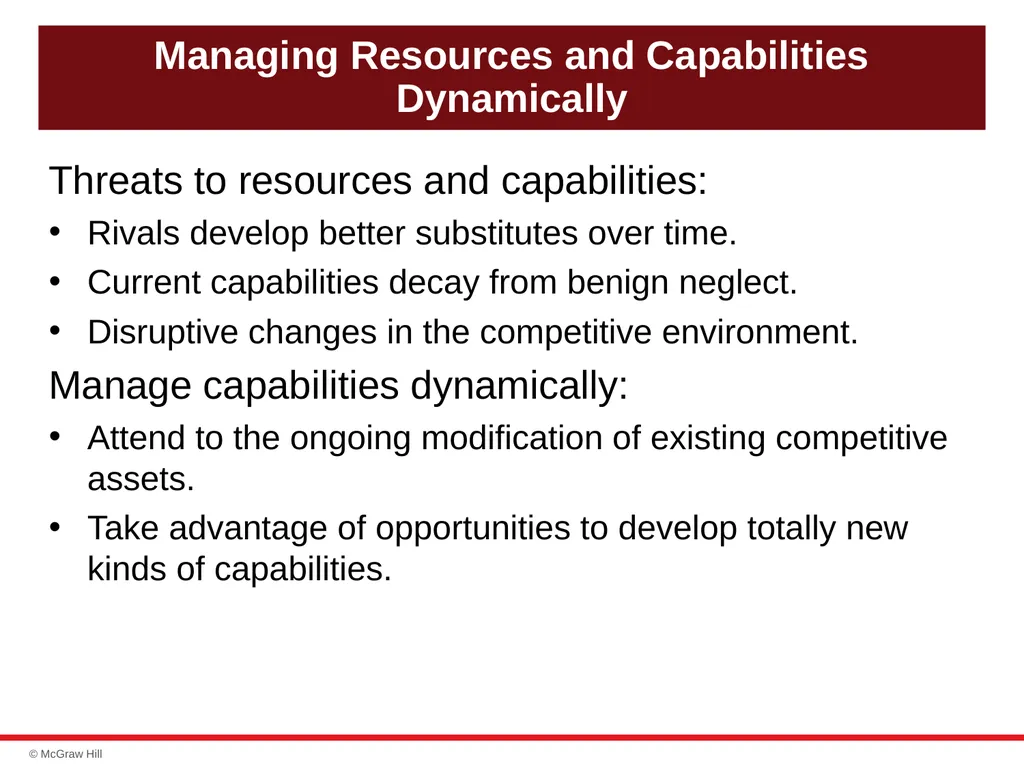
Managing Resources and Capabilities Dynamically Threats to resources and capabilities:
Rivals develop better substitutes over time.
Current capabilities decay from benign neglect.
Disruptive changes in the competitive environment.
Manage capabilities dynamically:
Attend to the ongoing modification of existing competitive assets.
Take advantage of opportunities to develop totally new kinds of capabilities.<br>
Rivals develop better substitutes over time.
Current capabilities decay from benign neglect.
Disruptive changes in the competitive environment.
Manage capabilities dynamically:
Attend to the ongoing modification of existing competitive assets.
Take advantage of opportunities to develop totally new kinds of capabilities.<br>
36
The Role of Dynamic Capabilities To sustain its competitiveness and help drive improvements in its performance, a firm requires a dynamically evolving portfolio of resources and capabilities.
A dynamic capability is the ongoing capacity of a firm to modify its existing resources and capabilities or create new ones.
Improve on existing resources and capabilities incrementally.
Add new resources and capabilities to the firm’s competitive asset portfolio.<br>
A dynamic capability is the ongoing capacity of a firm to modify its existing resources and capabilities or create new ones.
Improve on existing resources and capabilities incrementally.
Add new resources and capabilities to the firm’s competitive asset portfolio.<br>
37
QUESTION 4: How Do Value Chain Activities Impact a Company’s Cost Structure and Its Customer Value Proposition? Signs of a firm’s competitive strength:
Its prices and costs are in line with rivals.
Its customer-value proposition is competitive and cost effective.
Its bundled capabilities are yielding a sustainable competitive advantage.<br>
Its prices and costs are in line with rivals.
Its customer-value proposition is competitive and cost effective.
Its bundled capabilities are yielding a sustainable competitive advantage.<br>
38
The Concept of a Company Value Chain The value chain:
Identifies the primary activities and related support activities that create customer value.
Identifies the inner workings of the firm's customer value proposition and business model.
Permits a deep look at the firm’s cost structure and its ability to profitably offer low prices.
Reveals the emphasis that a firm places on activities that enhance differentiation and support higher prices.<br>
Identifies the primary activities and related support activities that create customer value.
Identifies the inner workings of the firm's customer value proposition and business model.
Permits a deep look at the firm’s cost structure and its ability to profitably offer low prices.
Reveals the emphasis that a firm places on activities that enhance differentiation and support higher prices.<br>
39
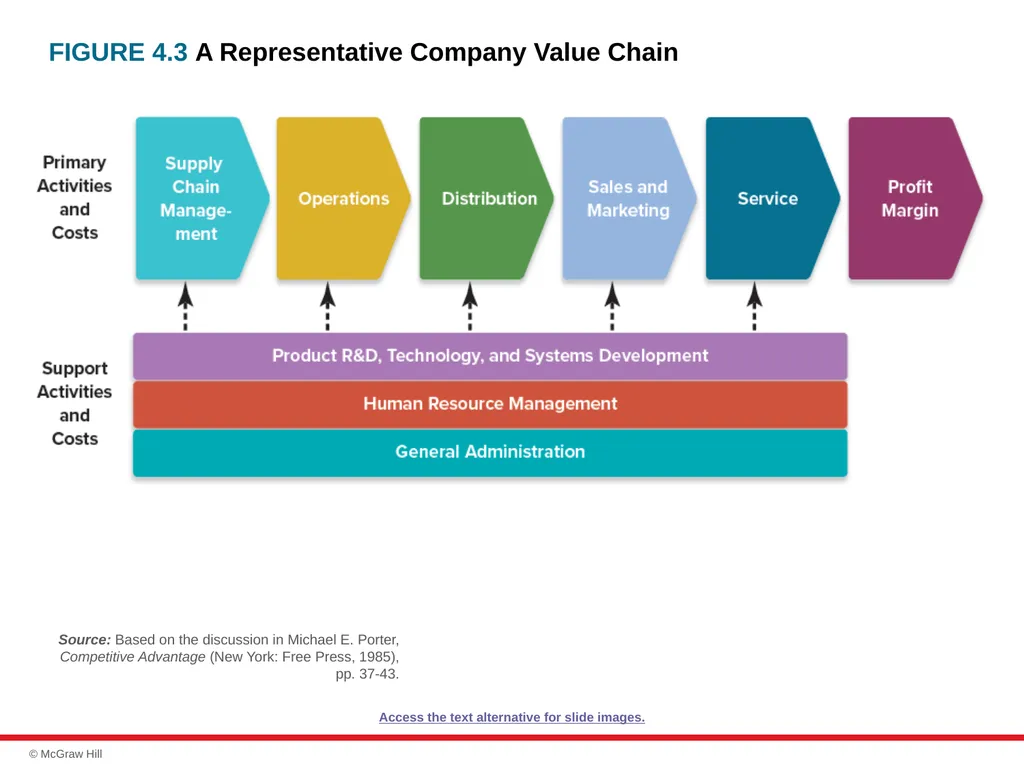
FIGURE 4.3 A Representative Company Value Chain Access the text alternative for slide images. Source: Based on the discussion in Michael E. Porter, Competitive Advantage (New York: Free Press, 1985), pp. 37-43.<br>
40
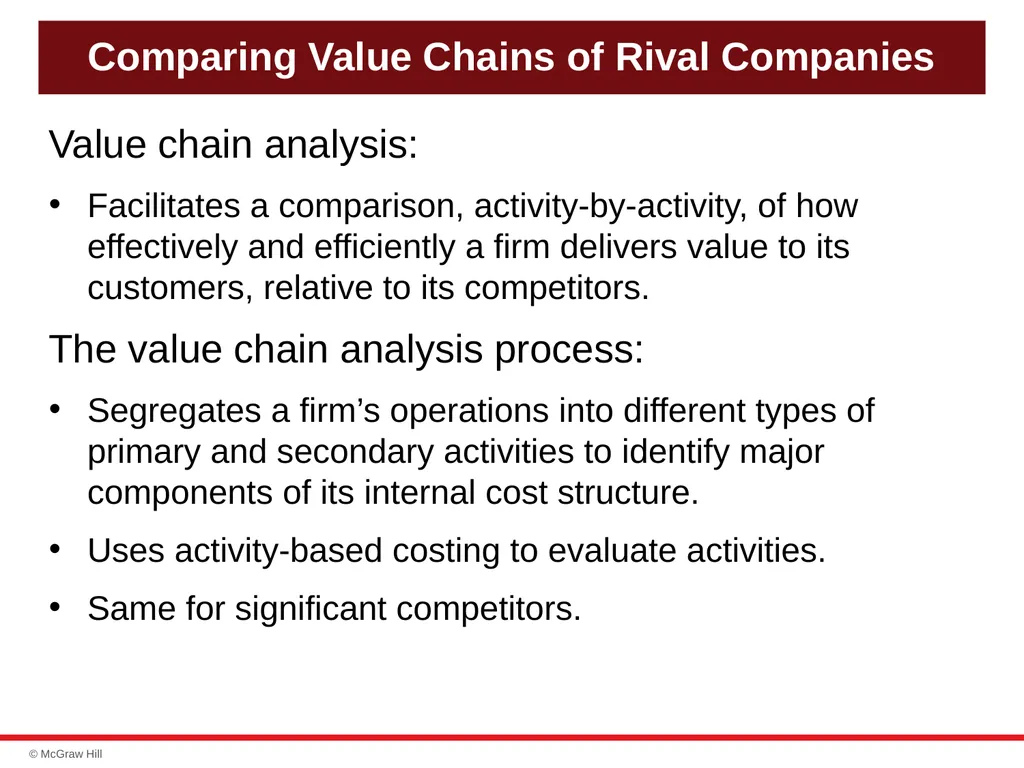
Comparing Value Chains of Rival Companies Value chain analysis:
Facilitates a comparison, activity-by-activity, of how effectively and efficiently a firm delivers value to its customers, relative to its competitors.
The value chain analysis process:
Segregates a firm’s operations into different types of primary and secondary activities to identify major components of its internal cost structure.
Uses activity-based costing to evaluate activities.
Same for significant competitors.<br>
Facilitates a comparison, activity-by-activity, of how effectively and efficiently a firm delivers value to its customers, relative to its competitors.
The value chain analysis process:
Segregates a firm’s operations into different types of primary and secondary activities to identify major components of its internal cost structure.
Uses activity-based costing to evaluate activities.
Same for significant competitors.<br>
41
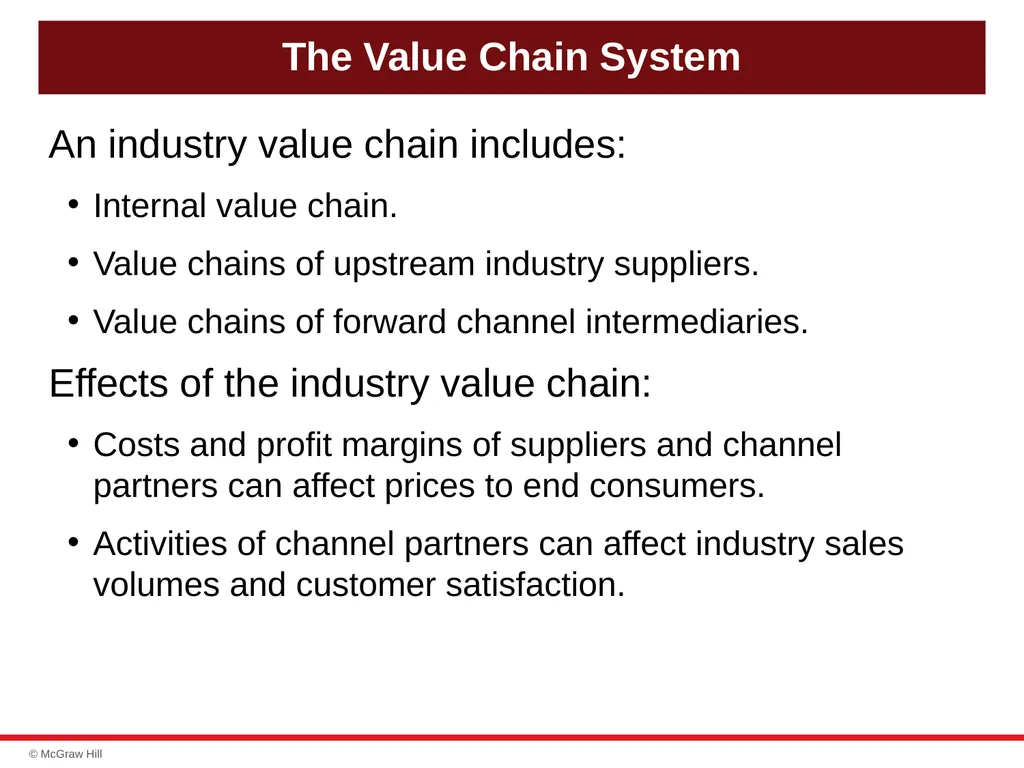
The Value Chain System An industry value chain includes:
Internal value chain.
Value chains of upstream industry suppliers.
Value chains of forward channel intermediaries.
Effects of the industry value chain:
Costs and profit margins of suppliers and channel partners can affect prices to end consumers.
Activities of channel partners can affect industry sales volumes and customer satisfaction.<br>
Internal value chain.
Value chains of upstream industry suppliers.
Value chains of forward channel intermediaries.
Effects of the industry value chain:
Costs and profit margins of suppliers and channel partners can affect prices to end consumers.
Activities of channel partners can affect industry sales volumes and customer satisfaction.<br>
42
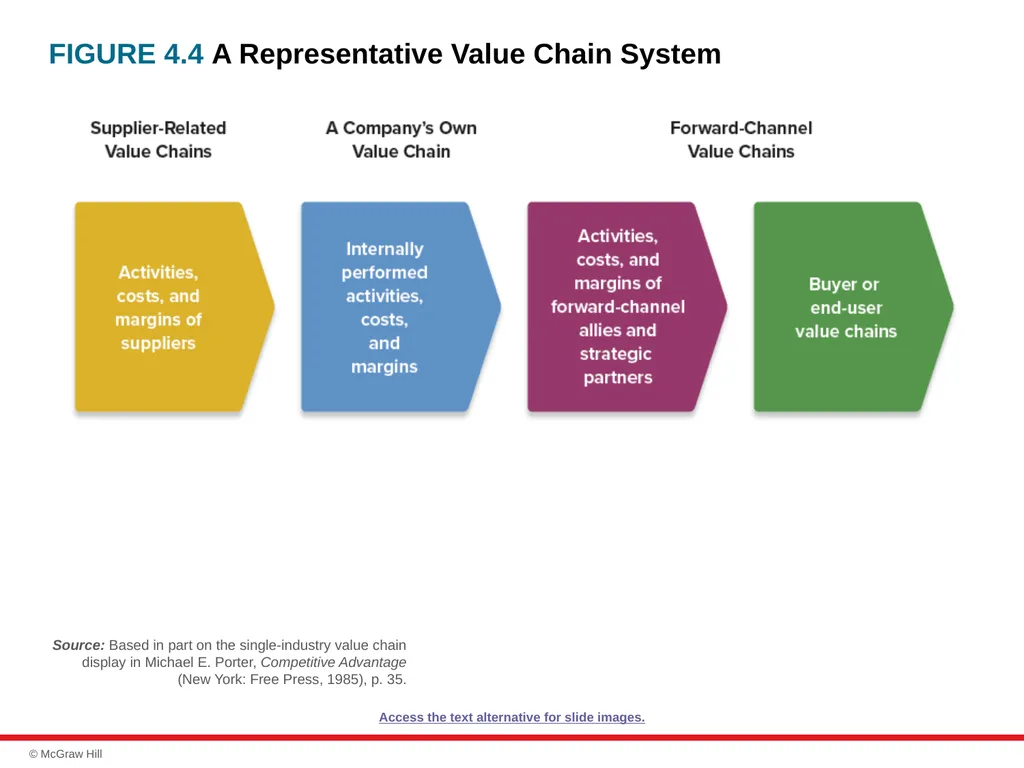
FIGURE 4.4 A Representative Value Chain System Access the text alternative for slide images. Source: Based in part on the single-industry value chain display in Michael E. Porter, Competitive Advantage (New York: Free Press, 1985), p. 35.<br>
43
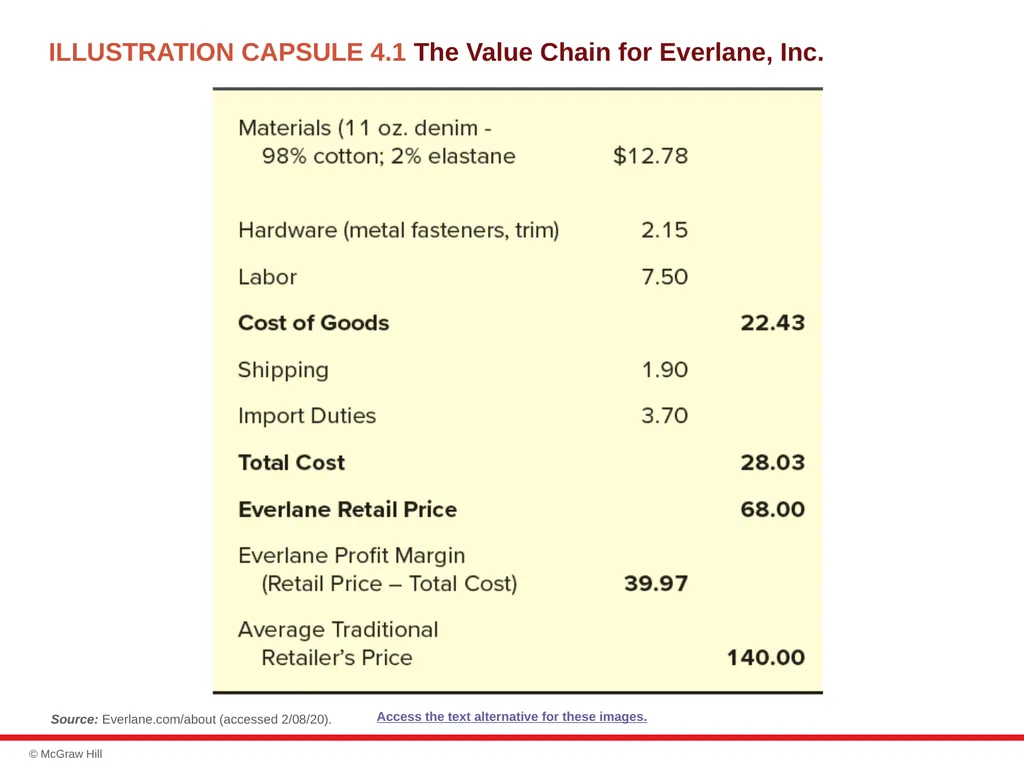
ILLUSTRATION CAPSULE 4.1 The Value Chain for Everlane, Inc. Source: Everlane.com/about (accessed 2/08/20). Access the text alternative for these images.<br>
44
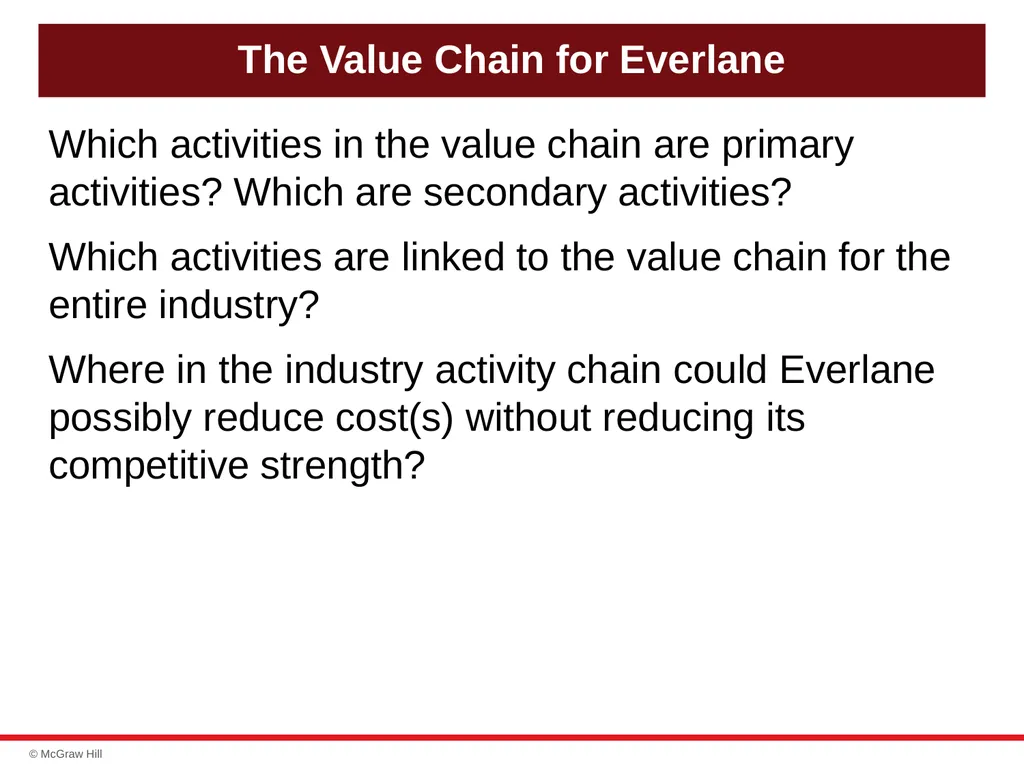
The Value Chain for Everlane Which activities in the value chain are primary activities? Which are secondary activities?
Which activities are linked to the value chain for the entire industry?
Where in the industry activity chain could Everlane possibly reduce cost(s) without reducing its competitive strength?<br>
Which activities are linked to the value chain for the entire industry?
Where in the industry activity chain could Everlane possibly reduce cost(s) without reducing its competitive strength?<br>
45
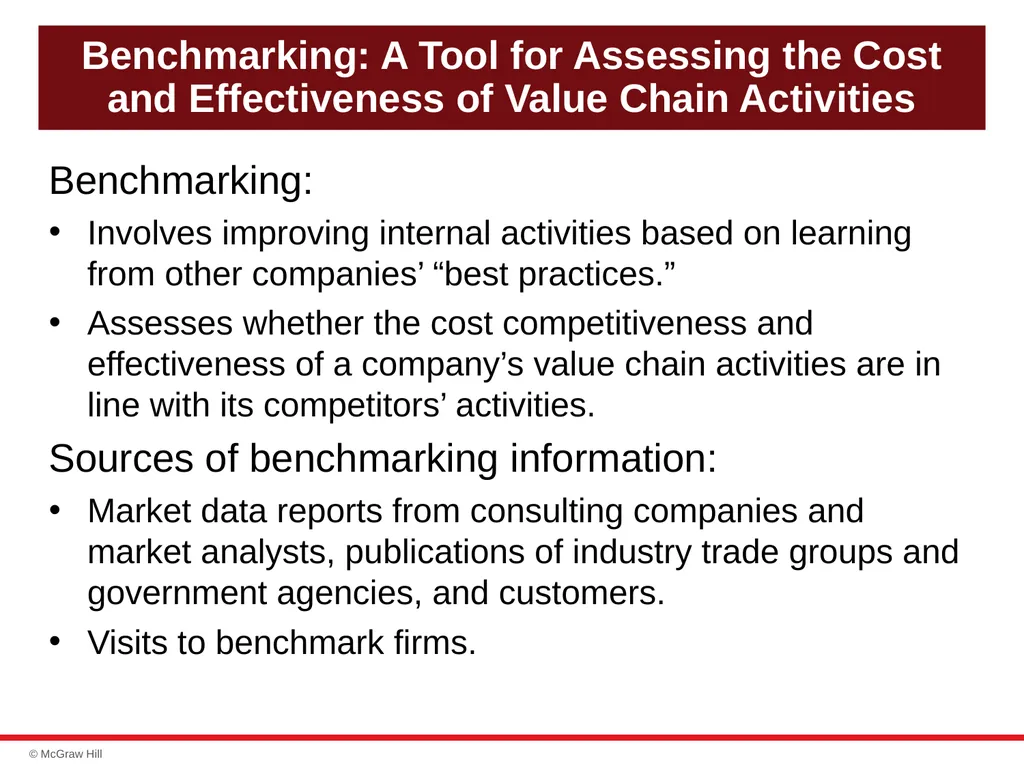
Benchmarking: A Tool for Assessing the Cost and Effectiveness of Value Chain Activities Benchmarking:
Involves improving internal activities based on learning from other companies’ “best practices.”
Assesses whether the cost competitiveness and effectiveness of a company’s value chain activities are in line with its competitors’ activities.
Sources of benchmarking information:
Market data reports from consulting companies and market analysts, publications of industry trade groups and government agencies, and customers.
Visits to benchmark firms.<br>
Involves improving internal activities based on learning from other companies’ “best practices.”
Assesses whether the cost competitiveness and effectiveness of a company’s value chain activities are in line with its competitors’ activities.
Sources of benchmarking information:
Market data reports from consulting companies and market analysts, publications of industry trade groups and government agencies, and customers.
Visits to benchmark firms.<br>
46
ILLUSTRATION CAPSULE 4.2 Benchmarking in the Solar Industry What benchmarks does the solar industry use in comparing costs among industry competitors?
How has SunPower responded to the continued downward pricing pressure in the industry?
Why is the collection of competitive intelligence to accurately benchmark delivered costs of such importance in the solar industry?<br>
How has SunPower responded to the continued downward pricing pressure in the industry?
Why is the collection of competitive intelligence to accurately benchmark delivered costs of such importance in the solar industry?<br>
47
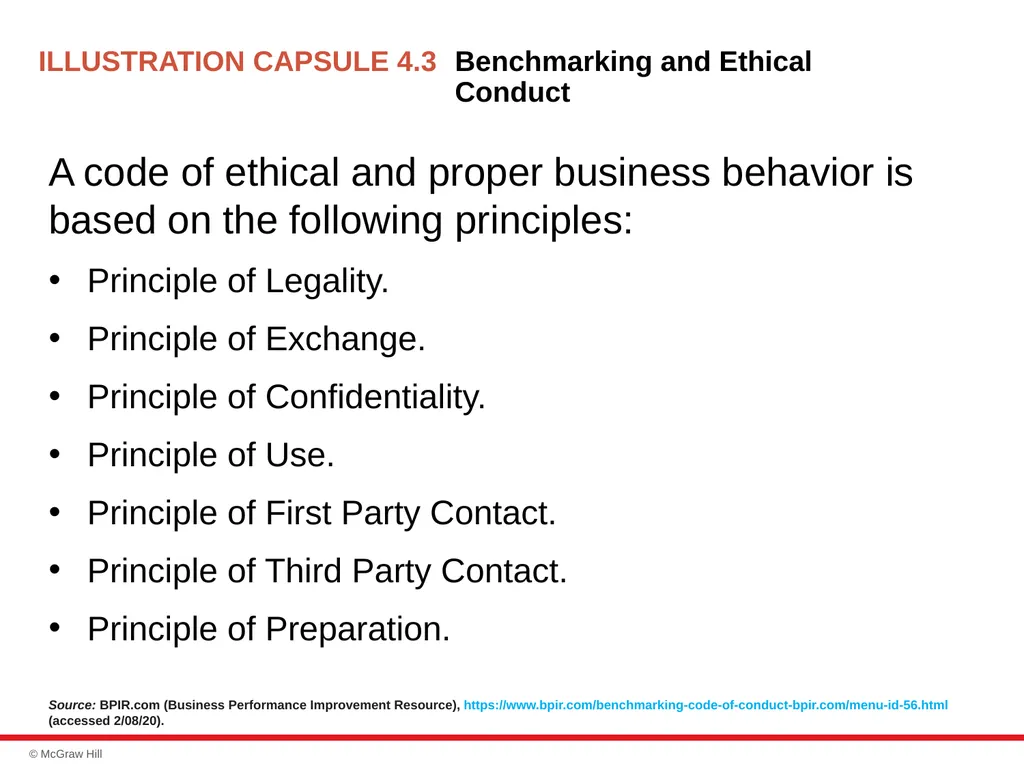
ILLUSTRATION CAPSULE 4.3 Benchmarking and Ethical Conduct A code of ethical and proper business behavior is based on the following principles:
Principle of Legality.
Principle of Exchange.
Principle of Confidentiality.
Principle of Use.
Principle of First Party Contact.
Principle of Third Party Contact.
Principle of Preparation. Source: BPIR.com (Business Performance Improvement Resource), https://www.bpir.com/benchmarking-code-of-conduct-bpir.com/menu-id-56.html (accessed 2/08/20).<br>
Principle of Legality.
Principle of Exchange.
Principle of Confidentiality.
Principle of Use.
Principle of First Party Contact.
Principle of Third Party Contact.
Principle of Preparation. Source: BPIR.com (Business Performance Improvement Resource), https://www.bpir.com/benchmarking-code-of-conduct-bpir.com/menu-id-56.html (accessed 2/08/20).<br>
48
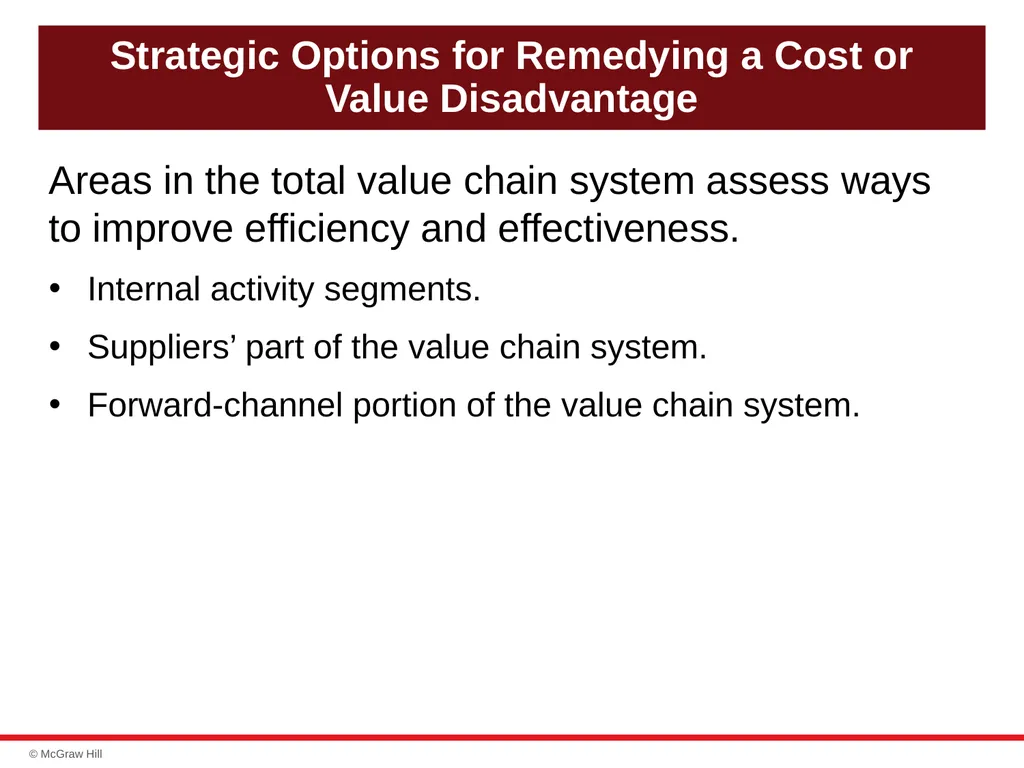
Strategic Options for Remedying a Cost or Value Disadvantage Areas in the total value chain system assess ways to improve efficiency and effectiveness.
Internal activity segments.
Suppliers’ part of the value chain system.
Forward-channel portion of the value chain system.<br>
Internal activity segments.
Suppliers’ part of the value chain system.
Forward-channel portion of the value chain system.<br>
49
Improving Internally Performed
Value Chain Activities Implement best practices throughout the firm, particularly for high-value activities.
Redesign products, components and activities to facilitate speedier and more economical manufacture or assembly.
Relocate high-cost activities to external value chains to be performed more cheaply by vendors or contractors.
Reallocate resources to activities that address buyers’ most important purchase criteria.
Adopt productivity-enhancing, cost-saving technological improvements that spur innovation, improve design, and enhance creativity.<br>
Redesign products, components and activities to facilitate speedier and more economical manufacture or assembly.
Relocate high-cost activities to external value chains to be performed more cheaply by vendors or contractors.
Reallocate resources to activities that address buyers’ most important purchase criteria.
Adopt productivity-enhancing, cost-saving technological improvements that spur innovation, improve design, and enhance creativity.<br>
50
Improving Supplier-Related
Value Chain Activities Pressure suppliers for lower prices.
Switch to lower-priced substitute inputs.
Collaborate closely with suppliers to identify mutual cost-saving opportunities.
Work with suppliers to enhance the firm’s differentiation.
Select and retain suppliers who meet higher-quality standards.
Coordinate with suppliers to enhance design or other features desired by customers.
Provide incentives to suppliers to meet higher-quality standards, and assist suppliers in their efforts to improve.<br>
Switch to lower-priced substitute inputs.
Collaborate closely with suppliers to identify mutual cost-saving opportunities.
Work with suppliers to enhance the firm’s differentiation.
Select and retain suppliers who meet higher-quality standards.
Coordinate with suppliers to enhance design or other features desired by customers.
Provide incentives to suppliers to meet higher-quality standards, and assist suppliers in their efforts to improve.<br>
51
Improving Value Chain Activities of
Distribution Partners Achieving cost-based competitiveness:
Pressure forward-channel allies to reduce their costs and markups.
Collaborate with forward-channel allies to identify win-win opportunities to reduce costs.
Change to a more economical distribution strategy, including switching to cheaper distribution channels.<br>
Pressure forward-channel allies to reduce their costs and markups.
Collaborate with forward-channel allies to identify win-win opportunities to reduce costs.
Change to a more economical distribution strategy, including switching to cheaper distribution channels.<br>
52
Enhancing Differentiation Through Activities at the Forward End of the Value Chain System Engage in cooperative advertising and promotions with forward-channel allies.
Use exclusive arrangements with downstream sellers or other mechanisms that increase their incentives to enhance delivered customer value.
Create and enforce standards for downstream activities and assist in training channel partners in business practices.<br>
Use exclusive arrangements with downstream sellers or other mechanisms that increase their incentives to enhance delivered customer value.
Create and enforce standards for downstream activities and assist in training channel partners in business practices.<br>
53
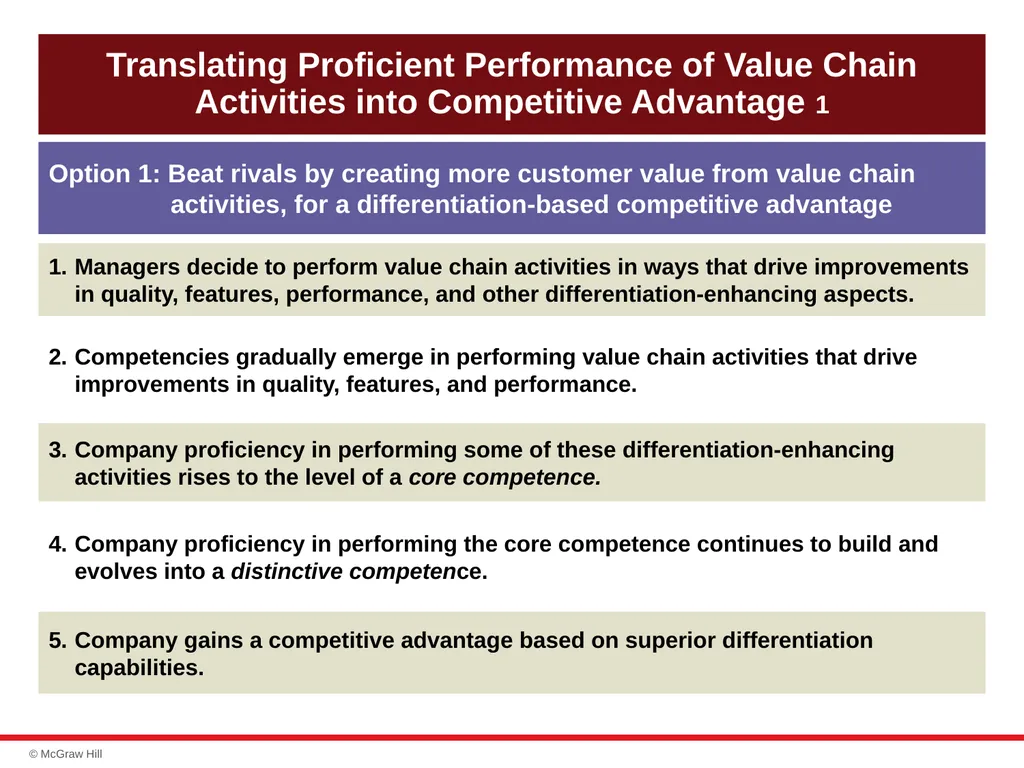
Translating Proficient Performance of Value Chain Activities into Competitive Advantage 1 Option 1: Beat rivals by creating more customer value from value chain activities, for a differentiation-based competitive advantage 1. Managers decide to perform value chain activities in ways that drive improvements in quality, features, performance, and other differentiation-enhancing aspects. 2. Competencies gradually emerge in performing value chain activities that drive improvements in quality, features, and performance. 3. Company proficiency in performing some of these differentiation-enhancing activities rises to the level of a core competence. 4. Company proficiency in performing the core competence continues to build and evolves into a distinctive competence. 5. Company gains a competitive advantage based on superior differentiation capabilities.<br>
54
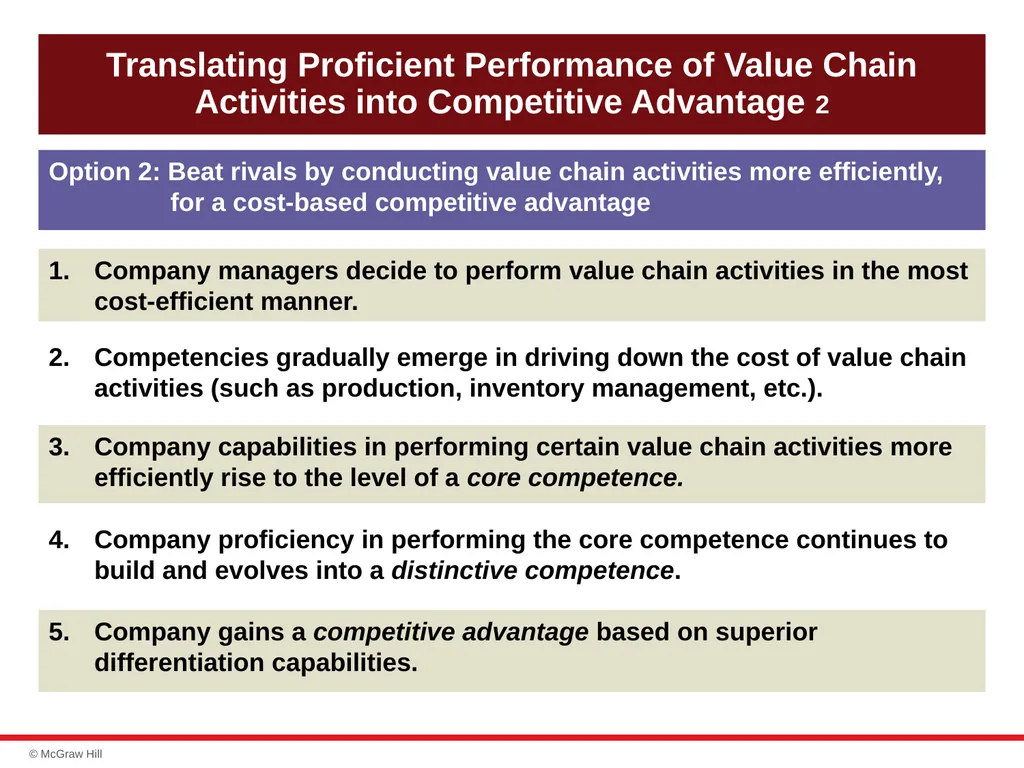
Translating Proficient Performance of Value Chain Activities into Competitive Advantage 2 Option 2: Beat rivals by conducting value chain activities more efficiently, for a cost-based competitive advantage 1. Company managers decide to perform value chain activities in the most cost-efficient manner. 2. Competencies gradually emerge in driving down the cost of value chain activities (such as production, inventory management, etc.). 3. Company capabilities in performing certain value chain activities more efficiently rise to the level of a core competence. 4. Company proficiency in performing the core competence continues to build and evolves into a distinctive competence. 5. Company gains a competitive advantage based on superior differentiation capabilities.<br>
55
QUESTION 5: Is the Company Competitively Stronger or Weaker Than Key Rivals? Assessing overall competitive strength:
How does the firm rank relative to competitors on each of the important factors that determine market success?
Does the firm have a net competitive advantage or disadvantage versus major competitors?<br>
How does the firm rank relative to competitors on each of the important factors that determine market success?
Does the firm have a net competitive advantage or disadvantage versus major competitors?<br>
56
Steps in the Competitive Strength
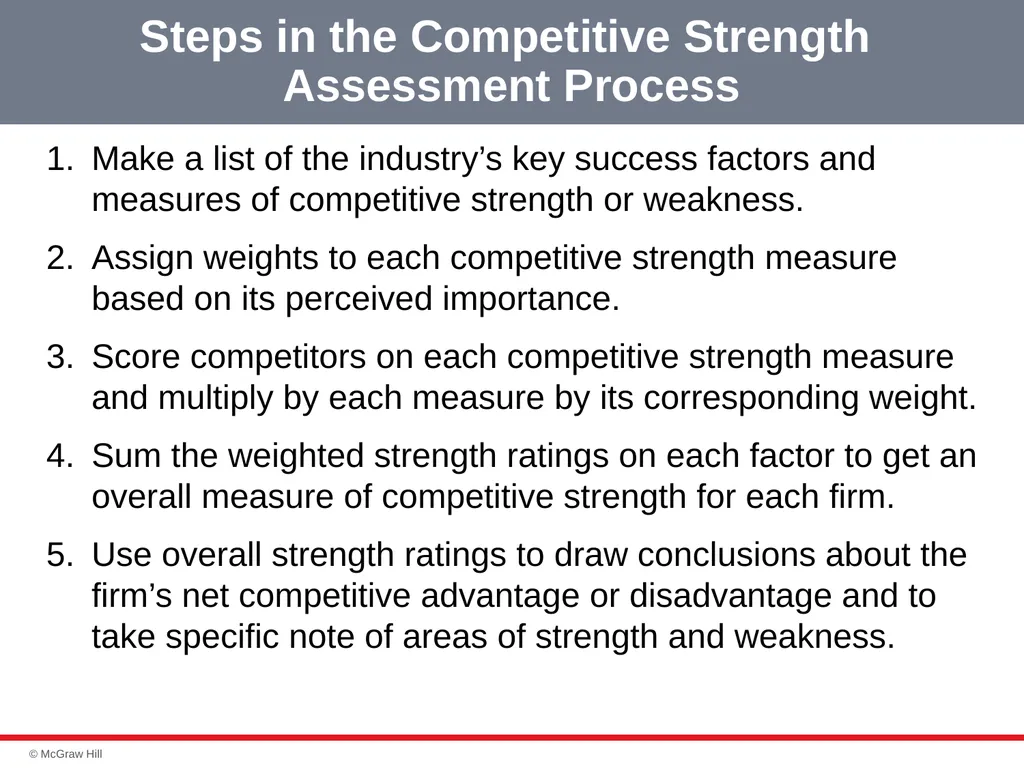
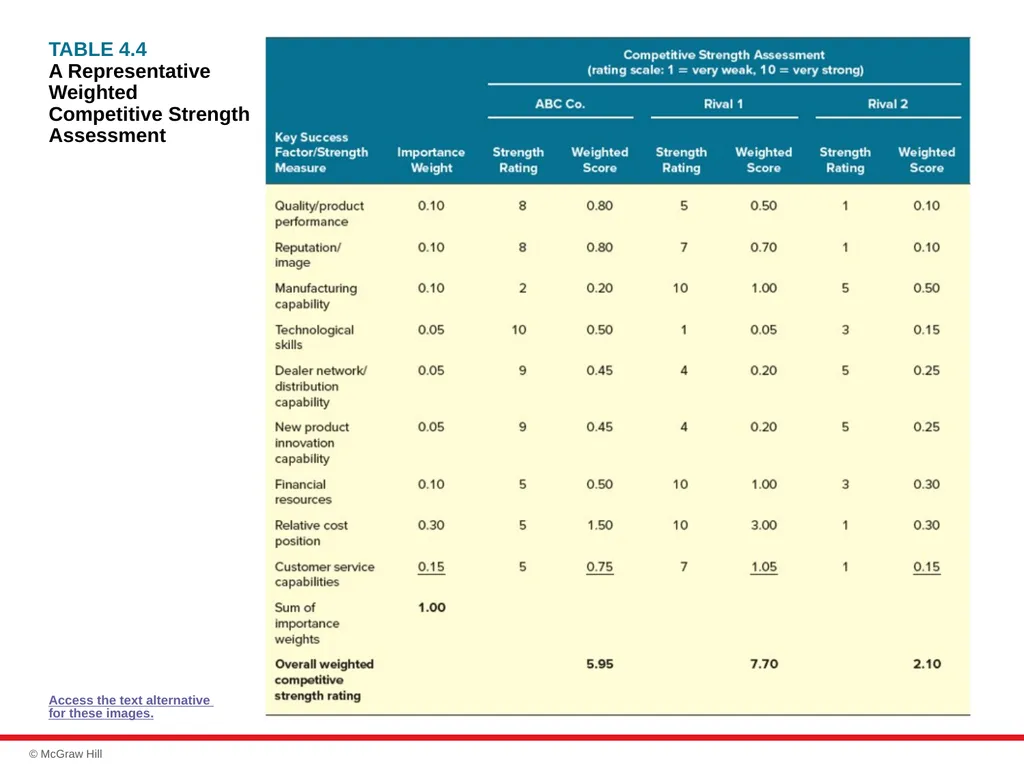
Assessment Process Make a list of the industry’s key success factors and measures of competitive strength or weakness.
Assign weights to each competitive strength measure based on its perceived importance.
Score competitors on each competitive strength measure and multiply by each measure by its corresponding weight.
Sum the weighted strength ratings on each factor to get an overall measure of competitive strength for each firm.
Use overall strength ratings to draw conclusions about the firm’s net competitive advantage or disadvantage and to take specific note of areas of strength and weakness.<br>
Assign weights to each competitive strength measure based on its perceived importance.
Score competitors on each competitive strength measure and multiply by each measure by its corresponding weight.
Sum the weighted strength ratings on each factor to get an overall measure of competitive strength for each firm.
Use overall strength ratings to draw conclusions about the firm’s net competitive advantage or disadvantage and to take specific note of areas of strength and weakness.<br>
57
TABLE 4.4
A Representative Weighted Competitive Strength Assessment Access the text alternative for these images.<br>
58
Strategic Implications of a Competitive
Strength Assessment The higher a firm’s overall weighted strength rating, the stronger its overall competitiveness versus rivals.
The rating score indicates the total net competitive advantage for a firm relative to other firms.
Firms with high competitive strength scores are targets for benchmarking.
The ratings show how a firm compares against rivals, factor by factor (or capability by capability).
Strength scores can be useful in deciding what strategic moves to make.<br>
The rating score indicates the total net competitive advantage for a firm relative to other firms.
Firms with high competitive strength scores are targets for benchmarking.
The ratings show how a firm compares against rivals, factor by factor (or capability by capability).
Strength scores can be useful in deciding what strategic moves to make.<br>
59
QUESTION 6: What Strategic Issues and Problems Merit Front-Burner Managerial Attention? Which and how serious are the strategic issues that managers must address—and resolve—for the firm to be more financially and competitively successful in the years ahead.
A good strategy must contain ways to deal with all the strategic issues and obstacles that stand in the way of the firm’s financial and competitive success in the years ahead.<br>
A good strategy must contain ways to deal with all the strategic issues and obstacles that stand in the way of the firm’s financial and competitive success in the years ahead.<br>
60
Strategic Priority “How To” Issues How to meet challenges of new foreign competitors.
How to combat the price discounting of rivals
How to both reduce high costs and prepare for price reductions.
How to sustain growth as buyer demand slows.
How to adapt to the changing demographics of the firm’s customer base.<br>
How to combat the price discounting of rivals
How to both reduce high costs and prepare for price reductions.
How to sustain growth as buyer demand slows.
How to adapt to the changing demographics of the firm’s customer base.<br>
61
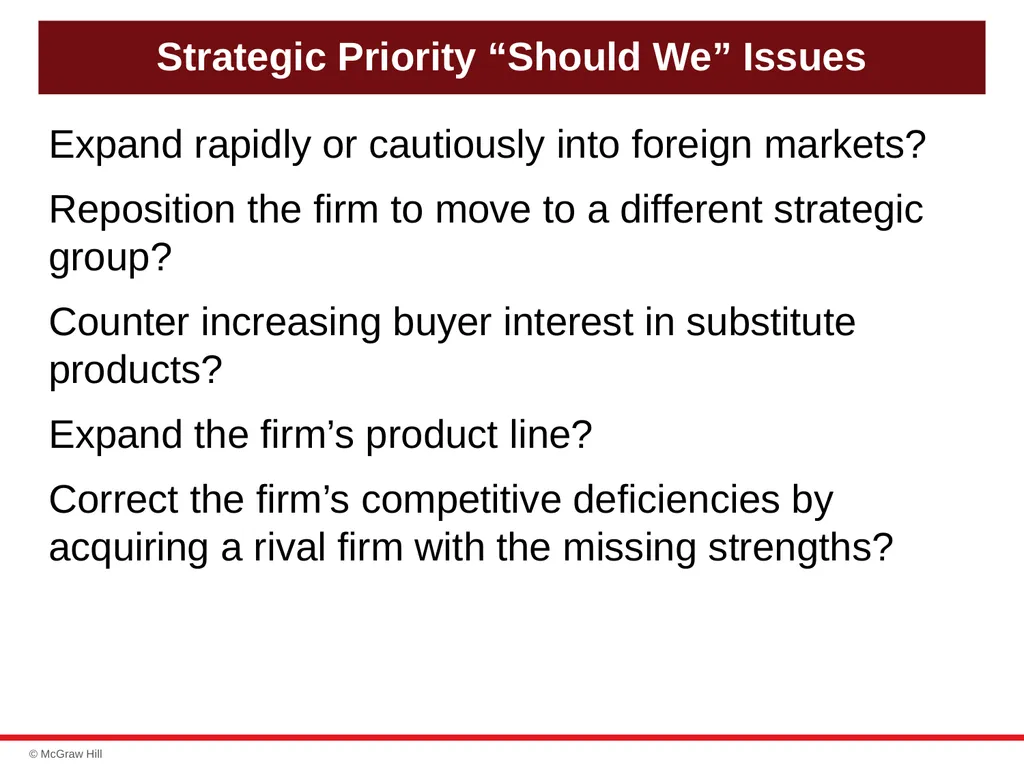
Strategic Priority “Should We” Issues Expand rapidly or cautiously into foreign markets?
Reposition the firm to move to a different strategic group?
Counter increasing buyer interest in substitute products?
Expand the firm’s product line?
Correct the firm’s competitive deficiencies by acquiring a rival firm with the missing strengths?<br>
Reposition the firm to move to a different strategic group?
Counter increasing buyer interest in substitute products?
Expand the firm’s product line?
Correct the firm’s competitive deficiencies by acquiring a rival firm with the missing strengths?<br>
62
End of Main Content © 2020 McGraw Hill. All rights reserved. Authorized only for instructor use in the classroom.
No reproduction or further distribution permitted without the prior written consent of McGraw Hill.<br>
No reproduction or further distribution permitted without the prior written consent of McGraw Hill.<br>
63
Text Alternatives for Slide Images<br>
64
Figure 4.1 Identifying the Components of a Single-Business Company’s Strategy, Text Alternative Return to slide containing original image. Single business strategic action plan components include:
Moves to respond to changing conditions in the macro-environment or in industry and competitive conditions.
Initiatives to build competitive advantage based on:
Lower costs and prices relative to rivals?
A better product or service (design, features, quality, wider selection, etc.)?
Superior ability to service a market niche or specific group of buyers?
Efforts to expand or narrow geographic coverage.
Efforts to build competitively valuable partnerships and strategic alliances with other enterprises within its industry.
Key functional strategies of the overall business strategy:
R&D, technology, product design; supply chain management; production; sales, marketing, and distribution; information technology; human resources; and finance. Return to slide containing original image.<br>
Moves to respond to changing conditions in the macro-environment or in industry and competitive conditions.
Initiatives to build competitive advantage based on:
Lower costs and prices relative to rivals?
A better product or service (design, features, quality, wider selection, etc.)?
Superior ability to service a market niche or specific group of buyers?
Efforts to expand or narrow geographic coverage.
Efforts to build competitively valuable partnerships and strategic alliances with other enterprises within its industry.
Key functional strategies of the overall business strategy:
R&D, technology, product design; supply chain management; production; sales, marketing, and distribution; information technology; human resources; and finance. Return to slide containing original image.<br>
65
Figure 4.2 The Steps Involved in SWOT Analysis: Identify the Four Components of SWOT, Draw Conclusions, Translate Implications into Strategic Actions, Text Alternative Return to slide containing original image. What can be gleaned from the SWOT listings?
The first two steps of SWOT analysis are:
Identify company strengths and competitive assets.
Identify company weaknesses and competitive deficiencies.
These two steps lead to conclusions concerning the company’s overall business situation. This includes determining what are the underlying reasons for the success (or lack of success) of the company’s strategy. It also includes what the attractive and unattractive aspects of the company’s situation are.
The last two steps of SWOT analysis are:
Identify market opportunities.
Identify external threats.
These two steps reveal implications for improving company strategy. This includes using company strengths as the foundation for the company’s strategy; shoring up weaknesses that are interfering with the success of the strategy; pursuing those market opportunities best suited to company strengths; correcting weaknesses that impair pursuit of important market opportunities; repair weaknesses that heighten vulnerability of external threats; and using company strengths to lessen the impact of important external threats. Return to slide containing original image.<br>
The first two steps of SWOT analysis are:
Identify company strengths and competitive assets.
Identify company weaknesses and competitive deficiencies.
These two steps lead to conclusions concerning the company’s overall business situation. This includes determining what are the underlying reasons for the success (or lack of success) of the company’s strategy. It also includes what the attractive and unattractive aspects of the company’s situation are.
The last two steps of SWOT analysis are:
Identify market opportunities.
Identify external threats.
These two steps reveal implications for improving company strategy. This includes using company strengths as the foundation for the company’s strategy; shoring up weaknesses that are interfering with the success of the strategy; pursuing those market opportunities best suited to company strengths; correcting weaknesses that impair pursuit of important market opportunities; repair weaknesses that heighten vulnerability of external threats; and using company strengths to lessen the impact of important external threats. Return to slide containing original image.<br>
66
Figure 4.3 A Representative Company Value Chain, Text Alternative Return to slide containing original image. Primary activities and costs of a company's value chain are:
Supply chain management.
Operations.
Distribution.
Sales and marketing service.
Profit margin.
Primary activities and costs are supported by the following:
Product R&D.
Technology.
Systems development.
Human resource management.
General administration. Return to slide containing original image.<br>
Supply chain management.
Operations.
Distribution.
Sales and marketing service.
Profit margin.
Primary activities and costs are supported by the following:
Product R&D.
Technology.
Systems development.
Human resource management.
General administration. Return to slide containing original image.<br>
67
Figure 4.4 A Representative Value Chain System, Text Alternative Return to slide containing original image. A representative value chain system shows the following:
Supplier-related value chains: activities, costs, and margins of suppliers.
A firm's own value chain: internally performed activities, costs, and margins.
Forward-channel value chains: (1) activities, costs, and margins of forward-channel allies and strategic partners and (2) buyer or end-user value chains. Return to slide containing original image.<br>
Supplier-related value chains: activities, costs, and margins of suppliers.
A firm's own value chain: internally performed activities, costs, and margins.
Forward-channel value chains: (1) activities, costs, and margins of forward-channel allies and strategic partners and (2) buyer or end-user value chains. Return to slide containing original image.<br>
68
Illustration Capsule 4.1 The Value Chain for Everlane, Text Alternative Return to slide containing original image. The cost of goods, including the raw cotton; the spinning, weaving, and dyeing; cutting, sewing, and finishing; the transportation of the material, and the factory fee is $22.43 per unit.
Import duties and shipping total $5.60 per unit.
A single unit’s total cost is $28.03.
Everlane’s wholesale selling price to retailers is $68.00 per unit (its unit markup over cost is 142%), resulting in a gross profit of $39.97 per unit.
The retailer’s anticipated selling price is $140.00 per unit (105% markup on its unit purchase cost of $68.00), resulting in a gross profit of $72.00 per unit sold. Return to slide containing original image.<br>
Import duties and shipping total $5.60 per unit.
A single unit’s total cost is $28.03.
Everlane’s wholesale selling price to retailers is $68.00 per unit (its unit markup over cost is 142%), resulting in a gross profit of $39.97 per unit.
The retailer’s anticipated selling price is $140.00 per unit (105% markup on its unit purchase cost of $68.00), resulting in a gross profit of $72.00 per unit sold. Return to slide containing original image.<br>
69
Table 4.4 A Representative Weighted Competitive Strength Assessment Return to slide containing original image. Return to slide containing original image.<br>