
Chapter 4 HOW CELLS OBTAIN ENERGY PowerPoint Image
NS
Published · 39 slides · 0 views

1 / 1
Description
Chapter 4 HOW CELLS OBTAIN ENERGY PowerPoint Image Slideshow Concepts of Biology This work is licensed under cc by 4.0 license. Credit: OpenStax: modified by M. F. Sega J. Wedincamp for ALG 18 grant through addition of ppt slides with
Related Topics
Share
Embed code
Download this presentation From Below
"Chapter 4 HOW CELLS OBTAIN ENERGY PowerPoint Image" is the property of its rightful owner. Permission is granted to download and print the materials on this website for personal, non-commercial use only, and to display it on your personal computer provided you do not modify the materials and that you retain all copyright notices contained in the materials. By downloading content from our website, you accept the terms of this agreement.
Presentation Transcript
01
Chapter 4 HOW CELLS OBTAIN ENERGY
PowerPoint Image Slideshow Concepts of Biology This work is licensed under cc by 4.0 license. Credit: OpenStax: modified by M. F. Sega & J. Wedincamp for ALG 18 grant through addition of ppt slides with texts made using Openstax textbook information.<br>
PowerPoint Image Slideshow Concepts of Biology This work is licensed under cc by 4.0 license. Credit: OpenStax: modified by M. F. Sega & J. Wedincamp for ALG 18 grant through addition of ppt slides with texts made using Openstax textbook information.<br>
02
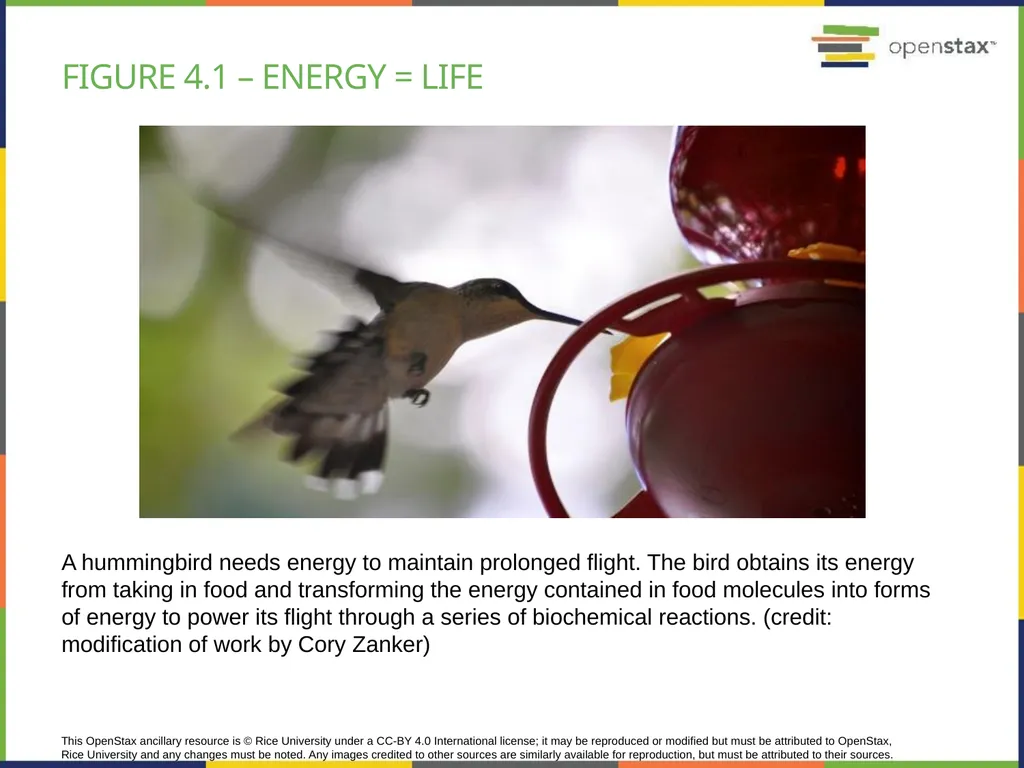
This OpenStax ancillary resource is © Rice University under a CC-BY 4.0 International license; it may be reproduced or modified but must be attributed to OpenStax, Rice University and any changes must be noted. Any images credited to other sources are similarly available for reproduction, but must be attributed to their sources. A hummingbird needs energy to maintain prolonged flight. The bird obtains its energy from taking in food and transforming the energy contained in food molecules into forms of energy to power its flight through a series of biochemical reactions. (credit: modification of work by Cory Zanker) Figure 4.1 – energy = life<br>
03
Energy = life Life is the result of chemical reactions and processes happening inside of your cells.
For these to proceed, some of them require energy.
Energy comes from food.
Food is made of molecules (see previous chapters) that must be transformed into energy.
Transformation involves making another chemical called ATP (that is why we call it chemical energy).
ATP is used as an energy currency for the cell.<br>
For these to proceed, some of them require energy.
Energy comes from food.
Food is made of molecules (see previous chapters) that must be transformed into energy.
Transformation involves making another chemical called ATP (that is why we call it chemical energy).
ATP is used as an energy currency for the cell.<br>
04
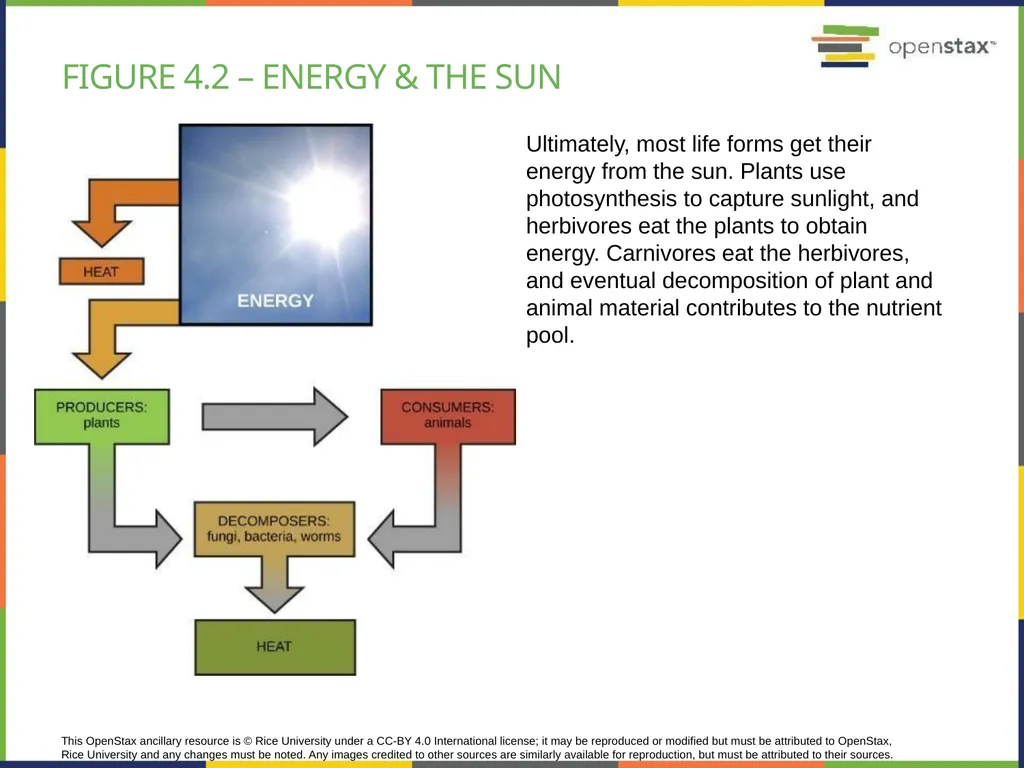
This OpenStax ancillary resource is © Rice University under a CC-BY 4.0 International license; it may be reproduced or modified but must be attributed to OpenStax, Rice University and any changes must be noted. Any images credited to other sources are similarly available for reproduction, but must be attributed to their sources. Ultimately, most life forms get their energy from the sun. Plants use photosynthesis to capture sunlight, and herbivores eat the plants to obtain energy. Carnivores eat the herbivores, and eventual decomposition of plant and animal material contributes to the nutrient pool. Figure 4.2 – energy & the sun<br>
05
Energy & the sun Producers = transform the energy from the sun into molecules containing energy (chemical energy) in the process of photosynthesis; molecules are used to grow the plant, make fruits etc.; these are used by consumers as food.
Consumers = use producers as food to obtain energy; hence, the solar energy is transferred into consumers.<br>
Consumers = use producers as food to obtain energy; hence, the solar energy is transferred into consumers.<br>
06
metabolism Metabolism = represents all the chemical reactions and processes taking place inside your cells resulting in LIFE.
Catabolism = chemical reactions resulting in breaking down big molecules
releases energy
Anabolism = chemical reactions resulting in building up molecules
requires energy
Metabolic pathway = all the consecutive reactions resulting in a specific product
Examples:……….<br>
Catabolism = chemical reactions resulting in breaking down big molecules
releases energy
Anabolism = chemical reactions resulting in building up molecules
requires energy
Metabolic pathway = all the consecutive reactions resulting in a specific product
Examples:……….<br>
07
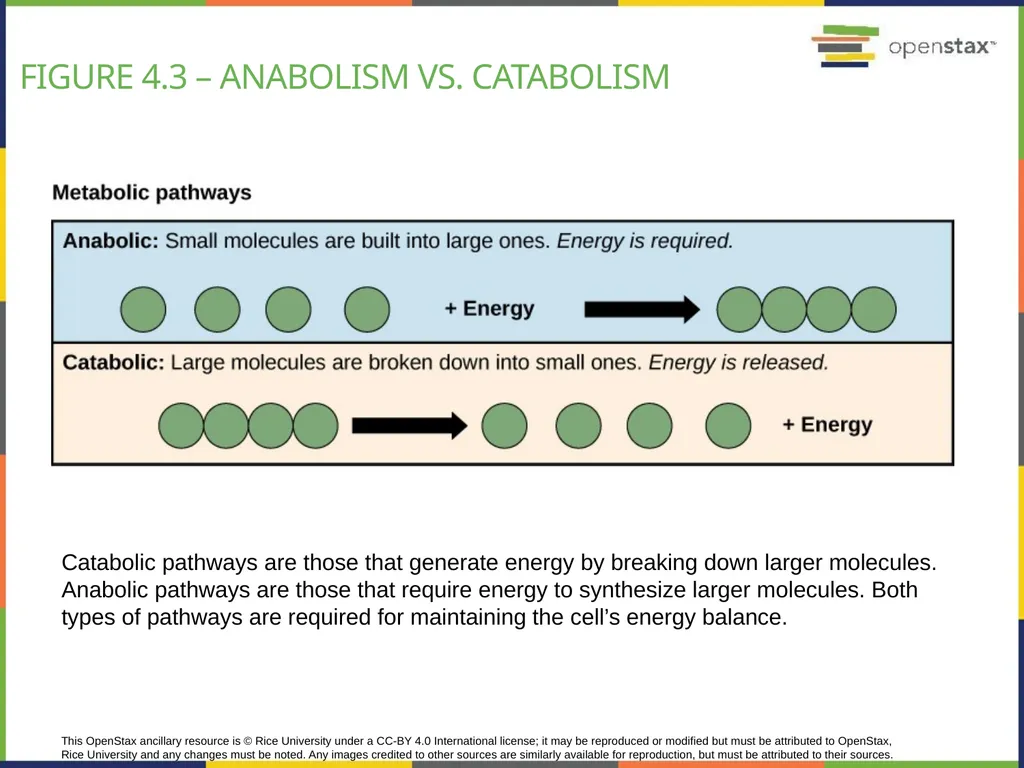
This OpenStax ancillary resource is © Rice University under a CC-BY 4.0 International license; it may be reproduced or modified but must be attributed to OpenStax, Rice University and any changes must be noted. Any images credited to other sources are similarly available for reproduction, but must be attributed to their sources. Catabolic pathways are those that generate energy by breaking down larger molecules. Anabolic pathways are those that require energy to synthesize larger molecules. Both types of pathways are required for maintaining the cell’s energy balance. Figure 4.3 – Anabolism vs. catabolism<br>
08
Energy & Thermodynamics 1st Thermodynamics law:
the amount of energy in the universe is constant & conserved;
the energy can only transform from one type into another while transferring between systems but will never disappear from the universe.
Examples:……………
2nd Thermodynamics law:
when energy transfers between systems some will be lost as heat;
ENTROPY = the order/disorder of the molecules: low entropy means highly ordered systems.
Systems releasing/losing energy have high entropy
Systems with low entropy require input of energy
Examples:……….<br>
the amount of energy in the universe is constant & conserved;
the energy can only transform from one type into another while transferring between systems but will never disappear from the universe.
Examples:……………
2nd Thermodynamics law:
when energy transfers between systems some will be lost as heat;
ENTROPY = the order/disorder of the molecules: low entropy means highly ordered systems.
Systems releasing/losing energy have high entropy
Systems with low entropy require input of energy
Examples:……….<br>
09
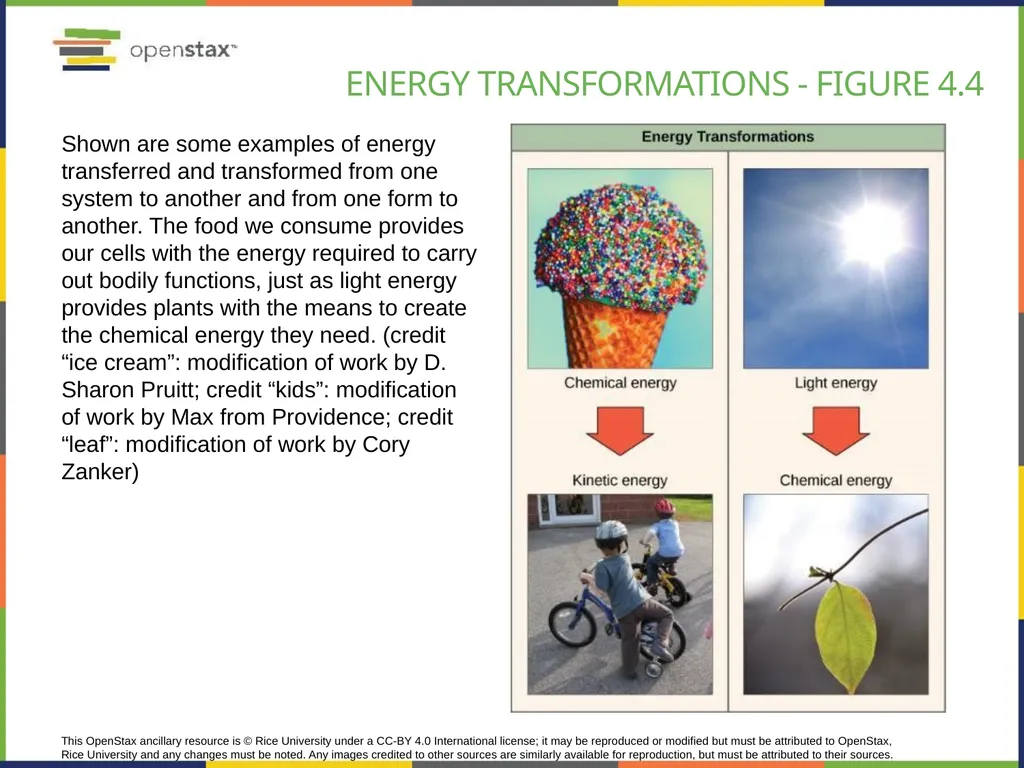
This OpenStax ancillary resource is © Rice University under a CC-BY 4.0 International license; it may be reproduced or modified but must be attributed to OpenStax, Rice University and any changes must be noted. Any images credited to other sources are similarly available for reproduction, but must be attributed to their sources. Shown are some examples of energy transferred and transformed from one system to another and from one form to another. The food we consume provides our cells with the energy required to carry out bodily functions, just as light energy provides plants with the means to create the chemical energy they need. (credit “ice cream”: modification of work by D. Sharon Pruitt; credit “kids”: modification of work by Max from Providence; credit “leaf”: modification of work by Cory Zanker) Energy transformations - Figure 4.4<br>
10
Energy transformations Types of energy:
Potential energy – energy within a system that will result into a change of the system
Example: Chemical energy – this is the energy contained within a chemical (i.e. molecule)
Kinetic energy – energy associated with movement
Example: …………….<br>
Potential energy – energy within a system that will result into a change of the system
Example: Chemical energy – this is the energy contained within a chemical (i.e. molecule)
Kinetic energy – energy associated with movement
Example: …………….<br>
11
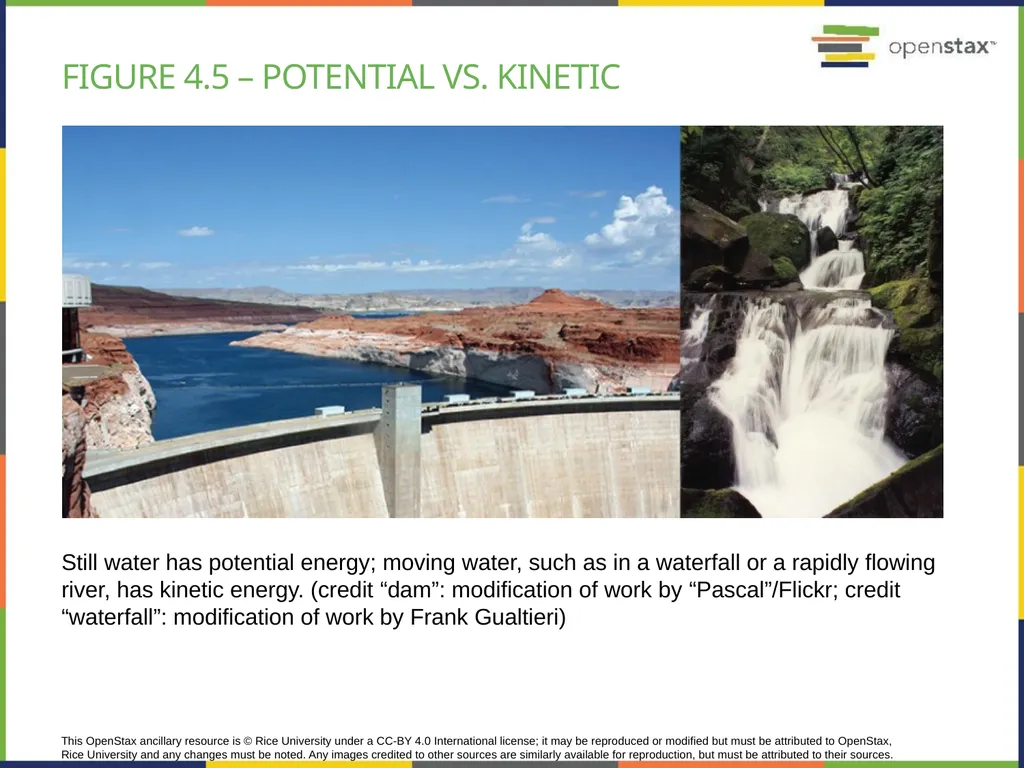
This OpenStax ancillary resource is © Rice University under a CC-BY 4.0 International license; it may be reproduced or modified but must be attributed to OpenStax, Rice University and any changes must be noted. Any images credited to other sources are similarly available for reproduction, but must be attributed to their sources. Still water has potential energy; moving water, such as in a waterfall or a rapidly flowing river, has kinetic energy. (credit “dam”: modification of work by “Pascal”/Flickr; credit “waterfall”: modification of work by Frank Gualtieri) Figure 4.5 – potential vs. kinetic<br>
12
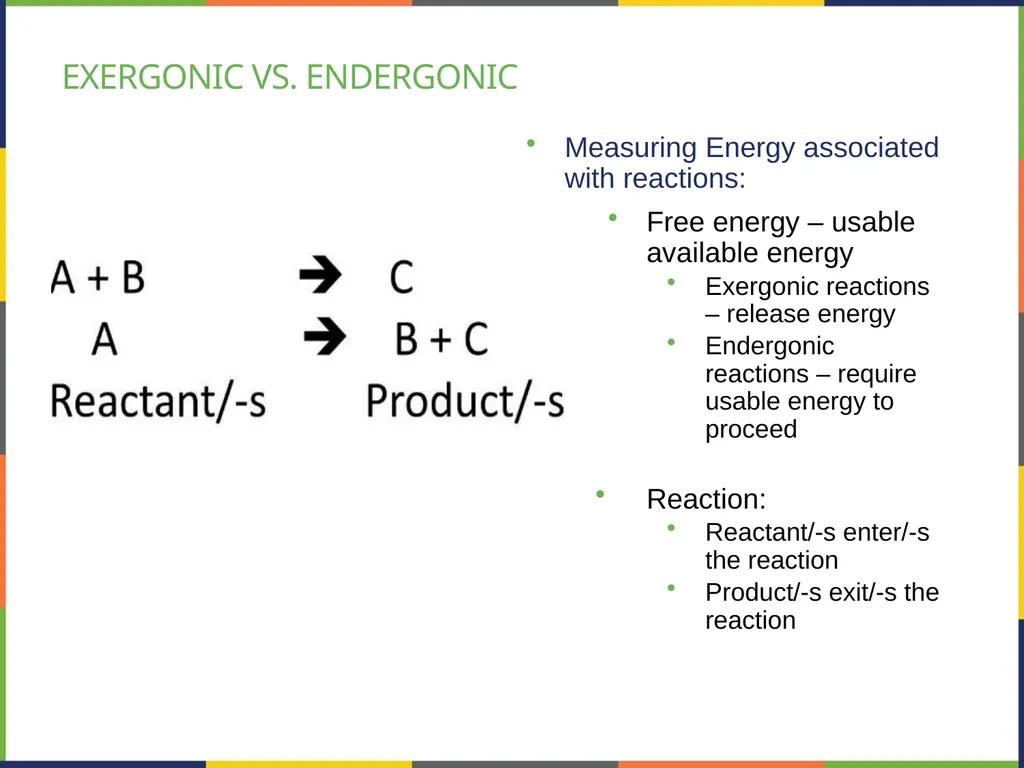
Exergonic vs. endergonic Measuring Energy associated with reactions:
Free energy – usable available energy
Exergonic reactions – release energy
Endergonic reactions – require usable energy to proceed
Reaction:
Reactant/-s enter/-s the reaction
Product/-s exit/-s the reaction<br>
Free energy – usable available energy
Exergonic reactions – release energy
Endergonic reactions – require usable energy to proceed
Reaction:
Reactant/-s enter/-s the reaction
Product/-s exit/-s the reaction<br>
13
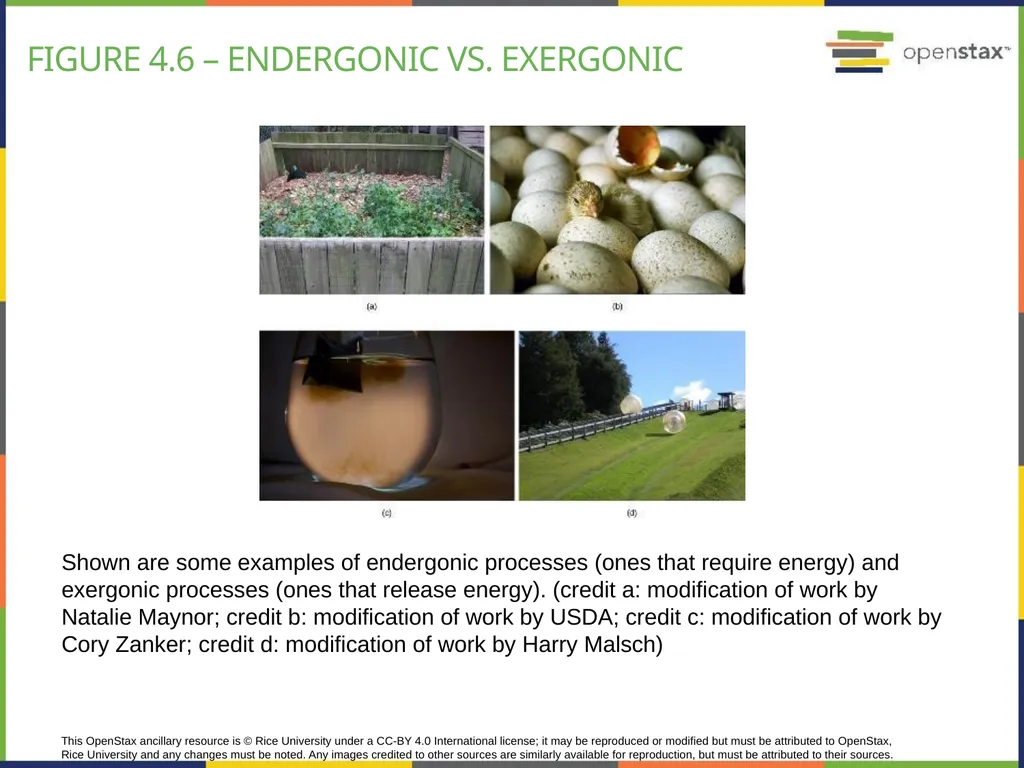
This OpenStax ancillary resource is © Rice University under a CC-BY 4.0 International license; it may be reproduced or modified but must be attributed to OpenStax, Rice University and any changes must be noted. Any images credited to other sources are similarly available for reproduction, but must be attributed to their sources. Shown are some examples of endergonic processes (ones that require energy) and exergonic processes (ones that release energy). (credit a: modification of work by Natalie Maynor; credit b: modification of work by USDA; credit c: modification of work by Cory Zanker; credit d: modification of work by Harry Malsch) Figure 4.6 – endergonic vs. exergonic<br>
14
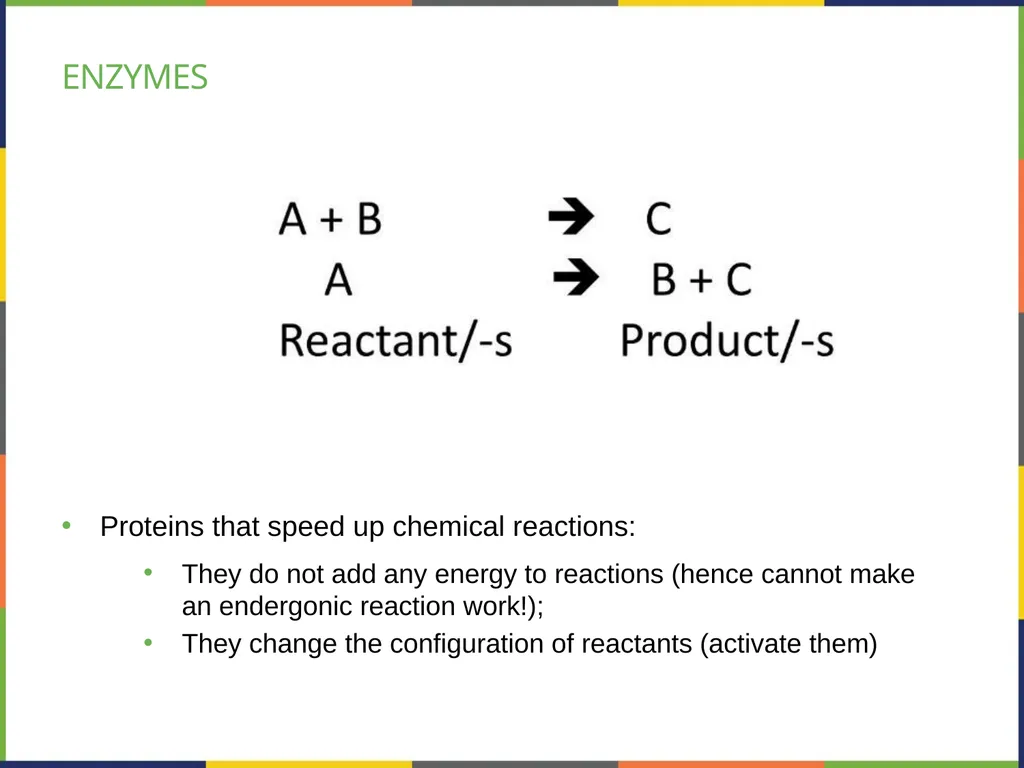
enzymes Proteins that speed up chemical reactions:
They do not add any energy to reactions (hence cannot make an endergonic reaction work!);
They change the configuration of reactants (activate them)<br>
They do not add any energy to reactions (hence cannot make an endergonic reaction work!);
They change the configuration of reactants (activate them)<br>
15
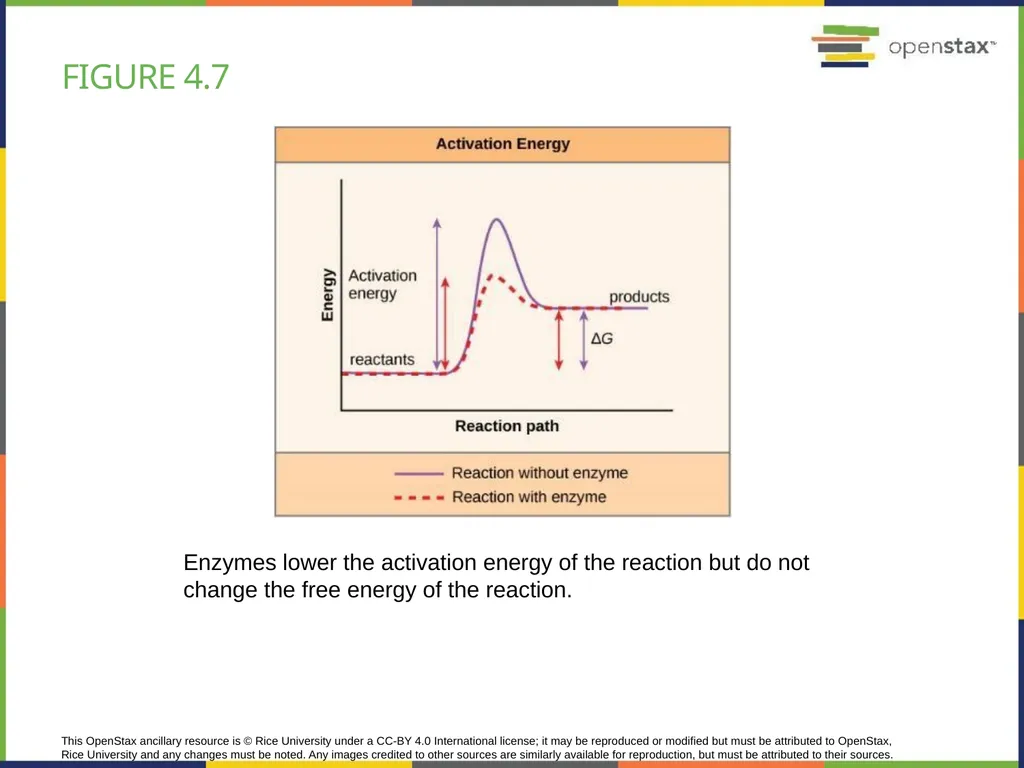
This OpenStax ancillary resource is © Rice University under a CC-BY 4.0 International license; it may be reproduced or modified but must be attributed to OpenStax, Rice University and any changes must be noted. Any images credited to other sources are similarly available for reproduction, but must be attributed to their sources. Enzymes lower the activation energy of the reaction but do not change the free energy of the reaction. Figure 4.7<br>
16
enzymes Enzymes:
Are Proteins
Have active site/-s where reactants bind
Reactants that bind to an enzyme are called substrates
Substrates are VERY specific to an enzyme (hence, it is easy to control a reaction by controlling an enzyme)
Specificity also known as Lock-and-Key model (lock is the enzyme, key is the substrate)<br>
Are Proteins
Have active site/-s where reactants bind
Reactants that bind to an enzyme are called substrates
Substrates are VERY specific to an enzyme (hence, it is easy to control a reaction by controlling an enzyme)
Specificity also known as Lock-and-Key model (lock is the enzyme, key is the substrate)<br>
17
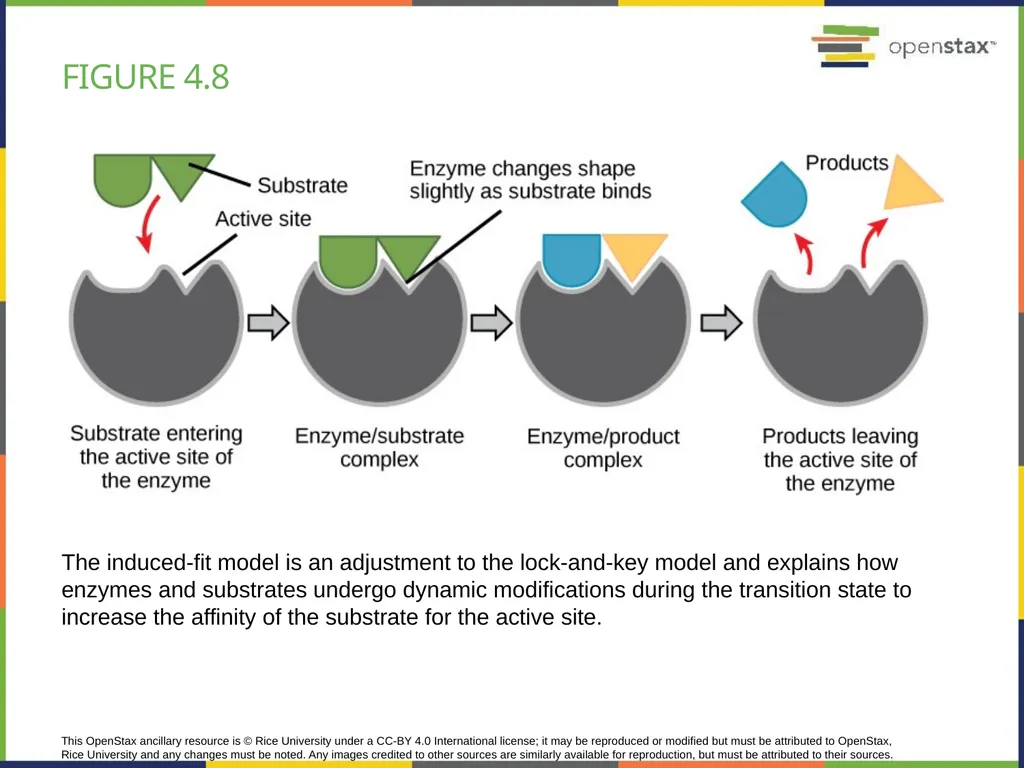
This OpenStax ancillary resource is © Rice University under a CC-BY 4.0 International license; it may be reproduced or modified but must be attributed to OpenStax, Rice University and any changes must be noted. Any images credited to other sources are similarly available for reproduction, but must be attributed to their sources. The induced-fit model is an adjustment to the lock-and-key model and explains how enzymes and substrates undergo dynamic modifications during the transition state to increase the affinity of the substrate for the active site. Figure 4.8<br>
18
Enzyme regulation Or controlling a chemical reaction through changing the enzyme activity (!)
Enzyme activation – by favoring the binding of substrate to the active site
Enzyme inactivation (inhibition) – by blocking the substrate from binding to active site
Help treating diseases by developing drugs that can change the enzyme activity
Very efficient since substrates and enzymes are HIGHLY specific<br>
Enzyme activation – by favoring the binding of substrate to the active site
Enzyme inactivation (inhibition) – by blocking the substrate from binding to active site
Help treating diseases by developing drugs that can change the enzyme activity
Very efficient since substrates and enzymes are HIGHLY specific<br>
19
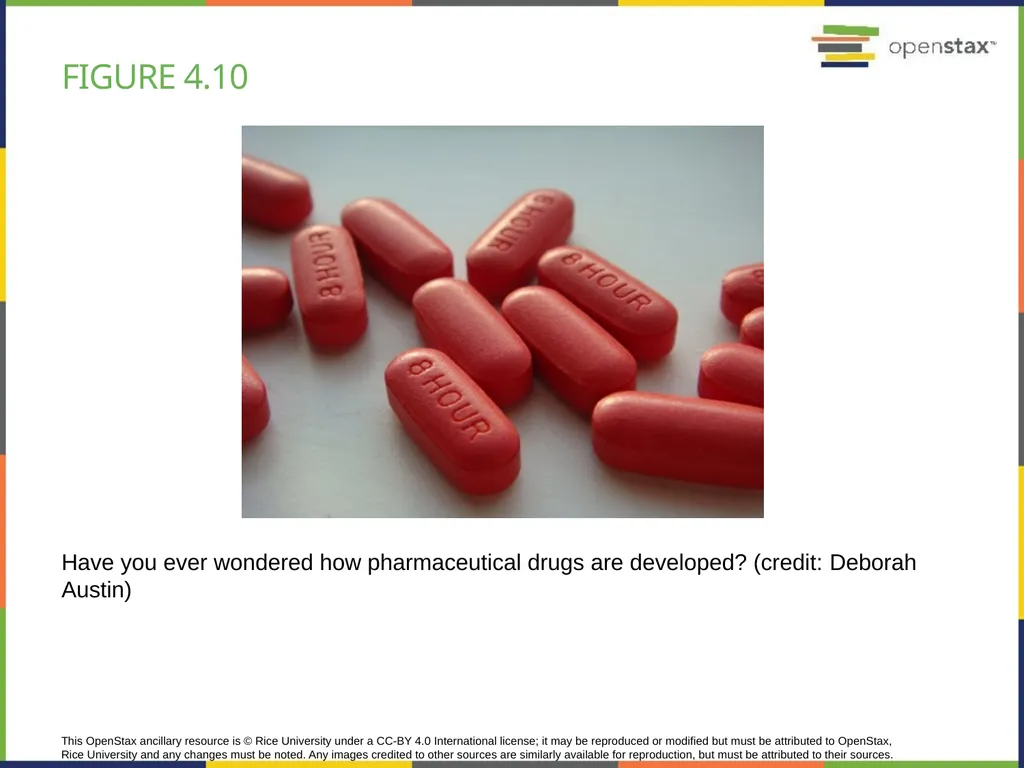
This OpenStax ancillary resource is © Rice University under a CC-BY 4.0 International license; it may be reproduced or modified but must be attributed to OpenStax, Rice University and any changes must be noted. Any images credited to other sources are similarly available for reproduction, but must be attributed to their sources. Have you ever wondered how pharmaceutical drugs are developed? (credit: Deborah Austin) Figure 4.10<br>
20
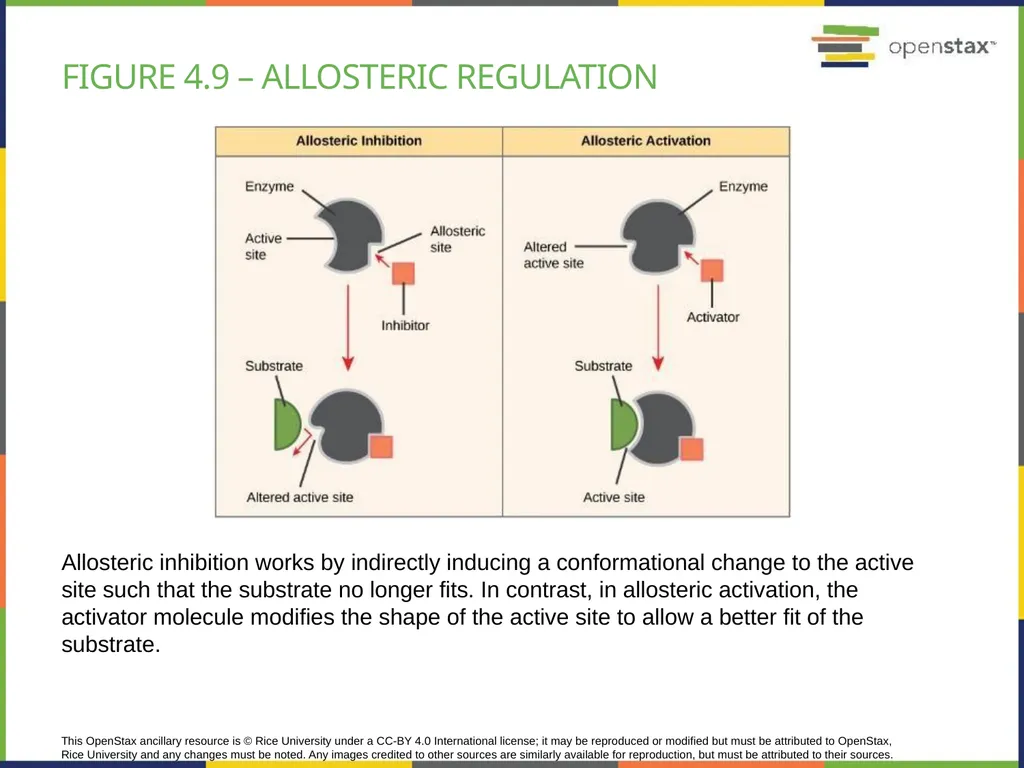
This OpenStax ancillary resource is © Rice University under a CC-BY 4.0 International license; it may be reproduced or modified but must be attributed to OpenStax, Rice University and any changes must be noted. Any images credited to other sources are similarly available for reproduction, but must be attributed to their sources. Allosteric inhibition works by indirectly inducing a conformational change to the active site such that the substrate no longer fits. In contrast, in allosteric activation, the activator molecule modifies the shape of the active site to allow a better fit of the substrate. Figure 4.9 – allosteric regulation<br>
21
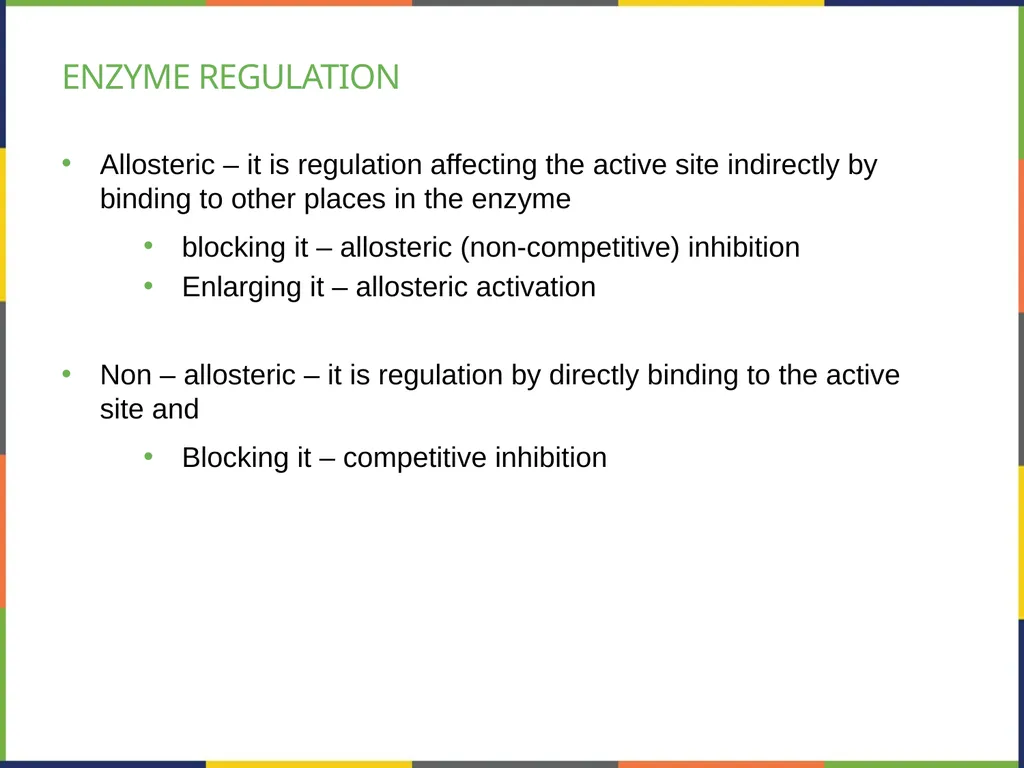
Enzyme regulation Allosteric – it is regulation affecting the active site indirectly by binding to other places in the enzyme
blocking it – allosteric (non-competitive) inhibition
Enlarging it – allosteric activation
Non – allosteric – it is regulation by directly binding to the active site and
Blocking it – competitive inhibition<br>
blocking it – allosteric (non-competitive) inhibition
Enlarging it – allosteric activation
Non – allosteric – it is regulation by directly binding to the active site and
Blocking it – competitive inhibition<br>
22
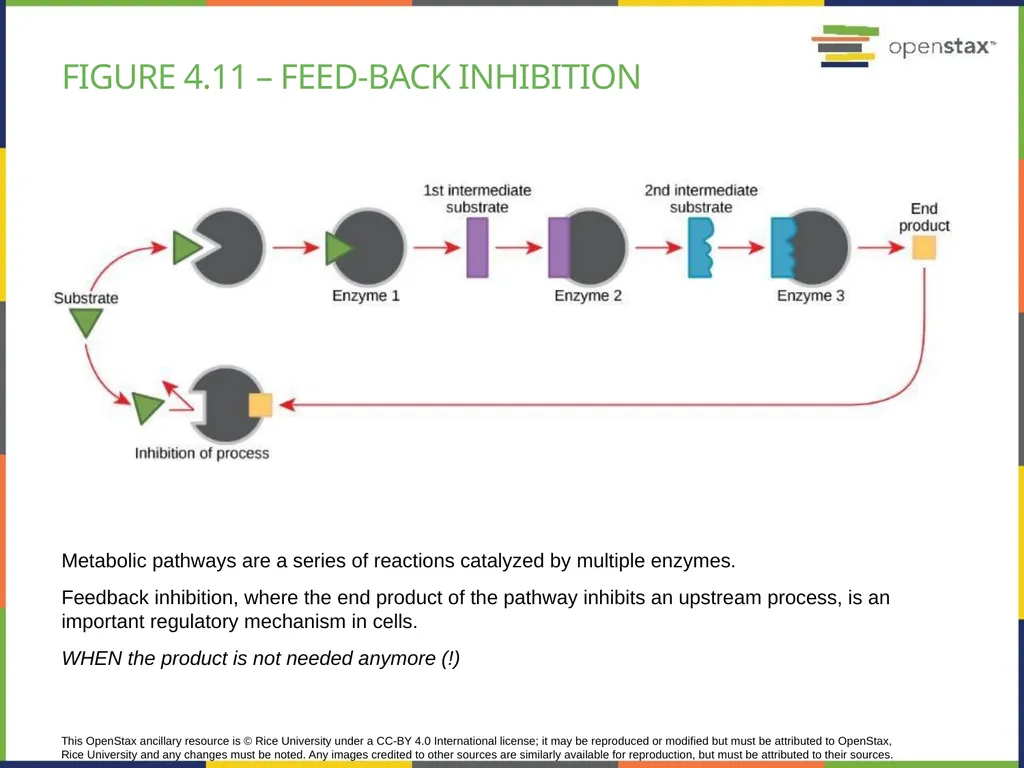
This OpenStax ancillary resource is © Rice University under a CC-BY 4.0 International license; it may be reproduced or modified but must be attributed to OpenStax, Rice University and any changes must be noted. Any images credited to other sources are similarly available for reproduction, but must be attributed to their sources. Metabolic pathways are a series of reactions catalyzed by multiple enzymes.
Feedback inhibition, where the end product of the pathway inhibits an upstream process, is an important regulatory mechanism in cells.
WHEN the product is not needed anymore (!) Figure 4.11 – feed-back inhibition<br>
Feedback inhibition, where the end product of the pathway inhibits an upstream process, is an important regulatory mechanism in cells.
WHEN the product is not needed anymore (!) Figure 4.11 – feed-back inhibition<br>
23
Energy & the cell Food provides energy for the cell
Energy from food is being extracted and stored as molecules of ATP – adenosine triphosphate
When cells needs energy, it will use ATP
ATP is made in the cell during:
Cellular respiration – from macromolecules provided by food with the help of O2
It happens in the mitochondria
Fermentation – from food macromolecules (when O2 not present)
It happens in the cytoplasm<br>
Energy from food is being extracted and stored as molecules of ATP – adenosine triphosphate
When cells needs energy, it will use ATP
ATP is made in the cell during:
Cellular respiration – from macromolecules provided by food with the help of O2
It happens in the mitochondria
Fermentation – from food macromolecules (when O2 not present)
It happens in the cytoplasm<br>
24
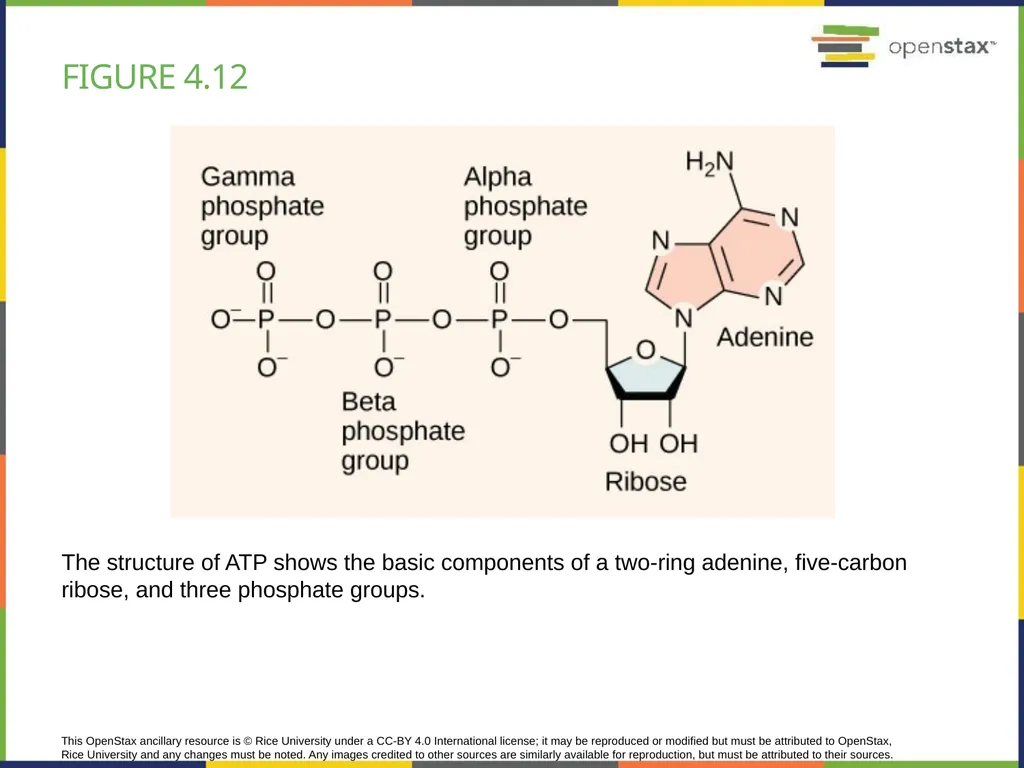
This OpenStax ancillary resource is © Rice University under a CC-BY 4.0 International license; it may be reproduced or modified but must be attributed to OpenStax, Rice University and any changes must be noted. Any images credited to other sources are similarly available for reproduction, but must be attributed to their sources. The structure of ATP shows the basic components of a two-ring adenine, five-carbon ribose, and three phosphate groups. Figure 4.12<br>
25
Cellular respiration Steps:
Glycolysis
Pyruvate processing
Citric cycle
Oxidative phosphorylation<br>
Glycolysis
Pyruvate processing
Citric cycle
Oxidative phosphorylation<br>
26
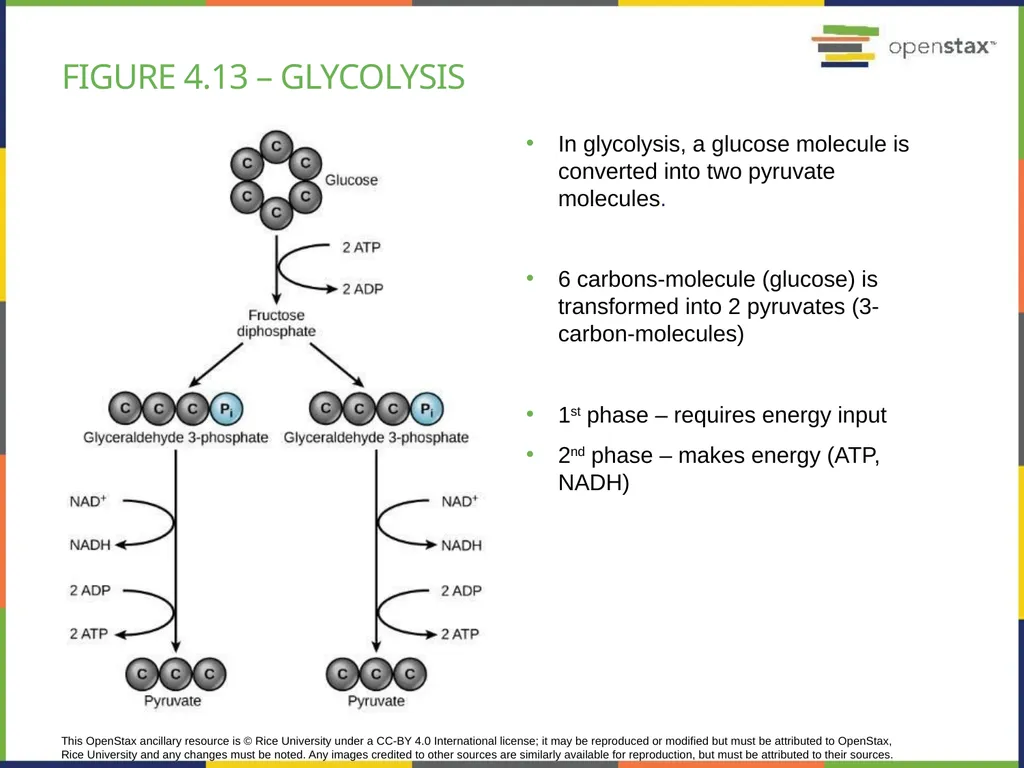
This OpenStax ancillary resource is © Rice University under a CC-BY 4.0 International license; it may be reproduced or modified but must be attributed to OpenStax, Rice University and any changes must be noted. Any images credited to other sources are similarly available for reproduction, but must be attributed to their sources. In glycolysis, a glucose molecule is converted into two pyruvate molecules.
6 carbons-molecule (glucose) is transformed into 2 pyruvates (3-carbon-molecules)
1st phase – requires energy input
2nd phase – makes energy (ATP, NADH) Figure 4.13 – glycolysis<br>
6 carbons-molecule (glucose) is transformed into 2 pyruvates (3-carbon-molecules)
1st phase – requires energy input
2nd phase – makes energy (ATP, NADH) Figure 4.13 – glycolysis<br>
27
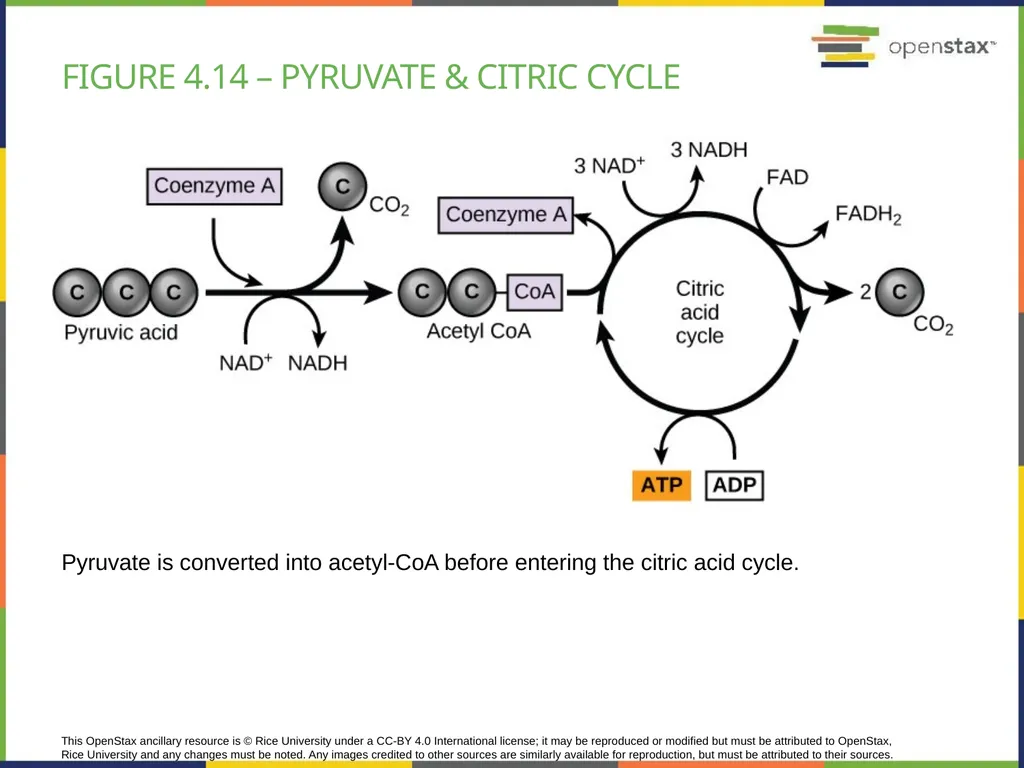
Pyruvate processing & citric cycle EACH Pyruvate molecule is processed:
1 carbon is lost as CO2
2 carbons are transformed into Acetyl-Coenzyme A
Makes energy as NADH
Citric cycle:
Each carbon from Acetyl-CoA is lost as CO2
Makes energy as ATP, NADH, FADH2<br>
1 carbon is lost as CO2
2 carbons are transformed into Acetyl-Coenzyme A
Makes energy as NADH
Citric cycle:
Each carbon from Acetyl-CoA is lost as CO2
Makes energy as ATP, NADH, FADH2<br>
28
This OpenStax ancillary resource is © Rice University under a CC-BY 4.0 International license; it may be reproduced or modified but must be attributed to OpenStax, Rice University and any changes must be noted. Any images credited to other sources are similarly available for reproduction, but must be attributed to their sources. Pyruvate is converted into acetyl-CoA before entering the citric acid cycle. Figure 4.14 – pyruvate & Citric Cycle<br>
29
Glycolysis, Pyruvate processing & citric cycle Overall:
Follow the carbon: 6-carbon atoms in 1 glucose molecule becomes 6 CO2 molecules (exhaled out during respiration)
Energy-containing molecules are made:
ATP
NADH, FADH2
These will provide energy for the next step (!)<br>
Follow the carbon: 6-carbon atoms in 1 glucose molecule becomes 6 CO2 molecules (exhaled out during respiration)
Energy-containing molecules are made:
ATP
NADH, FADH2
These will provide energy for the next step (!)<br>
30
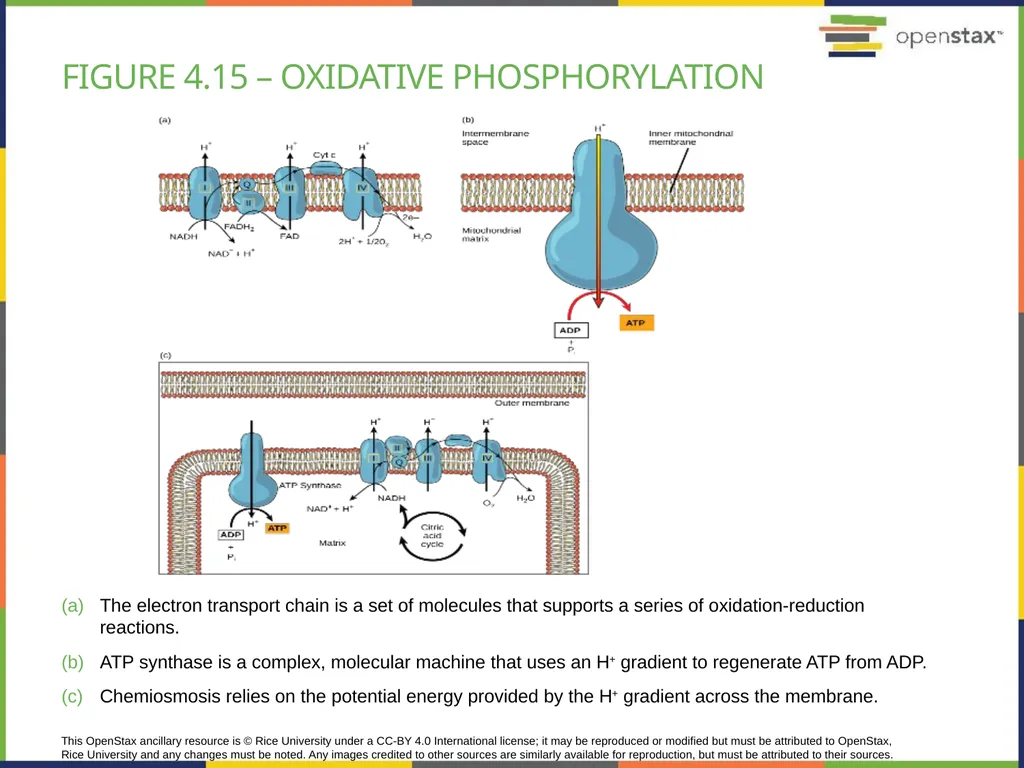
This OpenStax ancillary resource is © Rice University under a CC-BY 4.0 International license; it may be reproduced or modified but must be attributed to OpenStax, Rice University and any changes must be noted. Any images credited to other sources are similarly available for reproduction, but must be attributed to their sources. The electron transport chain is a set of molecules that supports a series of oxidation-reduction reactions.
ATP synthase is a complex, molecular machine that uses an H+ gradient to regenerate ATP from ADP.
Chemiosmosis relies on the potential energy provided by the H+ gradient across the membrane. Figure 4.15 – oxidative phosphorylation<br>
ATP synthase is a complex, molecular machine that uses an H+ gradient to regenerate ATP from ADP.
Chemiosmosis relies on the potential energy provided by the H+ gradient across the membrane. Figure 4.15 – oxidative phosphorylation<br>
31
Oxidative phosphorylation Oxidation:
Losing electrons
NADH & FADH2 will donate (this is oxidation) electrons to the ETC
ETC = electron transport chain
Made of a chain of proteins
Will use the energy of the electrons to create a H+ gradient
Moves H+ across the membrane resulting in higher concentration in the intermembrane space than the matrix
Will transport the electrons to O2 making H2O
Phosphorylation:
Process of adding phosphate to a molecule
H+ will passively move down the gradient through ATP-synthase (from intermembrane space back to matrix)
This makes ATP-synthase create ATP from ADP + 1 P
90% of ATP (energy) is made this way
Chemiosmosis = coupling of chemical reaction of making ATP to passive transport of H+ down their concentration gradient<br>
Losing electrons
NADH & FADH2 will donate (this is oxidation) electrons to the ETC
ETC = electron transport chain
Made of a chain of proteins
Will use the energy of the electrons to create a H+ gradient
Moves H+ across the membrane resulting in higher concentration in the intermembrane space than the matrix
Will transport the electrons to O2 making H2O
Phosphorylation:
Process of adding phosphate to a molecule
H+ will passively move down the gradient through ATP-synthase (from intermembrane space back to matrix)
This makes ATP-synthase create ATP from ADP + 1 P
90% of ATP (energy) is made this way
Chemiosmosis = coupling of chemical reaction of making ATP to passive transport of H+ down their concentration gradient<br>
32
Fermentation & energy Fermentation – obtaining energy without the need of O2
Makes less ATP than cellular respiration
Sugar goes only through glycolysis (!)
Two types:
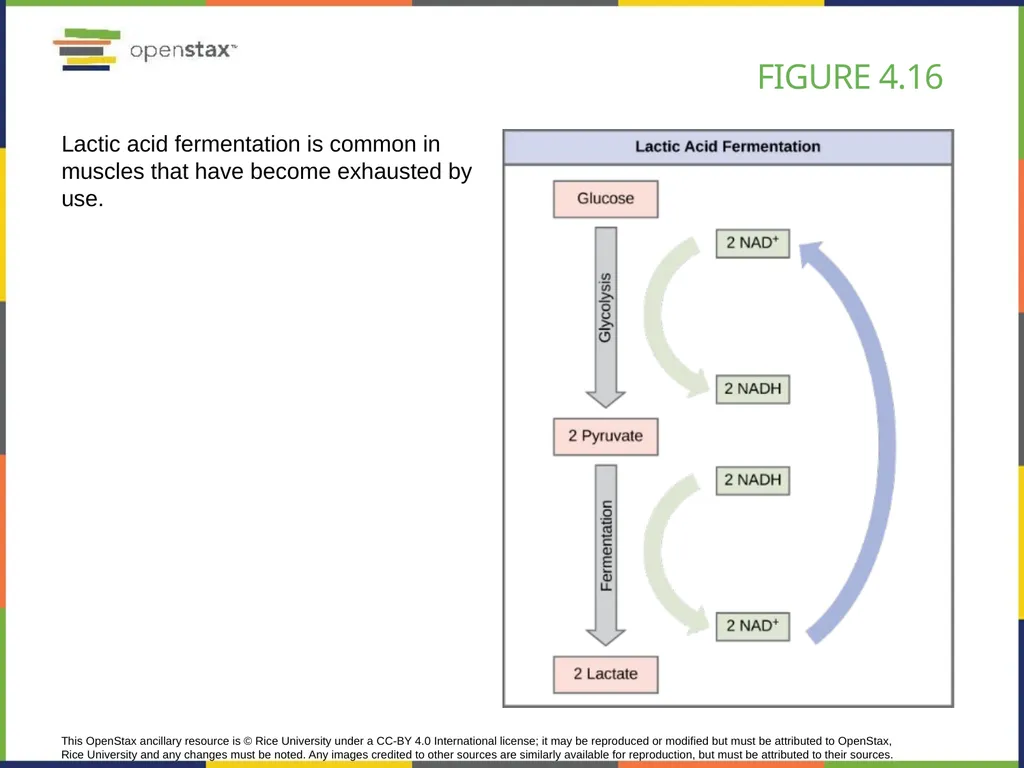
Lactic acid fermentation – in muscles
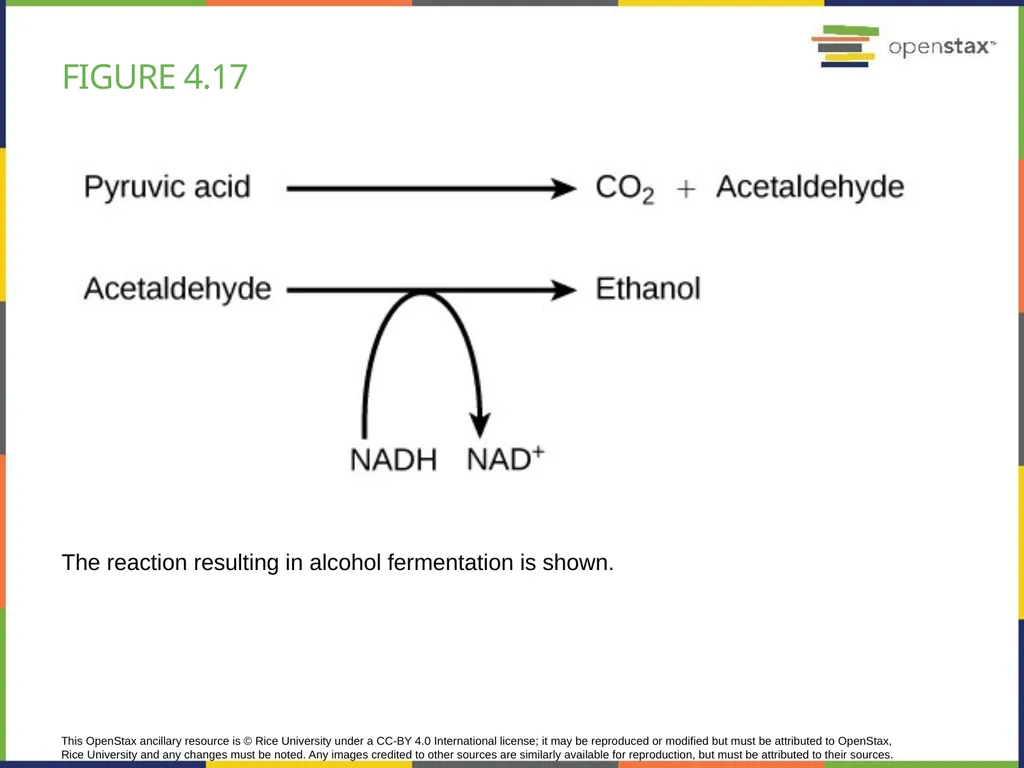
Alcohol fermentation – in yeast – makes alcohol and gas<br>
Makes less ATP than cellular respiration
Sugar goes only through glycolysis (!)
Two types:
Lactic acid fermentation – in muscles
Alcohol fermentation – in yeast – makes alcohol and gas<br>
33
This OpenStax ancillary resource is © Rice University under a CC-BY 4.0 International license; it may be reproduced or modified but must be attributed to OpenStax, Rice University and any changes must be noted. Any images credited to other sources are similarly available for reproduction, but must be attributed to their sources. Lactic acid fermentation is common in muscles that have become exhausted by use. Figure 4.16<br>
34
This OpenStax ancillary resource is © Rice University under a CC-BY 4.0 International license; it may be reproduced or modified but must be attributed to OpenStax, Rice University and any changes must be noted. Any images credited to other sources are similarly available for reproduction, but must be attributed to their sources. The reaction resulting in alcohol fermentation is shown. Figure 4.17<br>
35
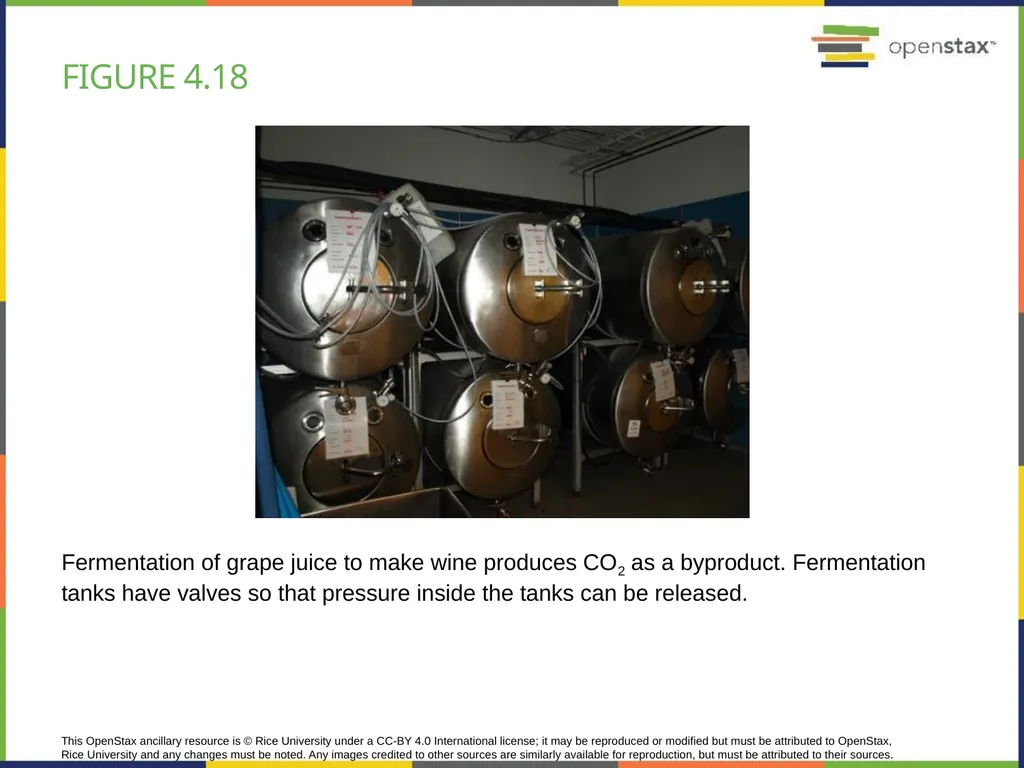
This OpenStax ancillary resource is © Rice University under a CC-BY 4.0 International license; it may be reproduced or modified but must be attributed to OpenStax, Rice University and any changes must be noted. Any images credited to other sources are similarly available for reproduction, but must be attributed to their sources. Fermentation of grape juice to make wine produces CO2 as a byproduct. Fermentation tanks have valves so that pressure inside the tanks can be released. Figure 4.18<br>
36
Anaerobic respiration Making energy without the use of O2
Uses inorganic molecules like:
Sulfates to make sulfide gas (H2S) – bacteria in water wells
CO2 to make methane gas (CH4) – stomach ruminants (cows)
Present in bacteria & archaea<br>
Uses inorganic molecules like:
Sulfates to make sulfide gas (H2S) – bacteria in water wells
CO2 to make methane gas (CH4) – stomach ruminants (cows)
Present in bacteria & archaea<br>
37
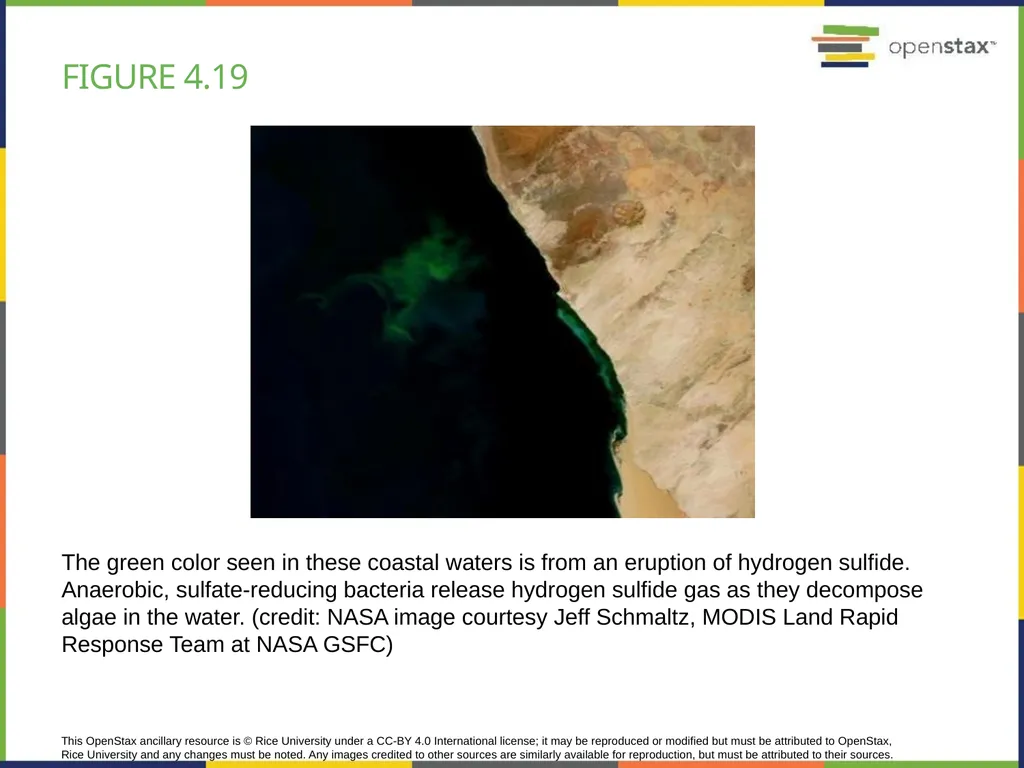
This OpenStax ancillary resource is © Rice University under a CC-BY 4.0 International license; it may be reproduced or modified but must be attributed to OpenStax, Rice University and any changes must be noted. Any images credited to other sources are similarly available for reproduction, but must be attributed to their sources. The green color seen in these coastal waters is from an eruption of hydrogen sulfide. Anaerobic, sulfate-reducing bacteria release hydrogen sulfide gas as they decompose algae in the water. (credit: NASA image courtesy Jeff Schmaltz, MODIS Land Rapid Response Team at NASA GSFC) Figure 4.19<br>
38
Macromolecules & energy How does a turkey sandwich, which contains protein, provide energy to your cells?
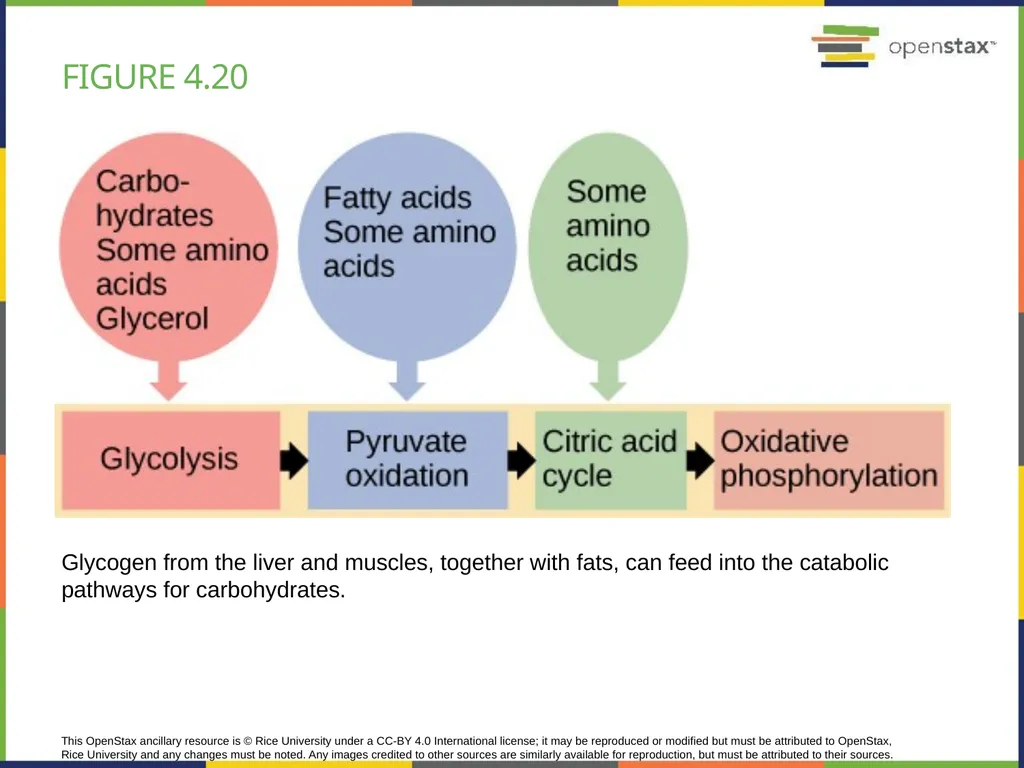
This happens because all the catabolic pathways for carbohydrates, proteins, and lipids eventually connect into glycolysis and the citric acid cycle pathways (fig 4.20)
Carbohydrates – first choice of cellular respiration
Lipids and Proteins – have different entry points into cellular respiration<br>
This happens because all the catabolic pathways for carbohydrates, proteins, and lipids eventually connect into glycolysis and the citric acid cycle pathways (fig 4.20)
Carbohydrates – first choice of cellular respiration
Lipids and Proteins – have different entry points into cellular respiration<br>
39
This OpenStax ancillary resource is © Rice University under a CC-BY 4.0 International license; it may be reproduced or modified but must be attributed to OpenStax, Rice University and any changes must be noted. Any images credited to other sources are similarly available for reproduction, but must be attributed to their sources. Glycogen from the liver and muscles, together with fats, can feed into the catabolic pathways for carbohydrates. Figure 4.20<br>