characteristics and applications of Normal distribution curve Characteristics of N. D. Curve N.D. curve is bell shaped and symmetrical about the mean. The curve is fully defined by X-bar and σ N. D. curve extends from -3 to 3 . σ σ The
"characteristics and applications of Normal" is the property of its rightful owner. Permission is granted to
download and print the materials on this website for personal, non-commercial use only, and to display it
on your personal computer provided you do not modify the materials and that you retain all copyright
notices contained in the materials. By downloading content from our website, you accept the terms of this
agreement.
Presentation Transcript
01
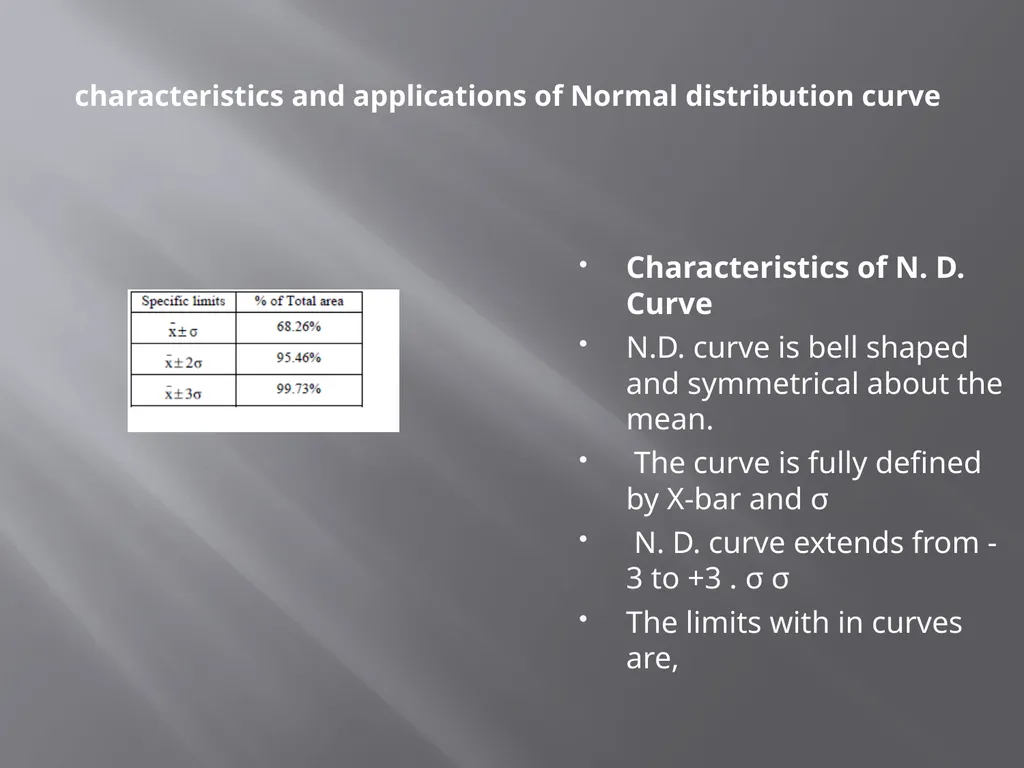
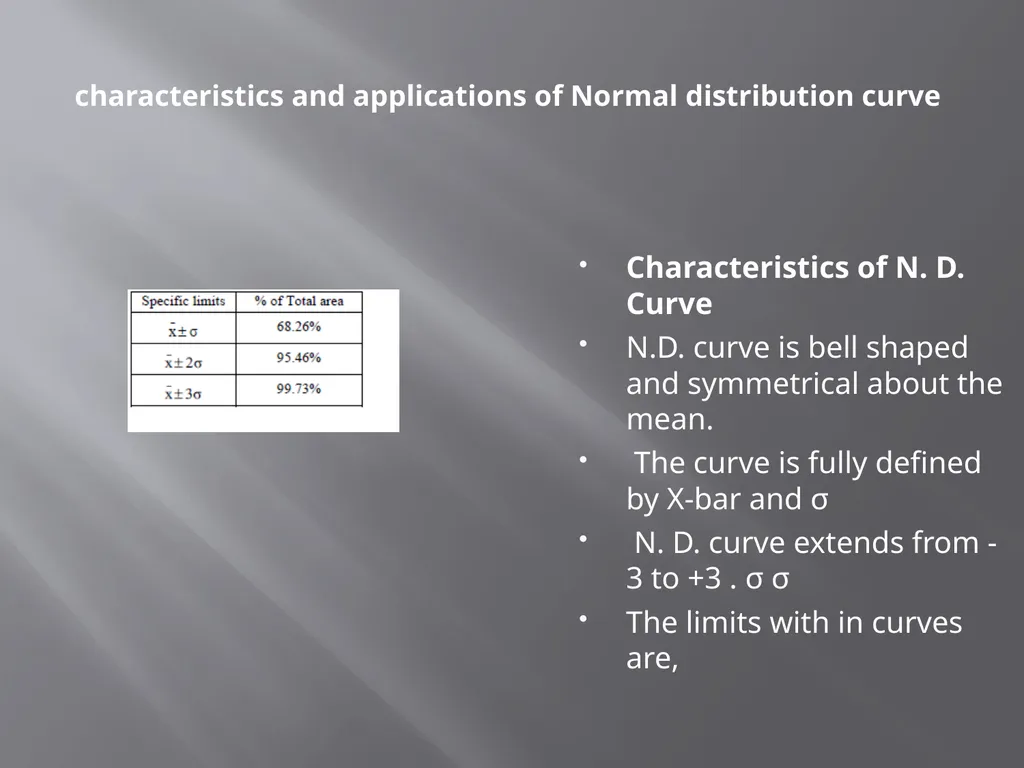
characteristics and applications of Normal distribution curve Characteristics of N. D. Curve
N.D. curve is bell shaped and symmetrical about the mean.
The curve is fully defined by X-bar and σ
N. D. curve extends from -3 to +3 . σ σ
The limits with in curves are,<br>
02
Ch7 Statastical Quality control C505.7-Analyze the data and draw control charts to understand SQC.<br>
03
Applications of N. D. Curve: 1. In process capability study
2. The area under the curve between two limits represents the total % of production that will fall between these limits.
When selection 0f 3 limits, we are 95.73% sure that the observations will lie within permissible limits. σ
It helps to calculate the expected proportion of observation that will be less than or equal to specified value . _x
It also help to calculate the expected proportion of observation that will be beyond the specified value of _ x<br>
04
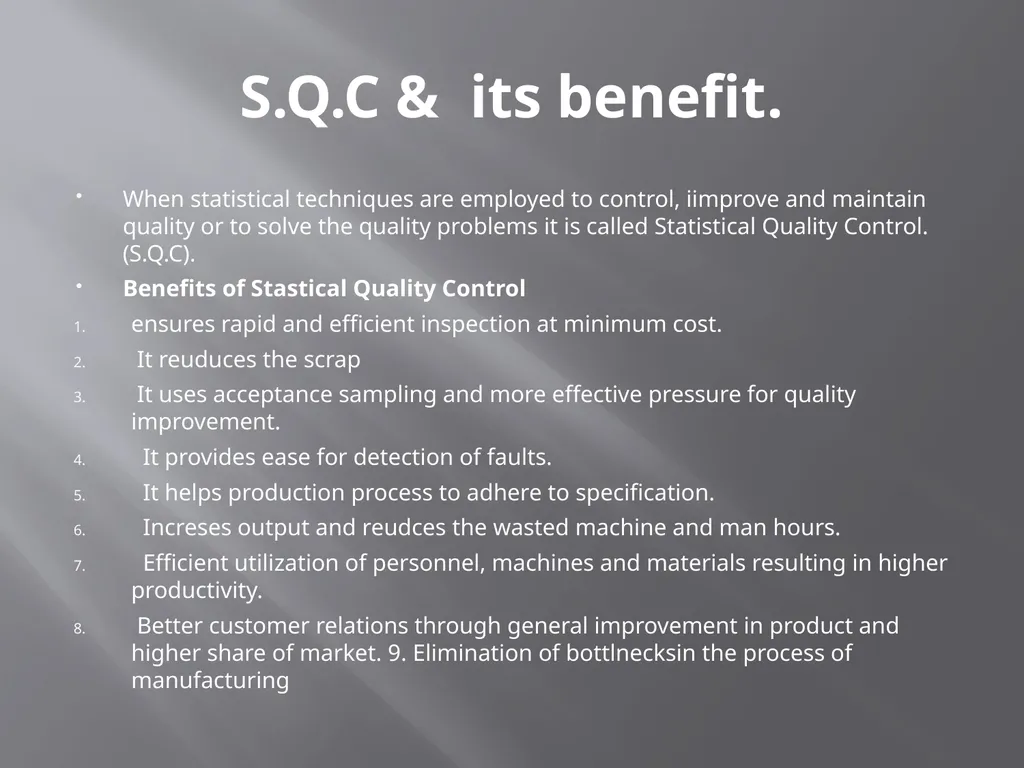
S.Q.C & its benefit. When statistical techniques are employed to control, iimprove and maintain quality or to solve the quality problems it is called Statistical Quality Control.(S.Q.C).
Benefits of Stastical Quality Control
ensures rapid and efficient inspection at minimum cost.
It reuduces the scrap
It uses acceptance sampling and more effective pressure for quality improvement.
It provides ease for detection of faults.
It helps production process to adhere to specification.
Increses output and reudces the wasted machine and man hours.
Efficient utilization of personnel, machines and materials resulting in higher productivity.
Better customer relations through general improvement in product and higher share of market. 9. Elimination of bottlnecksin the process of manufacturing<br>
05
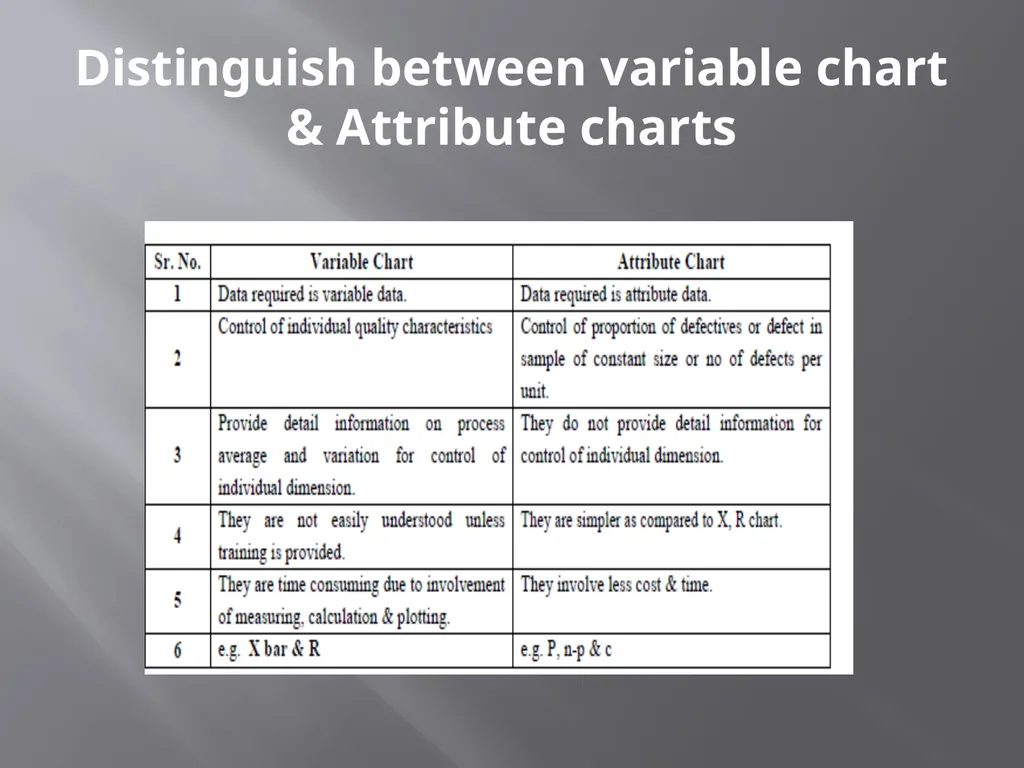
Distinguish between variable chart & Attribute charts<br>
06
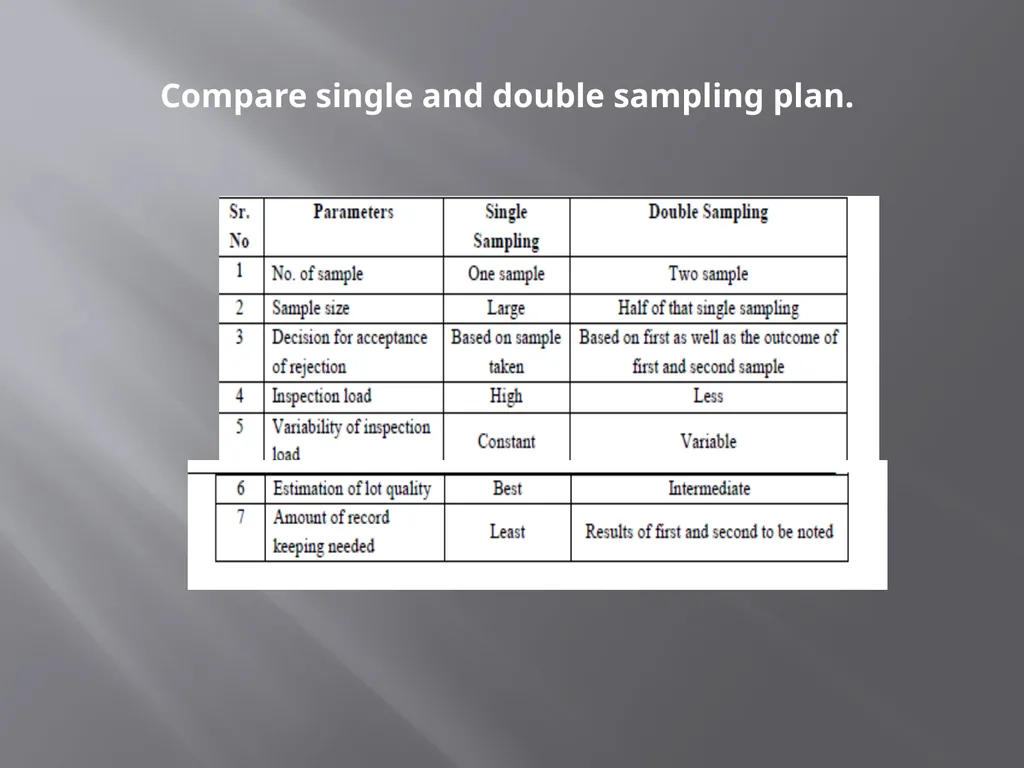
Compare single and double sampling plan.<br>
07
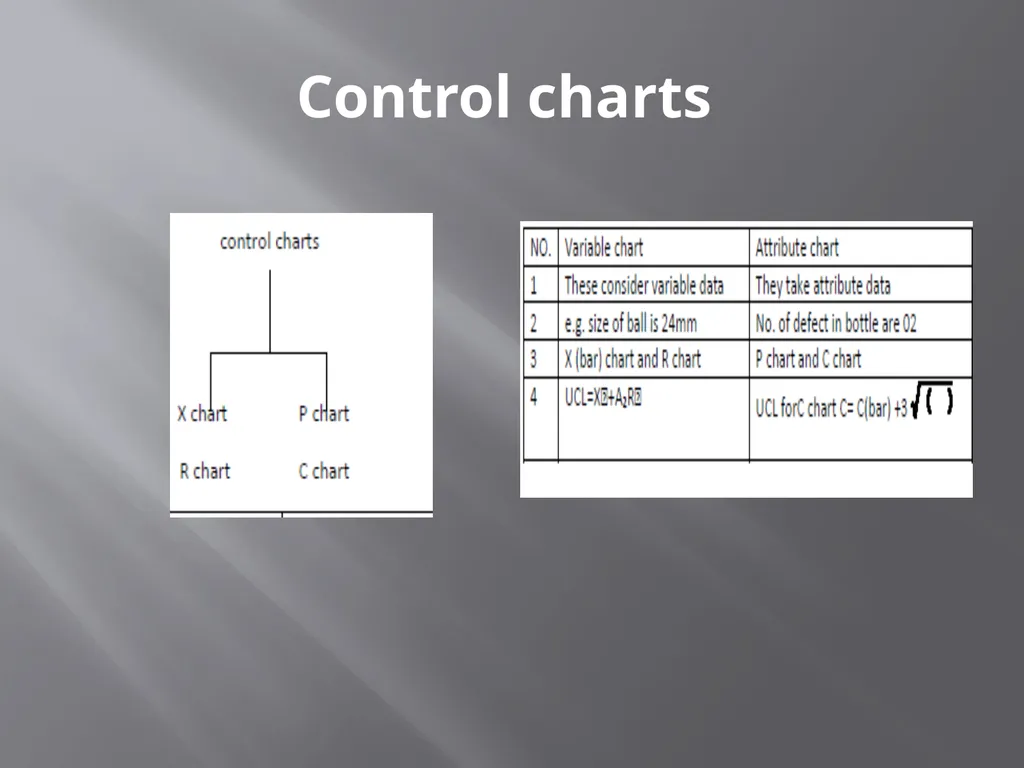
Control charts<br>
08
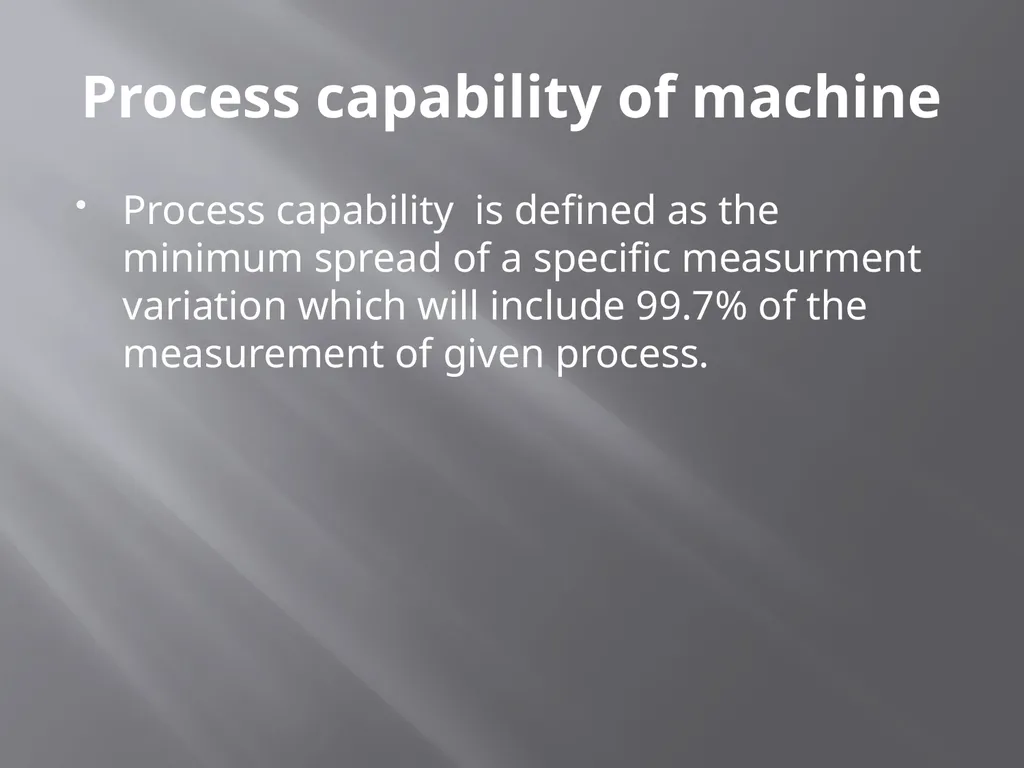
Process capability of machine Process capability is defined as the minimum spread of a specific measurment variation which will include 99.7% of the measurement of given process.<br>
09
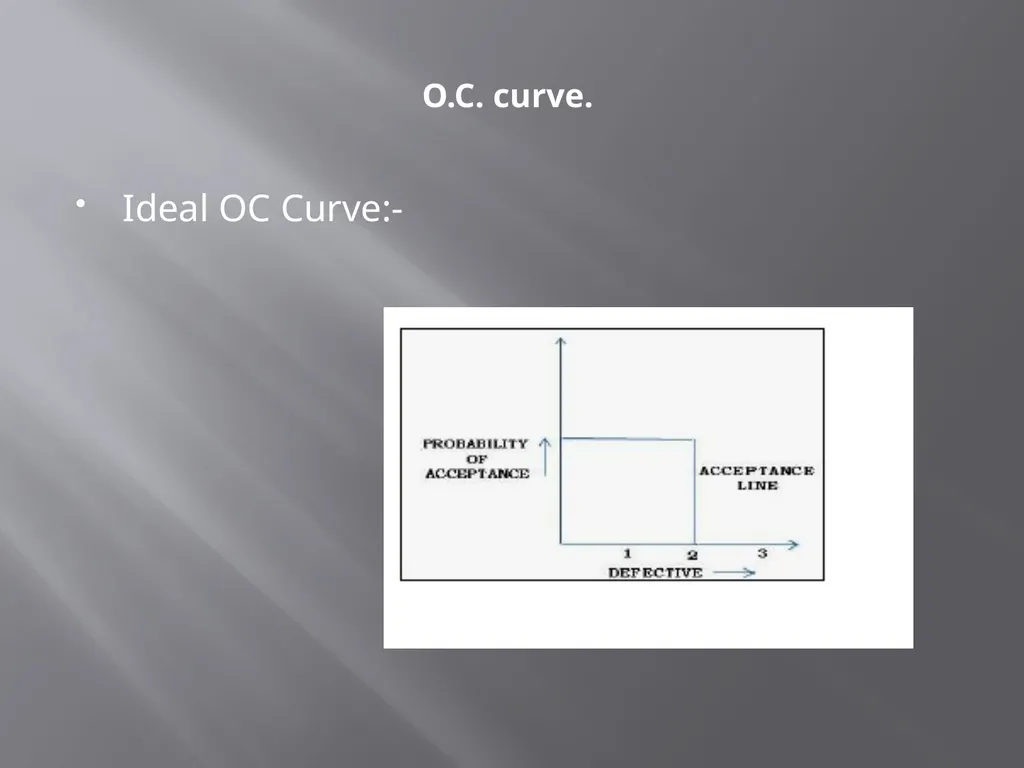
O.C. curve. Ideal OC Curve:-<br>
10
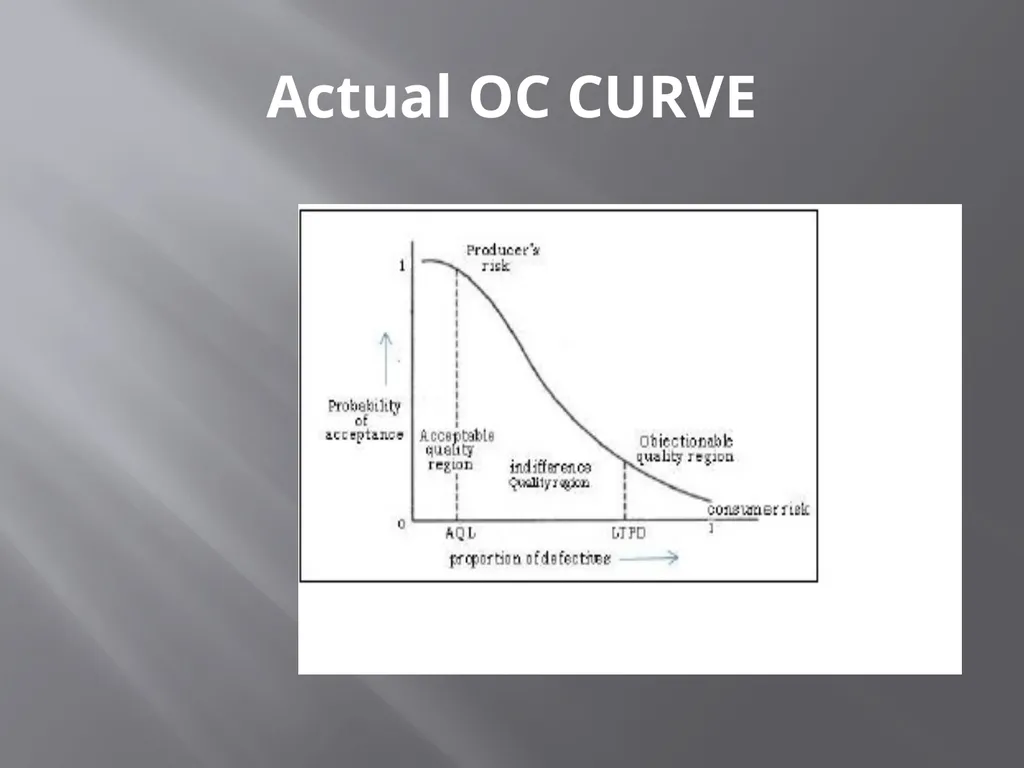
Actual OC CURVE<br>
11
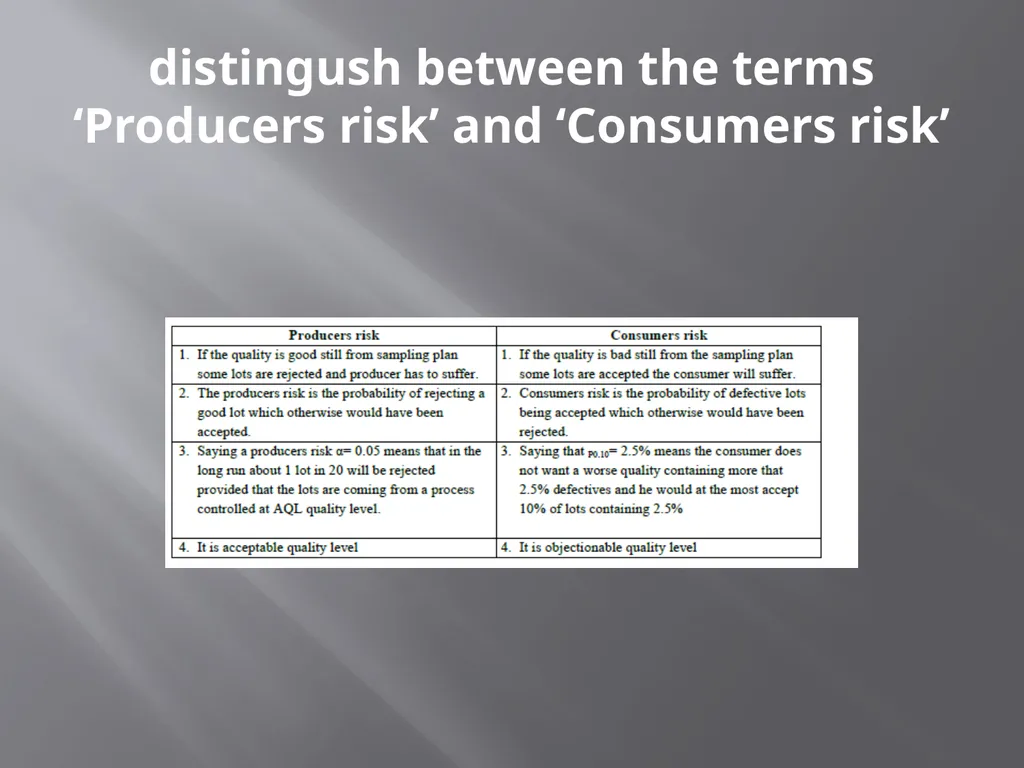
distingush between the terms ‘Producers risk’ and ‘Consumers risk’<br>
12
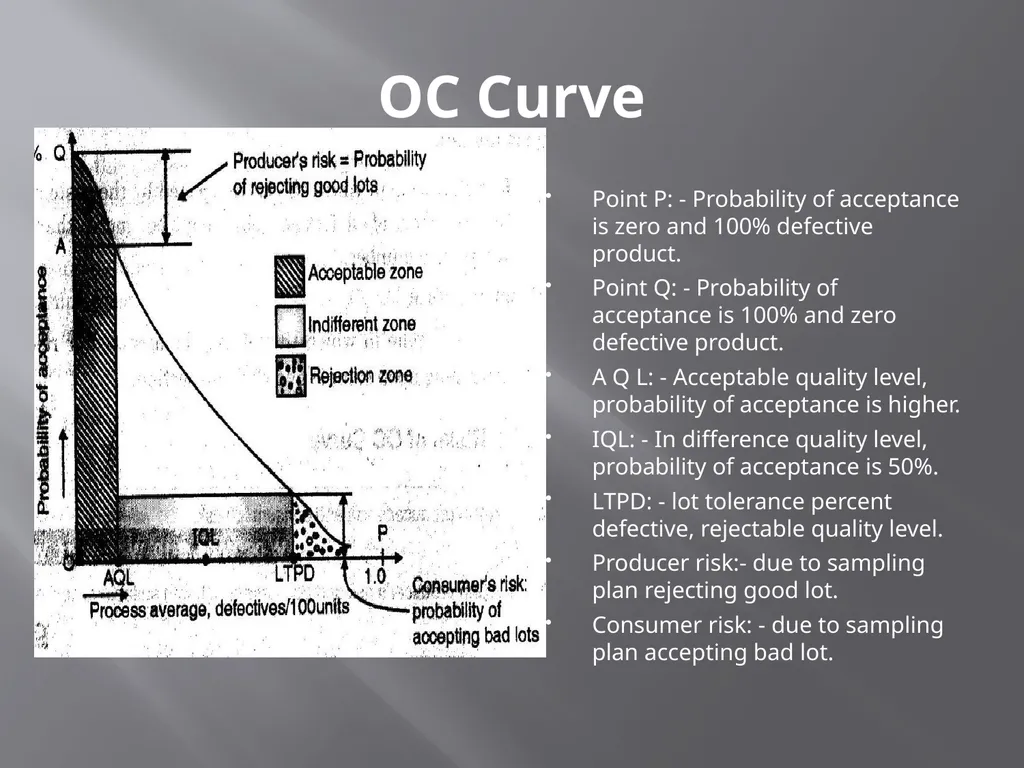
OC Curve Point P: - Probability of acceptance is zero and 100% defective product.
Point Q: - Probability of acceptance is 100% and zero defective product.
A Q L: - Acceptable quality level, probability of acceptance is higher.
IQL: - In difference quality level, probability of acceptance is 50%.
LTPD: - lot tolerance percent defective, rejectable quality level.
Producer risk:- due to sampling plan rejecting good lot.
Consumer risk: - due to sampling plan accepting bad lot.<br>