
Child Poverty and Social Exclusion Jonathan



Description: Child Poverty and Social Exclusion Jonathan Bradshaw Research Seminar The State of the Art of Measuring Poverty and Social Exclusion in the UK and Japan IPSS Tokyo January 6 2012 In the UK child poverty targets missed child poverty now
Related Topics
Download Presentation
"Child Poverty and Social Exclusion Jonathan" is the property of its rightful owner. Permission is granted to download and print the materials on this website for personal, non-commercial use only, and to display it on your personal computer provided you do not modify the materials and that you retain all copyright notices contained in the materials. By downloading content from our website, you accept the terms of this agreement.
Presentation Transcript
slide1. Child Poverty and Social Exclusion
Jonathan Bradshaw Research Seminar
The State of the Art of Measuring Poverty and Social Exclusion in the UK and Japan
IPSS
Tokyo
January 6 2012<br>
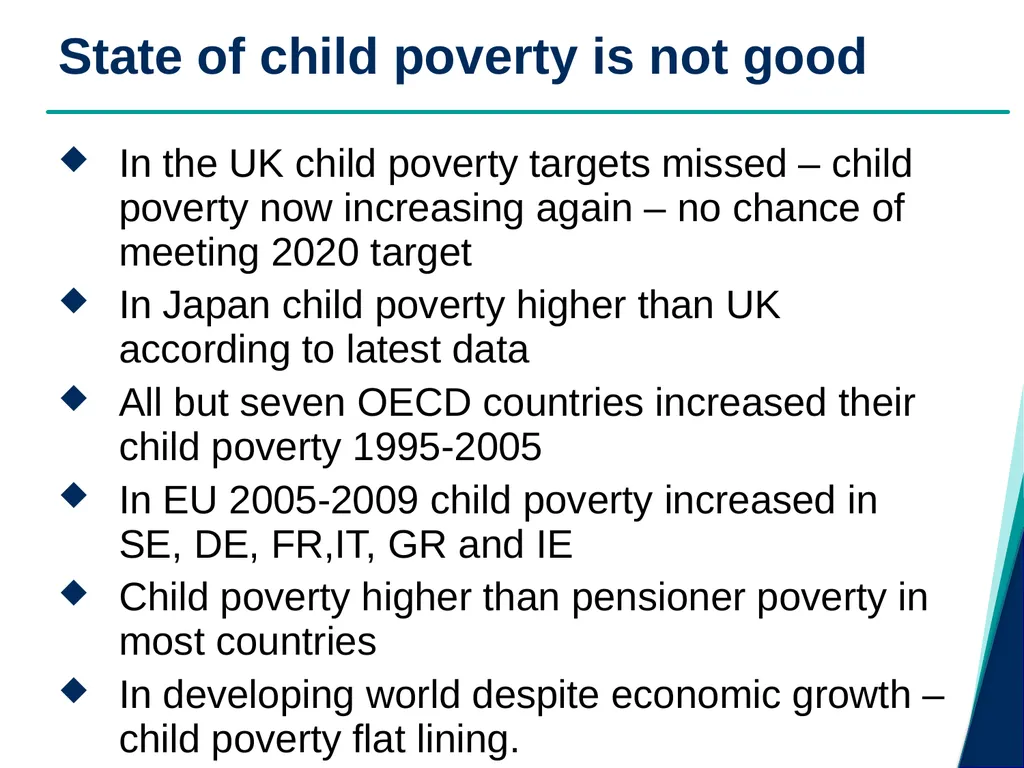
slide2. In the UK child poverty targets missed – child poverty now increasing again – no chance of meeting 2020 target
In Japan child poverty higher than UK according to latest data
All but seven OECD countries increased their child poverty 1995-2005
In EU 2005-2009 child poverty increased in SE, DE, FR,IT, GR and IE
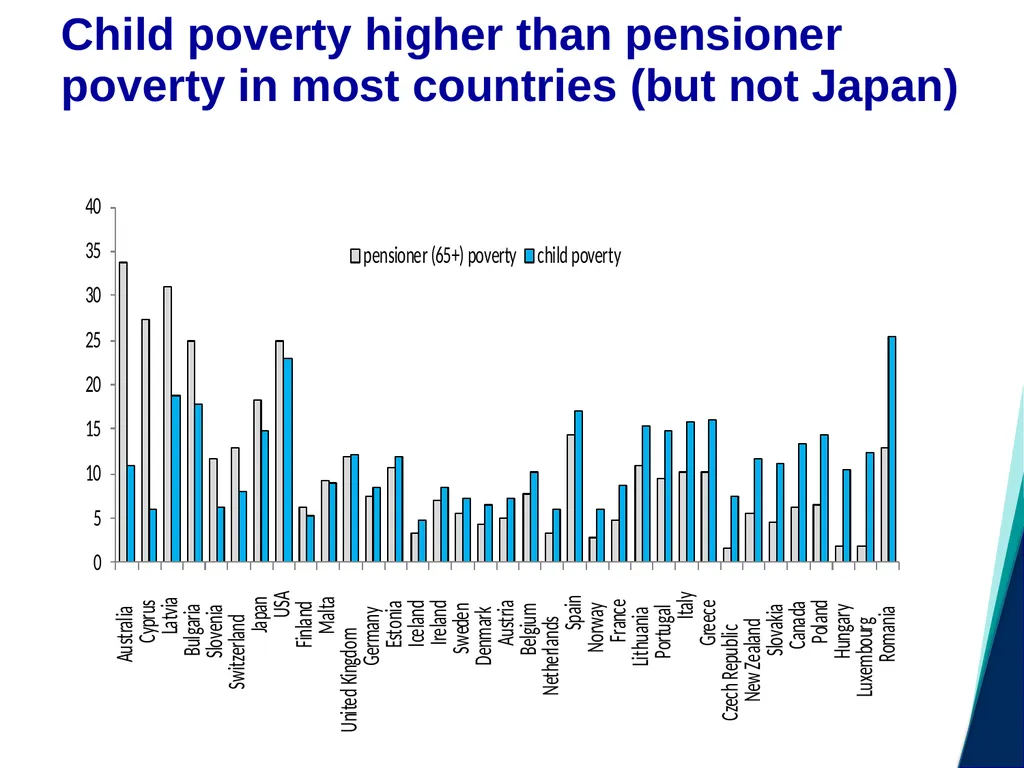
Child poverty higher than pensioner poverty in most countries
In developing world despite economic growth – child poverty flat lining. State of child poverty is not good<br>
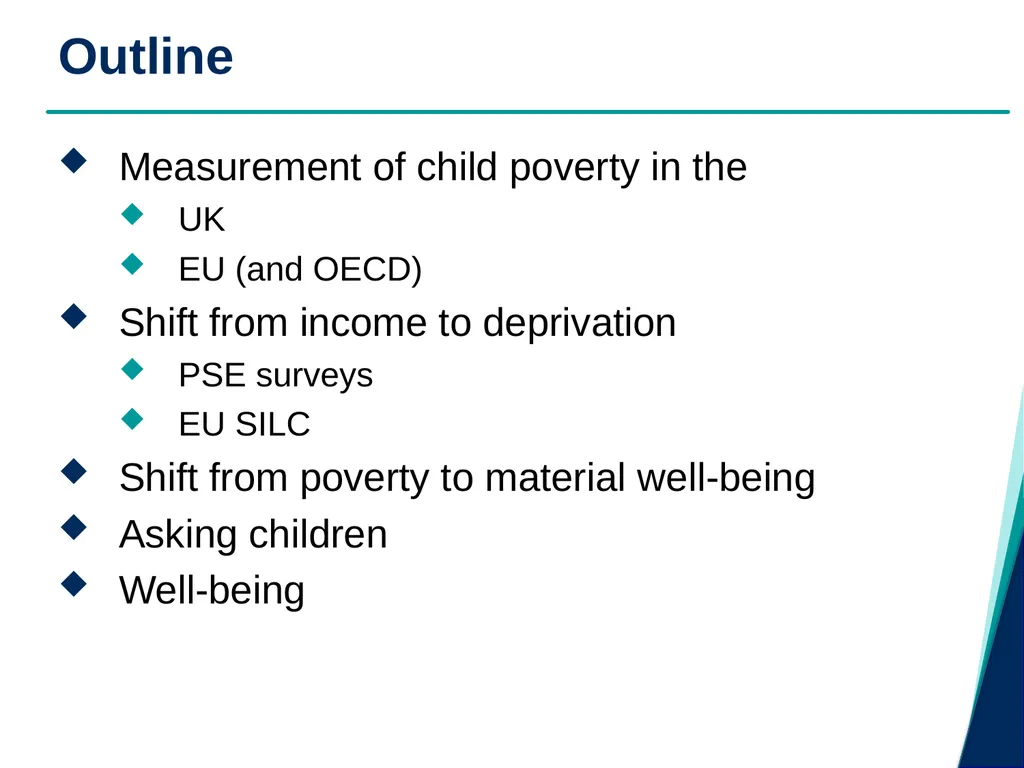
slide3. Measurement of child poverty in the
UK
EU (and OECD)
Shift from income to deprivation
PSE surveys
EU SILC
Shift from poverty to material well-being
Asking children
Well-being Outline<br>
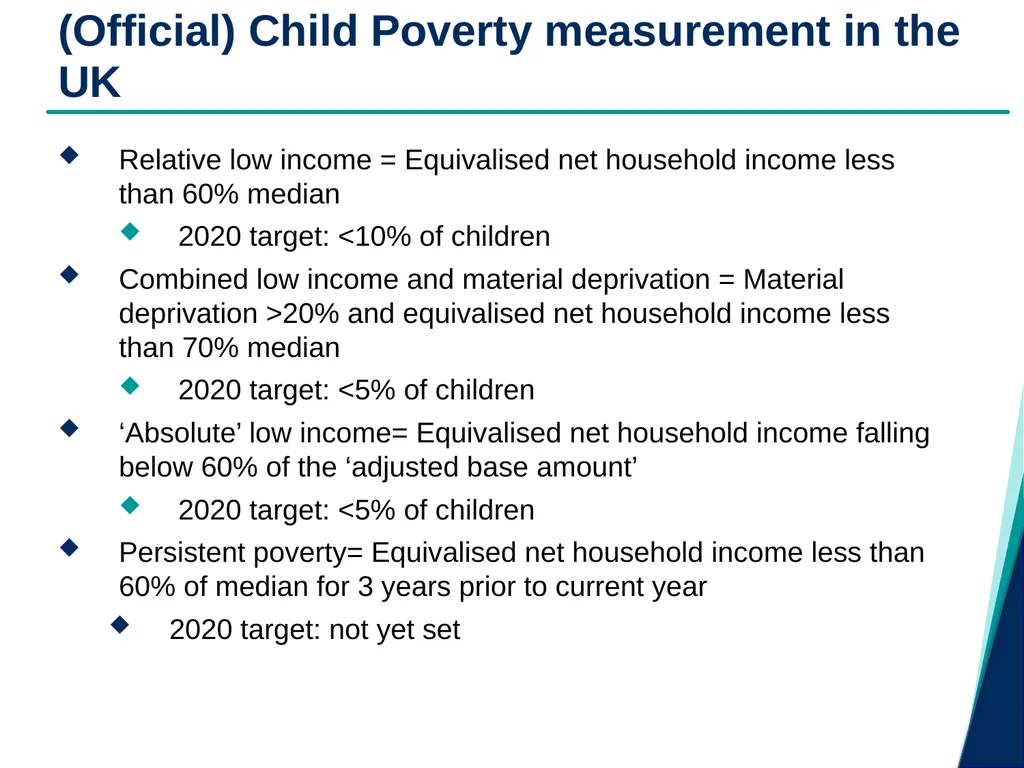
slide4. Relative low income = Equivalised net household income less than 60% median
2020 target: <10% of children
Combined low income and material deprivation = Material deprivation >20% and equivalised net household income less than 70% median
2020 target: <5% of children
‘Absolute’ low income= Equivalised net household income falling below 60% of the ‘adjusted base amount’
2020 target: <5% of children
Persistent poverty= Equivalised net household income less than 60% of median for 3 years prior to current year
2020 target: not yet set (Official) Child Poverty measurement in the UK<br>
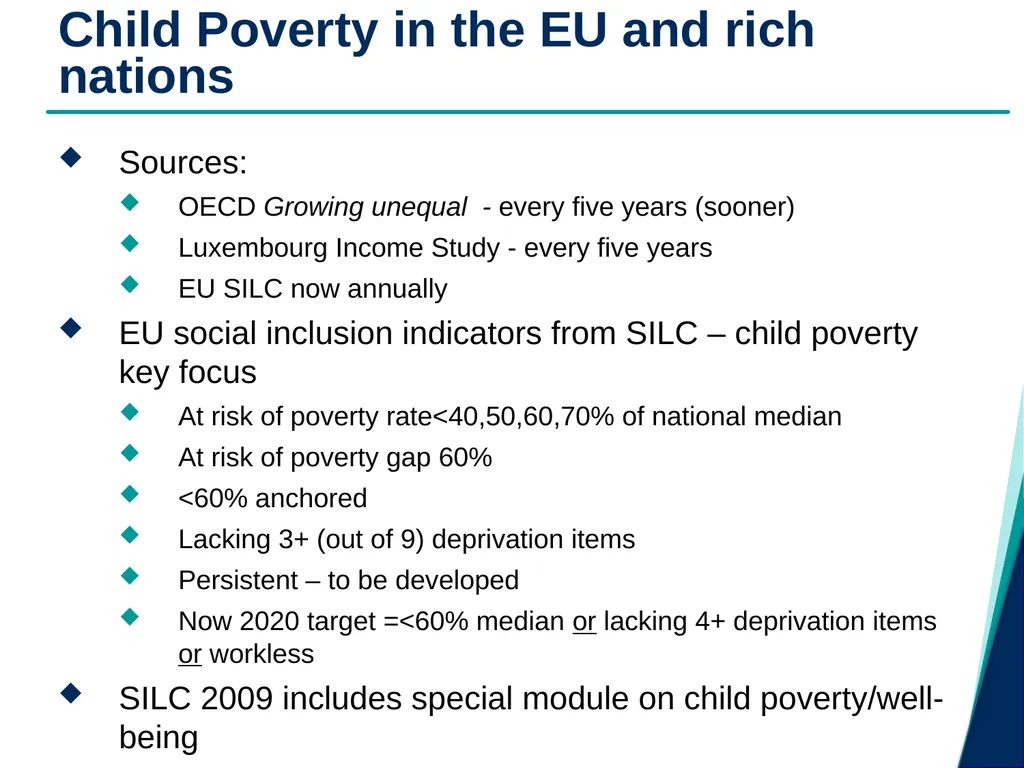
slide5. Sources:
OECD Growing unequal - every five years (sooner)
Luxembourg Income Study - every five years
EU SILC now annually
EU social inclusion indicators from SILC – child poverty key focus
At risk of poverty rate<40,50,60,70% of national median
At risk of poverty gap 60%
<60% anchored
Lacking 3+ (out of 9) deprivation items
Persistent – to be developed
Now 2020 target =<60% median or lacking 4+ deprivation items or workless
SILC 2009 includes special module on child poverty/well-being Child Poverty in the EU and rich nations<br>
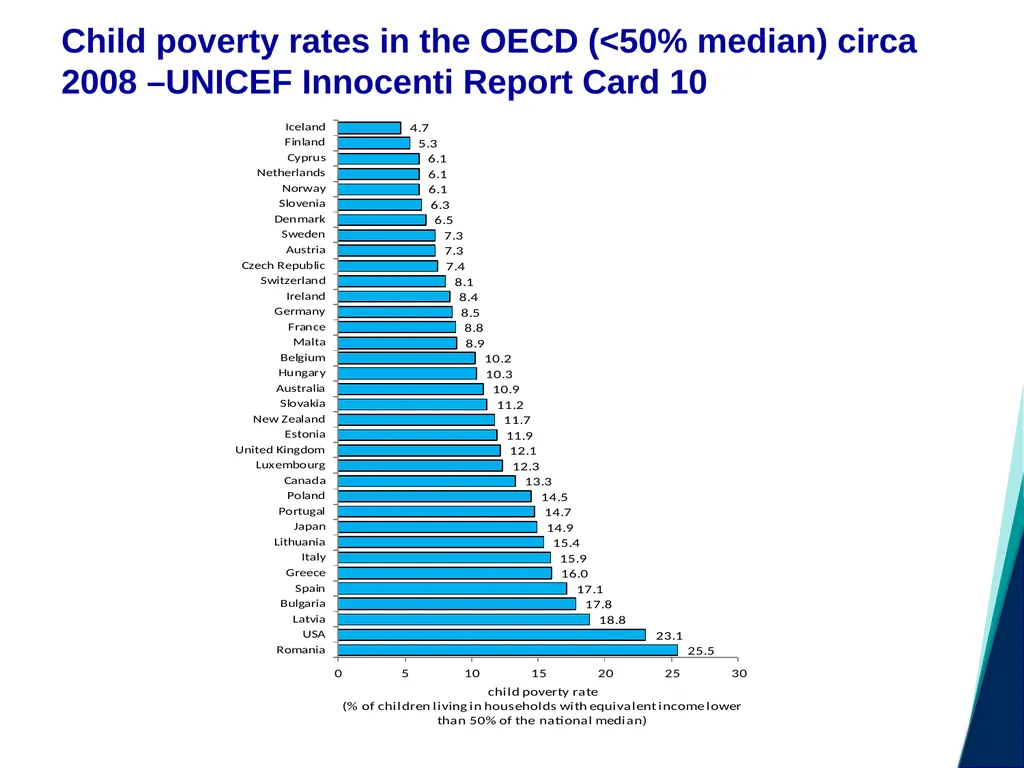
slide6. Child poverty rates in the OECD (<50% median) circa 2008 –UNICEF Innocenti Report Card 10<br>
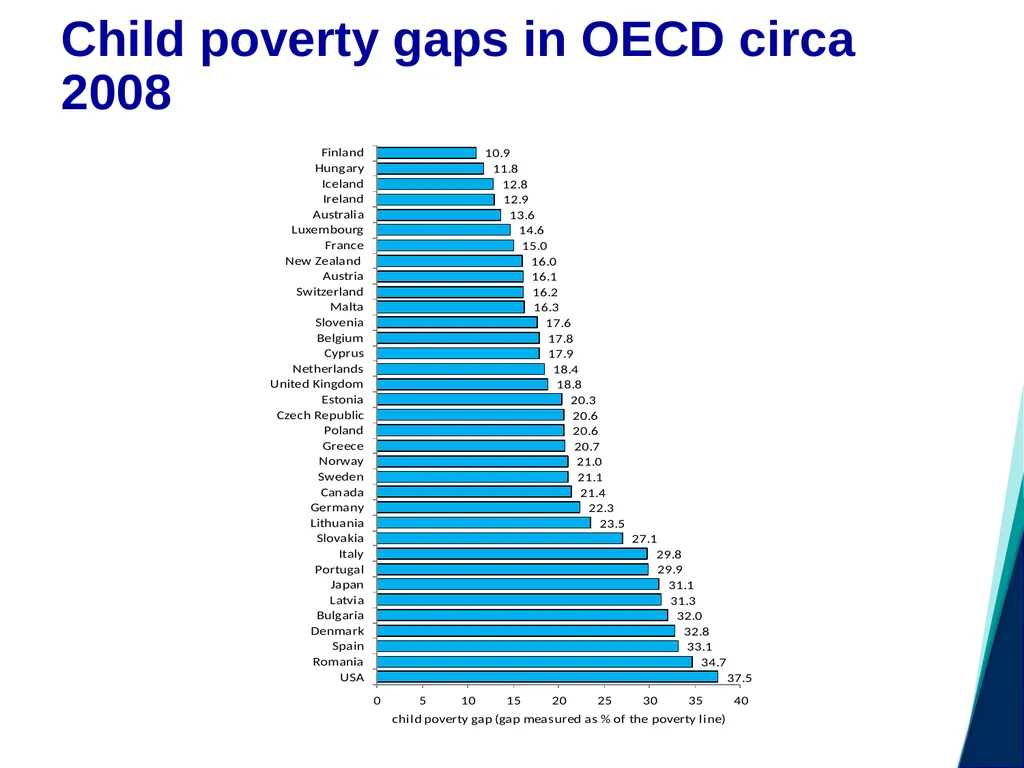
slide7. Child poverty gaps in OECD circa 2008<br>
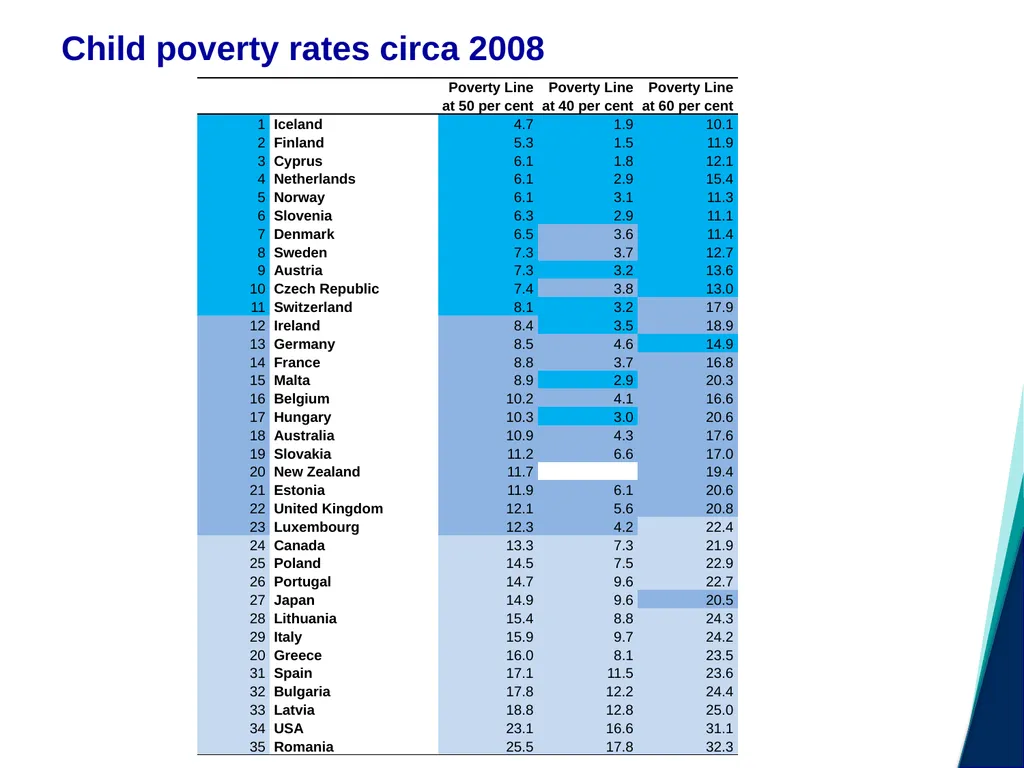
slide8. Child poverty rates circa 2008<br>
slide9. Child poverty higher than pensioner poverty in most countries (but not Japan)<br>
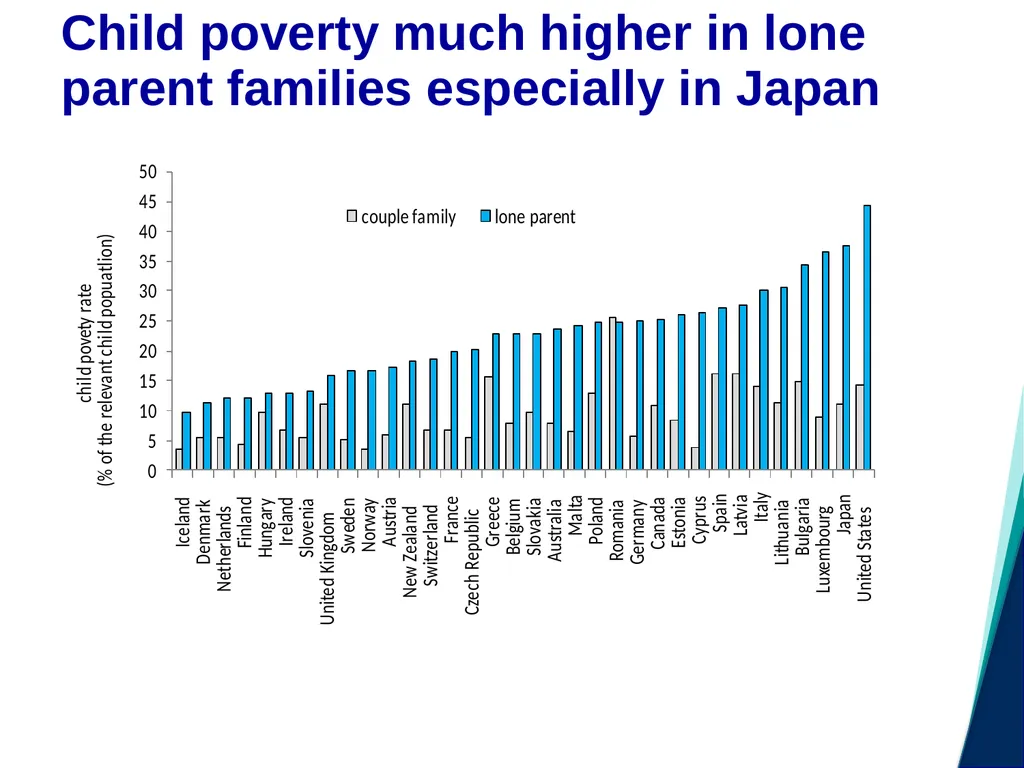
slide10. Child poverty much higher in lone parent families especially in Japan<br>
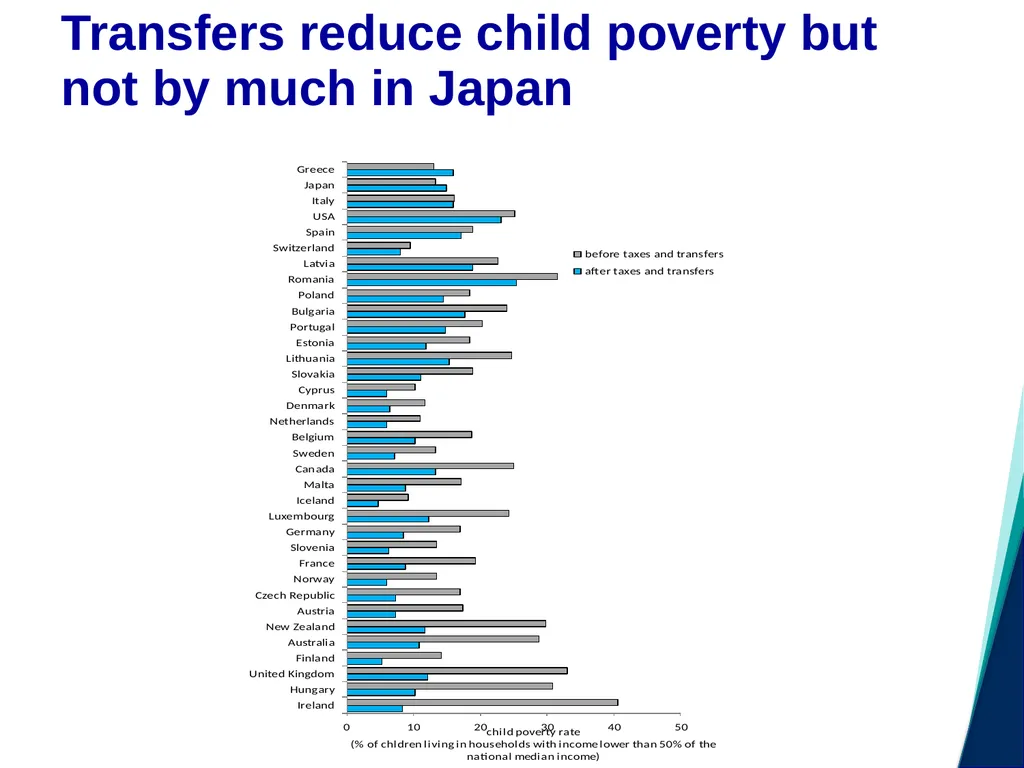
slide11. Transfers reduce child poverty but not by much in Japan<br>
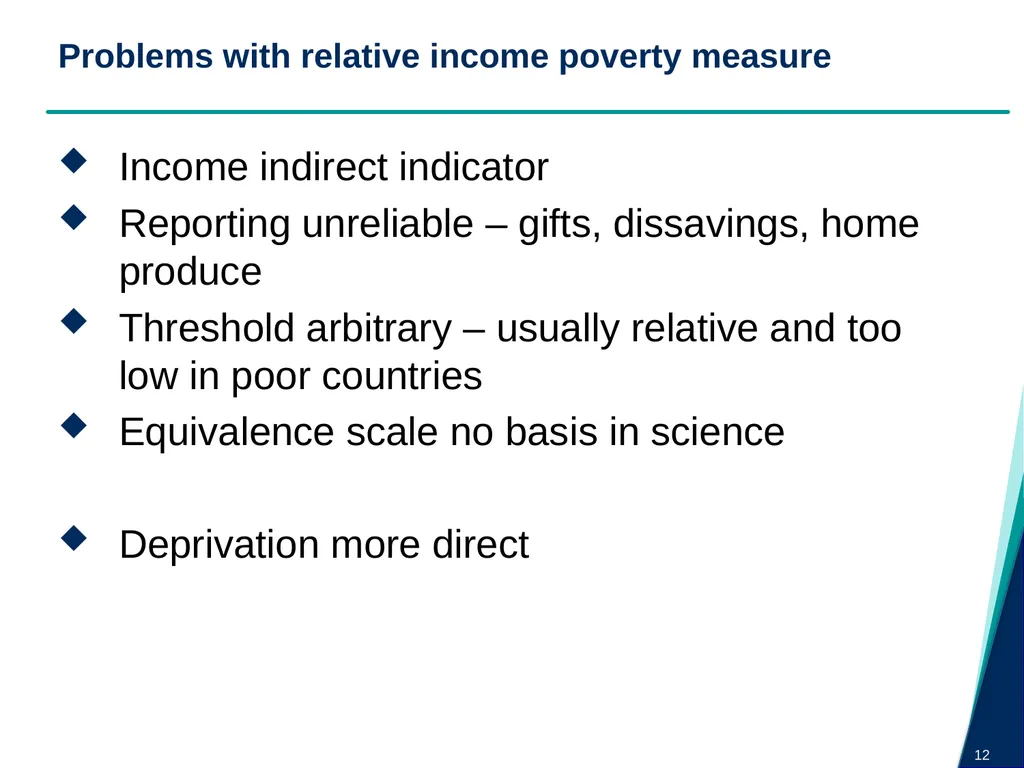
slide12. Income indirect indicator
Reporting unreliable – gifts, dissavings, home produce
Threshold arbitrary – usually relative and too low in poor countries
Equivalence scale no basis in science
Deprivation more direct Problems with relative income poverty measure 12<br>
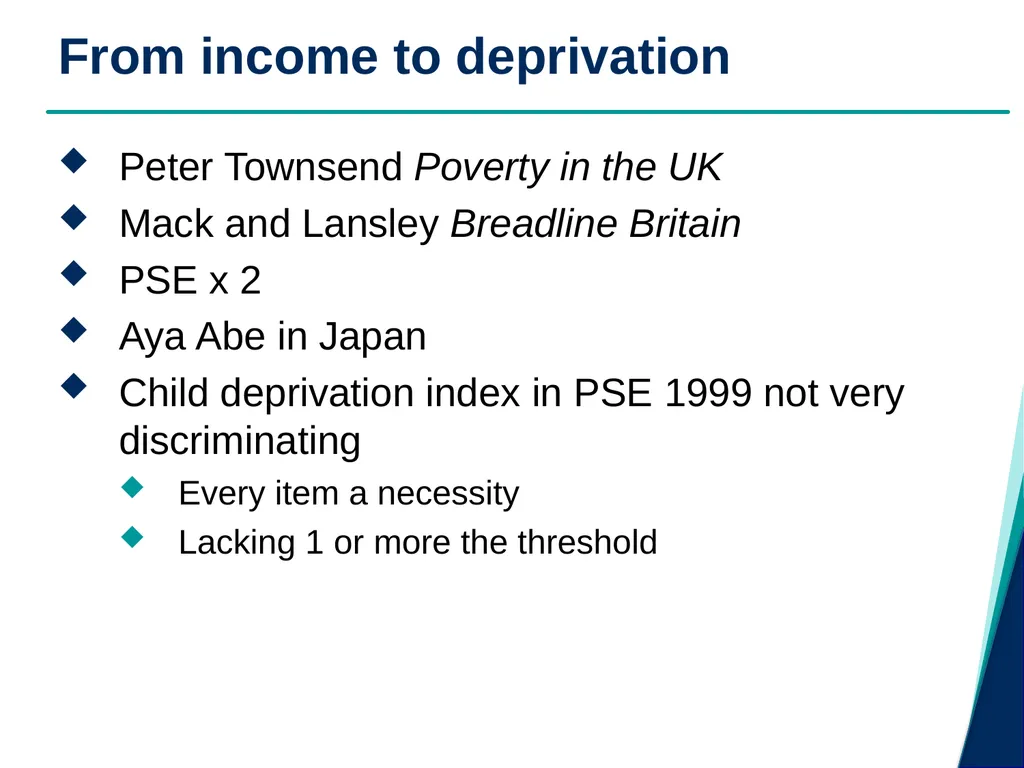
slide13. Peter Townsend Poverty in the UK
Mack and Lansley Breadline Britain
PSE x 2
Aya Abe in Japan
Child deprivation index in PSE 1999 not very discriminating
Every item a necessity
Lacking 1 or more the threshold From income to deprivation<br>
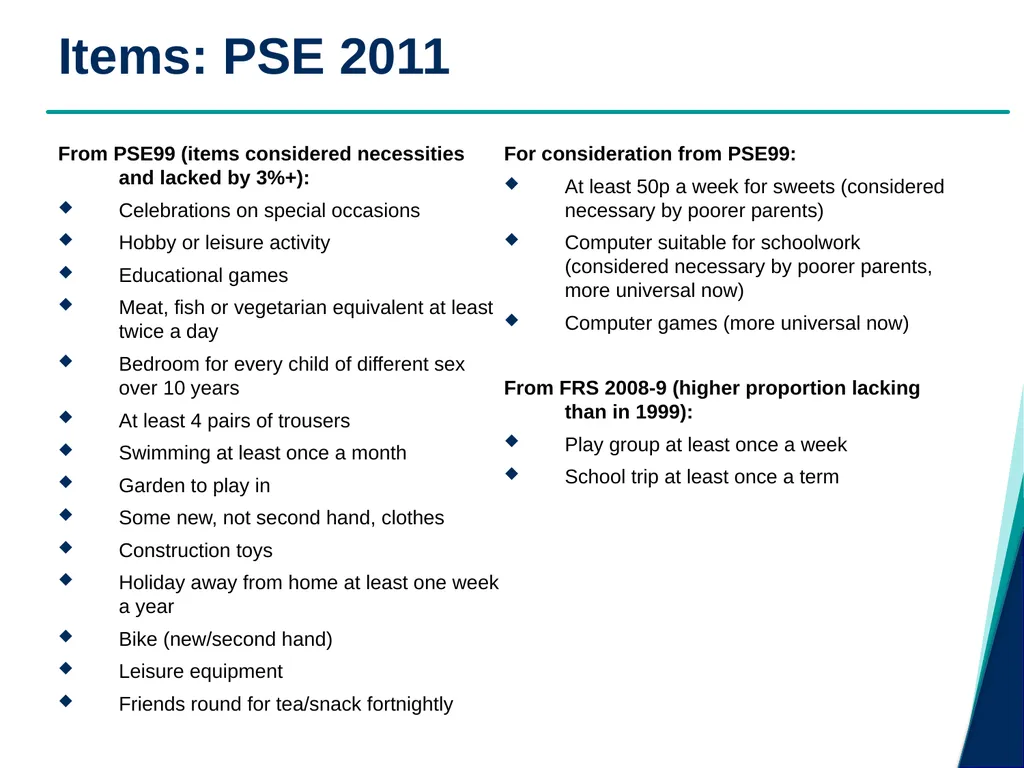
slide14. From PSE99 (items considered necessities and lacked by 3%+):
Celebrations on special occasions
Hobby or leisure activity
Educational games
Meat, fish or vegetarian equivalent at least twice a day
Bedroom for every child of different sex over 10 years
At least 4 pairs of trousers
Swimming at least once a month
Garden to play in
Some new, not second hand, clothes
Construction toys
Holiday away from home at least one week a year
Bike (new/second hand)
Leisure equipment
Friends round for tea/snack fortnightly
For consideration from PSE99:
At least 50p a week for sweets (considered necessary by poorer parents)
Computer suitable for schoolwork (considered necessary by poorer parents, more universal now)
Computer games (more universal now)
From FRS 2008-9 (higher proportion lacking than in 1999):
Play group at least once a week
School trip at least once a term Items: PSE 2011<br>
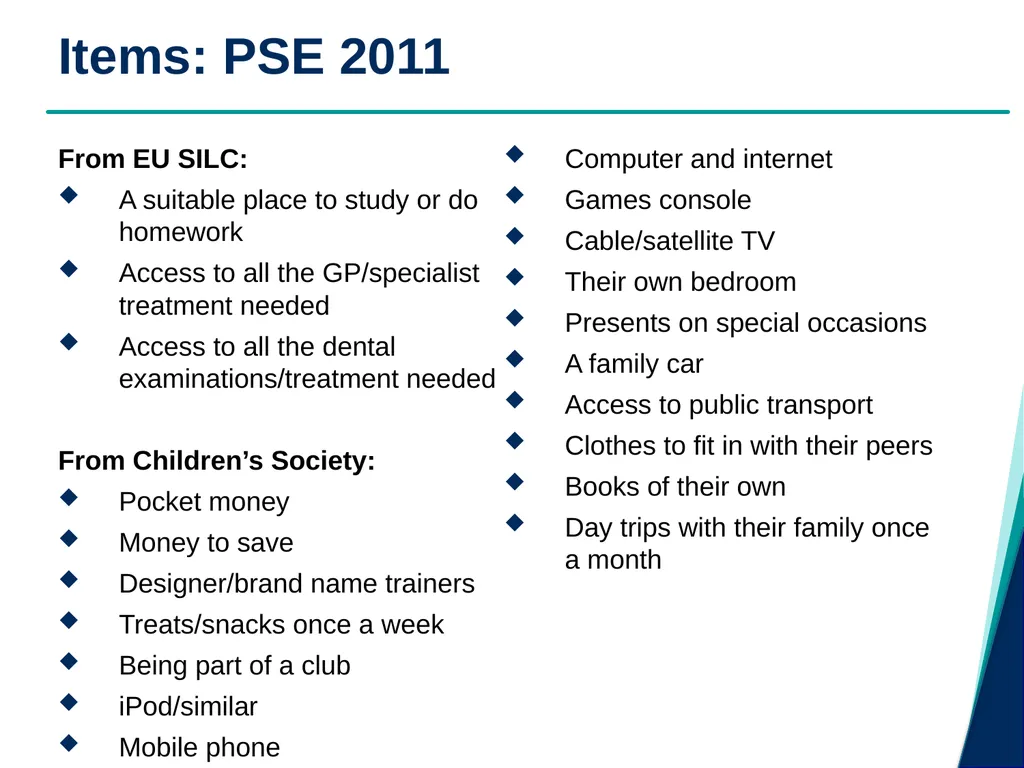
slide15. From EU SILC:
A suitable place to study or do homework
Access to all the GP/specialist treatment needed
Access to all the dental examinations/treatment needed
From Children’s Society:
Pocket money
Money to save
Designer/brand name trainers
Treats/snacks once a week
Being part of a club
iPod/similar
Mobile phone
Computer and internet
Games console
Cable/satellite TV
Their own bedroom
Presents on special occasions
A family car
Access to public transport
Clothes to fit in with their peers
Books of their own
Day trips with their family once a month Items: PSE 2011<br>
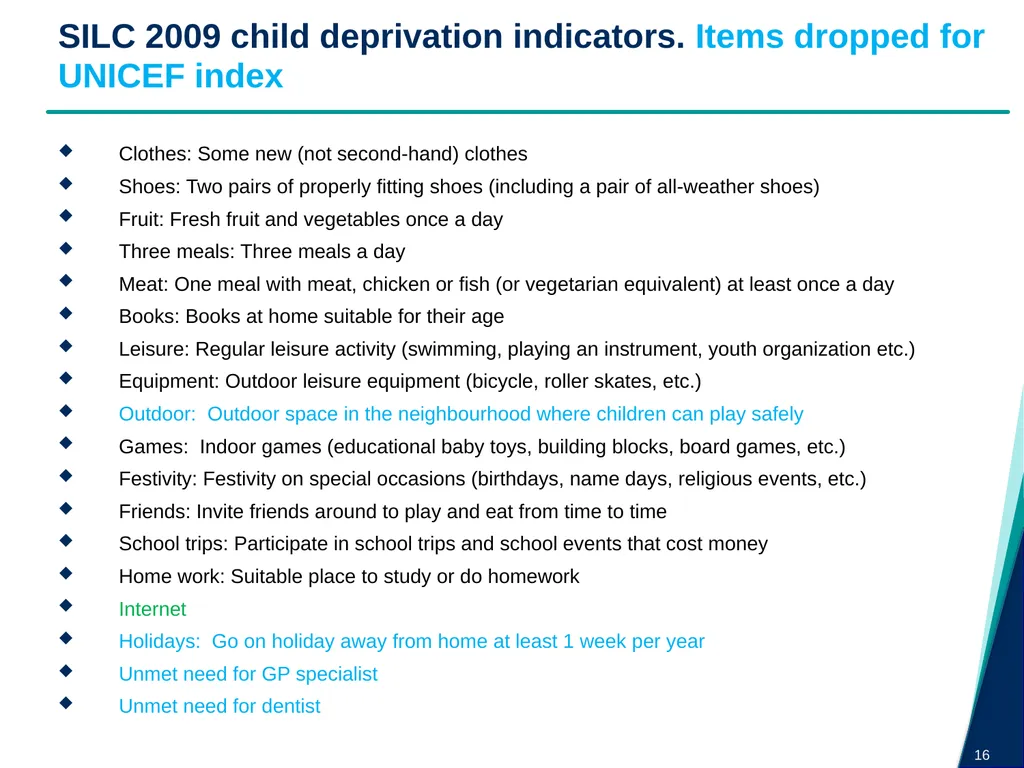
slide16. Clothes: Some new (not second-hand) clothes
Shoes: Two pairs of properly fitting shoes (including a pair of all-weather shoes)
Fruit: Fresh fruit and vegetables once a day
Three meals: Three meals a day
Meat: One meal with meat, chicken or fish (or vegetarian equivalent) at least once a day
Books: Books at home suitable for their age
Leisure: Regular leisure activity (swimming, playing an instrument, youth organization etc.)
Equipment: Outdoor leisure equipment (bicycle, roller skates, etc.)
Outdoor: Outdoor space in the neighbourhood where children can play safely
Games: Indoor games (educational baby toys, building blocks, board games, etc.)
Festivity: Festivity on special occasions (birthdays, name days, religious events, etc.)
Friends: Invite friends around to play and eat from time to time
School trips: Participate in school trips and school events that cost money
Home work: Suitable place to study or do homework
Internet
Holidays: Go on holiday away from home at least 1 week per year
Unmet need for GP specialist
Unmet need for dentist SILC 2009 child deprivation indicators. Items dropped for UNICEF index 16<br>
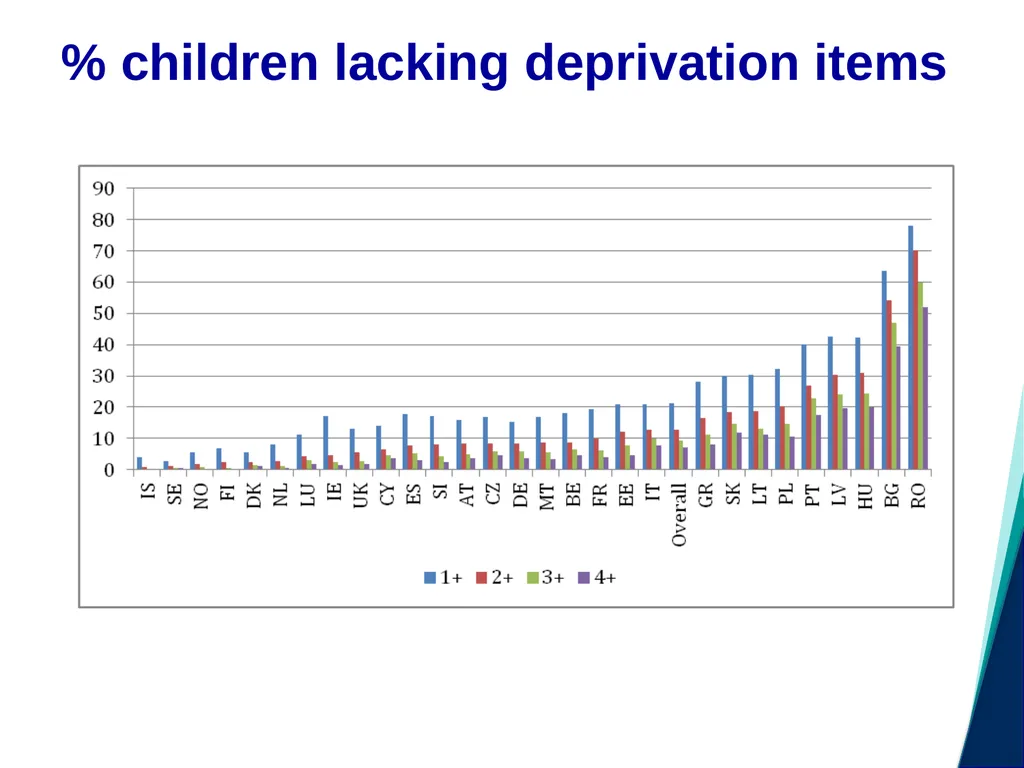
slide17. % children lacking deprivation items<br>
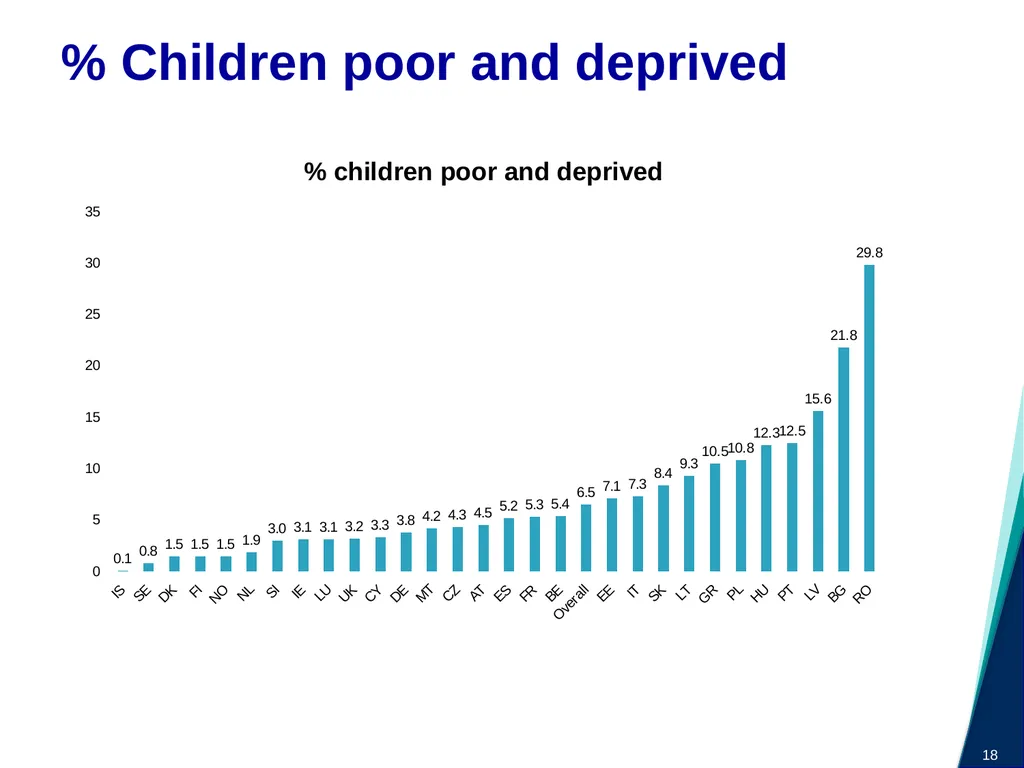
slide18. 18 % Children poor and deprived<br>
slide19. Children as respondents
Children actors in their own lives
Children deprived in rich households and not deprived in poor households
Closer association with child well-being
Broader conceptions
Bristol Social Exclusion matrix (B-sem)
Child well-being Two developments<br>
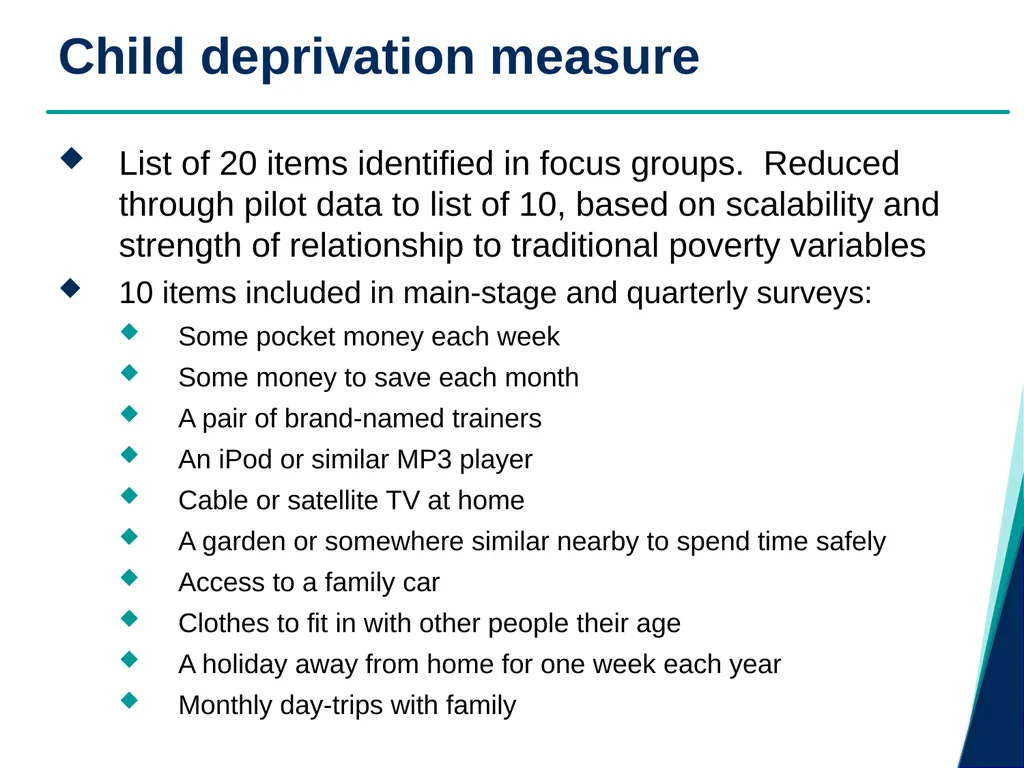
slide20. Child deprivation measure List of 20 items identified in focus groups. Reduced through pilot data to list of 10, based on scalability and strength of relationship to traditional poverty variables
10 items included in main-stage and quarterly surveys:
Some pocket money each week
Some money to save each month
A pair of brand-named trainers
An iPod or similar MP3 player
Cable or satellite TV at home
A garden or somewhere similar nearby to spend time safely
Access to a family car
Clothes to fit in with other people their age
A holiday away from home for one week each year
Monthly day-trips with family<br>
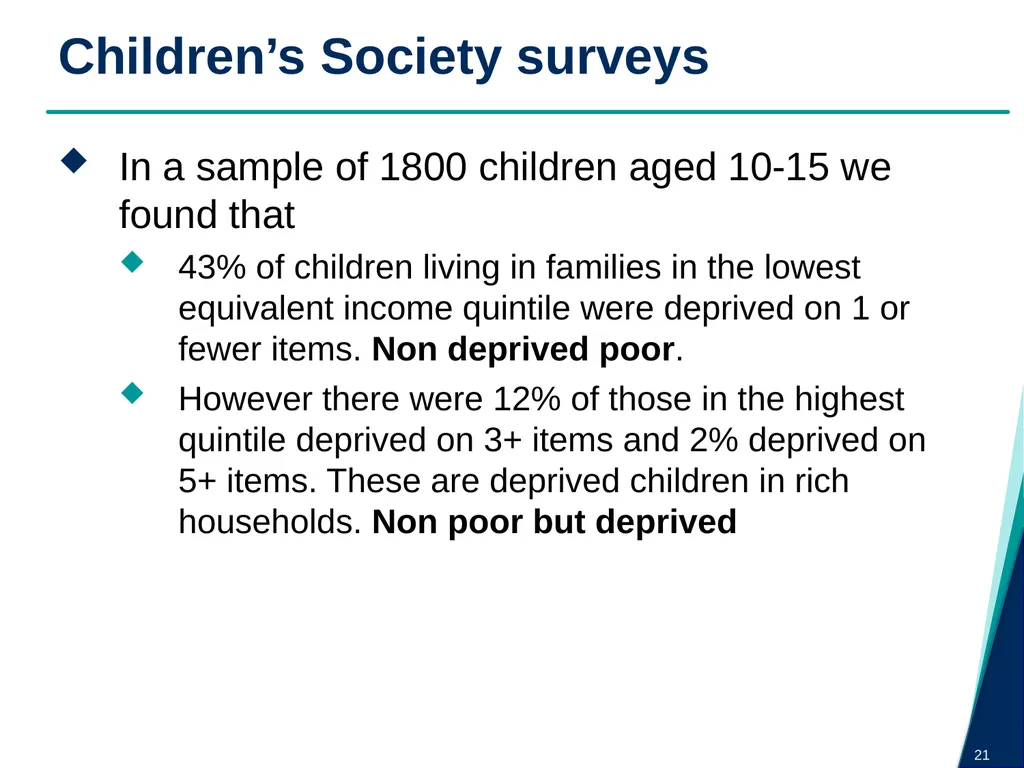
slide21. In a sample of 1800 children aged 10-15 we found that
43% of children living in families in the lowest equivalent income quintile were deprived on 1 or fewer items. Non deprived poor.
However there were 12% of those in the highest quintile deprived on 3+ items and 2% deprived on 5+ items. These are deprived children in rich households. Non poor but deprived Children’s Society surveys 21<br>
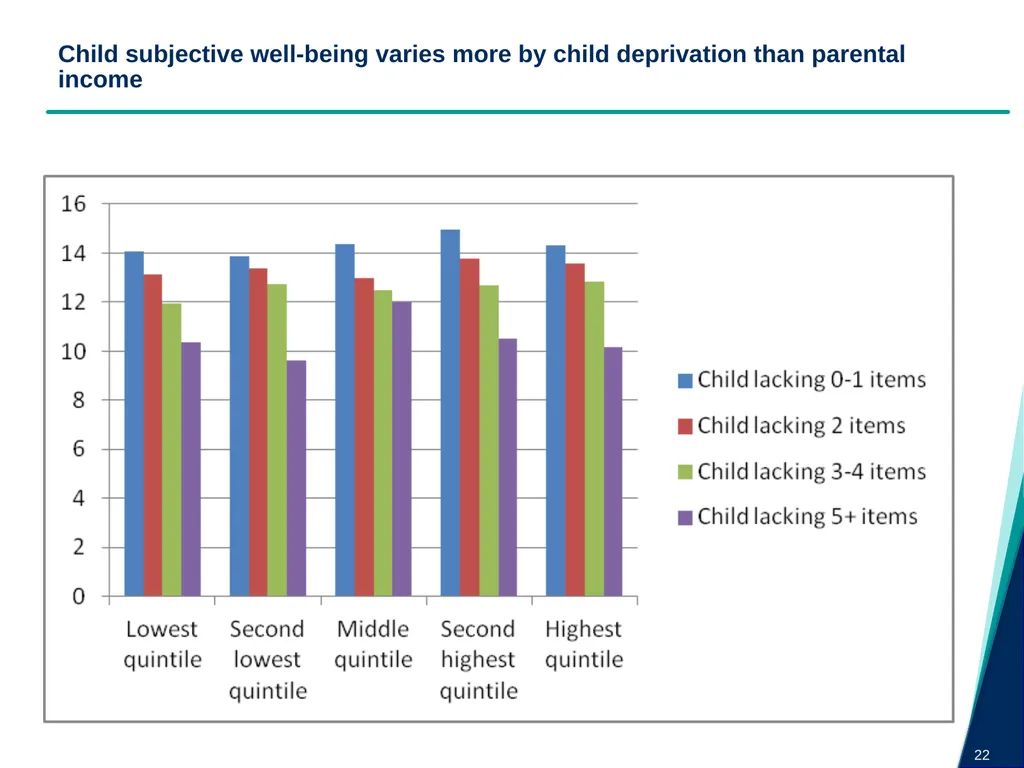
slide22. Child subjective well-being varies more by child deprivation than parental income 22<br>
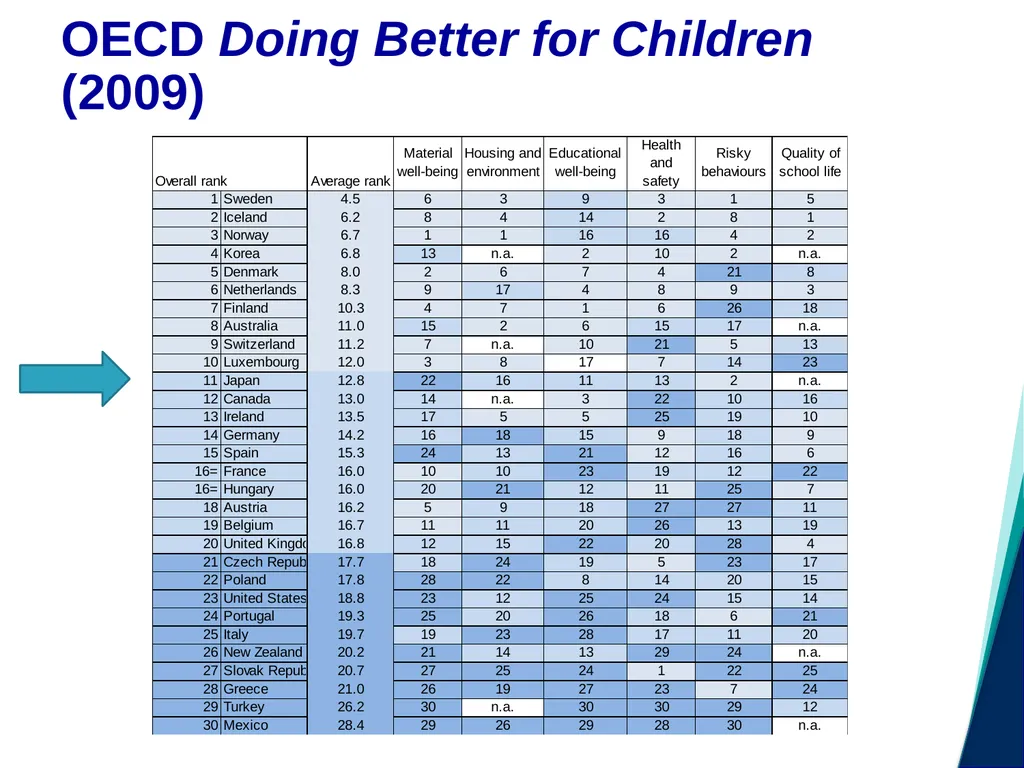
slide23. OECD Doing Better for Children (2009)<br>
slide24. Child income poverty and child well-being<br>
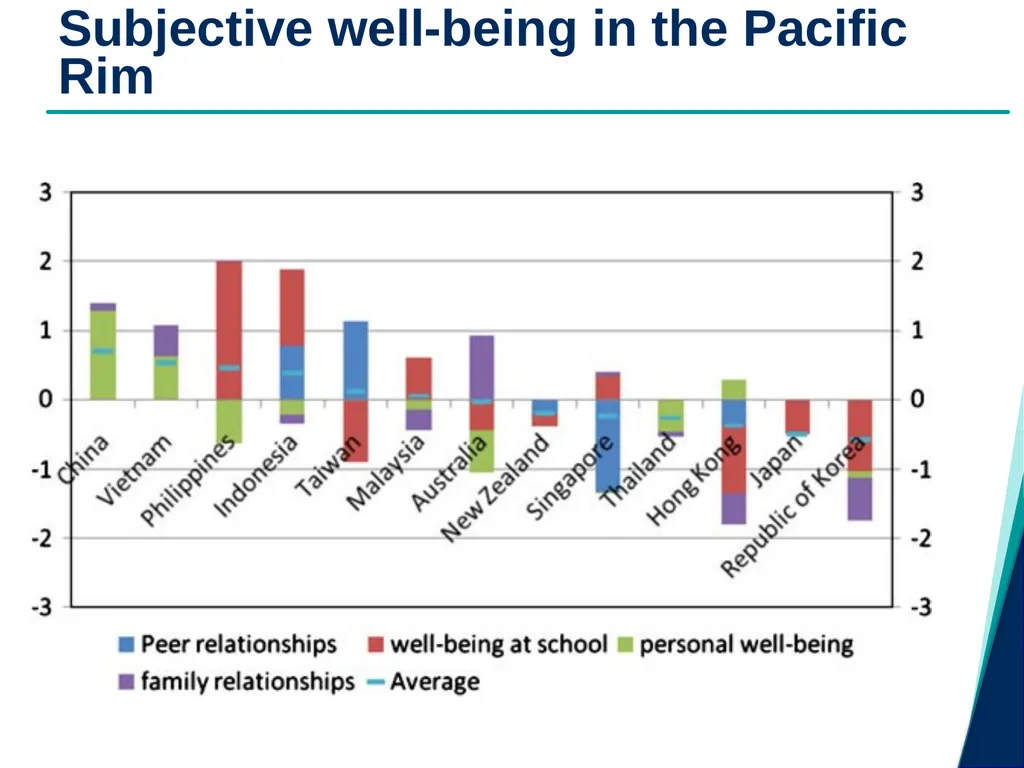
slide25. Subjective well-being in the Pacific Rim<br>
slide26. jonathan.bradshaw@york.ac.uk
http://www-users.york.ac.uk/~jrb1/ The End 26<br>
The State of the Art of Measuring Poverty and Social Exclusion in the UK and Japan
IPSS
Tokyo
January 6 2012<br>
slide2. In the UK child poverty targets missed – child poverty now increasing again – no chance of meeting 2020 target
In Japan child poverty higher than UK according to latest data
All but seven OECD countries increased their child poverty 1995-2005
In EU 2005-2009 child poverty increased in SE, DE, FR,IT, GR and IE
Child poverty higher than pensioner poverty in most countries
In developing world despite economic growth – child poverty flat lining. State of child poverty is not good<br>
slide3. Measurement of child poverty in the
UK
EU (and OECD)
Shift from income to deprivation
PSE surveys
EU SILC
Shift from poverty to material well-being
Asking children
Well-being Outline<br>
slide4. Relative low income = Equivalised net household income less than 60% median
2020 target: <10% of children
Combined low income and material deprivation = Material deprivation >20% and equivalised net household income less than 70% median
2020 target: <5% of children
‘Absolute’ low income= Equivalised net household income falling below 60% of the ‘adjusted base amount’
2020 target: <5% of children
Persistent poverty= Equivalised net household income less than 60% of median for 3 years prior to current year
2020 target: not yet set (Official) Child Poverty measurement in the UK<br>
slide5. Sources:
OECD Growing unequal - every five years (sooner)
Luxembourg Income Study - every five years
EU SILC now annually
EU social inclusion indicators from SILC – child poverty key focus
At risk of poverty rate<40,50,60,70% of national median
At risk of poverty gap 60%
<60% anchored
Lacking 3+ (out of 9) deprivation items
Persistent – to be developed
Now 2020 target =<60% median or lacking 4+ deprivation items or workless
SILC 2009 includes special module on child poverty/well-being Child Poverty in the EU and rich nations<br>
slide6. Child poverty rates in the OECD (<50% median) circa 2008 –UNICEF Innocenti Report Card 10<br>
slide7. Child poverty gaps in OECD circa 2008<br>
slide8. Child poverty rates circa 2008<br>
slide9. Child poverty higher than pensioner poverty in most countries (but not Japan)<br>
slide10. Child poverty much higher in lone parent families especially in Japan<br>
slide11. Transfers reduce child poverty but not by much in Japan<br>
slide12. Income indirect indicator
Reporting unreliable – gifts, dissavings, home produce
Threshold arbitrary – usually relative and too low in poor countries
Equivalence scale no basis in science
Deprivation more direct Problems with relative income poverty measure 12<br>
slide13. Peter Townsend Poverty in the UK
Mack and Lansley Breadline Britain
PSE x 2
Aya Abe in Japan
Child deprivation index in PSE 1999 not very discriminating
Every item a necessity
Lacking 1 or more the threshold From income to deprivation<br>
slide14. From PSE99 (items considered necessities and lacked by 3%+):
Celebrations on special occasions
Hobby or leisure activity
Educational games
Meat, fish or vegetarian equivalent at least twice a day
Bedroom for every child of different sex over 10 years
At least 4 pairs of trousers
Swimming at least once a month
Garden to play in
Some new, not second hand, clothes
Construction toys
Holiday away from home at least one week a year
Bike (new/second hand)
Leisure equipment
Friends round for tea/snack fortnightly
For consideration from PSE99:
At least 50p a week for sweets (considered necessary by poorer parents)
Computer suitable for schoolwork (considered necessary by poorer parents, more universal now)
Computer games (more universal now)
From FRS 2008-9 (higher proportion lacking than in 1999):
Play group at least once a week
School trip at least once a term Items: PSE 2011<br>
slide15. From EU SILC:
A suitable place to study or do homework
Access to all the GP/specialist treatment needed
Access to all the dental examinations/treatment needed
From Children’s Society:
Pocket money
Money to save
Designer/brand name trainers
Treats/snacks once a week
Being part of a club
iPod/similar
Mobile phone
Computer and internet
Games console
Cable/satellite TV
Their own bedroom
Presents on special occasions
A family car
Access to public transport
Clothes to fit in with their peers
Books of their own
Day trips with their family once a month Items: PSE 2011<br>
slide16. Clothes: Some new (not second-hand) clothes
Shoes: Two pairs of properly fitting shoes (including a pair of all-weather shoes)
Fruit: Fresh fruit and vegetables once a day
Three meals: Three meals a day
Meat: One meal with meat, chicken or fish (or vegetarian equivalent) at least once a day
Books: Books at home suitable for their age
Leisure: Regular leisure activity (swimming, playing an instrument, youth organization etc.)
Equipment: Outdoor leisure equipment (bicycle, roller skates, etc.)
Outdoor: Outdoor space in the neighbourhood where children can play safely
Games: Indoor games (educational baby toys, building blocks, board games, etc.)
Festivity: Festivity on special occasions (birthdays, name days, religious events, etc.)
Friends: Invite friends around to play and eat from time to time
School trips: Participate in school trips and school events that cost money
Home work: Suitable place to study or do homework
Internet
Holidays: Go on holiday away from home at least 1 week per year
Unmet need for GP specialist
Unmet need for dentist SILC 2009 child deprivation indicators. Items dropped for UNICEF index 16<br>
slide17. % children lacking deprivation items<br>
slide18. 18 % Children poor and deprived<br>
slide19. Children as respondents
Children actors in their own lives
Children deprived in rich households and not deprived in poor households
Closer association with child well-being
Broader conceptions
Bristol Social Exclusion matrix (B-sem)
Child well-being Two developments<br>
slide20. Child deprivation measure List of 20 items identified in focus groups. Reduced through pilot data to list of 10, based on scalability and strength of relationship to traditional poverty variables
10 items included in main-stage and quarterly surveys:
Some pocket money each week
Some money to save each month
A pair of brand-named trainers
An iPod or similar MP3 player
Cable or satellite TV at home
A garden or somewhere similar nearby to spend time safely
Access to a family car
Clothes to fit in with other people their age
A holiday away from home for one week each year
Monthly day-trips with family<br>
slide21. In a sample of 1800 children aged 10-15 we found that
43% of children living in families in the lowest equivalent income quintile were deprived on 1 or fewer items. Non deprived poor.
However there were 12% of those in the highest quintile deprived on 3+ items and 2% deprived on 5+ items. These are deprived children in rich households. Non poor but deprived Children’s Society surveys 21<br>
slide22. Child subjective well-being varies more by child deprivation than parental income 22<br>
slide23. OECD Doing Better for Children (2009)<br>
slide24. Child income poverty and child well-being<br>
slide25. Subjective well-being in the Pacific Rim<br>
slide26. jonathan.bradshaw@york.ac.uk
http://www-users.york.ac.uk/~jrb1/ The End 26<br>