04
Empirical Correlations Empirical correlations between results from simple, quick, and inexpensive index tests (e.g., water content, Atterberg limits) and results from more costly advanced laboratory consolidation testing (e.g., compressibility) can serve multiple useful purposes in practice:�
Estimate soil design parameters at an early stage (e.g., feasibility study) before advanced laboratory testing is planned or conducted;
Supplement data for projects where budgets for performing advanced laboratory tests are limited or not available, and
Quality control to check whether test results are consistent with previous experience. 4<br>
05
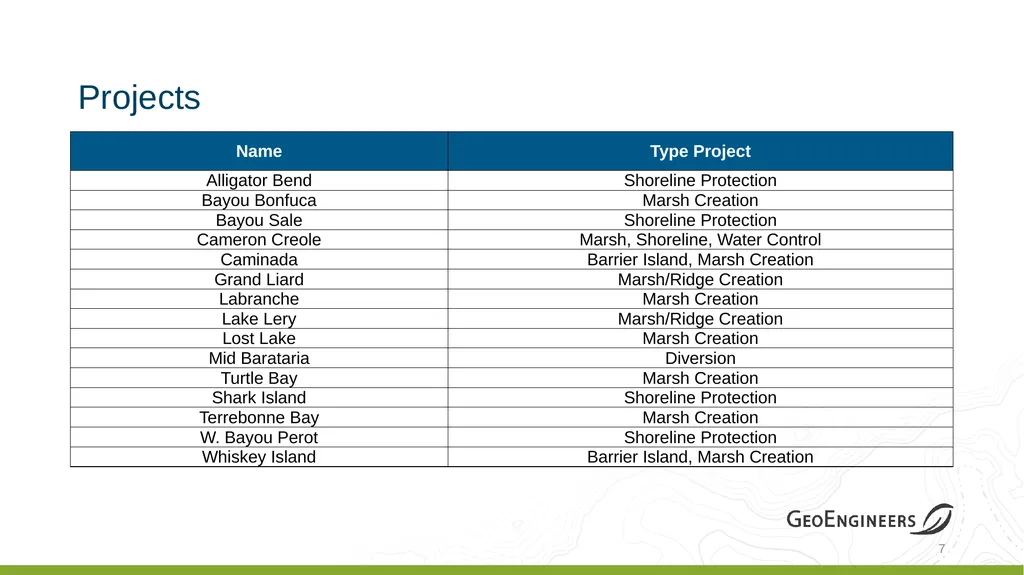
Data Sources 15 different coastal restoration projects
A variety of project types
Five different testing labs
Earliest data collected in 2008
All projects in south Louisiana 5<br>
06
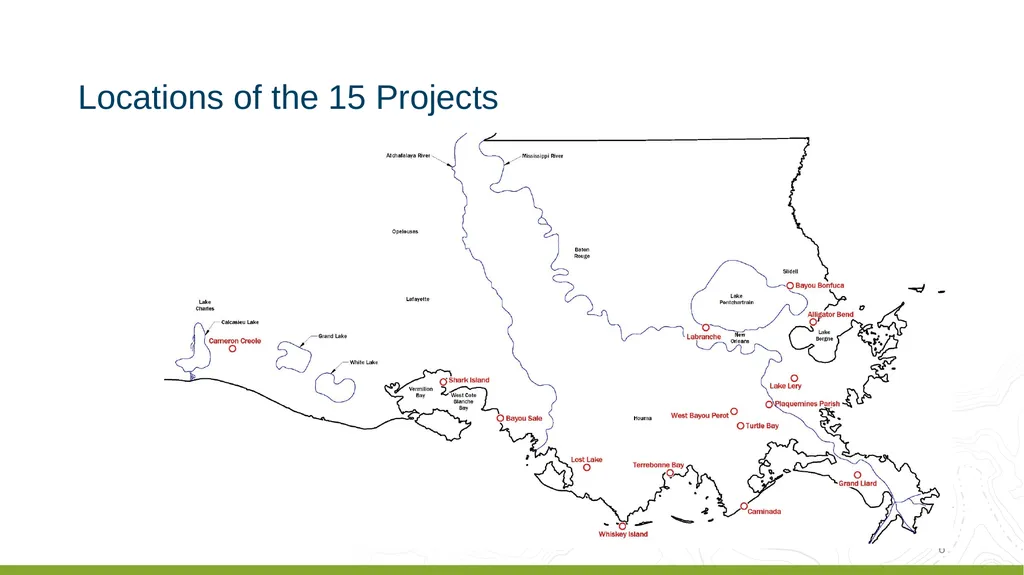
Locations of the 15 Projects 6<br>
08
Sampling Equipment Sampling Equipment 8<br>
09
Soil Sampling Soil sampling
Block sampling
“Undisturbed” tube sampling
SPT split spoon sampling
Challenges of collecting high quality samples in coast of Louisiana
Very soft soils with low effective stress
Existence of organic soils
Transportation 9<br>
10
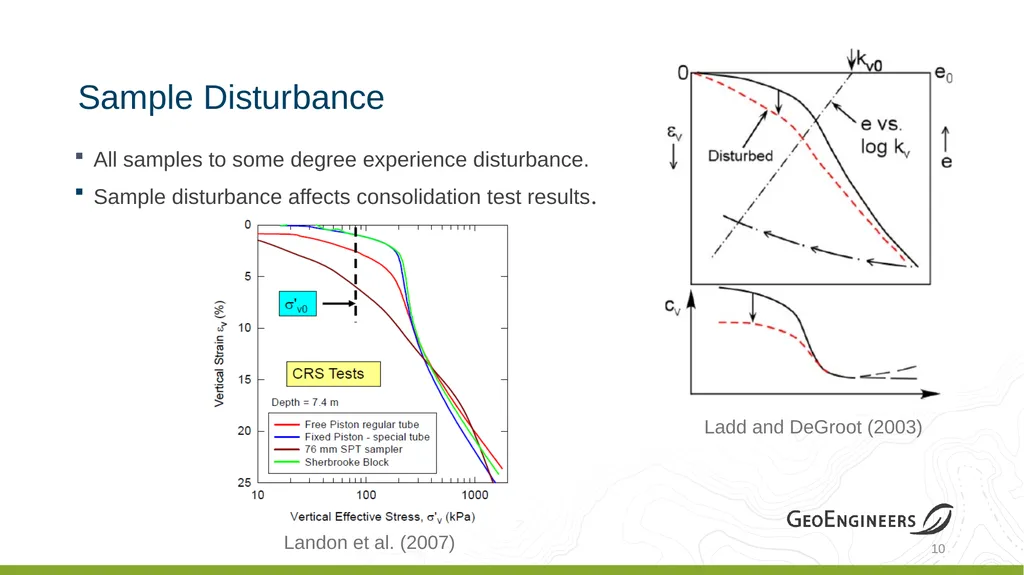
Sample Disturbance All samples to some degree experience disturbance.
Sample disturbance affects consolidation test results. Ladd and DeGroot (2003) Landon et al. (2007) 10<br>
11
Common Precautions Piston Sampling
Plugs and Caps for Tubes in Field
Store Samples Upright
Special Sample Transportation Containers to Cushion Samples
Frequent Trips from Field to Lab (limit sample time outside)
However, Still Must Transport Samples From Site to Lab 11<br>
12
By Sea… Image from Munson Boats 12<br>
13
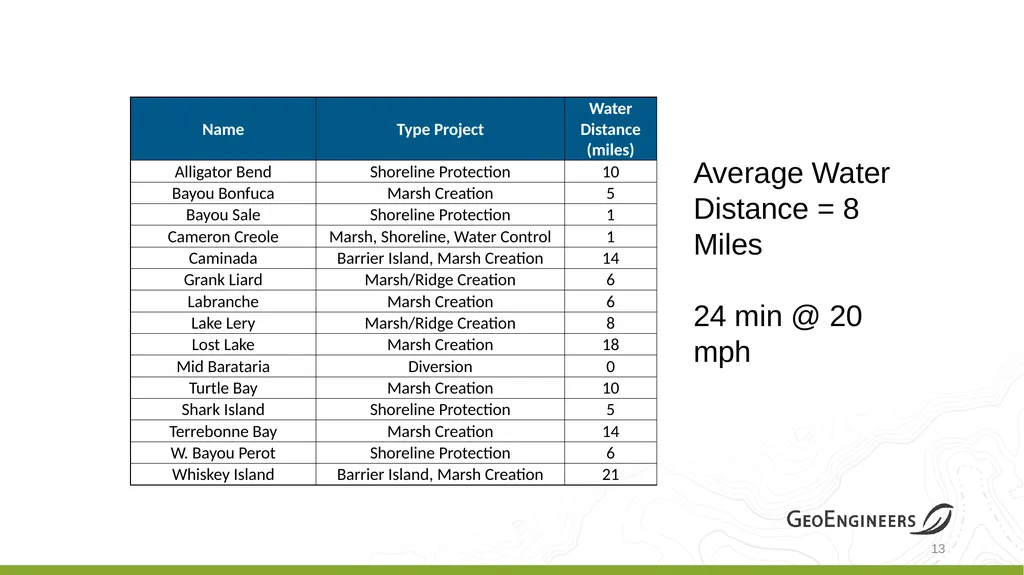
Average Water Distance = 8 Miles�
24 min @ 20 mph 13<br>
15
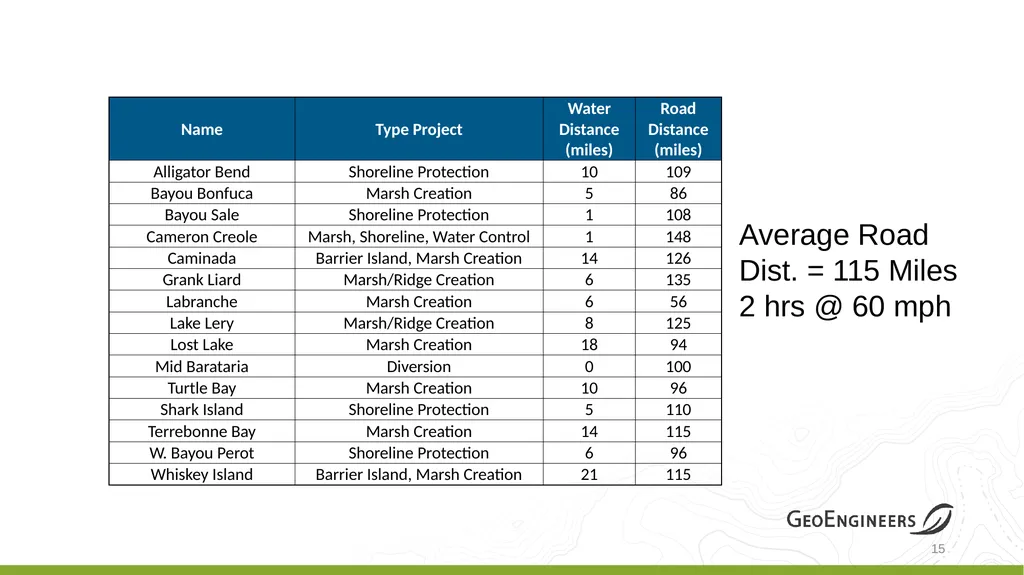
Average Road
Dist. = 115 Miles
2 hrs @ 60 mph 15<br>
16
Concede Samples are Disturbed This Photo by Unknown Author is licensed under CC BY-NC-ND 16<br>
17
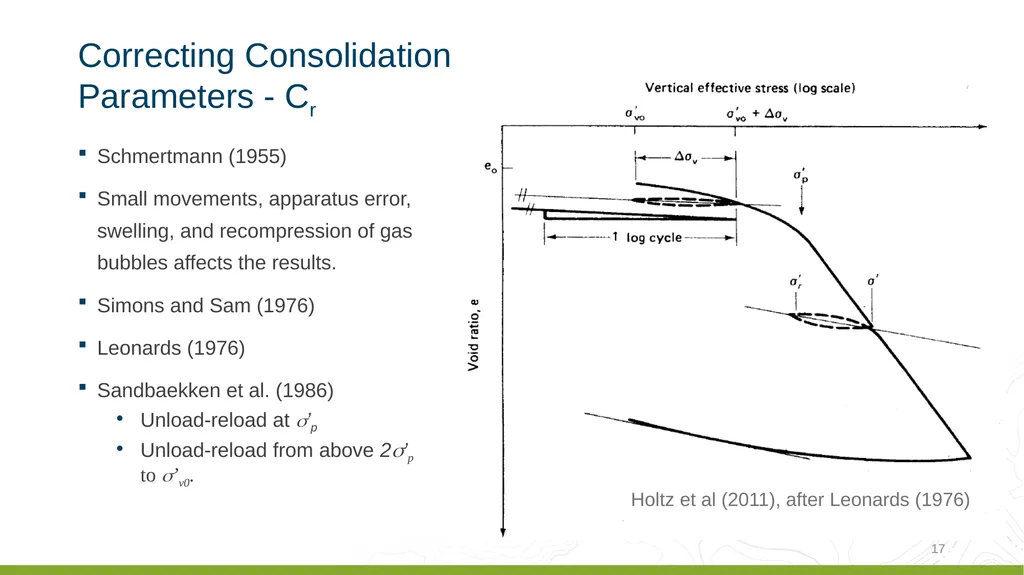
Correcting Consolidation Parameters - Cr Schmertmann (1955)
Small movements, apparatus error, swelling, and recompression of gas bubbles affects the results.
Simons and Sam (1976)
Leonards (1976)
Sandbaekken et al. (1986)
Unload-reload at ’p
Unload-reload from above 2’p to ’v0. Holtz et al (2011), after Leonards (1976) 17<br>
18
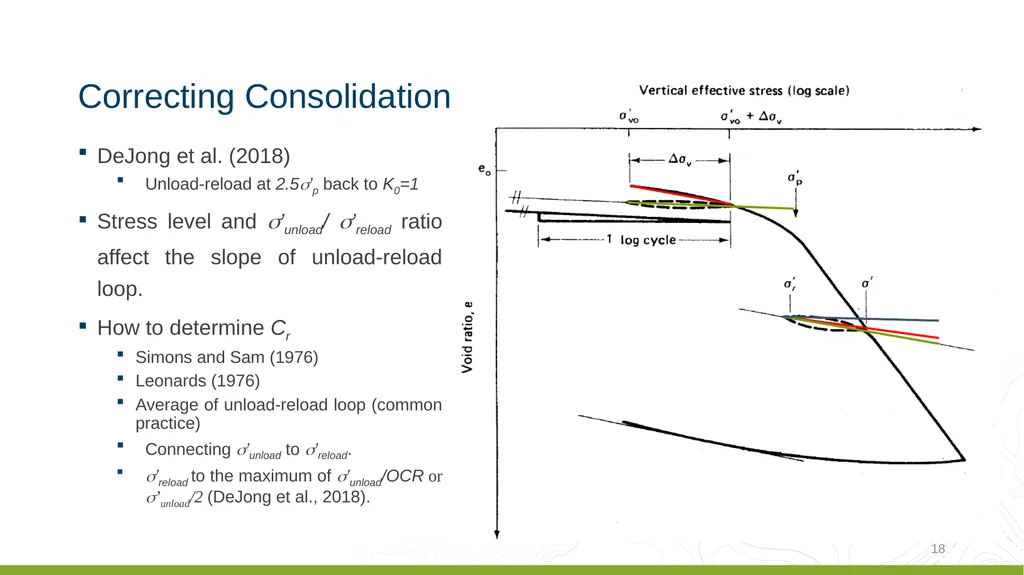
Correcting Consolidation Parameters - Cr DeJong et al. (2018)
Unload-reload at 2.5’p back to K0=1
Stress level and ’unload/ ’reload ratio affect the slope of unload-reload loop.
How to determine Cr
Simons and Sam (1976)
Leonards (1976)
Average of unload-reload loop (common practice)
Connecting ’unload to ’reload.
’reload to the maximum of ’unload/OCR or ’unload/2 (DeJong et al., 2018). 18<br>
19
Gunduz and Arman (2007)
RR increases as ’unload increases.
Vipulanandan et al. (2008) investigated three different methods to determine Cr from a loop as well as performing loops at three different stresses on 9 Houston area soft clay samples:
Up to 760% difference in Cr from a single loop
Stress level significantly affects Cr for CH soils Correcting Consolidation Parameters - Cr 19<br>
20
Schmertmann (1955) Experimental method
Based on the idea of compression curves merging around 0.42e0.
e = ein situ-elab is a symmetric plot with its maximum at ’p. Schmertmann (1955) 20<br>
21
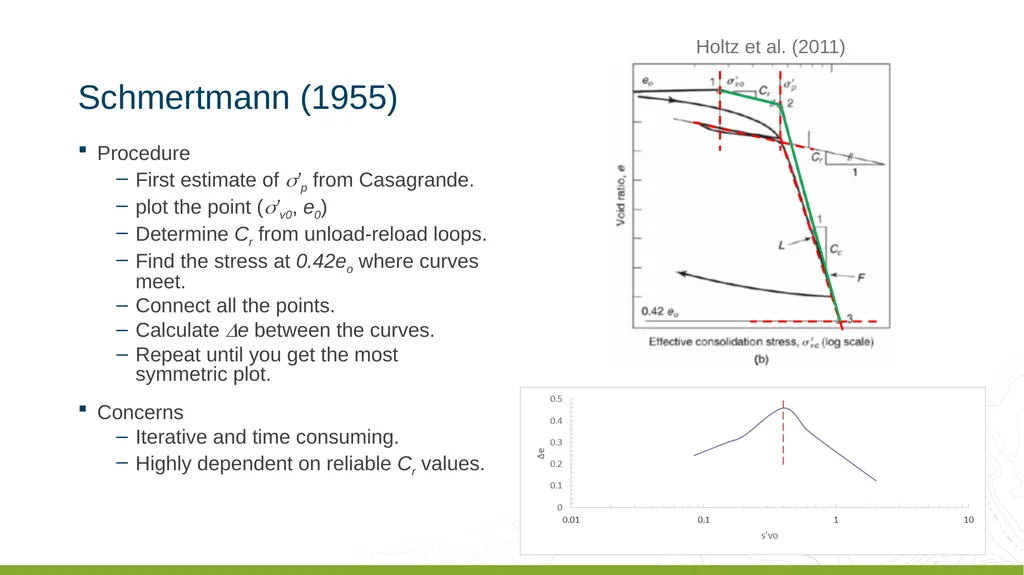
Schmertmann (1955) Procedure
First estimate of ’p from Casagrande.
plot the point (’v0, e0)
Determine Cr from unload-reload loops.
Find the stress at 0.42eo where curves meet.
Connect all the points.
Calculate e between the curves.
Repeat until you get the most symmetric plot.
Concerns
Iterative and time consuming.
Highly dependent on reliable Cr values. Holtz et al. (2011) 21<br>
22
Empirical Correlations 22<br>
23
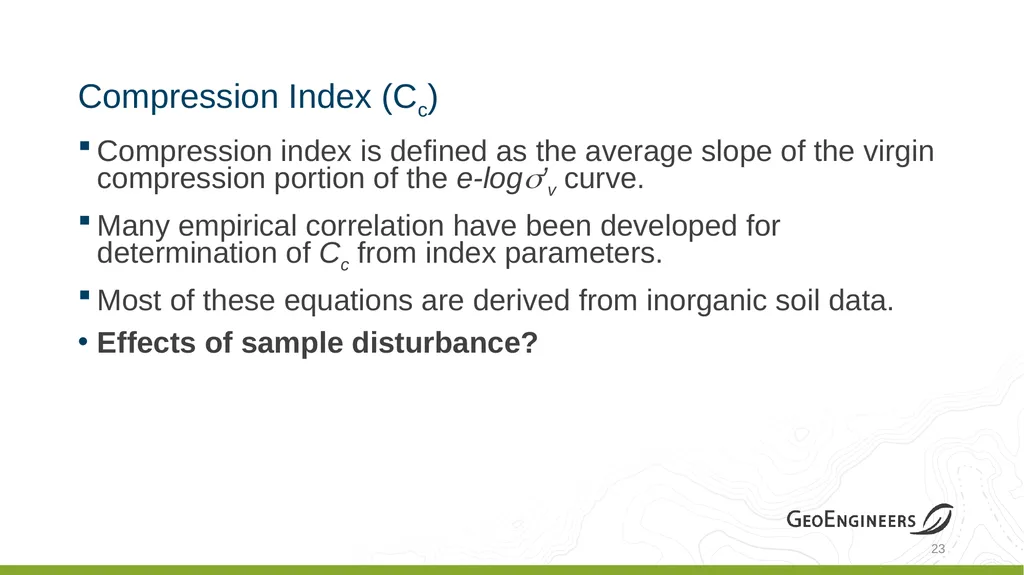
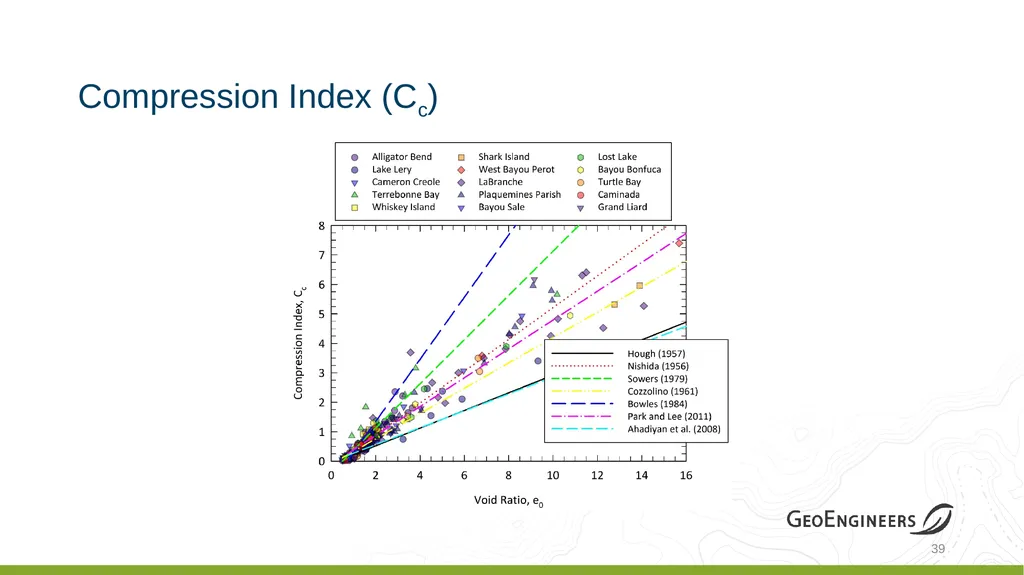
Compression index is defined as the average slope of the virgin compression portion of the e-log’v curve.
Many empirical correlation have been developed for determination of Cc from index parameters.
Most of these equations are derived from inorganic soil data.
Effects of sample disturbance? Compression Index (Cc) 23<br>
24
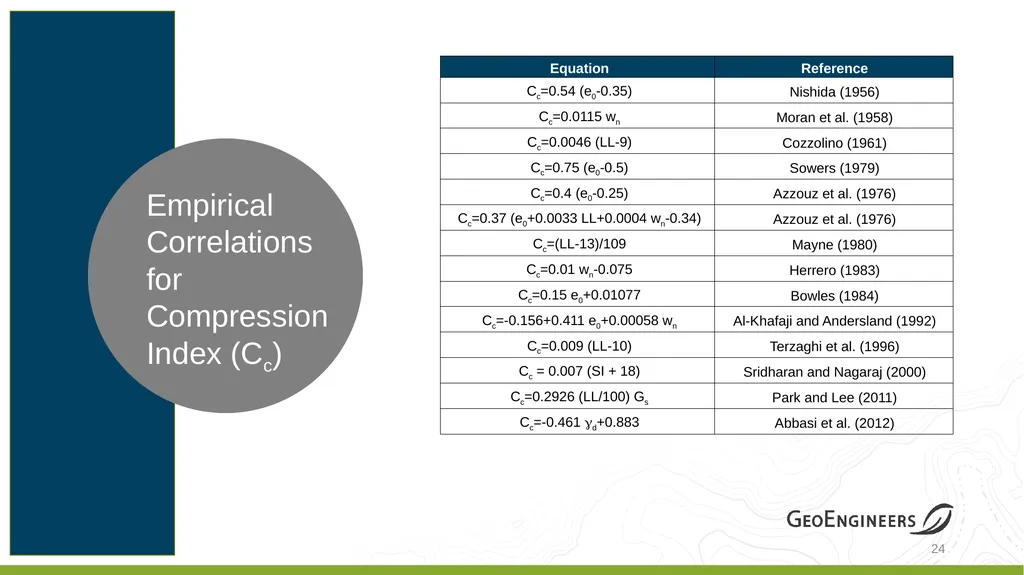
Empirical Correlations for Compression Index (Cc) 24<br>
25
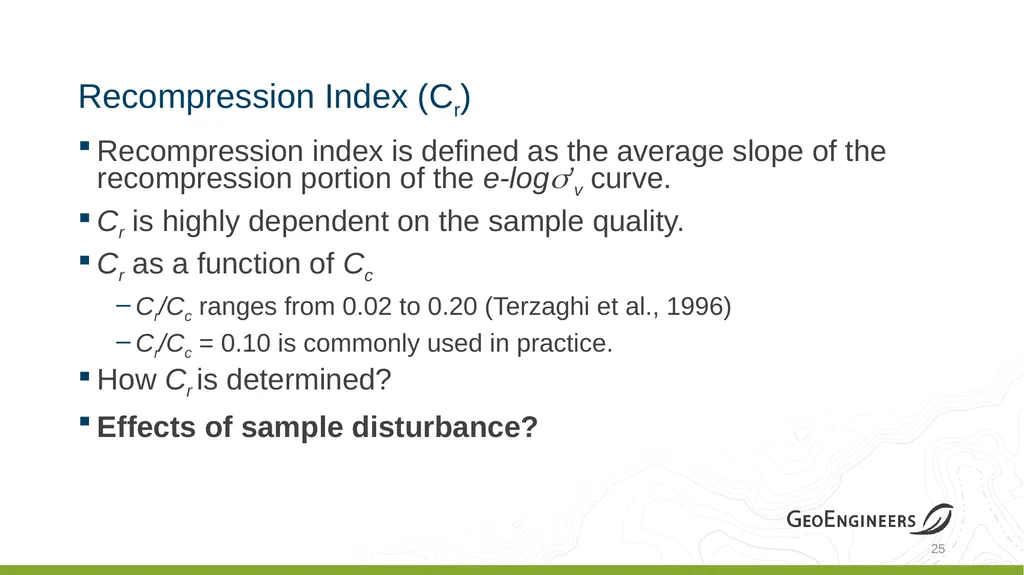
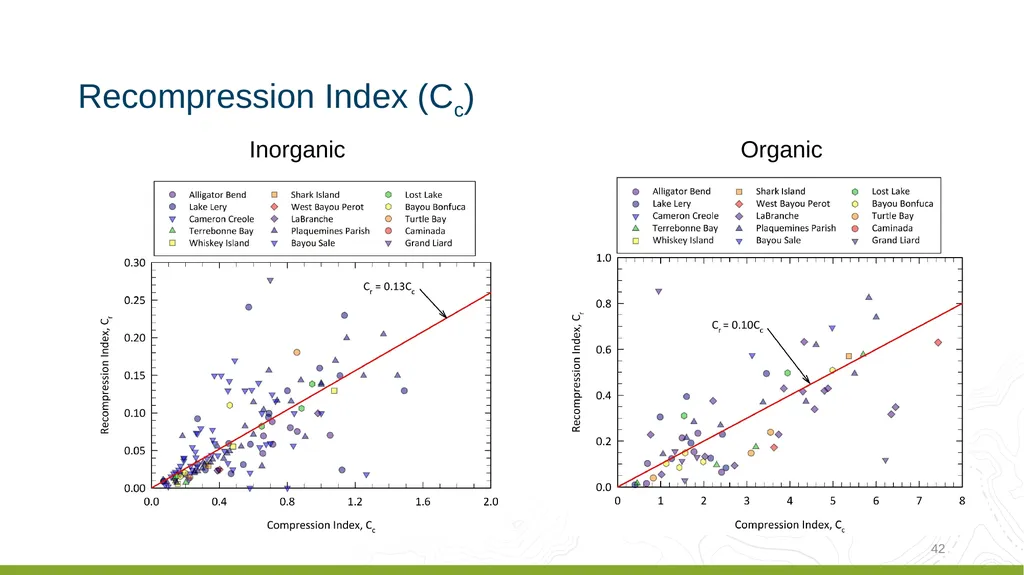
Recompression index is defined as the average slope of the recompression portion of the e-log’v curve.
Cr is highly dependent on the sample quality.
Cr as a function of Cc
Cr/Cc ranges from 0.02 to 0.20 (Terzaghi et al., 1996)
Cr/Cc = 0.10 is commonly used in practice.
How Cr is determined?
Effects of sample disturbance? Recompression Index (Cr) 25<br>
26
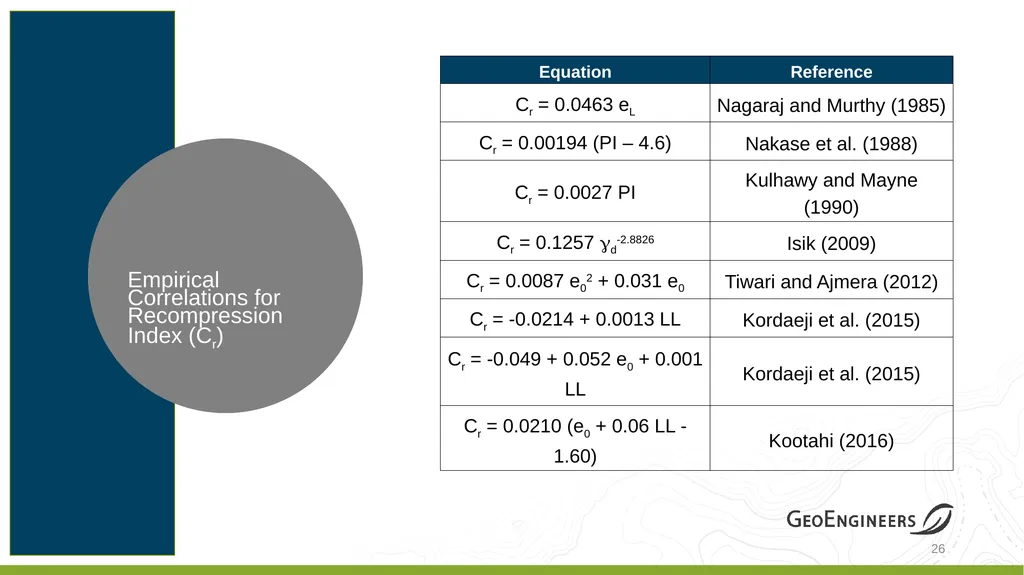
Empirical Correlations for Recompression Index (Cr) 26<br>
27
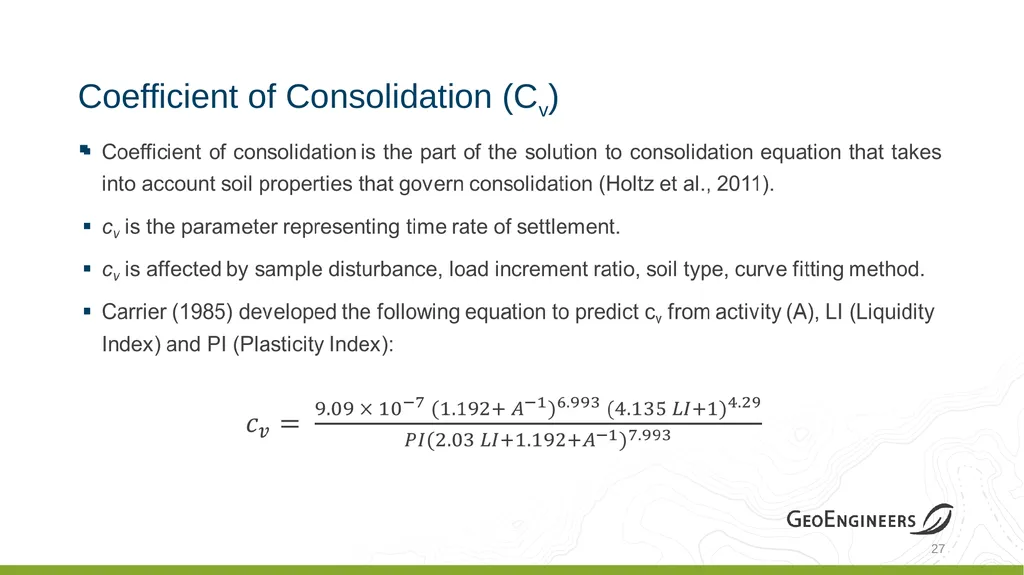
Coefficient of Consolidation (Cv) 27<br>
28
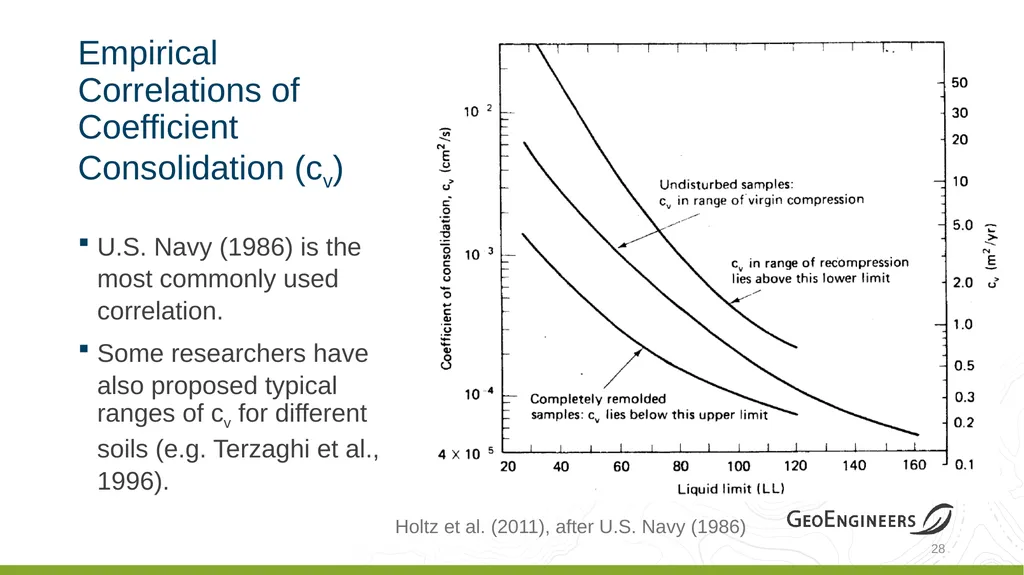
Empirical Correlations of Coefficient Consolidation (cv) U.S. Navy (1986) is the most commonly used correlation.
Some researchers have also proposed typical ranges of cv for different soils (e.g. Terzaghi et al., 1996). Holtz et al. (2011), after U.S. Navy (1986) 28<br>
29
There is little to no information on empirical correlations between results from index tests and consolidation parameters for high liquid limit, organic, coastal soils, such as those typically being used for LA marsh creation projects. Literature Review Outcome 29<br>
30
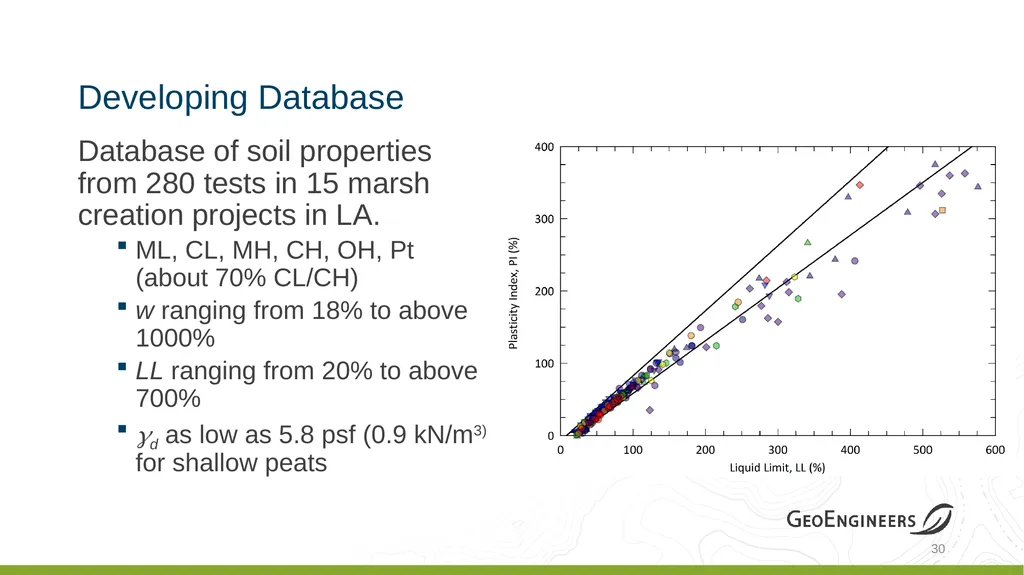
Developing Database Database of soil properties from 280 tests in 15 marsh creation projects in LA.
ML, CL, MH, CH, OH, Pt (about 70% CL/CH)
w ranging from 18% to above 1000%
LL ranging from 20% to above 700%
d as low as 5.8 psf (0.9 kN/m3) for shallow peats 30<br>
31
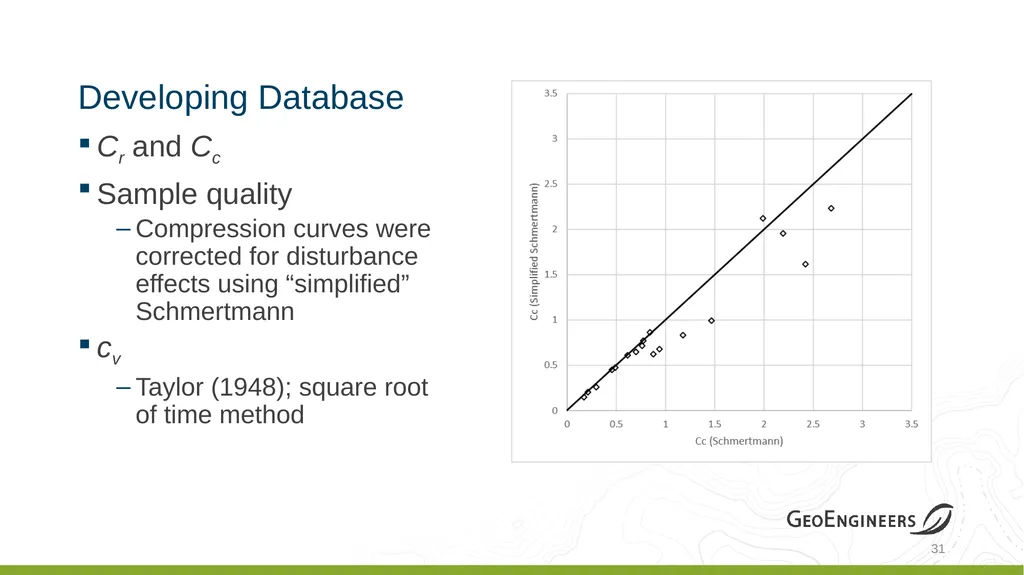
Developing Database Cr and Cc
Sample quality
Compression curves were corrected for disturbance effects using “simplified” Schmertmann
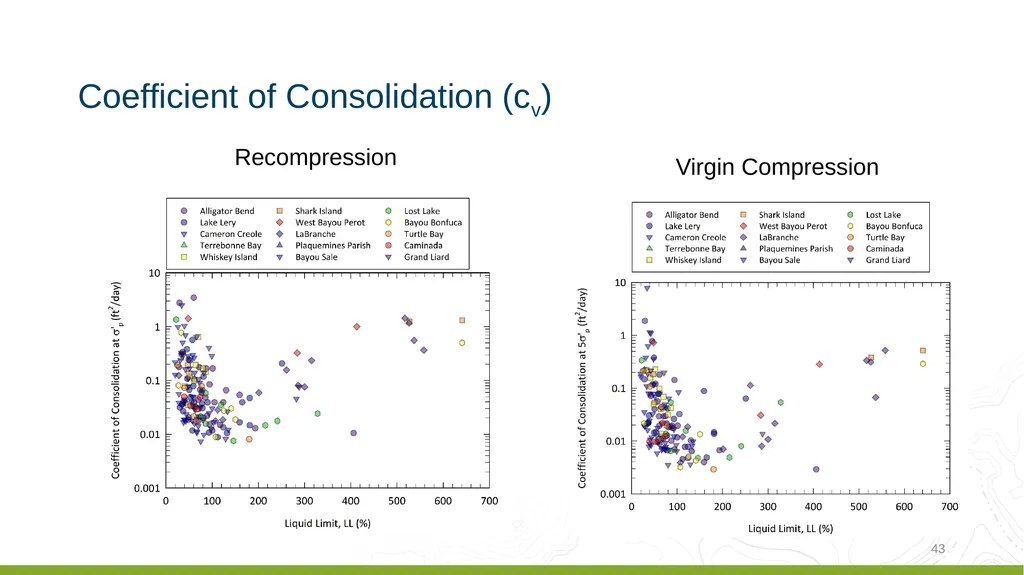
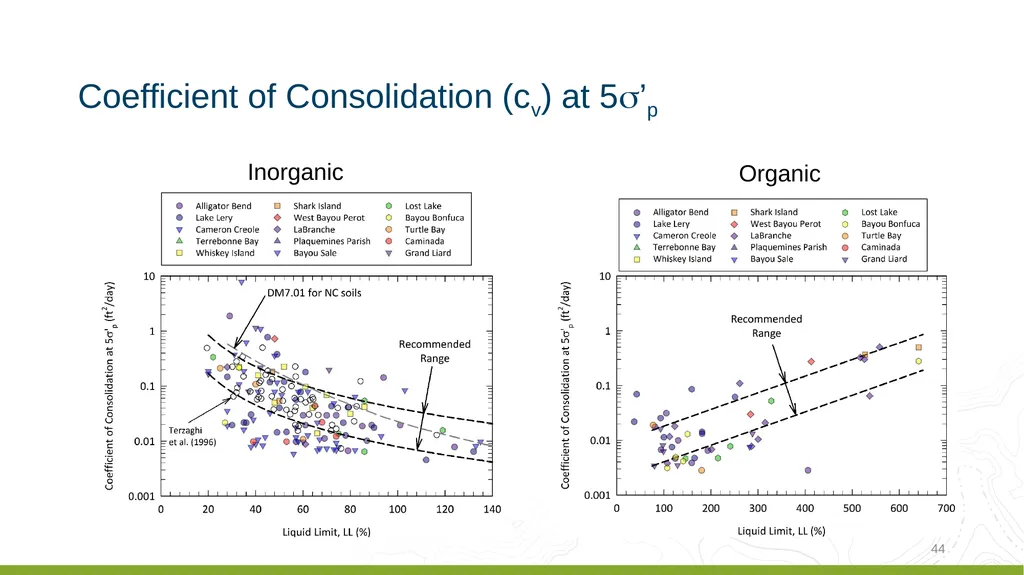
cv
Taylor (1948); square root of time method 31<br>
32
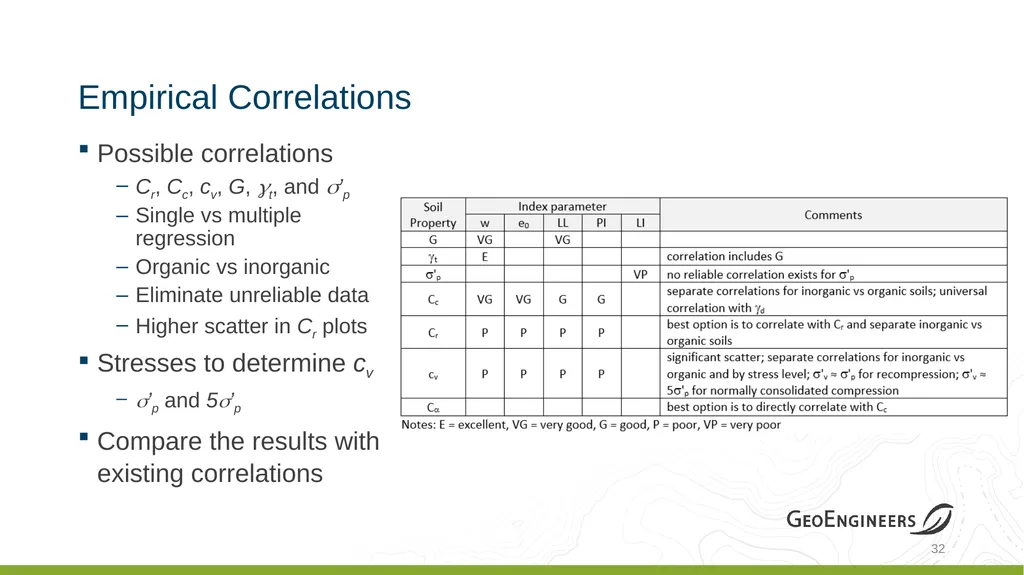
Empirical Correlations Possible correlations
Cr, Cc, cv, G, t, and ’p
Single vs multiple regression
Organic vs inorganic
Eliminate unreliable data
Higher scatter in Cr plots
Stresses to determine cv
’p and 5’p
Compare the results with existing correlations 32<br>
33
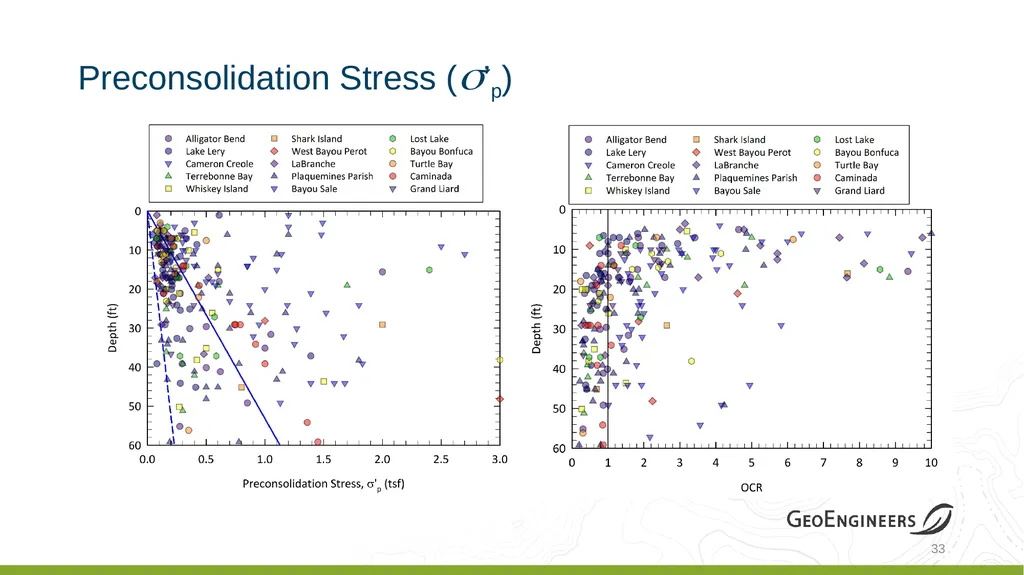
Preconsolidation Stress (’p) 33<br>
34
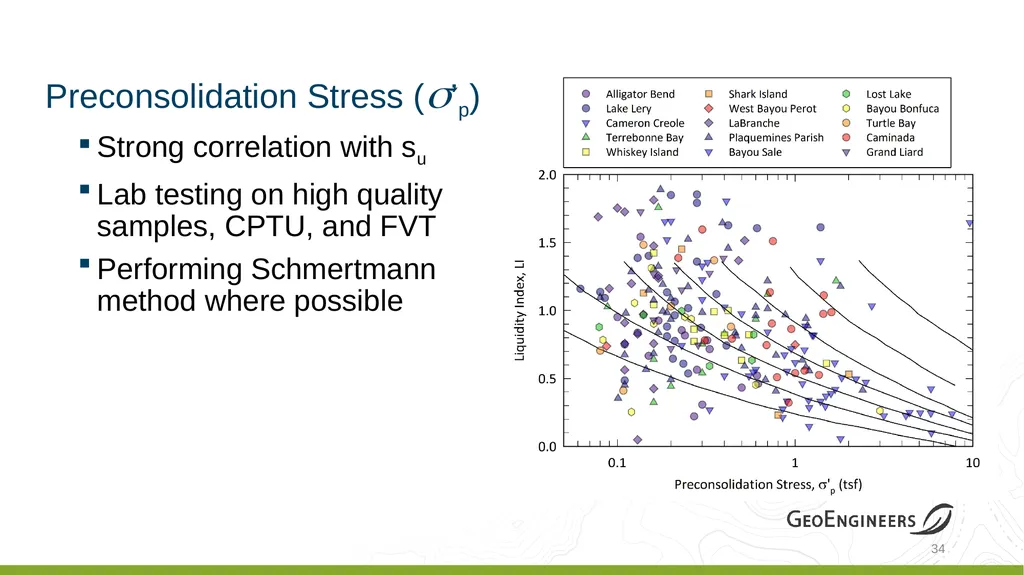
Preconsolidation Stress (’p) Strong correlation with su
Lab testing on high quality samples, CPTU, and FVT
Performing Schmertmann method where possible 34<br>
35
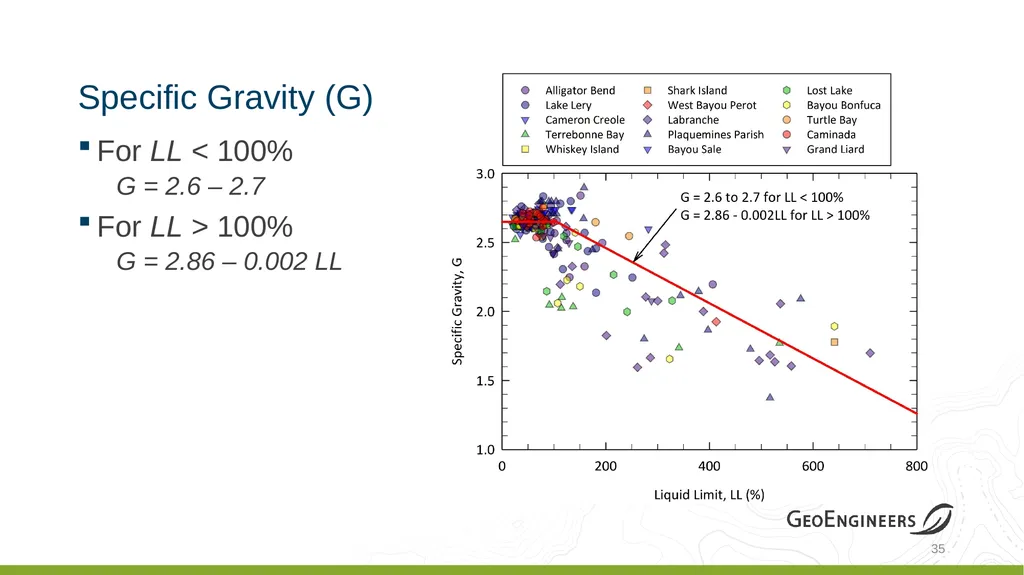
Specific Gravity (G) For LL < 100%
G = 2.6 – 2.7
For LL > 100%
G = 2.86 – 0.002 LL 35<br>
36
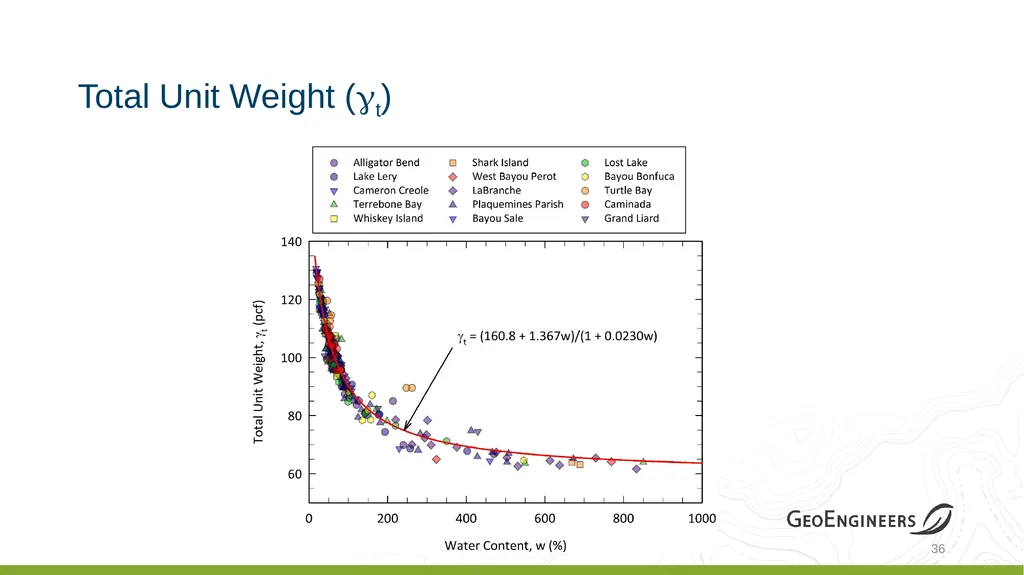
Total Unit Weight (t) 36<br>
37
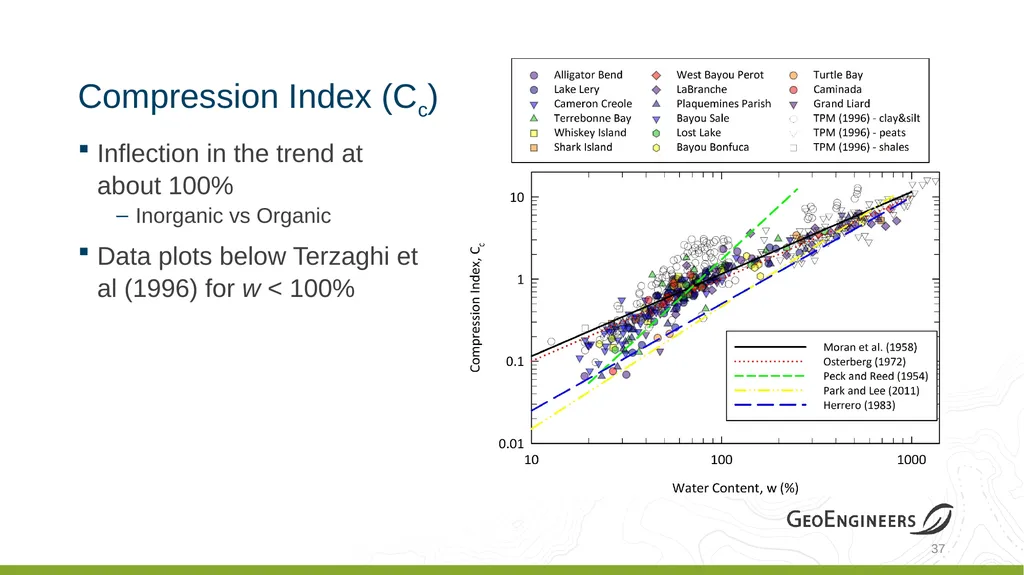
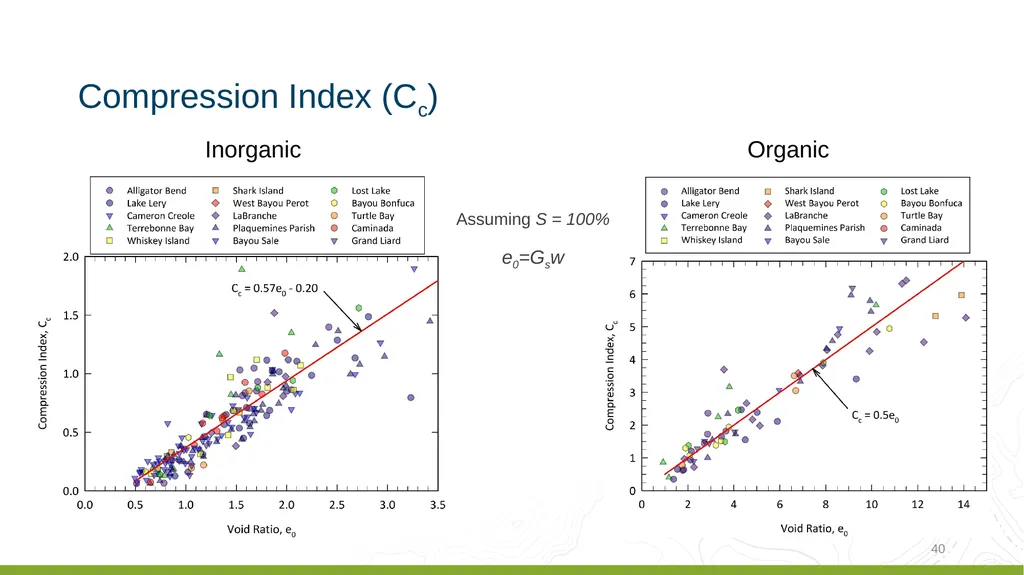
Compression Index (Cc) Inflection in the trend at about 100%
Inorganic vs Organic
Data plots below Terzaghi et al (1996) for w < 100% 37<br>
38
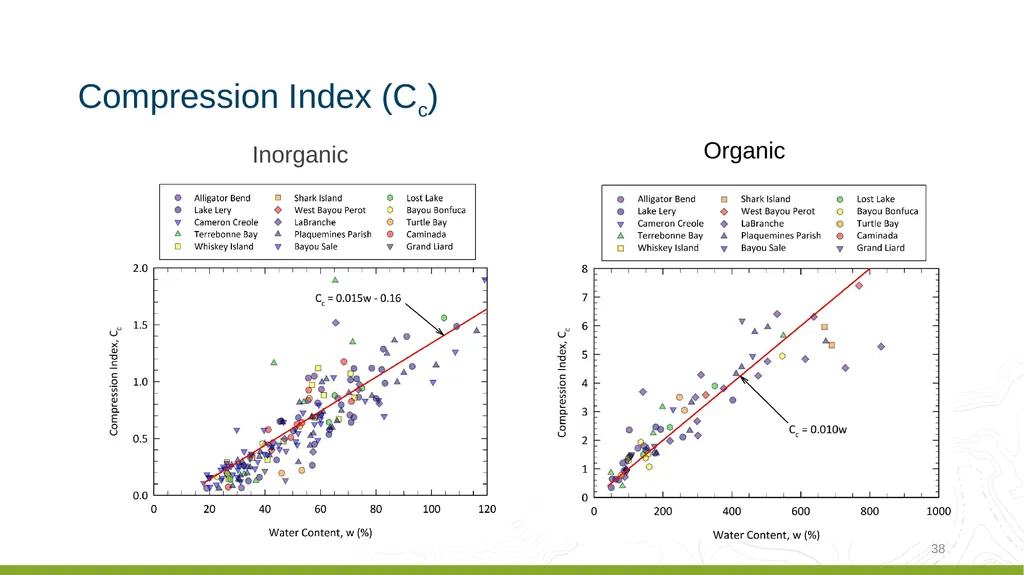
Compression Index (Cc) Inorganic Organic 38<br>
39
Compression Index (Cc) 39<br>
40
Inorganic Organic Compression Index (Cc) Assuming S = 100%
e0=Gsw 40<br>
41
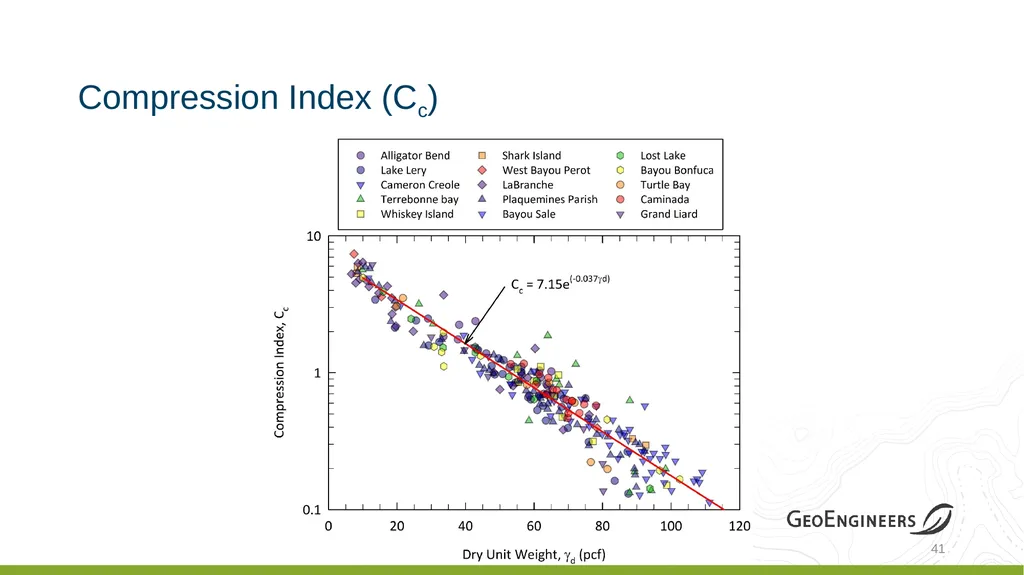
Compression Index (Cc) 41<br>
42
Recompression Index (Cc) Inorganic Organic 42<br>
43
Coefficient of Consolidation (cv) Recompression Virgin Compression 43<br>
44
Coefficient of Consolidation (cv) at 5’p Inorganic Organic 44<br>
45
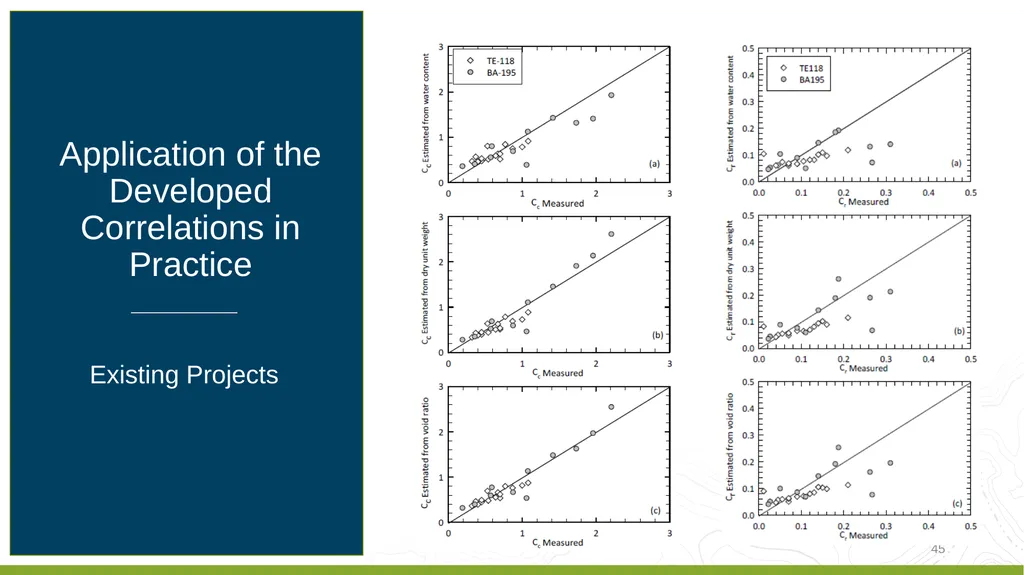
Existing Projects Application of the Developed Correlations in Practice Existing Projects 45<br>
46
Correlations in Practice Level 1 Predictions
Only index test data is available
Level 2 Predictions
Index and in situ test data are available
Level 3 Predictions
Index test, advanced laboratory testing (e.g., consolidation), and In situ test data available.
Highly Recommended 46<br>
47
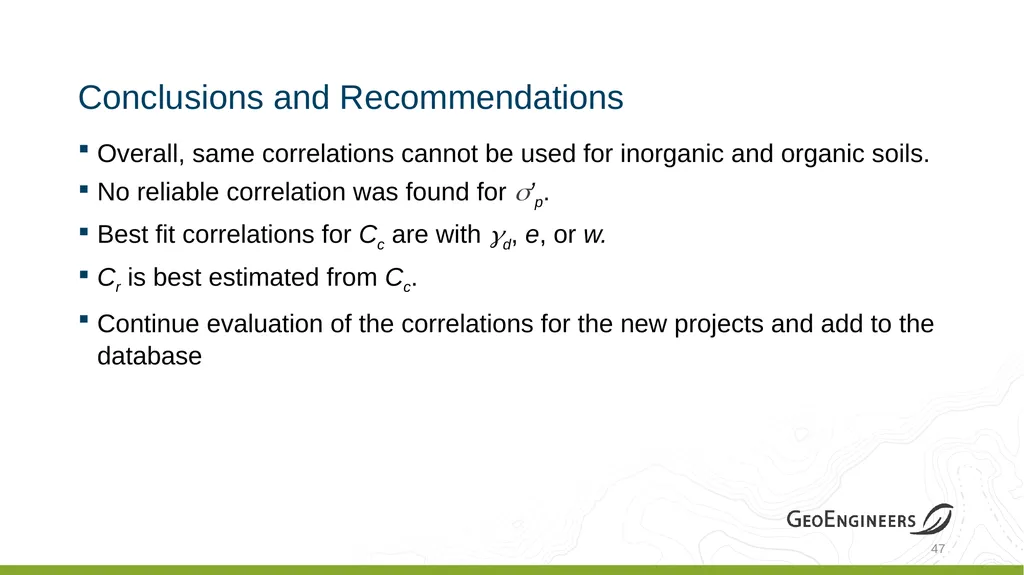
Conclusions and Recommendations Overall, same correlations cannot be used for inorganic and organic soils.
No reliable correlation was found for ’p.
Best fit correlations for Cc are with d, e, or w.
Cr is best estimated from Cc.
Continue evaluation of the correlations for the new projects and add to the database 47<br>
48
For authorizing data release for this study.
Look for this study to be published in the Marine Georesouces and Geotechnology Journal in the coming months! 48 Thank You!<br>