
Concepts, Constructs and Indicators in Research A
MY
Published · 35 slides · 0 views
1 / 1
Description
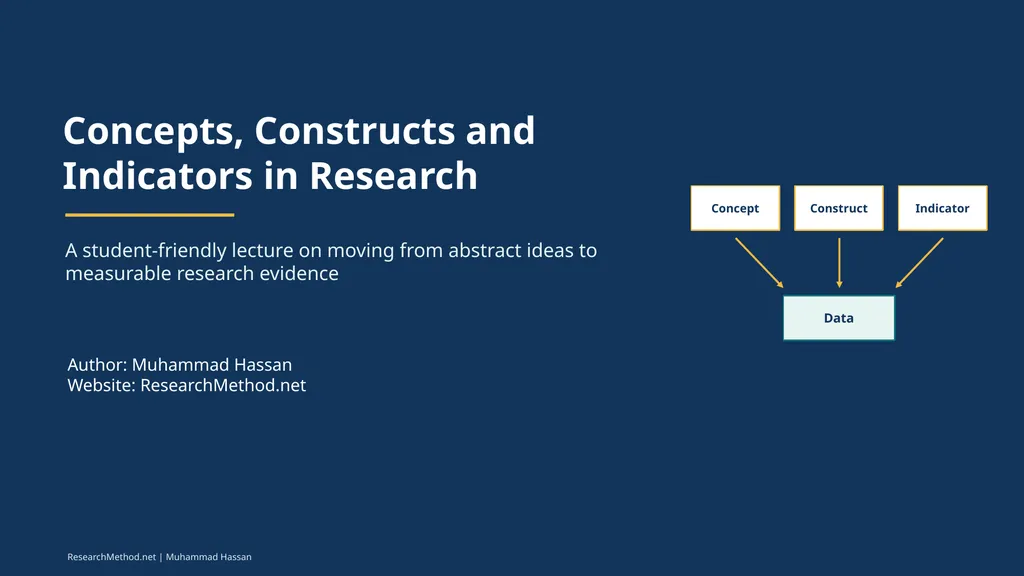
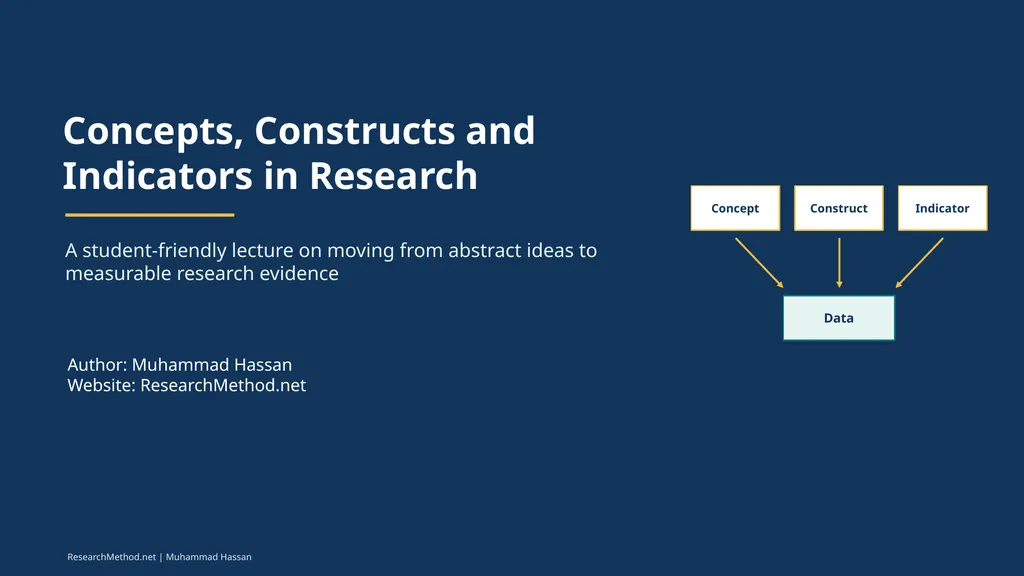
Concepts, Constructs and Indicators in Research A student-friendly lecture on moving from abstract ideas to measurable research evidence Author: Muhammad Hassan Website: ResearchMethod.net ResearchMethod.net Muhammad Hassan Concept
Related Topics
Share
Embed code
Download this presentation From Below
"Concepts, Constructs and Indicators in Research A" is the property of its rightful owner. Permission is granted to download and print the materials on this website for personal, non-commercial use only, and to display it on your personal computer provided you do not modify the materials and that you retain all copyright notices contained in the materials. By downloading content from our website, you accept the terms of this agreement.
Presentation Transcript
01
Concepts, Constructs and
Indicators in Research A student-friendly lecture on moving from abstract ideas to measurable research evidence Author: Muhammad Hassan
Website: ResearchMethod.net ResearchMethod.net | Muhammad Hassan Concept Construct Indicator Data<br>
Indicators in Research A student-friendly lecture on moving from abstract ideas to measurable research evidence Author: Muhammad Hassan
Website: ResearchMethod.net ResearchMethod.net | Muhammad Hassan Concept Construct Indicator Data<br>
02
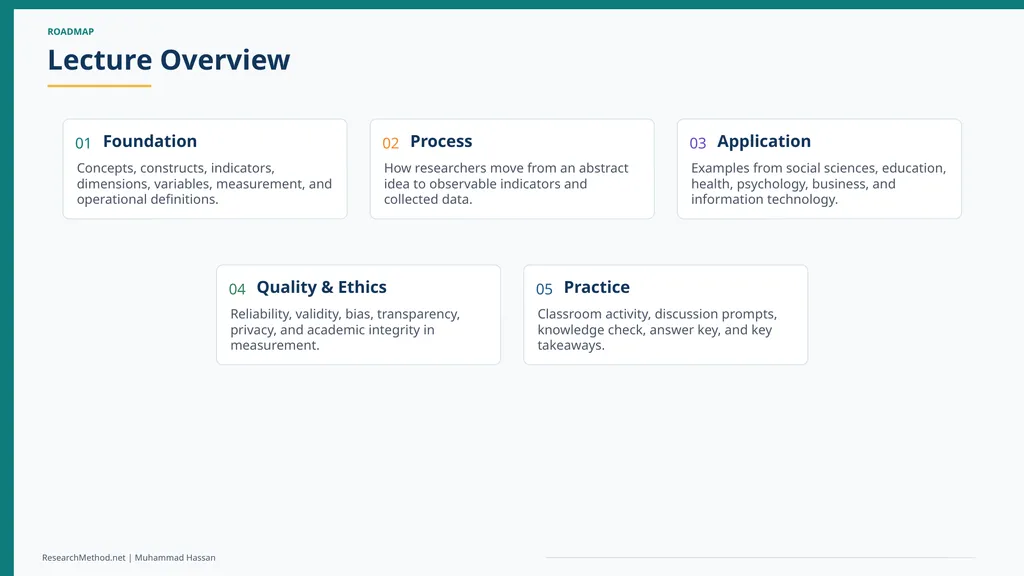
ROADMAP Lecture Overview ResearchMethod.net | Muhammad Hassan 01 Foundation Concepts, constructs, indicators, dimensions, variables, measurement, and operational definitions. 02 Process How researchers move from an abstract idea to observable indicators and collected data. 03 Application Examples from social sciences, education, health, psychology, business, and information technology. 04 Quality & Ethics Reliability, validity, bias, transparency, privacy, and academic integrity in measurement. 05 Practice Classroom activity, discussion prompts, knowledge check, answer key, and key takeaways.<br>
03
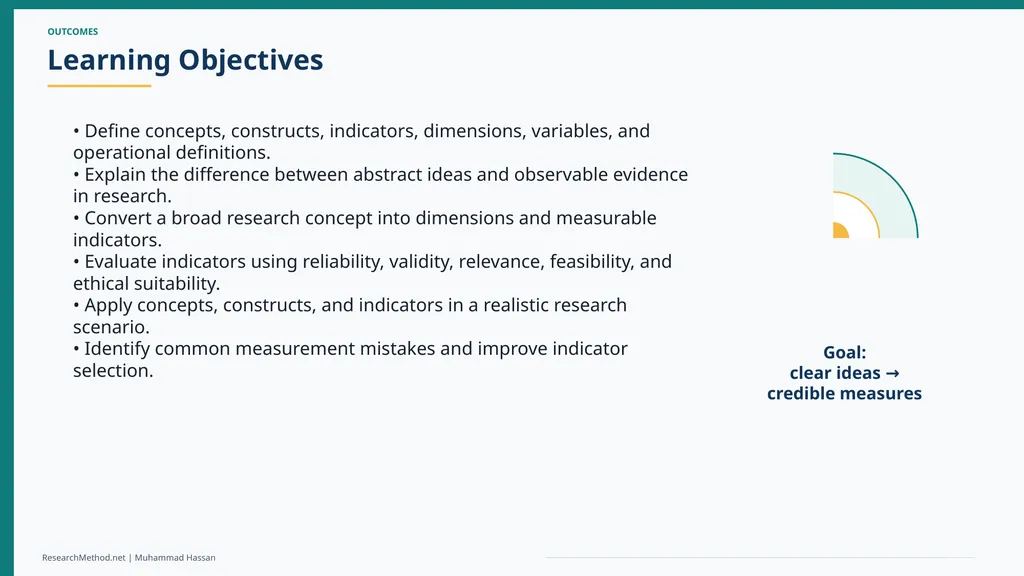
OUTCOMES Learning Objectives ResearchMethod.net | Muhammad Hassan • Define concepts, constructs, indicators, dimensions, variables, and operational definitions.
• Explain the difference between abstract ideas and observable evidence in research.
• Convert a broad research concept into dimensions and measurable indicators.
• Evaluate indicators using reliability, validity, relevance, feasibility, and ethical suitability.
• Apply concepts, constructs, and indicators in a realistic research scenario.
• Identify common measurement mistakes and improve indicator selection. Goal:
clear ideas →
credible measures<br>
• Explain the difference between abstract ideas and observable evidence in research.
• Convert a broad research concept into dimensions and measurable indicators.
• Evaluate indicators using reliability, validity, relevance, feasibility, and ethical suitability.
• Apply concepts, constructs, and indicators in a realistic research scenario.
• Identify common measurement mistakes and improve indicator selection. Goal:
clear ideas →
credible measures<br>
04
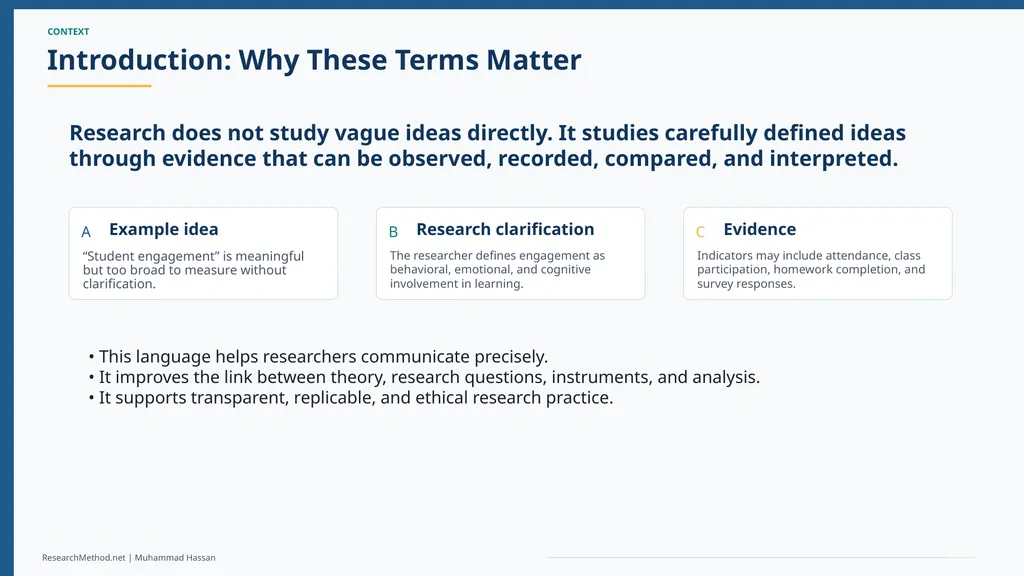
CONTEXT Introduction: Why These Terms Matter ResearchMethod.net | Muhammad Hassan Research does not study vague ideas directly. It studies carefully defined ideas through evidence that can be observed, recorded, compared, and interpreted. A Example idea “Student engagement” is meaningful but too broad to measure without clarification. B Research clarification The researcher defines engagement as behavioral, emotional, and cognitive involvement in learning. C Evidence Indicators may include attendance, class participation, homework completion, and survey responses. • This language helps researchers communicate precisely.
• It improves the link between theory, research questions, instruments, and analysis.
• It supports transparent, replicable, and ethical research practice.<br>
• It improves the link between theory, research questions, instruments, and analysis.
• It supports transparent, replicable, and ethical research practice.<br>
05
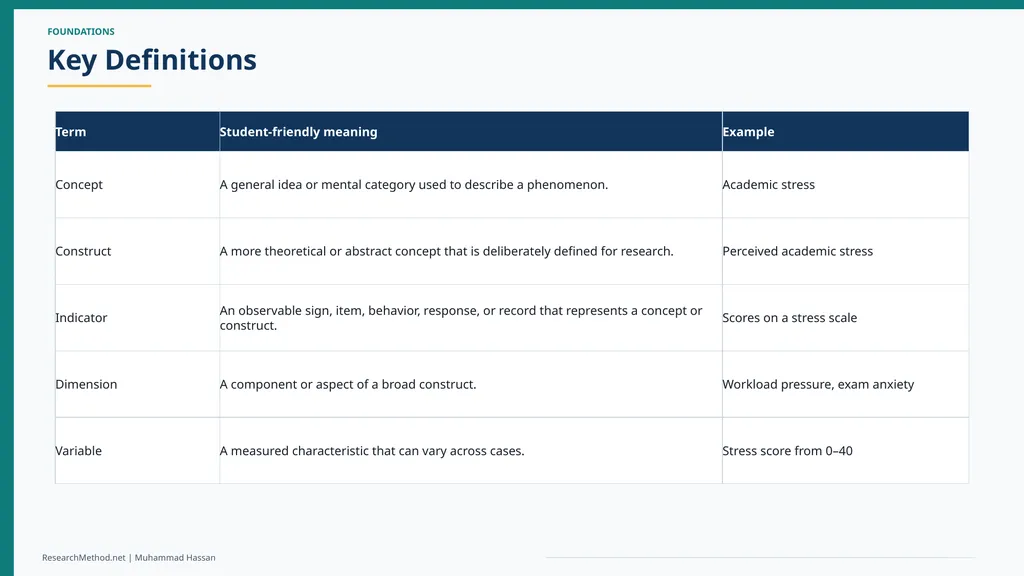
FOUNDATIONS Key Definitions ResearchMethod.net | Muhammad Hassan Term Student-friendly meaning Example Concept A general idea or mental category used to describe a phenomenon. Academic stress Construct A more theoretical or abstract concept that is deliberately defined for research. Perceived academic stress Indicator An observable sign, item, behavior, response, or record that represents a concept or construct. Scores on a stress scale Dimension A component or aspect of a broad construct. Workload pressure, exam anxiety Variable A measured characteristic that can vary across cases. Stress score from 0–40<br>
06
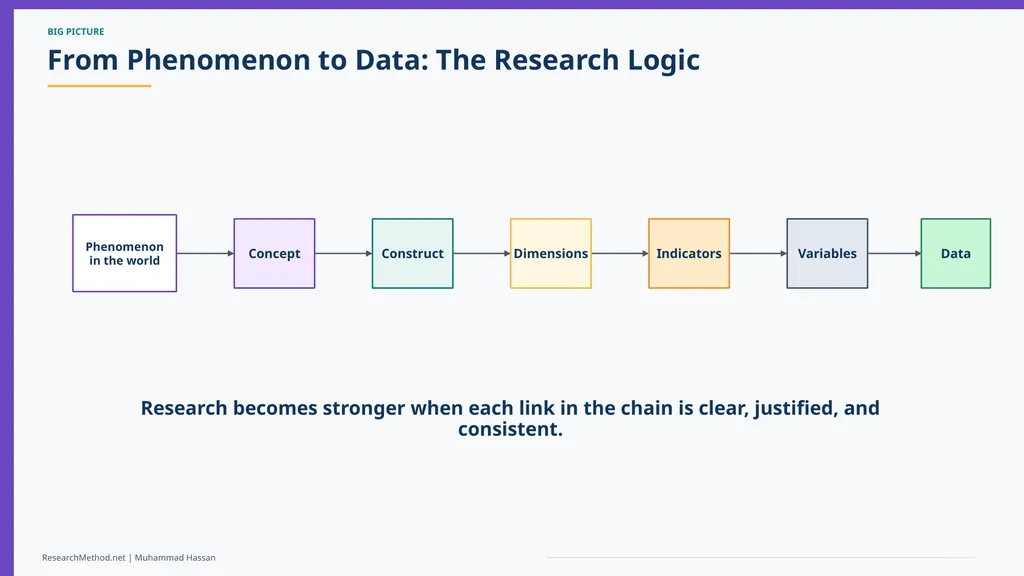
BIG PICTURE From Phenomenon to Data: The Research Logic ResearchMethod.net | Muhammad Hassan Phenomenon
in the world Concept Construct Dimensions Indicators Variables Data Research becomes stronger when each link in the chain is clear, justified, and consistent.<br>
in the world Concept Construct Dimensions Indicators Variables Data Research becomes stronger when each link in the chain is clear, justified, and consistent.<br>
07
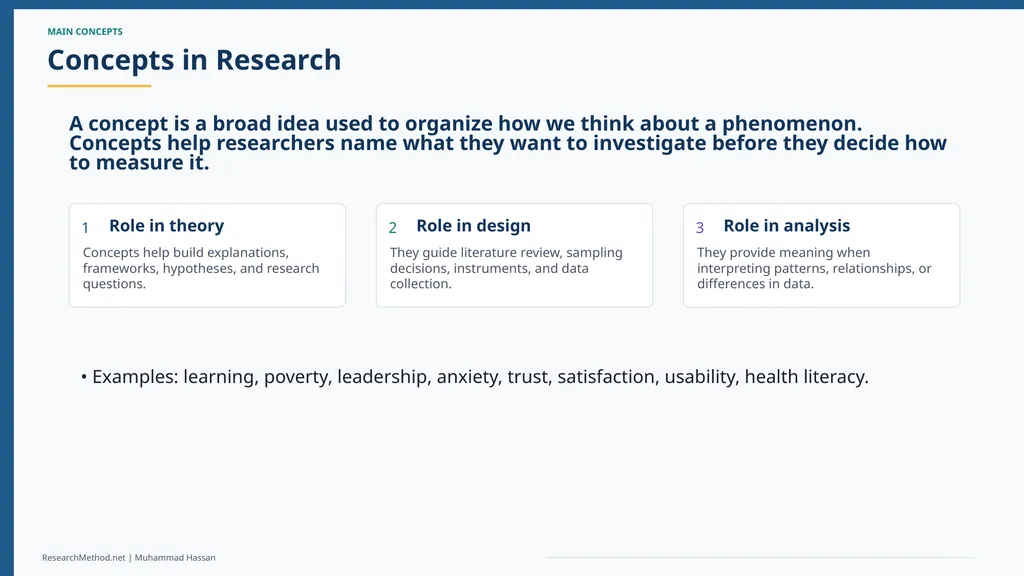
MAIN CONCEPTS Concepts in Research ResearchMethod.net | Muhammad Hassan A concept is a broad idea used to organize how we think about a phenomenon. Concepts help researchers name what they want to investigate before they decide how to measure it. 1 Role in theory Concepts help build explanations, frameworks, hypotheses, and research questions. 2 Role in design They guide literature review, sampling decisions, instruments, and data collection. 3 Role in analysis They provide meaning when interpreting patterns, relationships, or differences in data. • Examples: learning, poverty, leadership, anxiety, trust, satisfaction, usability, health literacy.<br>
08
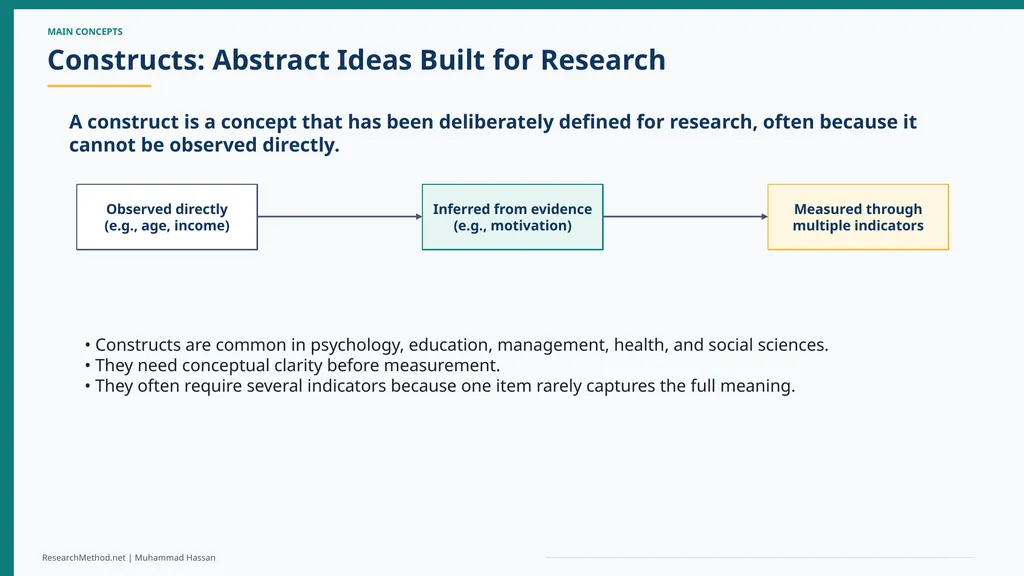
MAIN CONCEPTS Constructs: Abstract Ideas Built for Research ResearchMethod.net | Muhammad Hassan A construct is a concept that has been deliberately defined for research, often because it cannot be observed directly. Observed directly
(e.g., age, income) Inferred from evidence
(e.g., motivation) Measured through
multiple indicators • Constructs are common in psychology, education, management, health, and social sciences.
• They need conceptual clarity before measurement.
• They often require several indicators because one item rarely captures the full meaning.<br>
(e.g., age, income) Inferred from evidence
(e.g., motivation) Measured through
multiple indicators • Constructs are common in psychology, education, management, health, and social sciences.
• They need conceptual clarity before measurement.
• They often require several indicators because one item rarely captures the full meaning.<br>
09
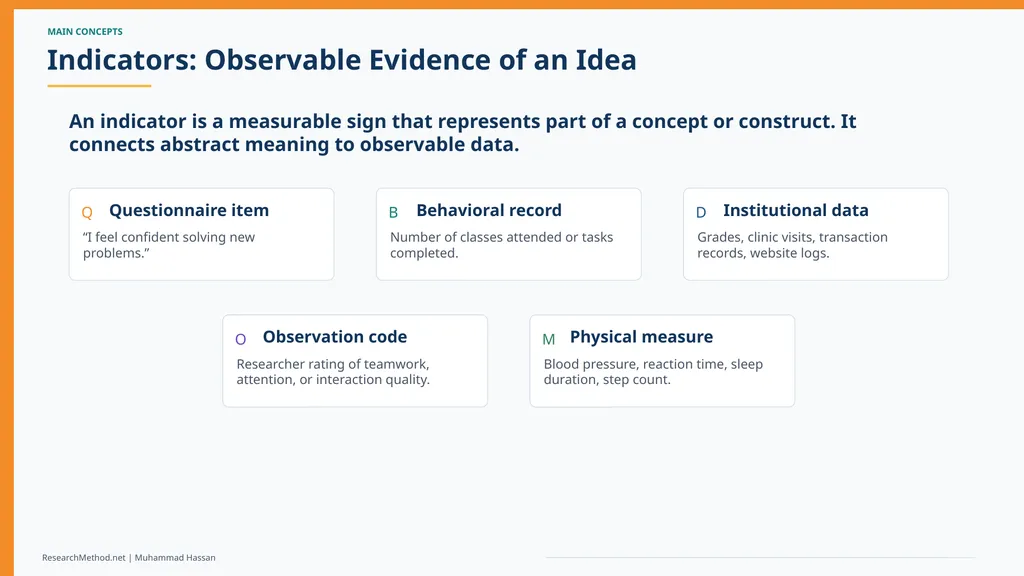
MAIN CONCEPTS Indicators: Observable Evidence of an Idea ResearchMethod.net | Muhammad Hassan An indicator is a measurable sign that represents part of a concept or construct. It connects abstract meaning to observable data. Q Questionnaire item “I feel confident solving new problems.” B Behavioral record Number of classes attended or tasks completed. D Institutional data Grades, clinic visits, transaction records, website logs. O Observation code Researcher rating of teamwork, attention, or interaction quality. M Physical measure Blood pressure, reaction time, sleep duration, step count.<br>
10
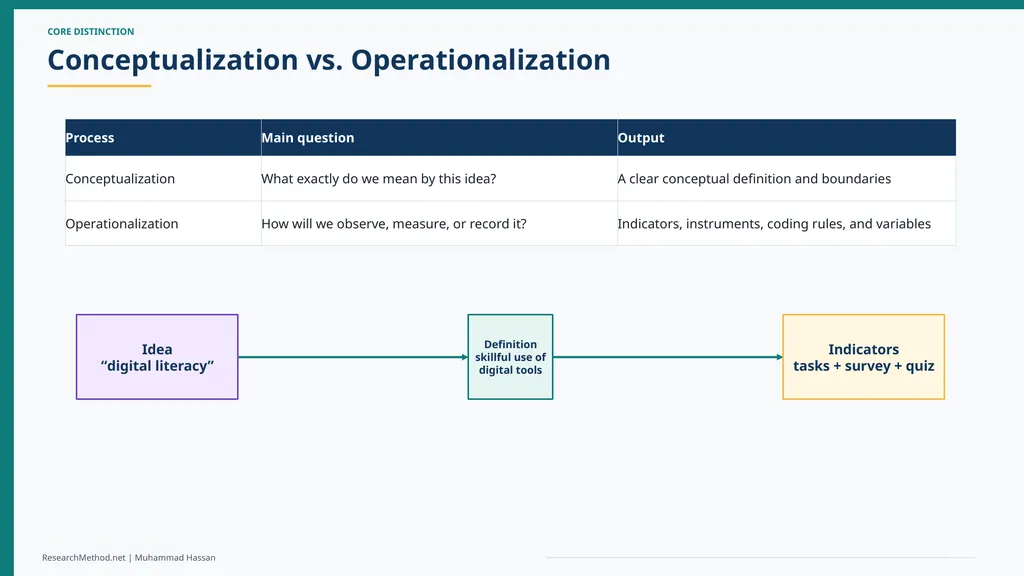
CORE DISTINCTION Conceptualization vs. Operationalization ResearchMethod.net | Muhammad Hassan Process Main question Output Conceptualization What exactly do we mean by this idea? A clear conceptual definition and boundaries Operationalization How will we observe, measure, or record it? Indicators, instruments, coding rules, and variables Idea
“digital literacy” Definition
skillful use of digital tools Indicators
tasks + survey + quiz<br>
“digital literacy” Definition
skillful use of digital tools Indicators
tasks + survey + quiz<br>
11
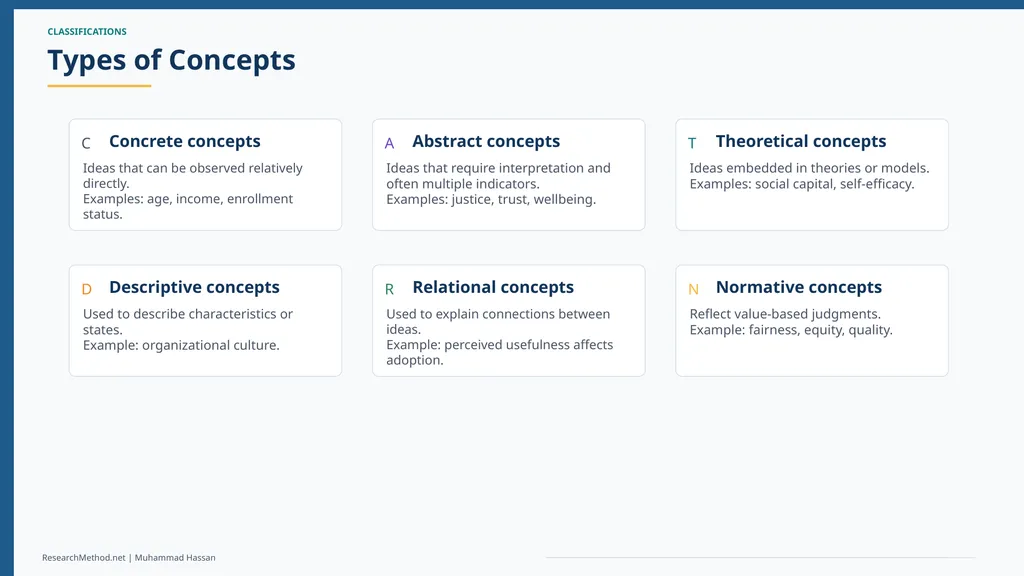
CLASSIFICATIONS Types of Concepts ResearchMethod.net | Muhammad Hassan C Concrete concepts Ideas that can be observed relatively directly.
Examples: age, income, enrollment status. A Abstract concepts Ideas that require interpretation and often multiple indicators.
Examples: justice, trust, wellbeing. T Theoretical concepts Ideas embedded in theories or models.
Examples: social capital, self-efficacy. D Descriptive concepts Used to describe characteristics or states.
Example: organizational culture. R Relational concepts Used to explain connections between ideas.
Example: perceived usefulness affects adoption. N Normative concepts Reflect value-based judgments.
Example: fairness, equity, quality.<br>
Examples: age, income, enrollment status. A Abstract concepts Ideas that require interpretation and often multiple indicators.
Examples: justice, trust, wellbeing. T Theoretical concepts Ideas embedded in theories or models.
Examples: social capital, self-efficacy. D Descriptive concepts Used to describe characteristics or states.
Example: organizational culture. R Relational concepts Used to explain connections between ideas.
Example: perceived usefulness affects adoption. N Normative concepts Reflect value-based judgments.
Example: fairness, equity, quality.<br>
12
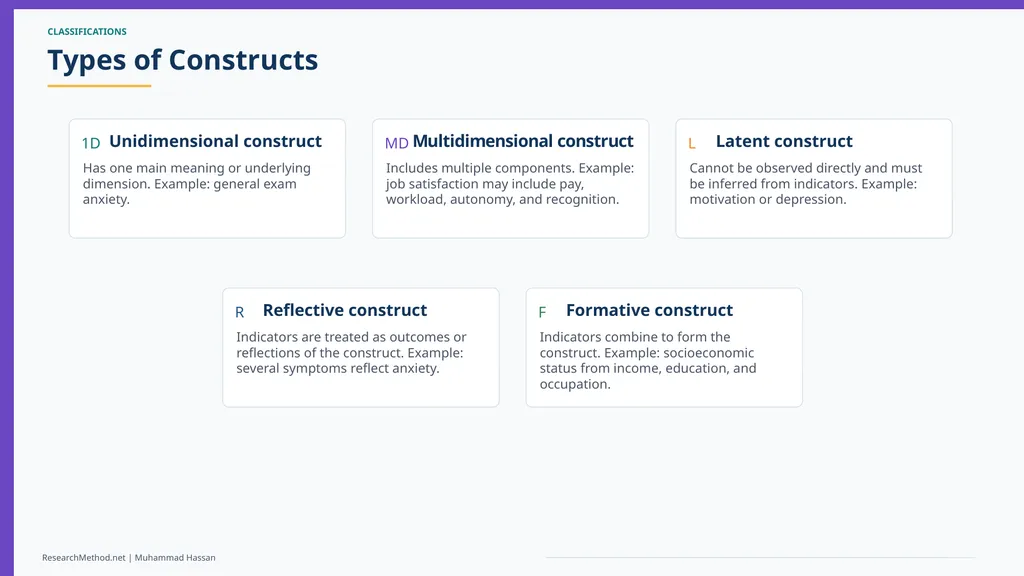
CLASSIFICATIONS Types of Constructs ResearchMethod.net | Muhammad Hassan 1D Unidimensional construct Has one main meaning or underlying dimension. Example: general exam anxiety. MD Multidimensional construct Includes multiple components. Example: job satisfaction may include pay, workload, autonomy, and recognition. L Latent construct Cannot be observed directly and must be inferred from indicators. Example: motivation or depression. R Reflective construct Indicators are treated as outcomes or reflections of the construct. Example: several symptoms reflect anxiety. F Formative construct Indicators combine to form the construct. Example: socioeconomic status from income, education, and occupation.<br>
13
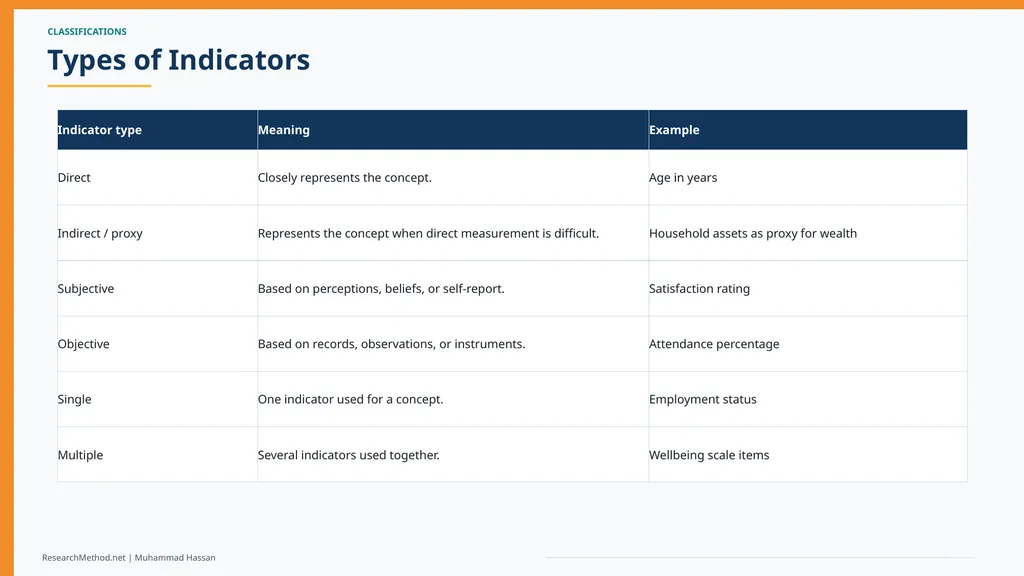
CLASSIFICATIONS Types of Indicators ResearchMethod.net | Muhammad Hassan Indicator type Meaning Example Direct Closely represents the concept. Age in years Indirect / proxy Represents the concept when direct measurement is difficult. Household assets as proxy for wealth Subjective Based on perceptions, beliefs, or self-report. Satisfaction rating Objective Based on records, observations, or instruments. Attendance percentage Single One indicator used for a concept. Employment status Multiple Several indicators used together. Wellbeing scale items<br>
14
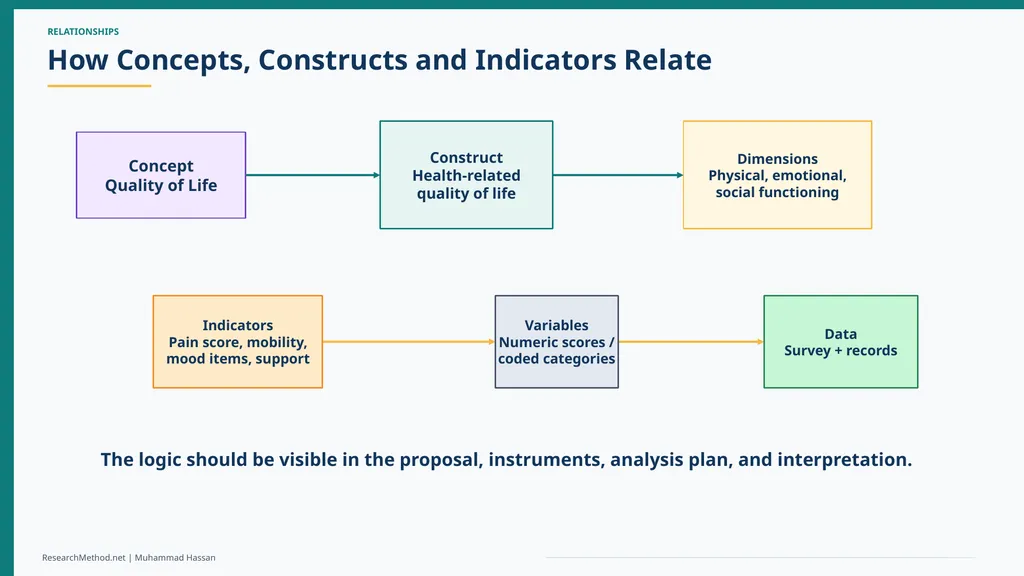
RELATIONSHIPS How Concepts, Constructs and Indicators Relate ResearchMethod.net | Muhammad Hassan Concept
Quality of Life Construct
Health-related
quality of life Dimensions
Physical, emotional,
social functioning Indicators
Pain score, mobility,
mood items, support Variables
Numeric scores /
coded categories Data
Survey + records The logic should be visible in the proposal, instruments, analysis plan, and interpretation.<br>
Quality of Life Construct
Health-related
quality of life Dimensions
Physical, emotional,
social functioning Indicators
Pain score, mobility,
mood items, support Variables
Numeric scores /
coded categories Data
Survey + records The logic should be visible in the proposal, instruments, analysis plan, and interpretation.<br>
15
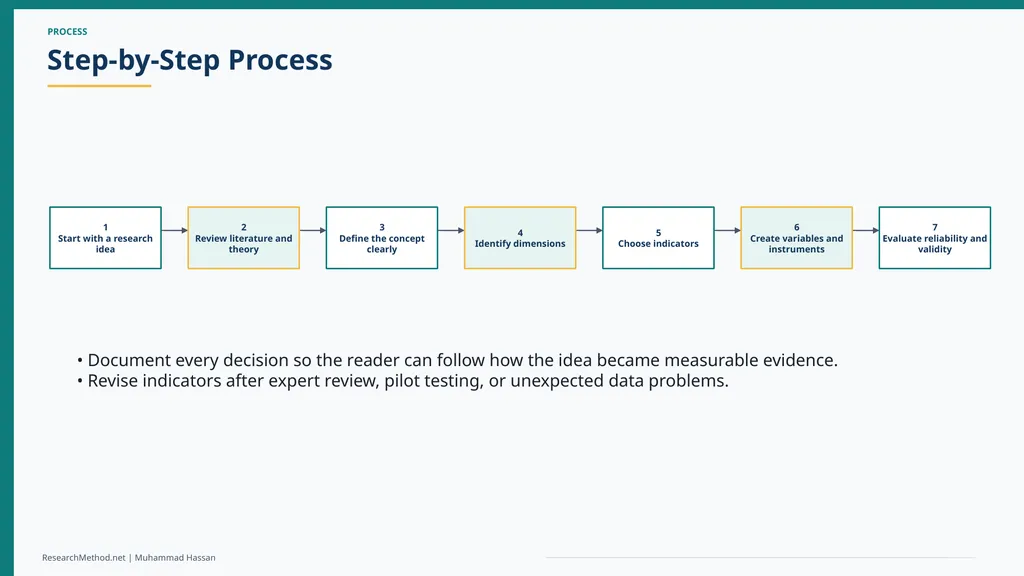
PROCESS Step-by-Step Process ResearchMethod.net | Muhammad Hassan 1
Start with a research idea 2
Review literature and theory 3
Define the concept clearly 4
Identify dimensions 5
Choose indicators 6
Create variables and instruments 7
Evaluate reliability and validity • Document every decision so the reader can follow how the idea became measurable evidence.
• Revise indicators after expert review, pilot testing, or unexpected data problems.<br>
Start with a research idea 2
Review literature and theory 3
Define the concept clearly 4
Identify dimensions 5
Choose indicators 6
Create variables and instruments 7
Evaluate reliability and validity • Document every decision so the reader can follow how the idea became measurable evidence.
• Revise indicators after expert review, pilot testing, or unexpected data problems.<br>
16
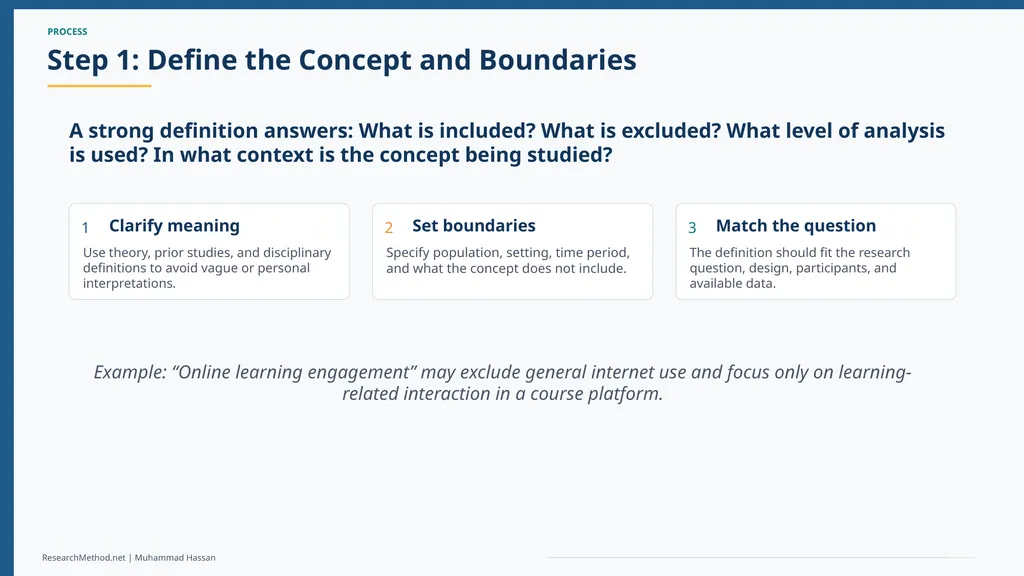
PROCESS Step 1: Define the Concept and Boundaries ResearchMethod.net | Muhammad Hassan A strong definition answers: What is included? What is excluded? What level of analysis is used? In what context is the concept being studied? 1 Clarify meaning Use theory, prior studies, and disciplinary definitions to avoid vague or personal interpretations. 2 Set boundaries Specify population, setting, time period, and what the concept does not include. 3 Match the question The definition should fit the research question, design, participants, and available data. Example: “Online learning engagement” may exclude general internet use and focus only on learning-related interaction in a course platform.<br>
17
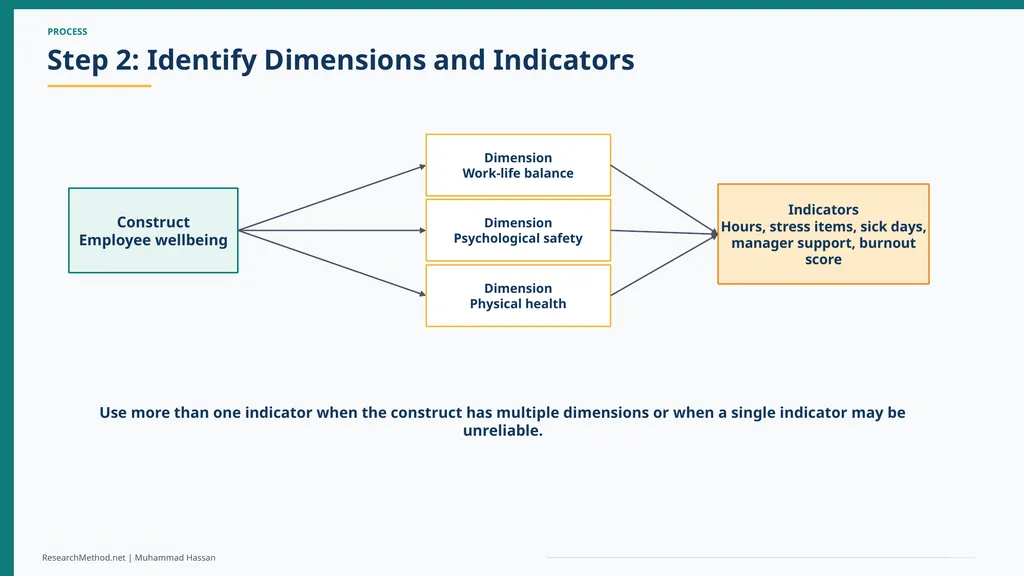
PROCESS Step 2: Identify Dimensions and Indicators ResearchMethod.net | Muhammad Hassan Construct
Employee wellbeing Dimension
Work-life balance Dimension
Psychological safety Dimension
Physical health Indicators
Hours, stress items, sick days,
manager support, burnout score Use more than one indicator when the construct has multiple dimensions or when a single indicator may be unreliable.<br>
Employee wellbeing Dimension
Work-life balance Dimension
Psychological safety Dimension
Physical health Indicators
Hours, stress items, sick days,
manager support, burnout score Use more than one indicator when the construct has multiple dimensions or when a single indicator may be unreliable.<br>
18
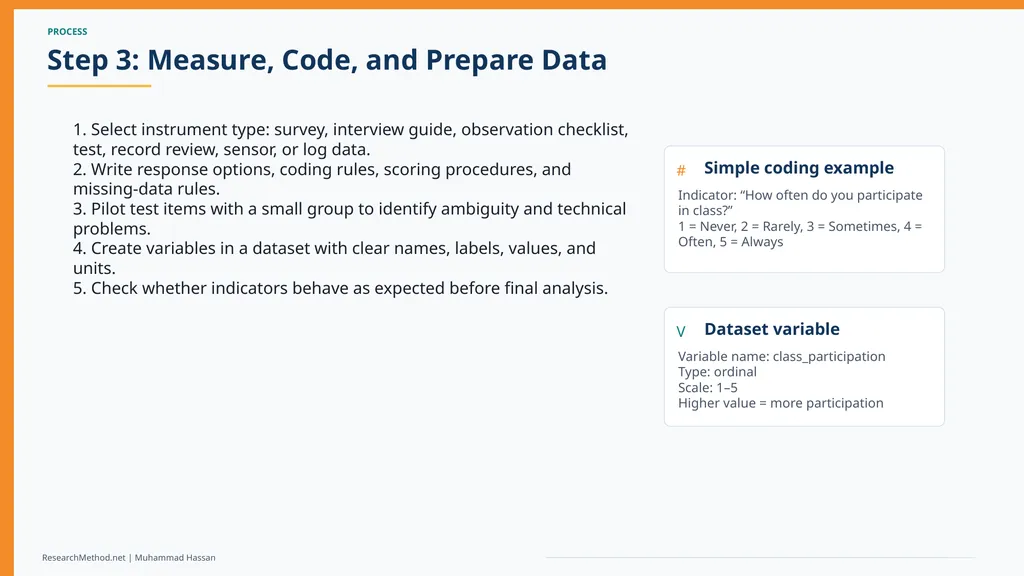
PROCESS Step 3: Measure, Code, and Prepare Data ResearchMethod.net | Muhammad Hassan 1. Select instrument type: survey, interview guide, observation checklist, test, record review, sensor, or log data.
2. Write response options, coding rules, scoring procedures, and missing-data rules.
3. Pilot test items with a small group to identify ambiguity and technical problems.
4. Create variables in a dataset with clear names, labels, values, and units.
5. Check whether indicators behave as expected before final analysis. # Simple coding example Indicator: “How often do you participate in class?”
1 = Never, 2 = Rarely, 3 = Sometimes, 4 = Often, 5 = Always V Dataset variable Variable name: class_participation
Type: ordinal
Scale: 1–5
Higher value = more participation<br>
2. Write response options, coding rules, scoring procedures, and missing-data rules.
3. Pilot test items with a small group to identify ambiguity and technical problems.
4. Create variables in a dataset with clear names, labels, values, and units.
5. Check whether indicators behave as expected before final analysis. # Simple coding example Indicator: “How often do you participate in class?”
1 = Never, 2 = Rarely, 3 = Sometimes, 4 = Often, 5 = Always V Dataset variable Variable name: class_participation
Type: ordinal
Scale: 1–5
Higher value = more participation<br>
19
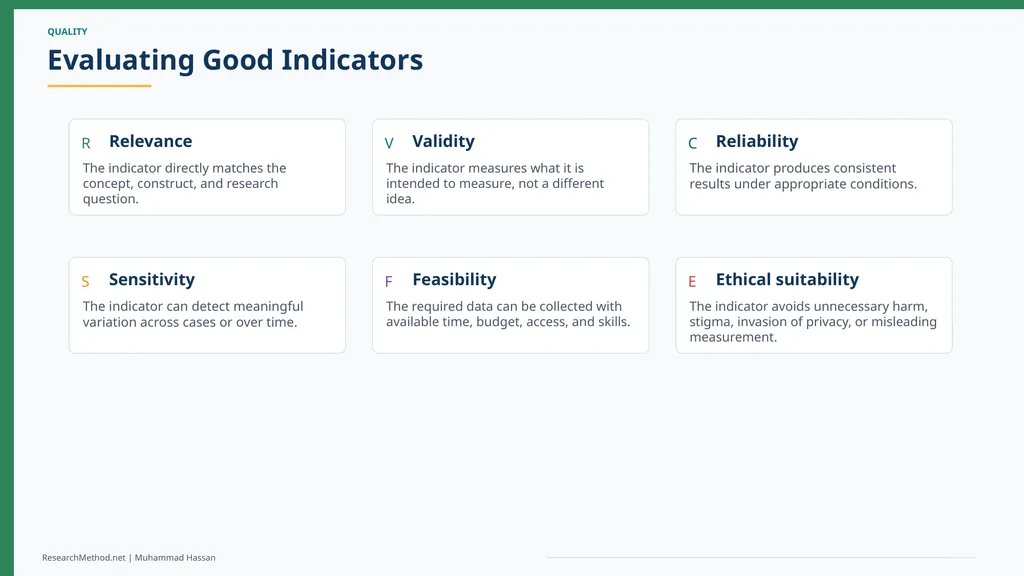
QUALITY Evaluating Good Indicators ResearchMethod.net | Muhammad Hassan R Relevance The indicator directly matches the concept, construct, and research question. V Validity The indicator measures what it is intended to measure, not a different idea. C Reliability The indicator produces consistent results under appropriate conditions. S Sensitivity The indicator can detect meaningful variation across cases or over time. F Feasibility The required data can be collected with available time, budget, access, and skills. E Ethical suitability The indicator avoids unnecessary harm, stigma, invasion of privacy, or misleading measurement.<br>
20
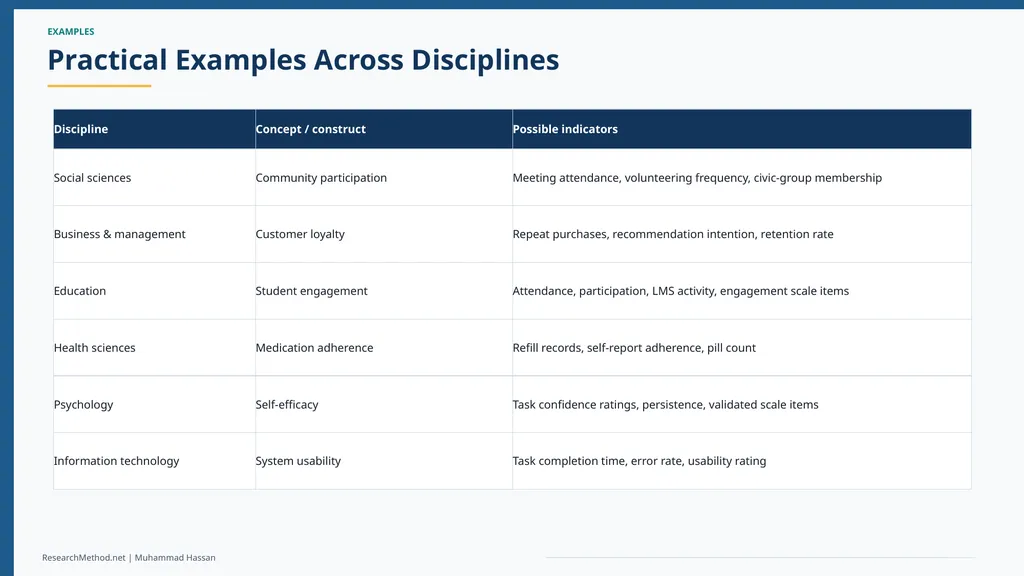
EXAMPLES Practical Examples Across Disciplines ResearchMethod.net | Muhammad Hassan Discipline Concept / construct Possible indicators Social sciences Community participation Meeting attendance, volunteering frequency, civic-group membership Business & management Customer loyalty Repeat purchases, recommendation intention, retention rate Education Student engagement Attendance, participation, LMS activity, engagement scale items Health sciences Medication adherence Refill records, self-report adherence, pill count Psychology Self-efficacy Task confidence ratings, persistence, validated scale items Information technology System usability Task completion time, error rate, usability rating<br>
21
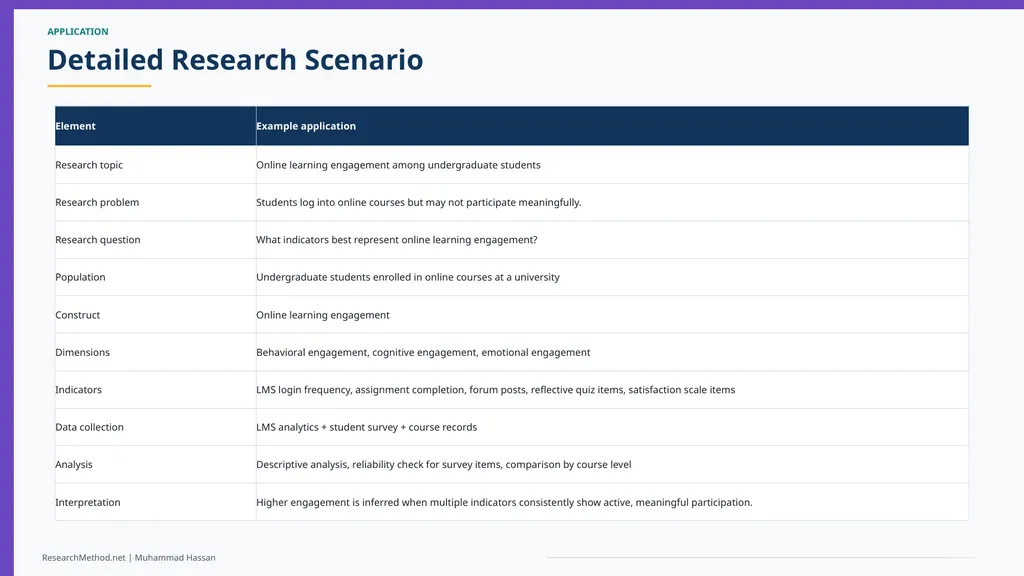
APPLICATION Detailed Research Scenario ResearchMethod.net | Muhammad Hassan Element Example application Research topic Online learning engagement among undergraduate students Research problem Students log into online courses but may not participate meaningfully. Research question What indicators best represent online learning engagement? Population Undergraduate students enrolled in online courses at a university Construct Online learning engagement Dimensions Behavioral engagement, cognitive engagement, emotional engagement Indicators LMS login frequency, assignment completion, forum posts, reflective quiz items, satisfaction scale items Data collection LMS analytics + student survey + course records Analysis Descriptive analysis, reliability check for survey items, comparison by course level Interpretation Higher engagement is inferred when multiple indicators consistently show active, meaningful participation.<br>
22
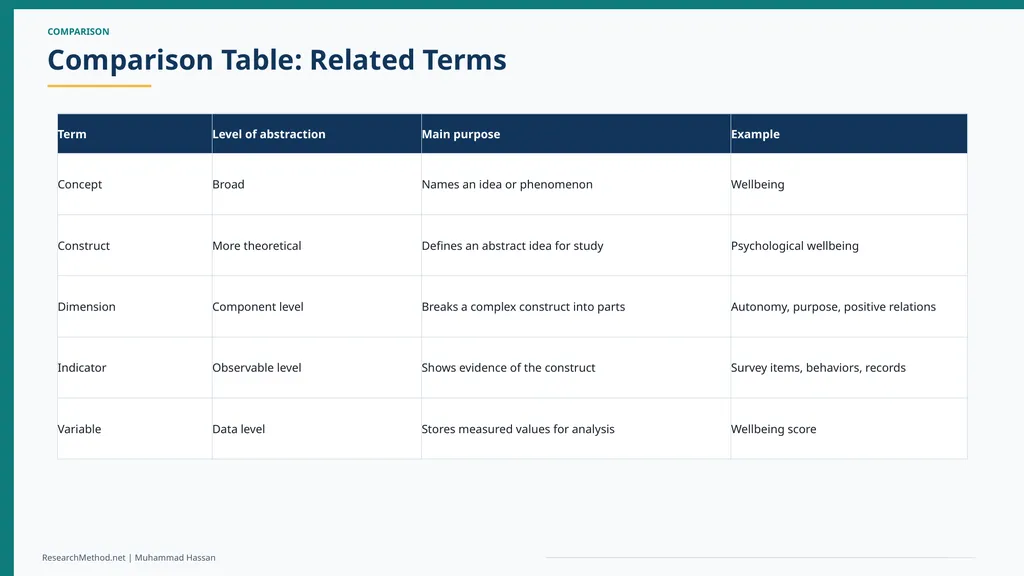
COMPARISON Comparison Table: Related Terms ResearchMethod.net | Muhammad Hassan Term Level of abstraction Main purpose Example Concept Broad Names an idea or phenomenon Wellbeing Construct More theoretical Defines an abstract idea for study Psychological wellbeing Dimension Component level Breaks a complex construct into parts Autonomy, purpose, positive relations Indicator Observable level Shows evidence of the construct Survey items, behaviors, records Variable Data level Stores measured values for analysis Wellbeing score<br>
23
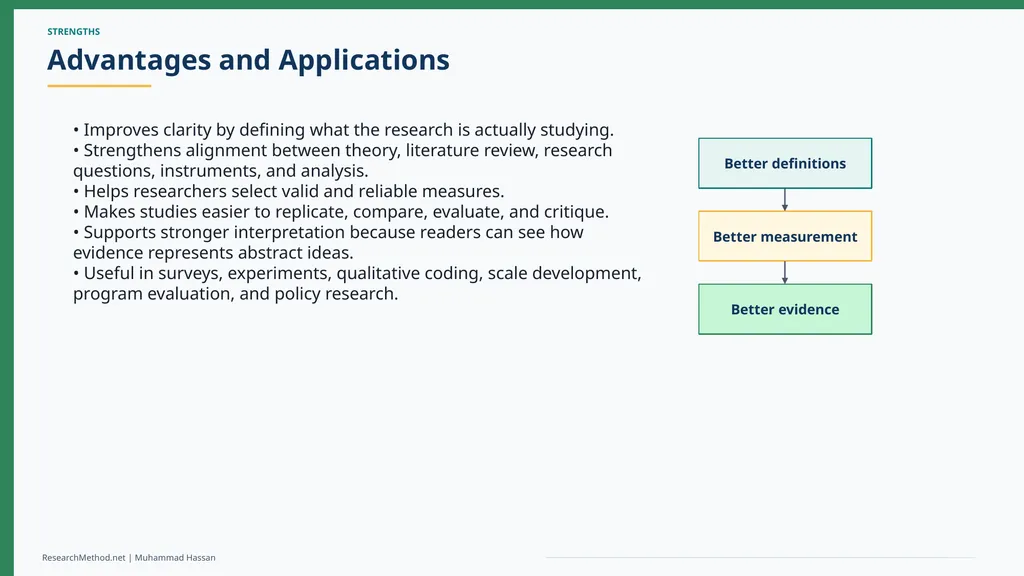
STRENGTHS Advantages and Applications ResearchMethod.net | Muhammad Hassan • Improves clarity by defining what the research is actually studying.
• Strengthens alignment between theory, literature review, research questions, instruments, and analysis.
• Helps researchers select valid and reliable measures.
• Makes studies easier to replicate, compare, evaluate, and critique.
• Supports stronger interpretation because readers can see how evidence represents abstract ideas.
• Useful in surveys, experiments, qualitative coding, scale development, program evaluation, and policy research. Better definitions Better measurement Better evidence<br>
• Strengthens alignment between theory, literature review, research questions, instruments, and analysis.
• Helps researchers select valid and reliable measures.
• Makes studies easier to replicate, compare, evaluate, and critique.
• Supports stronger interpretation because readers can see how evidence represents abstract ideas.
• Useful in surveys, experiments, qualitative coding, scale development, program evaluation, and policy research. Better definitions Better measurement Better evidence<br>
24
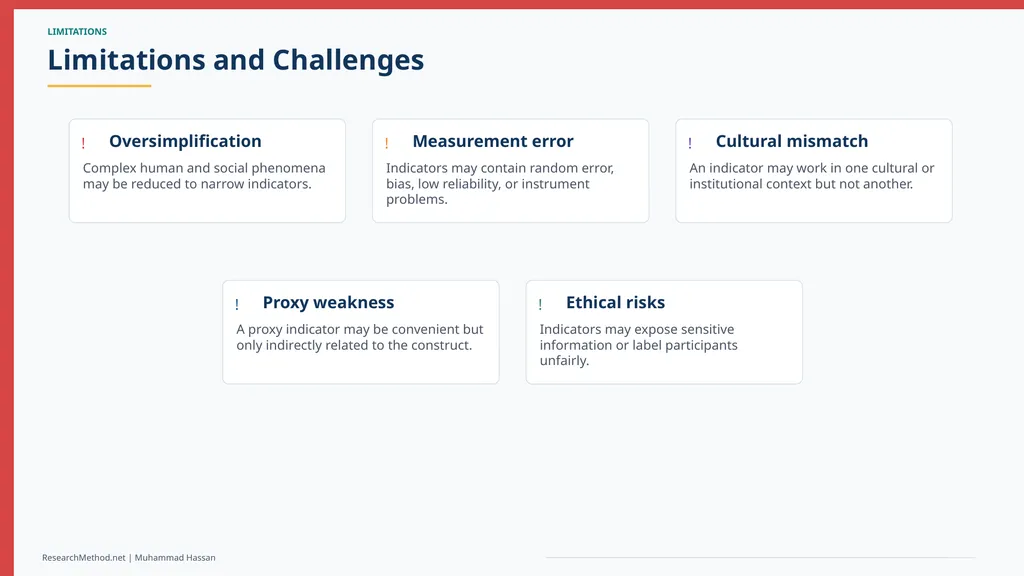
LIMITATIONS Limitations and Challenges ResearchMethod.net | Muhammad Hassan ! Oversimplification Complex human and social phenomena may be reduced to narrow indicators. ! Measurement error Indicators may contain random error, bias, low reliability, or instrument problems. ! Cultural mismatch An indicator may work in one cultural or institutional context but not another. ! Proxy weakness A proxy indicator may be convenient but only indirectly related to the construct. ! Ethical risks Indicators may expose sensitive information or label participants unfairly.<br>
25
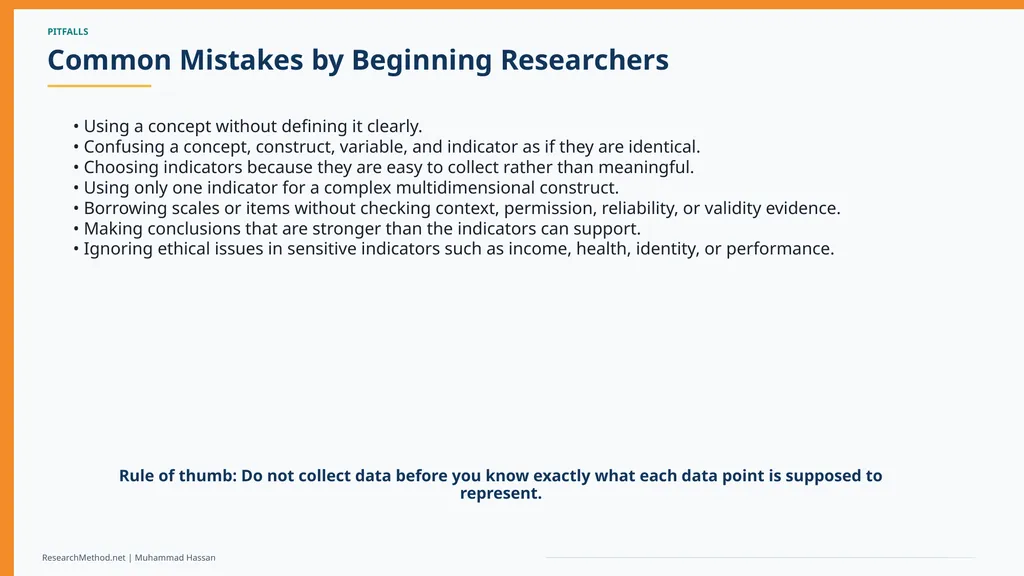
PITFALLS Common Mistakes by Beginning Researchers ResearchMethod.net | Muhammad Hassan • Using a concept without defining it clearly.
• Confusing a concept, construct, variable, and indicator as if they are identical.
• Choosing indicators because they are easy to collect rather than meaningful.
• Using only one indicator for a complex multidimensional construct.
• Borrowing scales or items without checking context, permission, reliability, or validity evidence.
• Making conclusions that are stronger than the indicators can support.
• Ignoring ethical issues in sensitive indicators such as income, health, identity, or performance. Rule of thumb: Do not collect data before you know exactly what each data point is supposed to represent.<br>
• Confusing a concept, construct, variable, and indicator as if they are identical.
• Choosing indicators because they are easy to collect rather than meaningful.
• Using only one indicator for a complex multidimensional construct.
• Borrowing scales or items without checking context, permission, reliability, or validity evidence.
• Making conclusions that are stronger than the indicators can support.
• Ignoring ethical issues in sensitive indicators such as income, health, identity, or performance. Rule of thumb: Do not collect data before you know exactly what each data point is supposed to represent.<br>
26
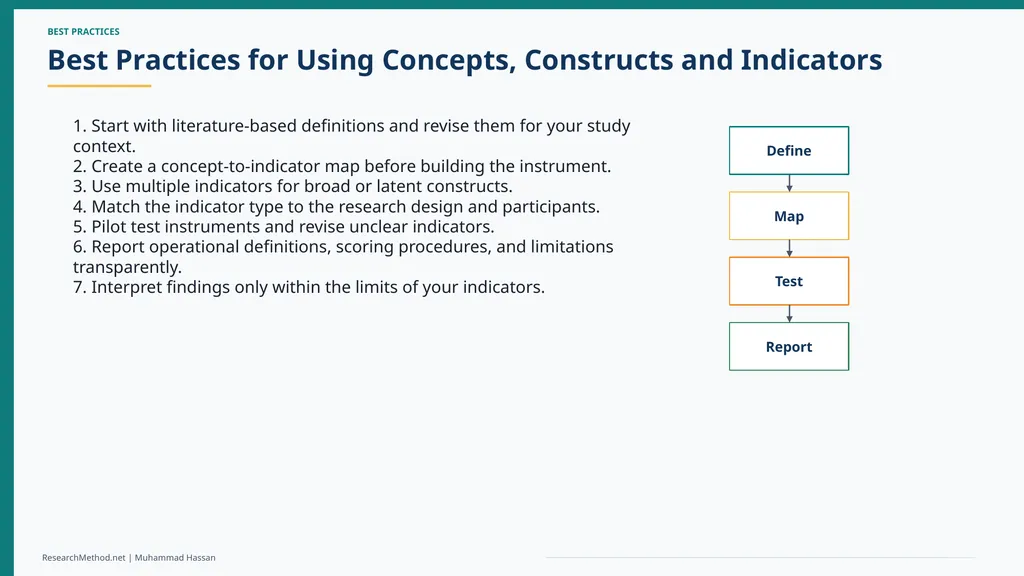
BEST PRACTICES Best Practices for Using Concepts, Constructs and Indicators ResearchMethod.net | Muhammad Hassan 1. Start with literature-based definitions and revise them for your study context.
2. Create a concept-to-indicator map before building the instrument.
3. Use multiple indicators for broad or latent constructs.
4. Match the indicator type to the research design and participants.
5. Pilot test instruments and revise unclear indicators.
6. Report operational definitions, scoring procedures, and limitations transparently.
7. Interpret findings only within the limits of your indicators. Define Map Test Report<br>
2. Create a concept-to-indicator map before building the instrument.
3. Use multiple indicators for broad or latent constructs.
4. Match the indicator type to the research design and participants.
5. Pilot test instruments and revise unclear indicators.
6. Report operational definitions, scoring procedures, and limitations transparently.
7. Interpret findings only within the limits of your indicators. Define Map Test Report<br>
27
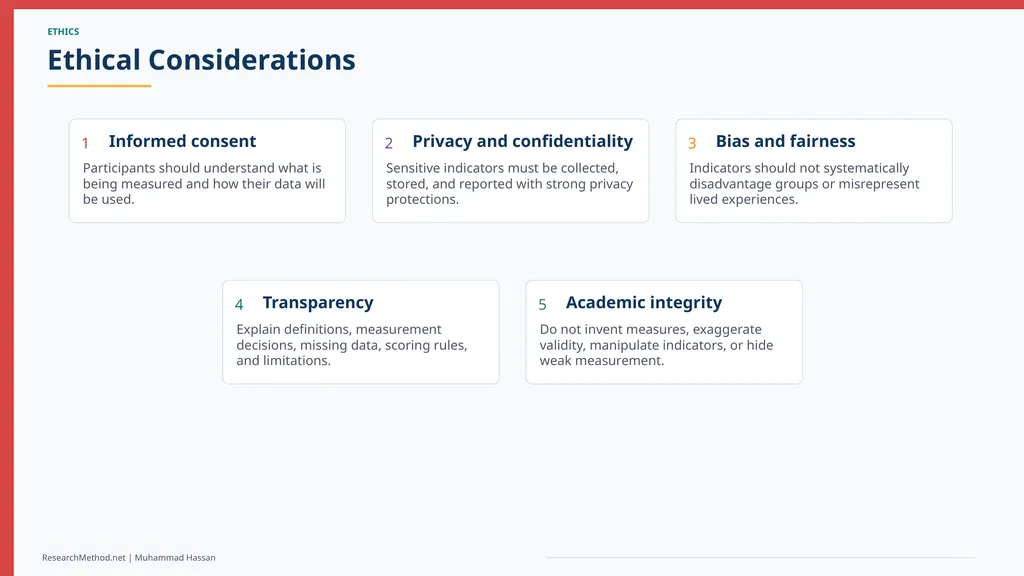
ETHICS Ethical Considerations ResearchMethod.net | Muhammad Hassan 1 Informed consent Participants should understand what is being measured and how their data will be used. 2 Privacy and confidentiality Sensitive indicators must be collected, stored, and reported with strong privacy protections. 3 Bias and fairness Indicators should not systematically disadvantage groups or misrepresent lived experiences. 4 Transparency Explain definitions, measurement decisions, missing data, scoring rules, and limitations. 5 Academic integrity Do not invent measures, exaggerate validity, manipulate indicators, or hide weak measurement.<br>
28
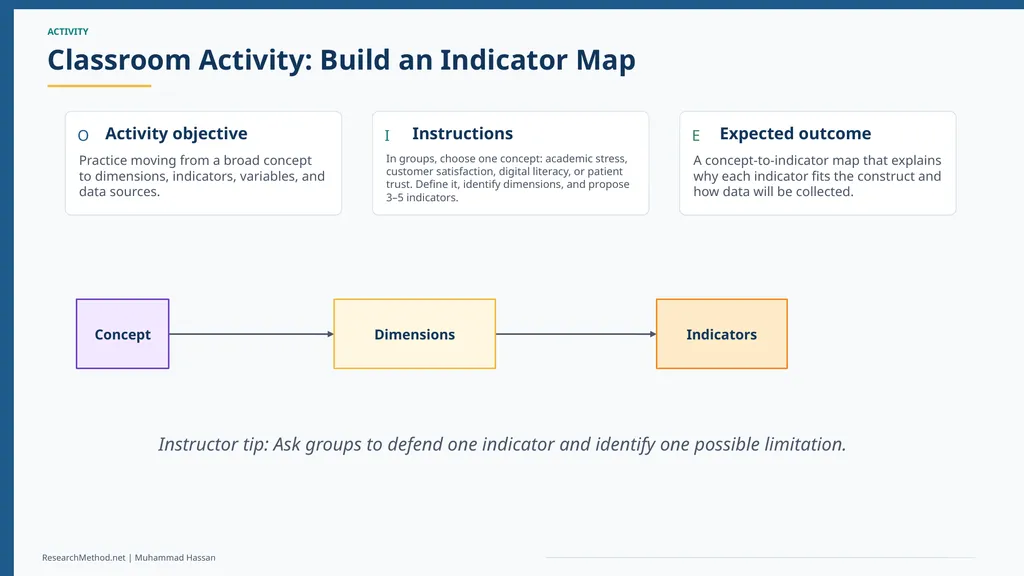
ACTIVITY Classroom Activity: Build an Indicator Map ResearchMethod.net | Muhammad Hassan O Activity objective Practice moving from a broad concept to dimensions, indicators, variables, and data sources. I Instructions In groups, choose one concept: academic stress, customer satisfaction, digital literacy, or patient trust. Define it, identify dimensions, and propose 3–5 indicators. E Expected outcome A concept-to-indicator map that explains why each indicator fits the construct and how data will be collected. Concept Dimensions Indicators Instructor tip: Ask groups to defend one indicator and identify one possible limitation.<br>
29
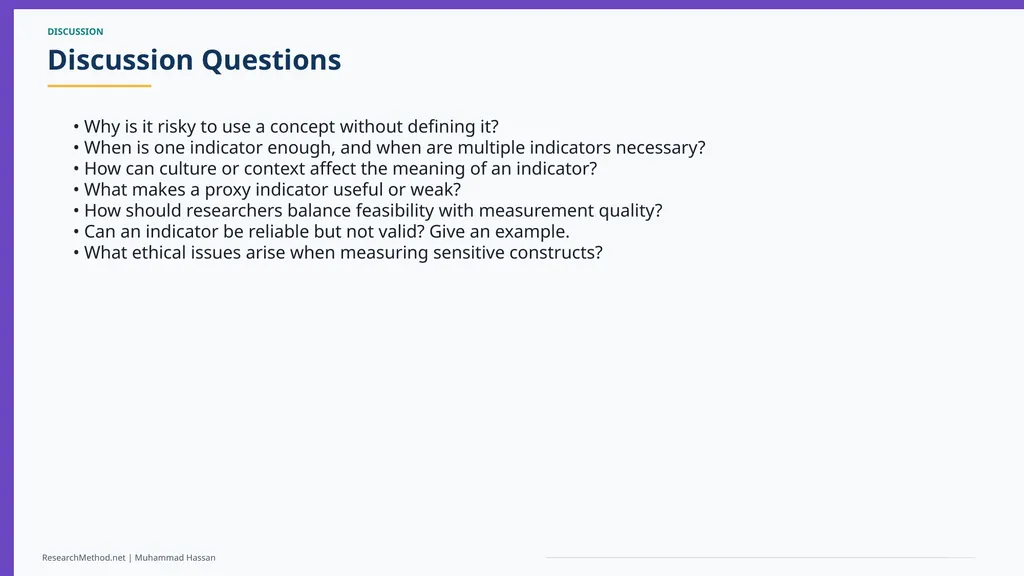
DISCUSSION Discussion Questions ResearchMethod.net | Muhammad Hassan • Why is it risky to use a concept without defining it?
• When is one indicator enough, and when are multiple indicators necessary?
• How can culture or context affect the meaning of an indicator?
• What makes a proxy indicator useful or weak?
• How should researchers balance feasibility with measurement quality?
• Can an indicator be reliable but not valid? Give an example.
• What ethical issues arise when measuring sensitive constructs?<br>
• When is one indicator enough, and when are multiple indicators necessary?
• How can culture or context affect the meaning of an indicator?
• What makes a proxy indicator useful or weak?
• How should researchers balance feasibility with measurement quality?
• Can an indicator be reliable but not valid? Give an example.
• What ethical issues arise when measuring sensitive constructs?<br>
30
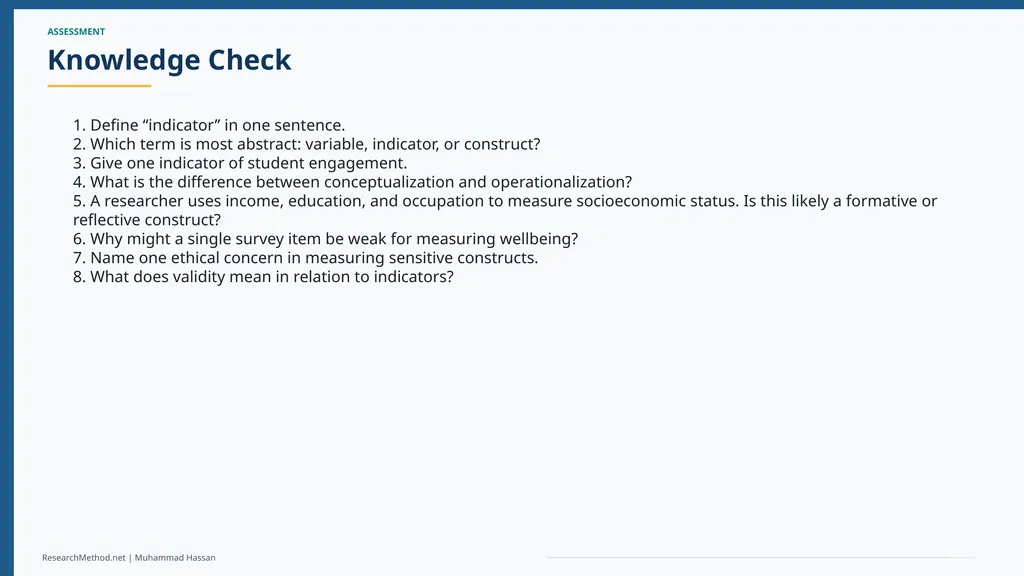
ASSESSMENT Knowledge Check ResearchMethod.net | Muhammad Hassan 1. Define “indicator” in one sentence.
2. Which term is most abstract: variable, indicator, or construct?
3. Give one indicator of student engagement.
4. What is the difference between conceptualization and operationalization?
5. A researcher uses income, education, and occupation to measure socioeconomic status. Is this likely a formative or reflective construct?
6. Why might a single survey item be weak for measuring wellbeing?
7. Name one ethical concern in measuring sensitive constructs.
8. What does validity mean in relation to indicators?<br>
2. Which term is most abstract: variable, indicator, or construct?
3. Give one indicator of student engagement.
4. What is the difference between conceptualization and operationalization?
5. A researcher uses income, education, and occupation to measure socioeconomic status. Is this likely a formative or reflective construct?
6. Why might a single survey item be weak for measuring wellbeing?
7. Name one ethical concern in measuring sensitive constructs.
8. What does validity mean in relation to indicators?<br>
31
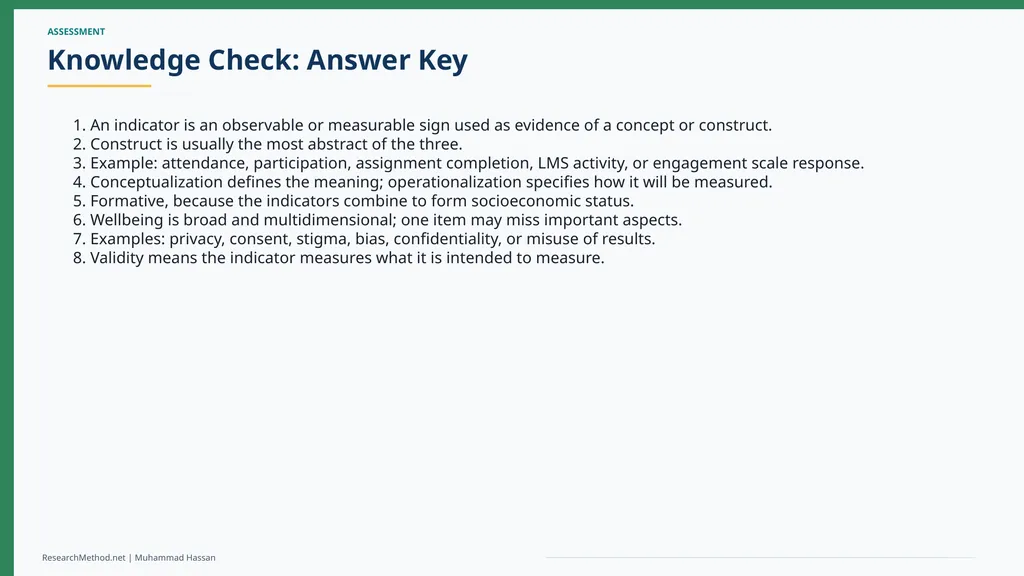
ASSESSMENT Knowledge Check: Answer Key ResearchMethod.net | Muhammad Hassan 1. An indicator is an observable or measurable sign used as evidence of a concept or construct.
2. Construct is usually the most abstract of the three.
3. Example: attendance, participation, assignment completion, LMS activity, or engagement scale response.
4. Conceptualization defines the meaning; operationalization specifies how it will be measured.
5. Formative, because the indicators combine to form socioeconomic status.
6. Wellbeing is broad and multidimensional; one item may miss important aspects.
7. Examples: privacy, consent, stigma, bias, confidentiality, or misuse of results.
8. Validity means the indicator measures what it is intended to measure.<br>
2. Construct is usually the most abstract of the three.
3. Example: attendance, participation, assignment completion, LMS activity, or engagement scale response.
4. Conceptualization defines the meaning; operationalization specifies how it will be measured.
5. Formative, because the indicators combine to form socioeconomic status.
6. Wellbeing is broad and multidimensional; one item may miss important aspects.
7. Examples: privacy, consent, stigma, bias, confidentiality, or misuse of results.
8. Validity means the indicator measures what it is intended to measure.<br>
32
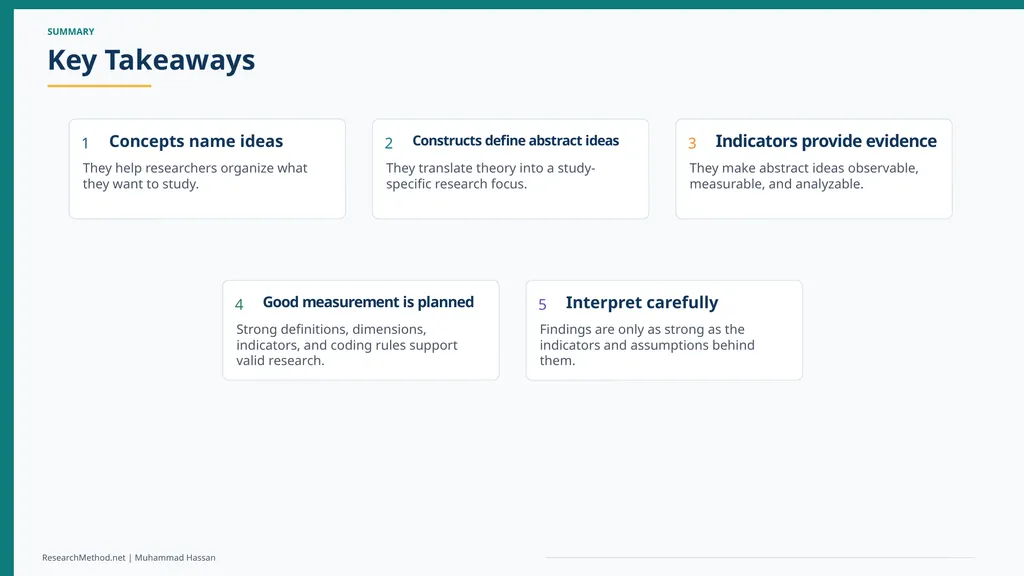
SUMMARY Key Takeaways ResearchMethod.net | Muhammad Hassan 1 Concepts name ideas They help researchers organize what they want to study. 2 Constructs define abstract ideas They translate theory into a study-specific research focus. 3 Indicators provide evidence They make abstract ideas observable, measurable, and analyzable. 4 Good measurement is planned Strong definitions, dimensions, indicators, and coding rules support valid research. 5 Interpret carefully Findings are only as strong as the indicators and assumptions behind them.<br>
33
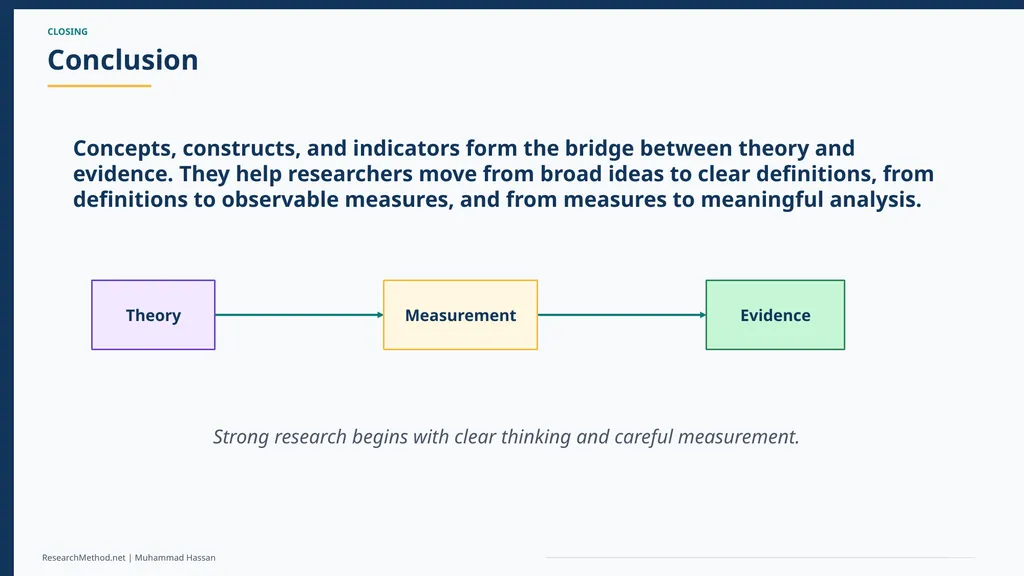
CLOSING Conclusion ResearchMethod.net | Muhammad Hassan Concepts, constructs, and indicators form the bridge between theory and evidence. They help researchers move from broad ideas to clear definitions, from definitions to observable measures, and from measures to meaningful analysis. Theory Measurement Evidence Strong research begins with clear thinking and careful measurement.<br>
34
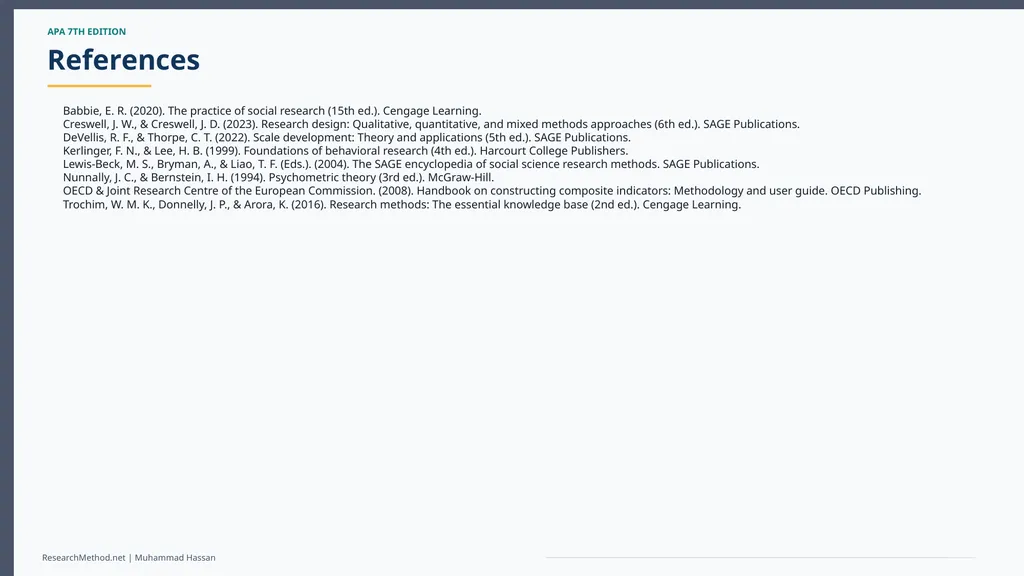
APA 7TH EDITION References ResearchMethod.net | Muhammad Hassan Babbie, E. R. (2020). The practice of social research (15th ed.). Cengage Learning.
Creswell, J. W., & Creswell, J. D. (2023). Research design: Qualitative, quantitative, and mixed methods approaches (6th ed.). SAGE Publications.
DeVellis, R. F., & Thorpe, C. T. (2022). Scale development: Theory and applications (5th ed.). SAGE Publications.
Kerlinger, F. N., & Lee, H. B. (1999). Foundations of behavioral research (4th ed.). Harcourt College Publishers.
Lewis-Beck, M. S., Bryman, A., & Liao, T. F. (Eds.). (2004). The SAGE encyclopedia of social science research methods. SAGE Publications.
Nunnally, J. C., & Bernstein, I. H. (1994). Psychometric theory (3rd ed.). McGraw-Hill.
OECD & Joint Research Centre of the European Commission. (2008). Handbook on constructing composite indicators: Methodology and user guide. OECD Publishing.
Trochim, W. M. K., Donnelly, J. P., & Arora, K. (2016). Research methods: The essential knowledge base (2nd ed.). Cengage Learning.<br>
Creswell, J. W., & Creswell, J. D. (2023). Research design: Qualitative, quantitative, and mixed methods approaches (6th ed.). SAGE Publications.
DeVellis, R. F., & Thorpe, C. T. (2022). Scale development: Theory and applications (5th ed.). SAGE Publications.
Kerlinger, F. N., & Lee, H. B. (1999). Foundations of behavioral research (4th ed.). Harcourt College Publishers.
Lewis-Beck, M. S., Bryman, A., & Liao, T. F. (Eds.). (2004). The SAGE encyclopedia of social science research methods. SAGE Publications.
Nunnally, J. C., & Bernstein, I. H. (1994). Psychometric theory (3rd ed.). McGraw-Hill.
OECD & Joint Research Centre of the European Commission. (2008). Handbook on constructing composite indicators: Methodology and user guide. OECD Publishing.
Trochim, W. M. K., Donnelly, J. P., & Arora, K. (2016). Research methods: The essential knowledge base (2nd ed.). Cengage Learning.<br>
35
Thank You Author: Muhammad Hassan
Website: ResearchMethod.net Visit ResearchMethod.net for research guides, templates, lecture slides, examples, and academic resources. ResearchMethod.net | Muhammad Hassan<br>
Website: ResearchMethod.net Visit ResearchMethod.net for research guides, templates, lecture slides, examples, and academic resources. ResearchMethod.net | Muhammad Hassan<br>