Conditional probability Calculate and interpret conditional probabilities, using expected frequencies with two-way tables, tree diagrams and Venn diagrams Grade A If you have any questions regarding these resources or come across any
"Conditional probability Calculate and interpret" is the property of its rightful owner. Permission is granted to
download and print the materials on this website for personal, non-commercial use only, and to display it
on your personal computer provided you do not modify the materials and that you retain all copyright
notices contained in the materials. By downloading content from our website, you accept the terms of this
agreement.
Presentation Transcript
01
Conditional probability Calculate and interpret conditional probabilities, using expected frequencies with two-way tables, tree diagrams and Venn diagrams Grade A If you have any questions regarding these resources or come across any errors, please contact
helpful-report@pixl.org.uk<br>
02
Key Vocabulary Event
Combined event
Conditional probability and its notation p(AǀB)
Expected frequency
Tree diagram
Venn diagram<br>
03
Combined events When two or more separate events happen this is called a combined event.
Combined events are often represented by tree diagrams, Venn diagrams or two-way tables.
Sometimes we do not need to draw a diagram, and work out the straight probability.<br>
04
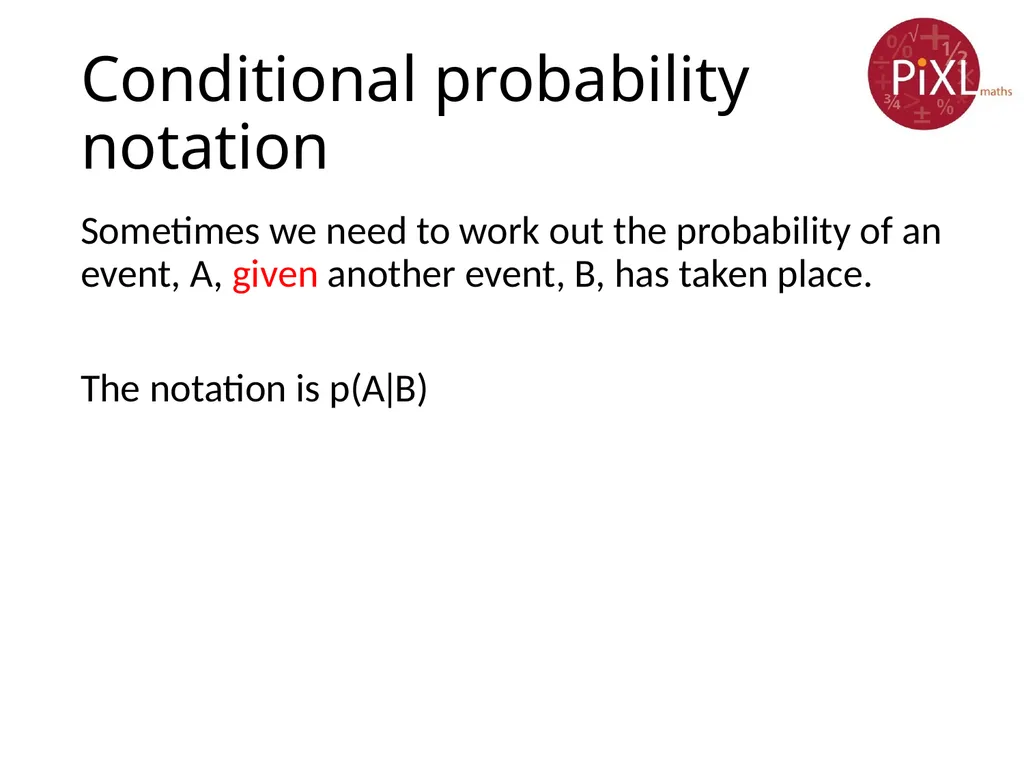
Conditional probability notation Sometimes we need to work out the probability of an event, A, given another event, B, has taken place.
The notation is p(AǀB)<br>
05
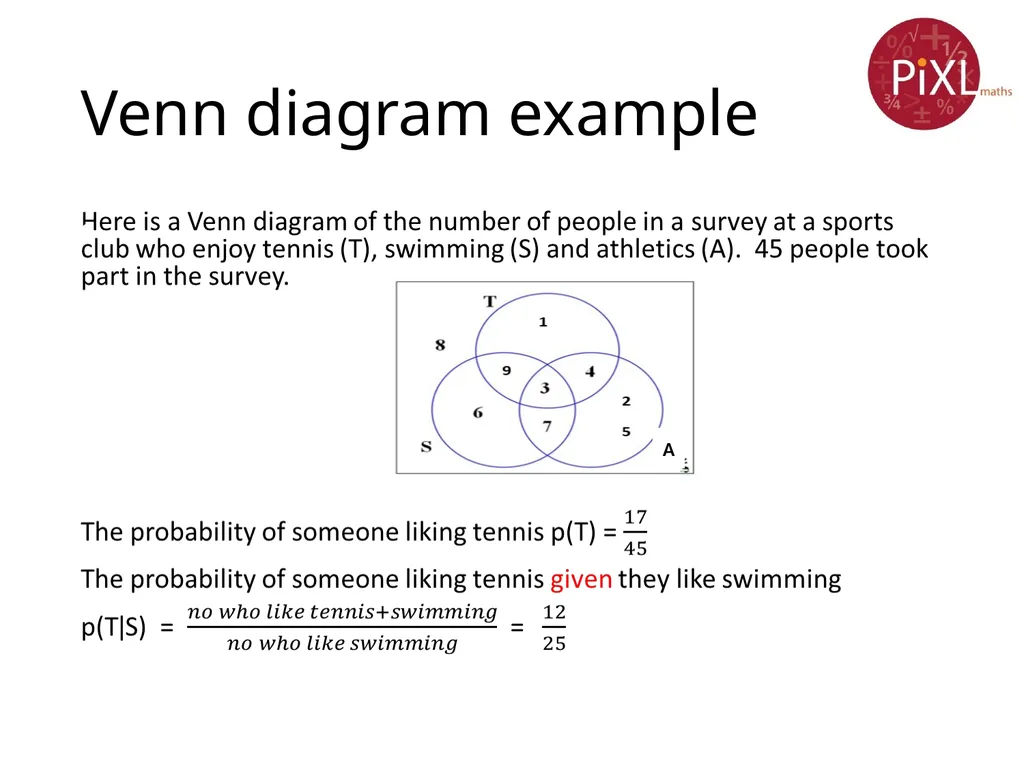
Venn diagram example A<br>
06
Tree diagrams We can represent combined events using a tree diagram.
Probabilities for single events are written on the ‘branches’
Branches from a point cover all possible outcomes for an activity so will always add up to 1.
Each route along a series of branches leads to a combined event. To find its probability, multiply the probabilities along the route.
To find the probability for one or other of the combined events, add their probabilities.<br>
07
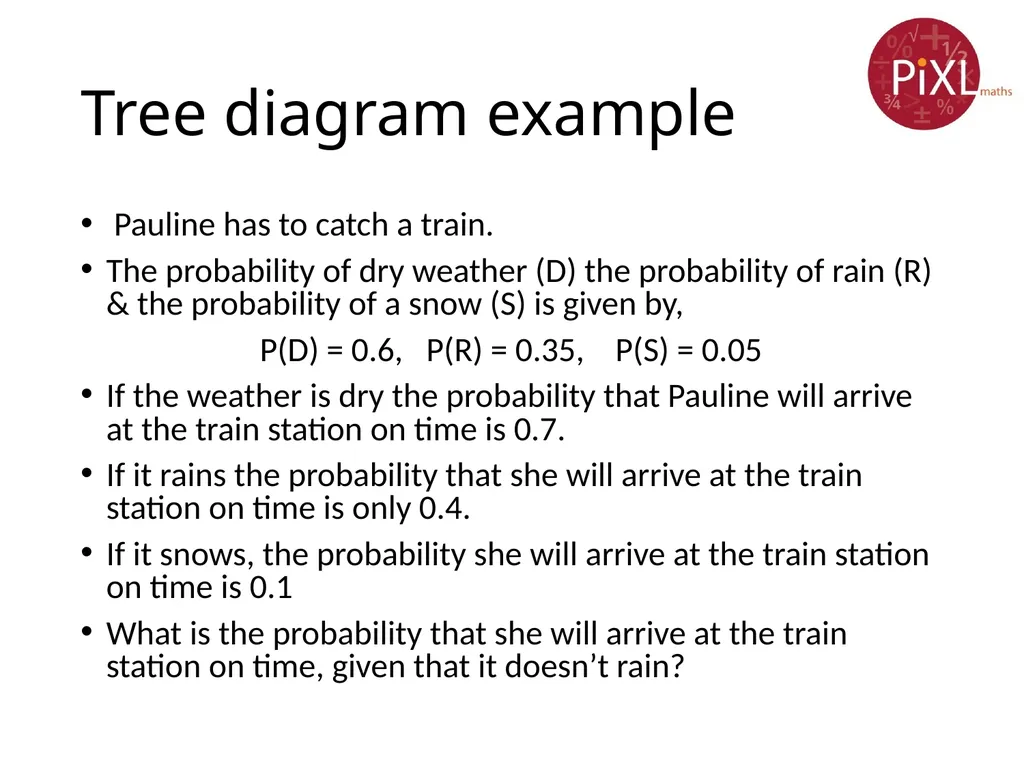
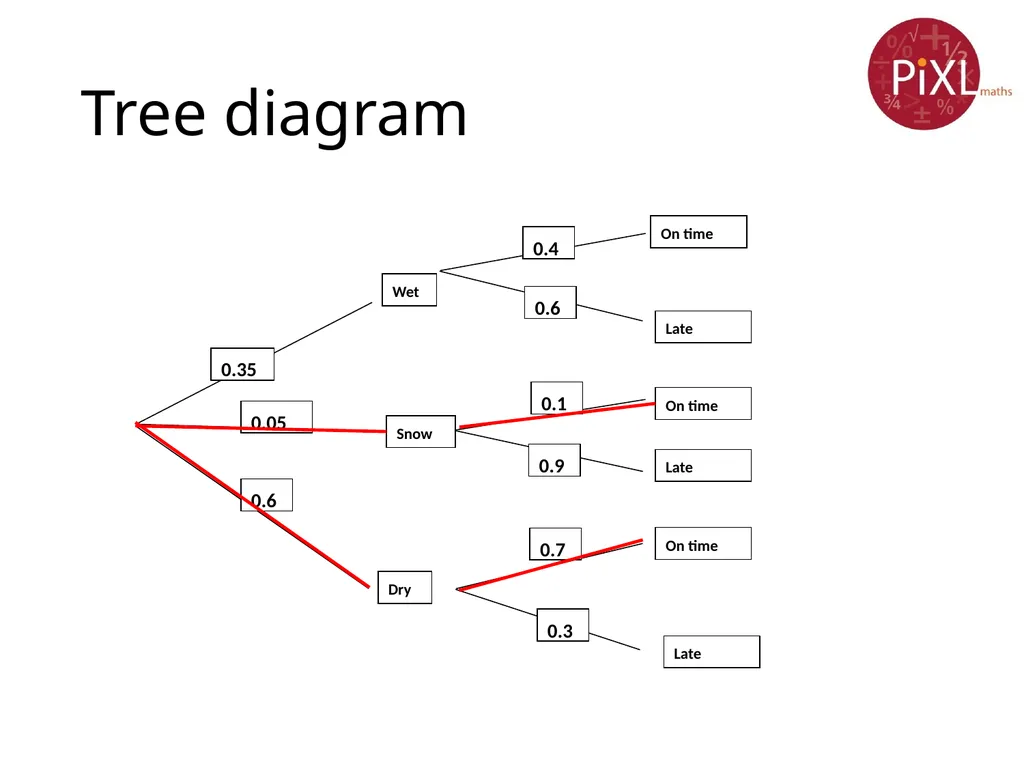
Tree diagram example Pauline has to catch a train.
The probability of dry weather (D) the probability of rain (R) & the probability of a snow (S) is given by,
P(D) = 0.6, P(R) = 0.35, P(S) = 0.05
If the weather is dry the probability that Pauline will arrive at the train station on time is 0.7.
If it rains the probability that she will arrive at the train station on time is only 0.4.
If it snows, the probability she will arrive at the train station on time is 0.1
What is the probability that she will arrive at the train station on time, given that it doesn’t rain?<br>
08
Tree diagram Wet Dry On time On time Late Late 0.35 0.6 0.6 0.4 0.3 0.7 Snow 0.05 Late On time 0.1 0.9<br>
09
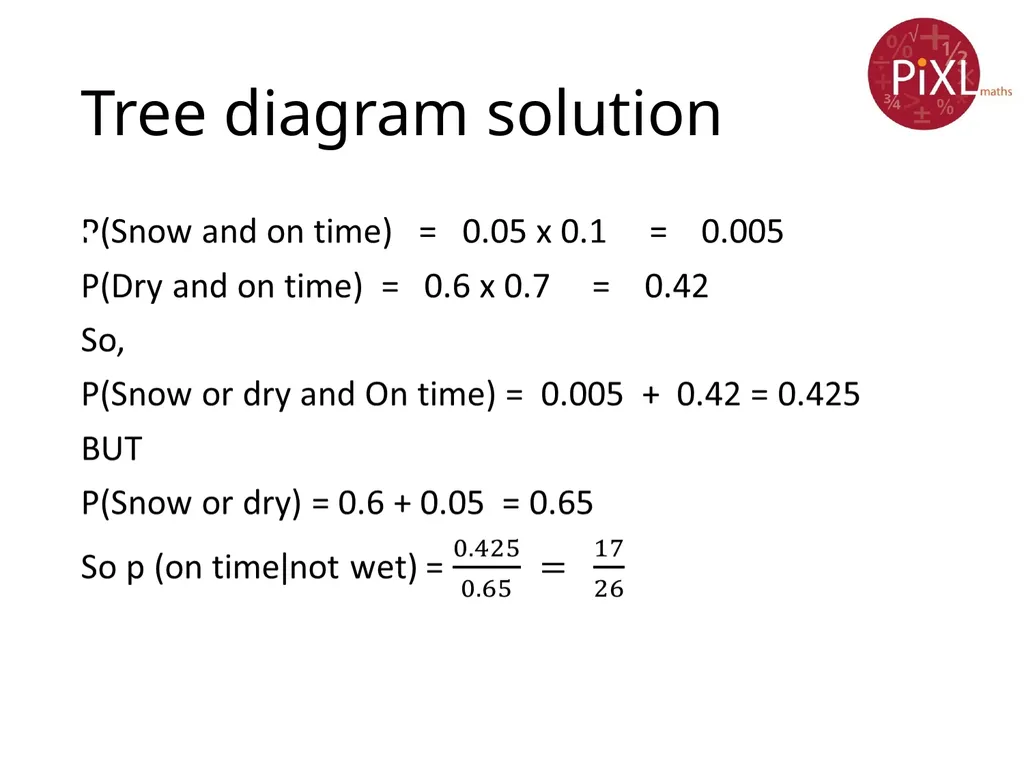
Tree diagram solution<br>
10
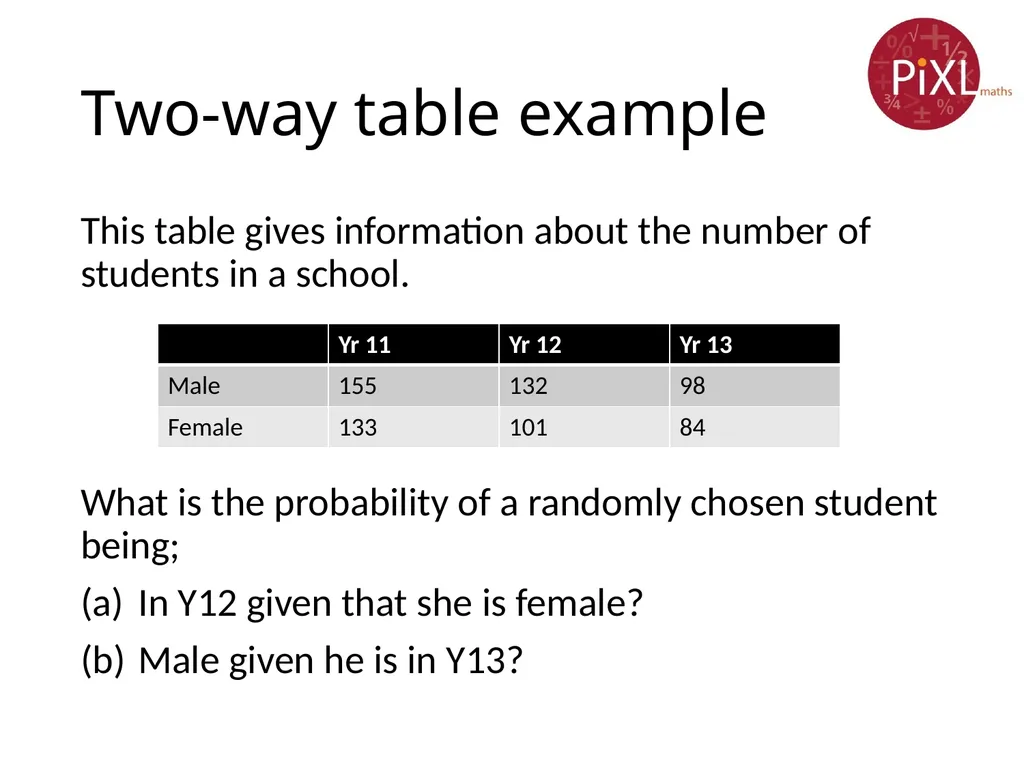
Two-way table example This table gives information about the number of students in a school.
What is the probability of a randomly chosen student being;
In Y12 given that she is female?
Male given he is in Y13?<br>
11
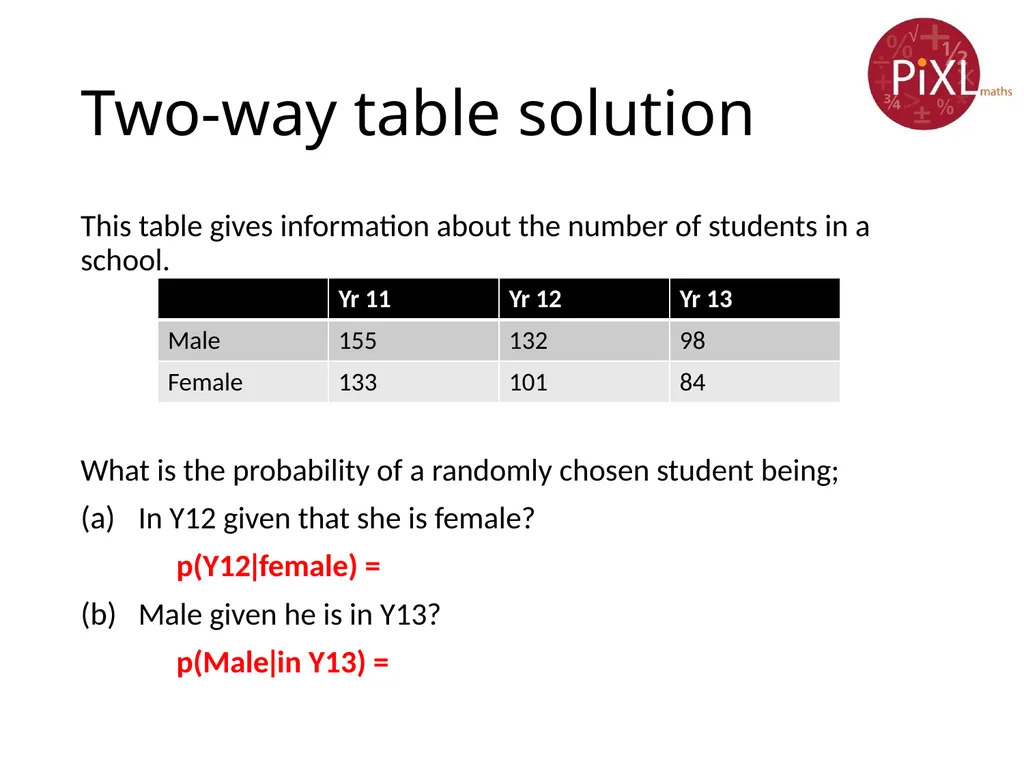
Two-way table solution This table gives information about the number of students in a school.
What is the probability of a randomly chosen student being;
In Y12 given that she is female?
p(Y12ǀfemale) =
Male given he is in Y13?
p(Maleǀin Y13) =<br>
12
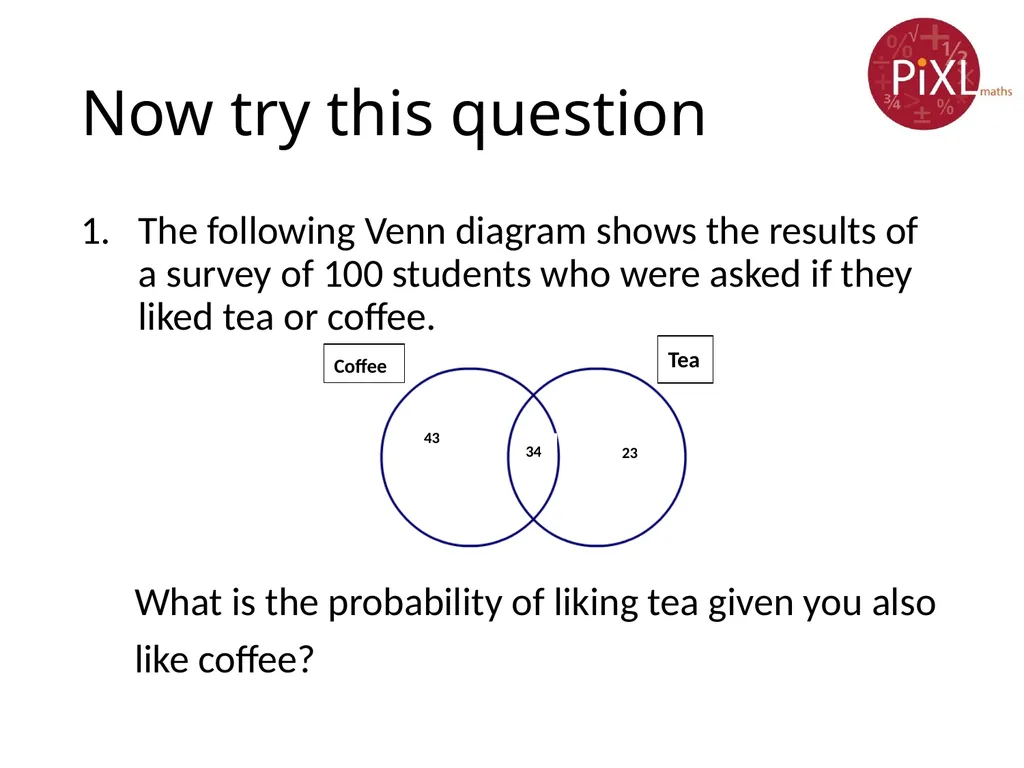
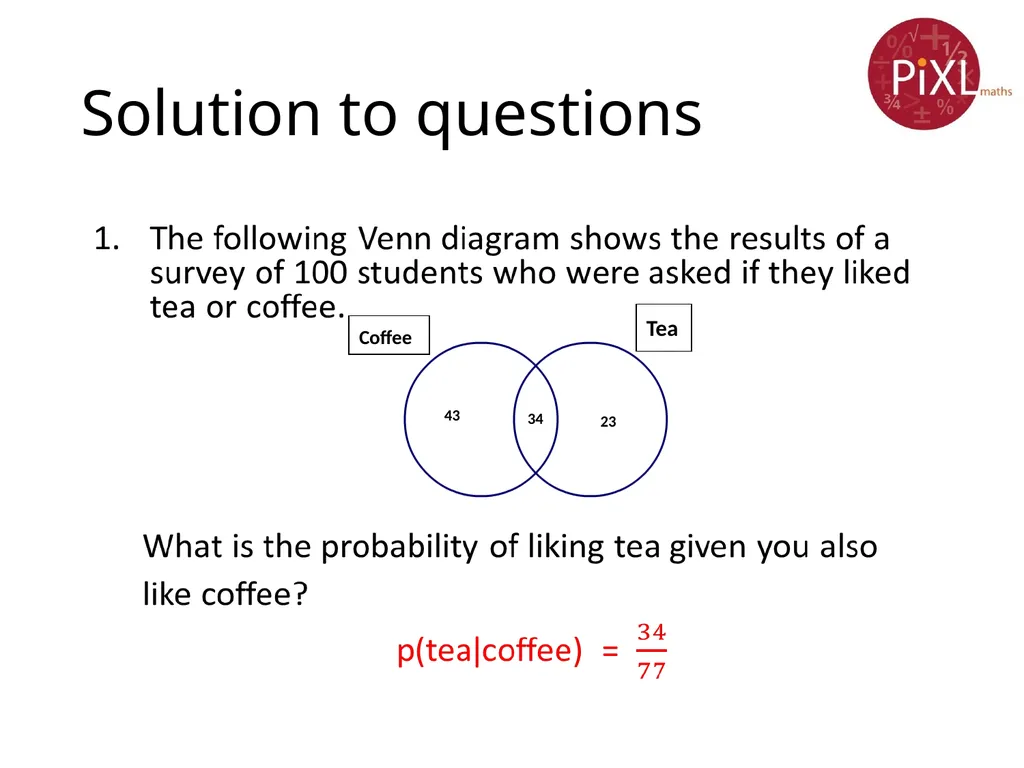
Now try this question The following Venn diagram shows the results of a survey of 100 students who were asked if they liked tea or coffee.
What is the probability of liking tea given you also
like coffee? Coffee Tea 23 43 34<br>
13
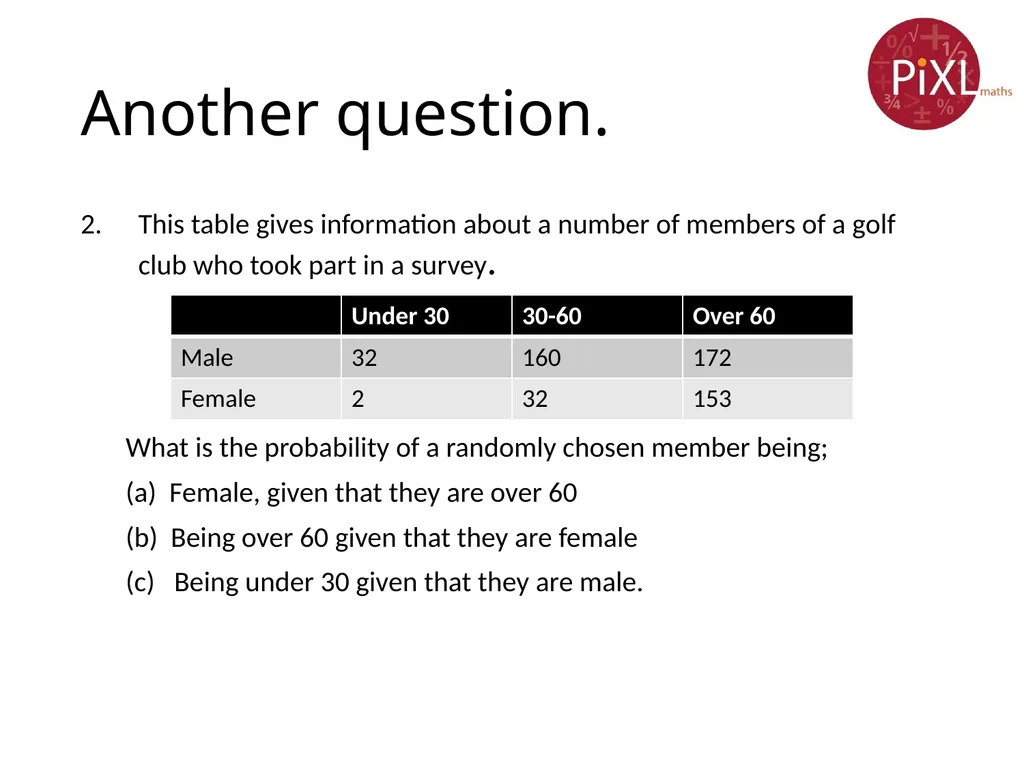
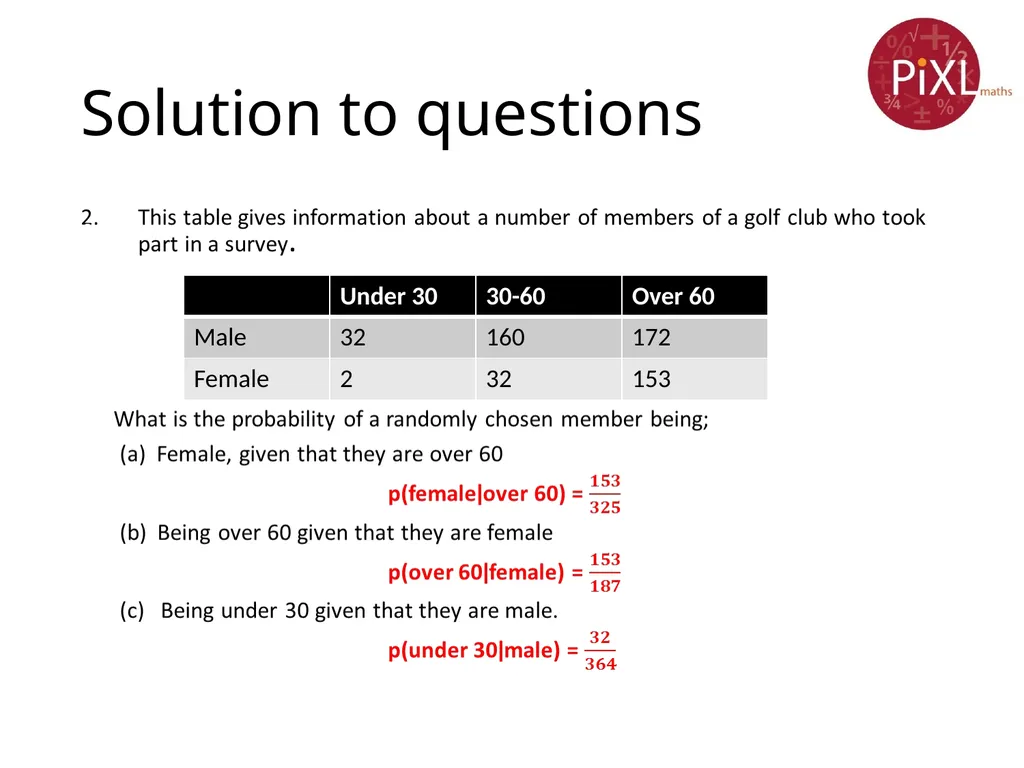
Another question. This table gives information about a number of members of a golf club who took part in a survey.
What is the probability of a randomly chosen member being;
(a) Female, given that they are over 60
(b) Being over 60 given that they are female
(c) Being under 30 given that they are male.<br>
14
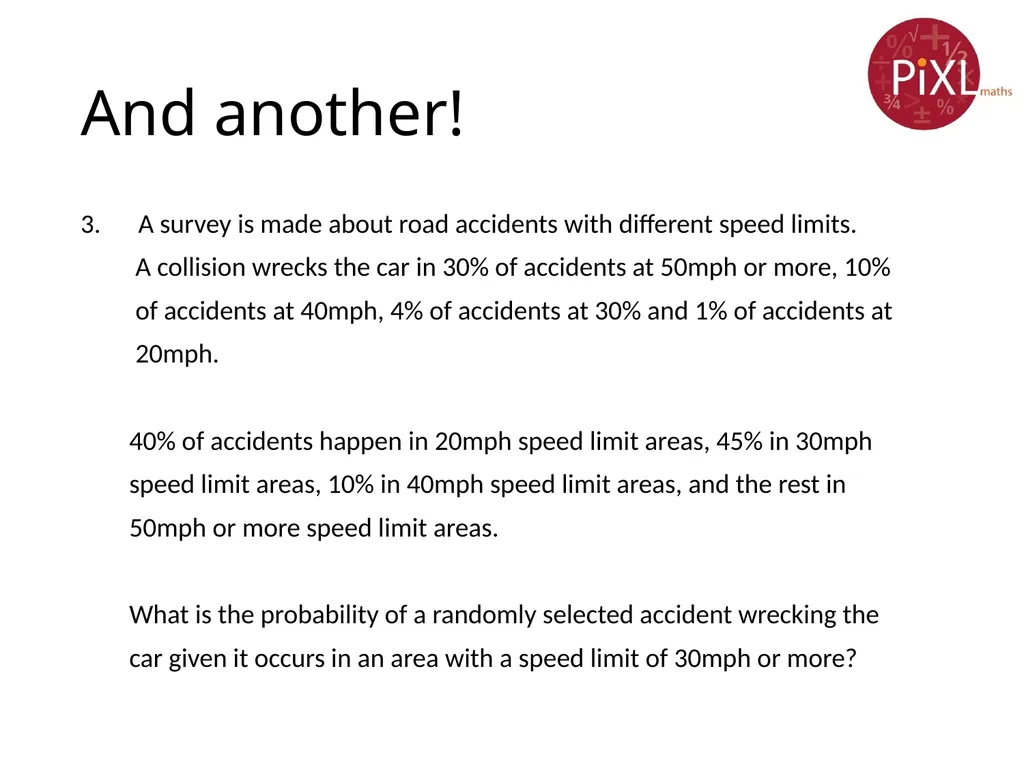
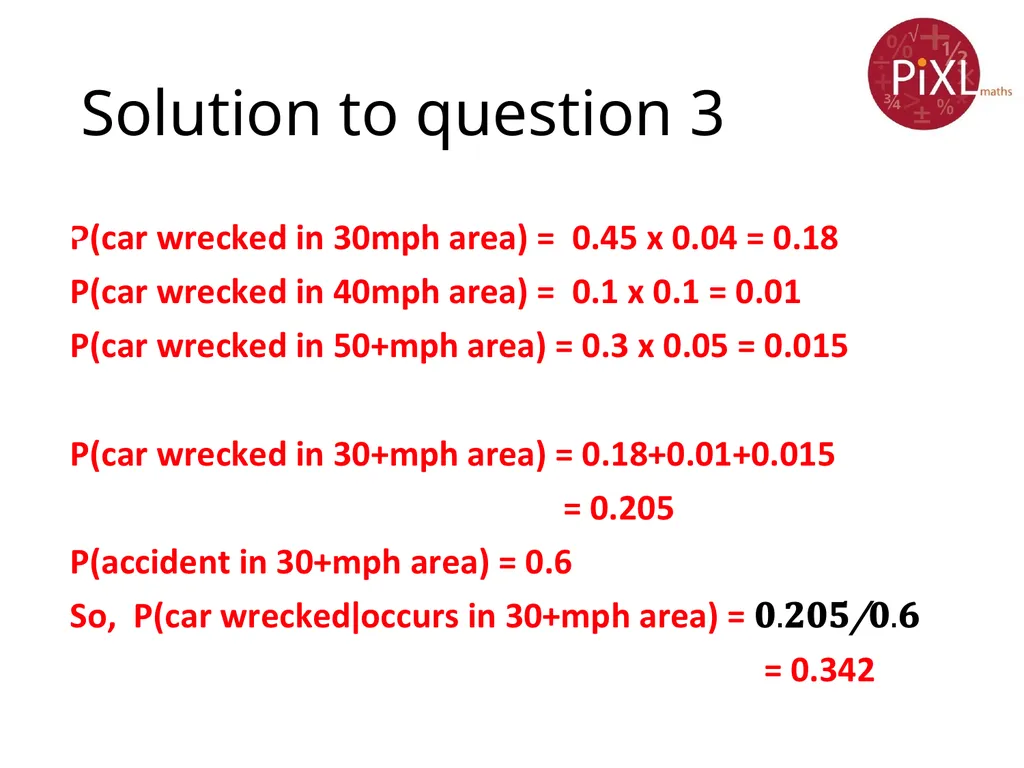
And another! A survey is made about road accidents with different speed limits.
A collision wrecks the car in 30% of accidents at 50mph or more, 10%
of accidents at 40mph, 4% of accidents at 30% and 1% of accidents at
20mph.
40% of accidents happen in 20mph speed limit areas, 45% in 30mph
speed limit areas, 10% in 40mph speed limit areas, and the rest in
50mph or more speed limit areas.
What is the probability of a randomly selected accident wrecking the
car given it occurs in an area with a speed limit of 30mph or more?<br>