
Cooperative Research Programs Transportation
MY
Published · 37 slides · 0 views
1 / 1


Description
Cooperative Research Programs Transportation Research Board National Academies of Science, Engineering and Medicine 500 Fifth Street, NW Washington, DC 20001 Briefing F-26: Improving the Health and Safety of Transit Workers with
Related Topics
Share
Embed code
Download this presentation From Below
"Cooperative Research Programs Transportation" is the property of its rightful owner. Permission is granted to download and print the materials on this website for personal, non-commercial use only, and to display it on your personal computer provided you do not modify the materials and that you retain all copyright notices contained in the materials. By downloading content from our website, you accept the terms of this agreement.
Presentation Transcript
01
Cooperative Research Programs
Transportation Research Board
National Academies of Science, Engineering and Medicine
500 Fifth Street, NW
Washington, DC 20001 Briefing
F-26: Improving the Health and Safety of Transit Workers with Corresponding Impacts on the Bottom Line
AUTHOR: Jennifer Stoloff
Contributors: Frankie Clogston, Fred Bellemore, Cynthia Khan, Jeff Pongsiri, and Timothy Beggs TLC staff: Xinge Wang and Karitsa Holdzkom Econometrica, Inc.
7475 Wisconsin Avenue, Suite 1000
Bethesda, MD 20814 Contract No.: TCRP F-26
Unit/ No.: 913
Subaward No.: SUB0001109 March 19, 2020<br>
Transportation Research Board
National Academies of Science, Engineering and Medicine
500 Fifth Street, NW
Washington, DC 20001 Briefing
F-26: Improving the Health and Safety of Transit Workers with Corresponding Impacts on the Bottom Line
AUTHOR: Jennifer Stoloff
Contributors: Frankie Clogston, Fred Bellemore, Cynthia Khan, Jeff Pongsiri, and Timothy Beggs TLC staff: Xinge Wang and Karitsa Holdzkom Econometrica, Inc.
7475 Wisconsin Avenue, Suite 1000
Bethesda, MD 20814 Contract No.: TCRP F-26
Unit/ No.: 913
Subaward No.: SUB0001109 March 19, 2020<br>
02
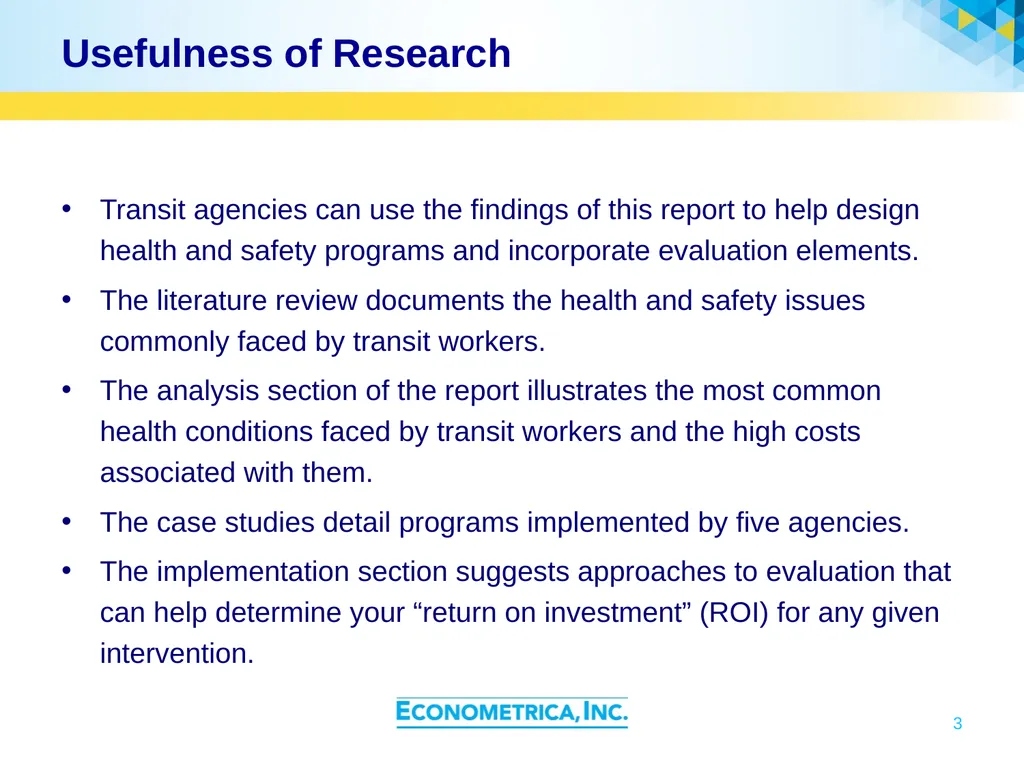
Outline of Briefing Usefulness of Research
Research Approach
Research Design and Literature Review
Prevalence and Costs of Health Conditions
Additional Costs to Individuals, Employers, and Society
Case Studies
Implementation Strategies
Key Findings 2<br>
Research Approach
Research Design and Literature Review
Prevalence and Costs of Health Conditions
Additional Costs to Individuals, Employers, and Society
Case Studies
Implementation Strategies
Key Findings 2<br>
03
Usefulness of Research Transit agencies can use the findings of this report to help design health and safety programs and incorporate evaluation elements.
The literature review documents the health and safety issues commonly faced by transit workers.
The analysis section of the report illustrates the most common health conditions faced by transit workers and the high costs associated with them.
The case studies detail programs implemented by five agencies.
The implementation section suggests approaches to evaluation that can help determine your “return on investment” (ROI) for any given intervention. 3<br>
The literature review documents the health and safety issues commonly faced by transit workers.
The analysis section of the report illustrates the most common health conditions faced by transit workers and the high costs associated with them.
The case studies detail programs implemented by five agencies.
The implementation section suggests approaches to evaluation that can help determine your “return on investment” (ROI) for any given intervention. 3<br>
04
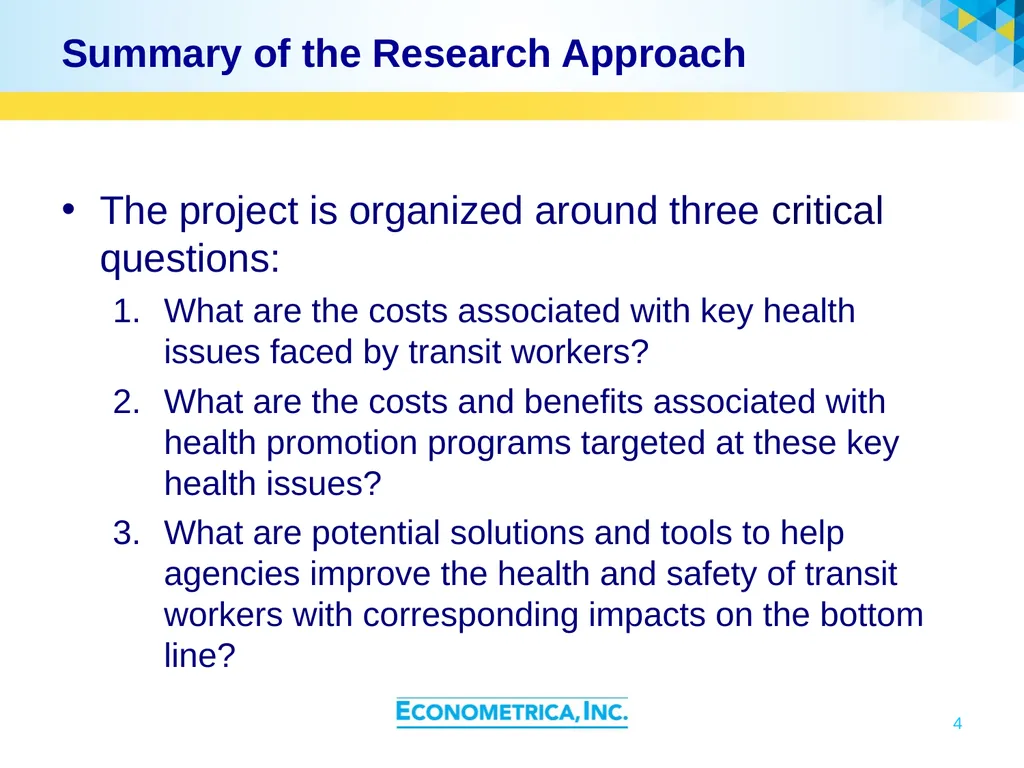
Summary of the Research Approach The project is organized around three critical questions:
What are the costs associated with key health issues faced by transit workers?
What are the costs and benefits associated with health promotion programs targeted at these key health issues?
What are potential solutions and tools to help agencies improve the health and safety of transit workers with corresponding impacts on the bottom line? 4<br>
What are the costs associated with key health issues faced by transit workers?
What are the costs and benefits associated with health promotion programs targeted at these key health issues?
What are potential solutions and tools to help agencies improve the health and safety of transit workers with corresponding impacts on the bottom line? 4<br>
05
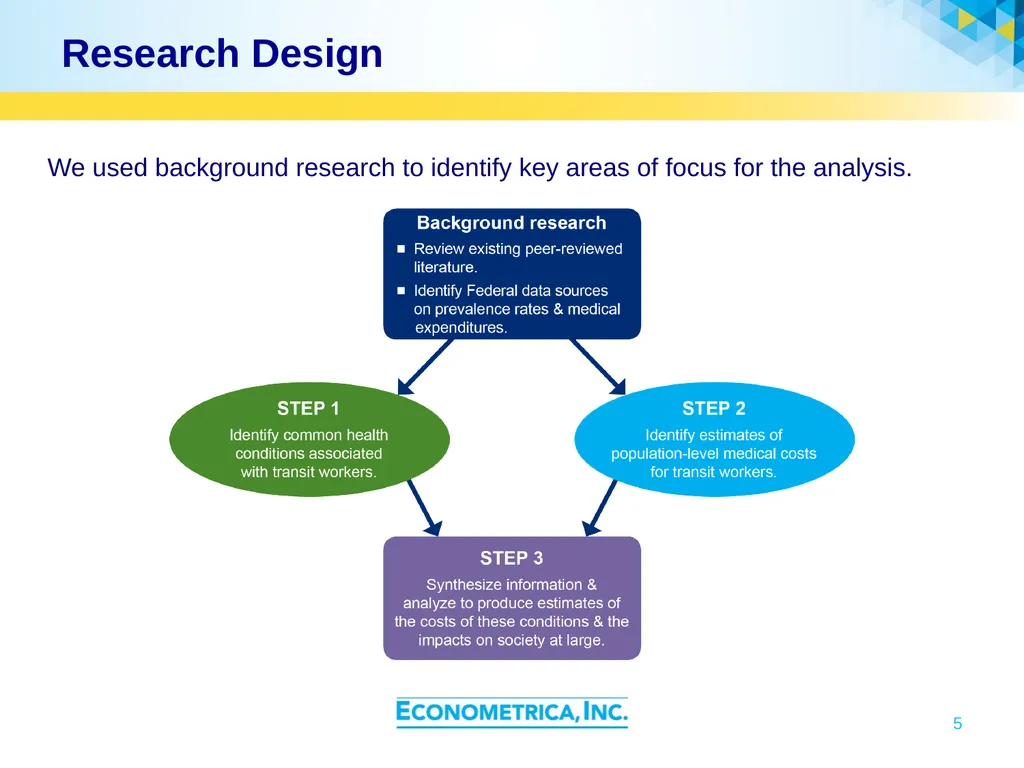
Research Design 5 We used background research to identify key areas of focus for the analysis.<br>
06
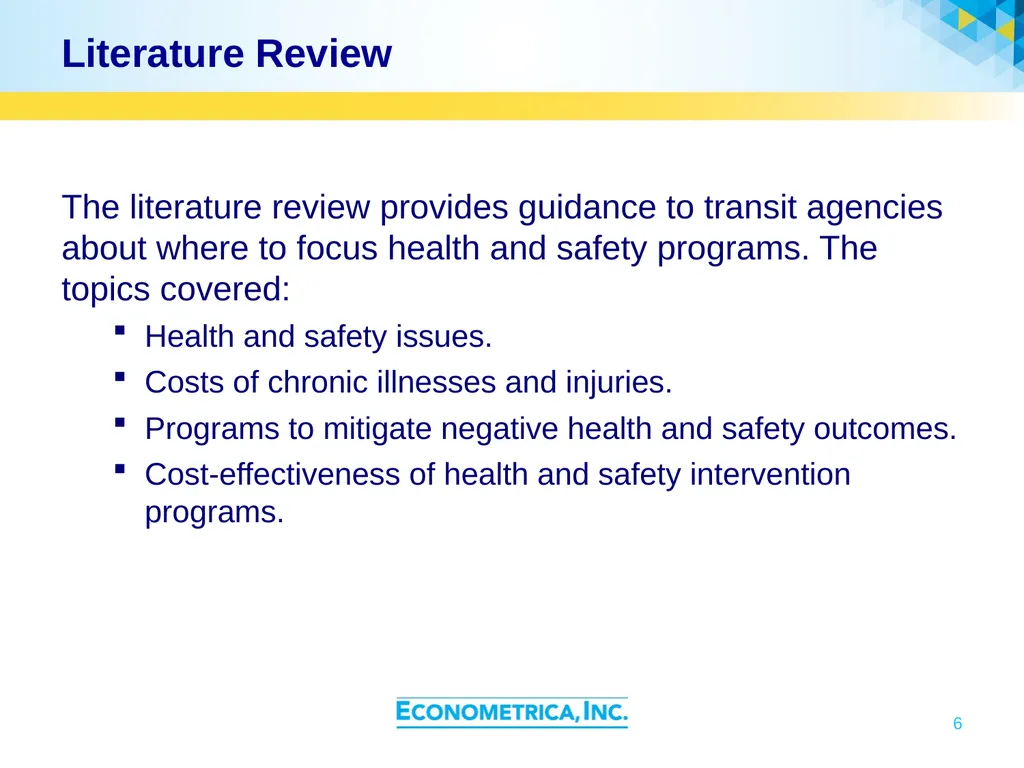
Literature Review The literature review provides guidance to transit agencies about where to focus health and safety programs. The topics covered:
Health and safety issues.
Costs of chronic illnesses and injuries.
Programs to mitigate negative health and safety outcomes.
Cost-effectiveness of health and safety intervention programs. 6<br>
Health and safety issues.
Costs of chronic illnesses and injuries.
Programs to mitigate negative health and safety outcomes.
Cost-effectiveness of health and safety intervention programs. 6<br>
07
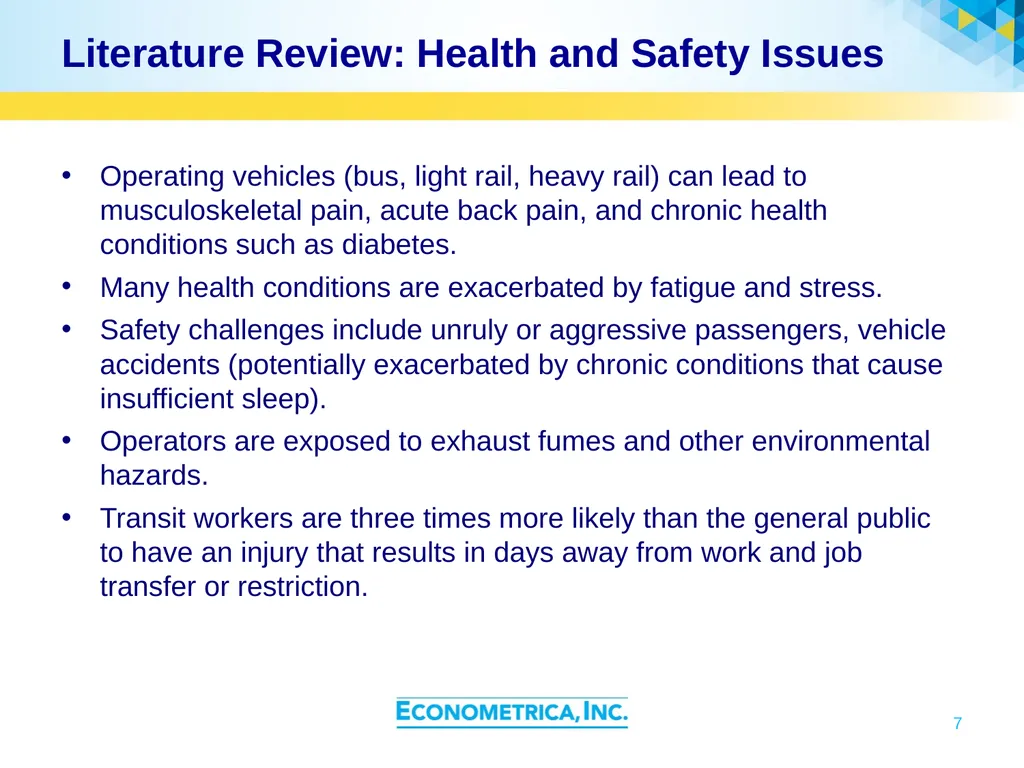
Literature Review: Health and Safety Issues Operating vehicles (bus, light rail, heavy rail) can lead to musculoskeletal pain, acute back pain, and chronic health conditions such as diabetes.
Many health conditions are exacerbated by fatigue and stress.
Safety challenges include unruly or aggressive passengers, vehicle accidents (potentially exacerbated by chronic conditions that cause insufficient sleep).
Operators are exposed to exhaust fumes and other environmental hazards.
Transit workers are three times more likely than the general public to have an injury that results in days away from work and job transfer or restriction. 7<br>
Many health conditions are exacerbated by fatigue and stress.
Safety challenges include unruly or aggressive passengers, vehicle accidents (potentially exacerbated by chronic conditions that cause insufficient sleep).
Operators are exposed to exhaust fumes and other environmental hazards.
Transit workers are three times more likely than the general public to have an injury that results in days away from work and job transfer or restriction. 7<br>
08
Literature Review: Costs of Chronic Illnesses and Injuries Transit workers have high rates of smoking and obesity, which are associated with higher medical costs.
Injuries and the development of chronic illness in transit workers can create meaningful economic losses from reduced workdays, shortened career spans, and the costs of clinical care.
Costs related to fatal occupational injuries in transit and ground transportation workers were estimated to amount to more than $200 million per year in 2006.
Transit workers suffer disproportionately from chronic illnesses such as diabetes, cancer, and hearing loss, which carry high medical and economic costs.
People with diabetes incur an estimated $7,900 per year in diabetes-related medical expenditures (American Diabetes Association, 2013).
Direct medical costs associated with cancer treatment can range from hundreds to thousands of dollars per month (Yabroff, Lund, Kepka, & Mariotto, 2011). 8<br>
Injuries and the development of chronic illness in transit workers can create meaningful economic losses from reduced workdays, shortened career spans, and the costs of clinical care.
Costs related to fatal occupational injuries in transit and ground transportation workers were estimated to amount to more than $200 million per year in 2006.
Transit workers suffer disproportionately from chronic illnesses such as diabetes, cancer, and hearing loss, which carry high medical and economic costs.
People with diabetes incur an estimated $7,900 per year in diabetes-related medical expenditures (American Diabetes Association, 2013).
Direct medical costs associated with cancer treatment can range from hundreds to thousands of dollars per month (Yabroff, Lund, Kepka, & Mariotto, 2011). 8<br>
09
Literature Review: Programs to Mitigate Negative Health and Safety Outcomes Many agencies use competition to incentivize improvements in fitness and nutrition. This strategy has become popular in the corporate world because of its relatively low cost and built-in incentive structure.
Incentives combined with supportive practices (e.g., increasing access to care, thorough screenings, onsite treatment, assistance with early risk identification) can lead to longer-term benefits.
Programs or practices that promote a culture of safety can mitigate risks that transit workers face, including aggressive passengers and road accidents. 9<br>
Incentives combined with supportive practices (e.g., increasing access to care, thorough screenings, onsite treatment, assistance with early risk identification) can lead to longer-term benefits.
Programs or practices that promote a culture of safety can mitigate risks that transit workers face, including aggressive passengers and road accidents. 9<br>
10
Literature Review: Cost-Effectiveness of Health and Safety Intervention Programs There are relatively few studies that measure the indirect costs of occupational health injuries for transit workers and very little data that provide evidence for the effectiveness of wellness intervention programs for the transit worker population.
We found one case with a twofold return on investment and health intervention program for truck drivers that resulted in increased retention.
Overall, the literature is largely inconclusive on the effectiveness of wellness programs to reduce costs in general and specifically for transit agencies.
Most programs are not well supported, funded, or targeted to the unique challenges transit workers face. 10<br>
We found one case with a twofold return on investment and health intervention program for truck drivers that resulted in increased retention.
Overall, the literature is largely inconclusive on the effectiveness of wellness programs to reduce costs in general and specifically for transit agencies.
Most programs are not well supported, funded, or targeted to the unique challenges transit workers face. 10<br>
11
Demographic Characteristics Most transit workers are involved in vehicle operations (72 percent).
Of these, more than 50 percent are bus operators.
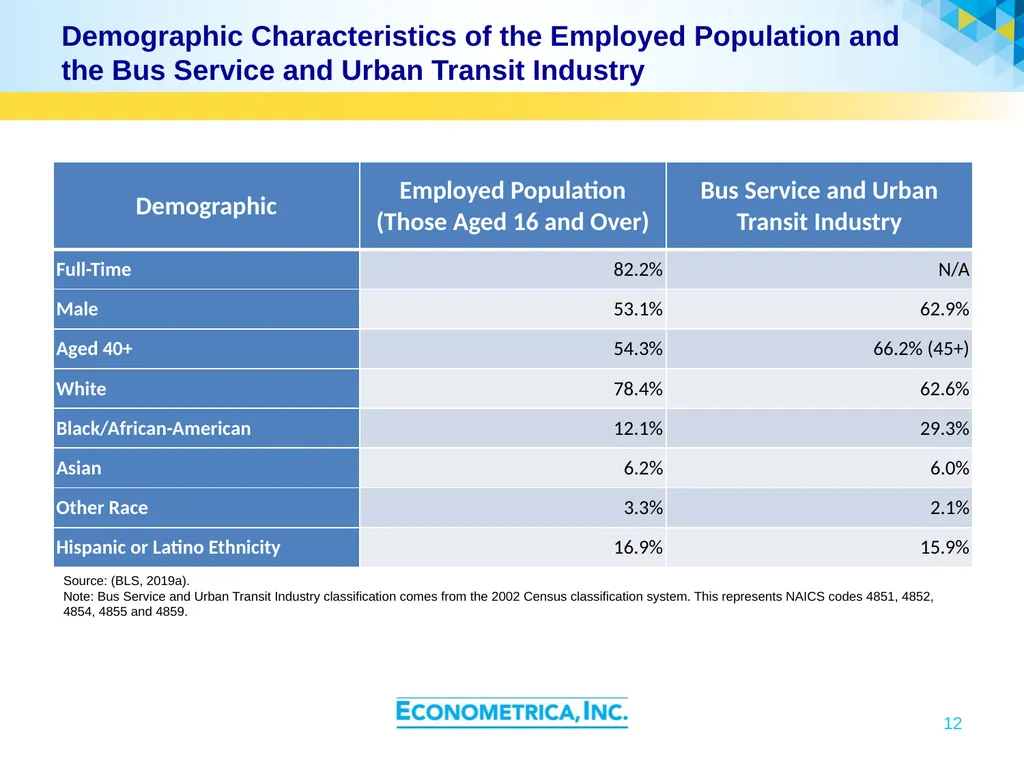
Most are male (63 percent), over 45 years of age (66 percent), and White (63 percent).
There are disproportionately more Black transit workers (29 percent) than in the general workforce (12 percent).
Women are underrepresented at 37 percent of the transit industry, compared to 47 percent of the overall workforce. 11<br>
Of these, more than 50 percent are bus operators.
Most are male (63 percent), over 45 years of age (66 percent), and White (63 percent).
There are disproportionately more Black transit workers (29 percent) than in the general workforce (12 percent).
Women are underrepresented at 37 percent of the transit industry, compared to 47 percent of the overall workforce. 11<br>
12
Demographic Characteristics of the Employed Population and the Bus Service and Urban Transit Industry 12 Source: (BLS, 2019a).
Note: Bus Service and Urban Transit Industry classification comes from the 2002 Census classification system. This represents NAICS codes 4851, 4852, 4854, 4855 and 4859.<br>
Note: Bus Service and Urban Transit Industry classification comes from the 2002 Census classification system. This represents NAICS codes 4851, 4852, 4854, 4855 and 4859.<br>
13
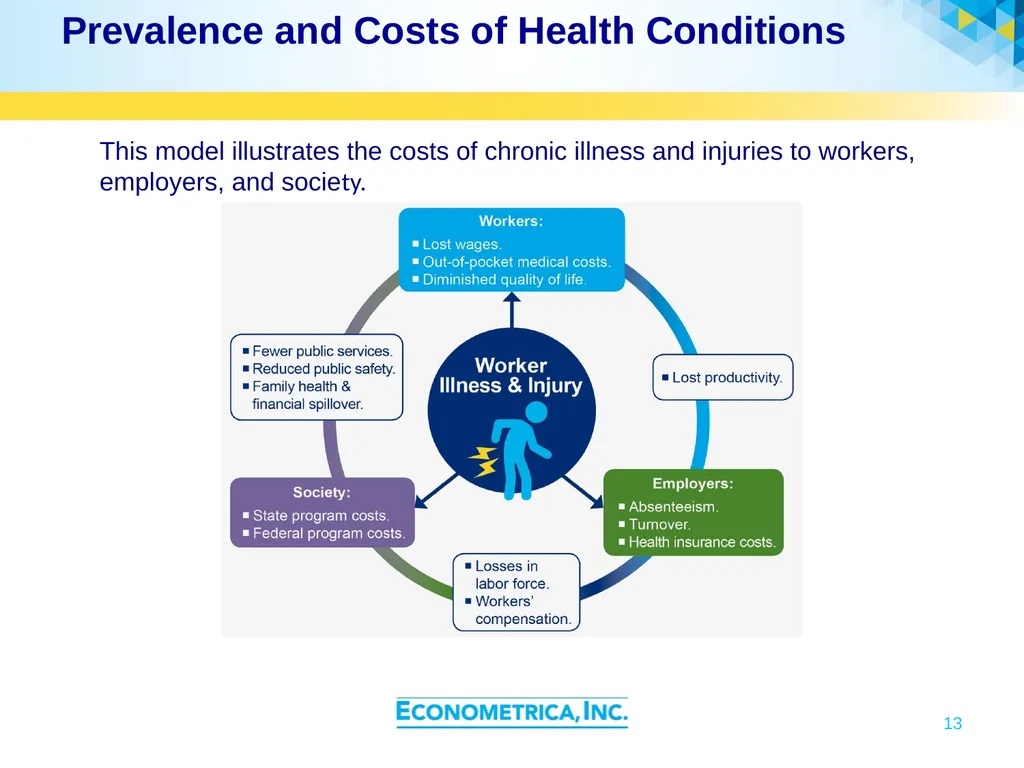
Prevalence and Costs of Health Conditions 13 This model illustrates the costs of chronic illness and injuries to workers, employers, and society.<br>
14
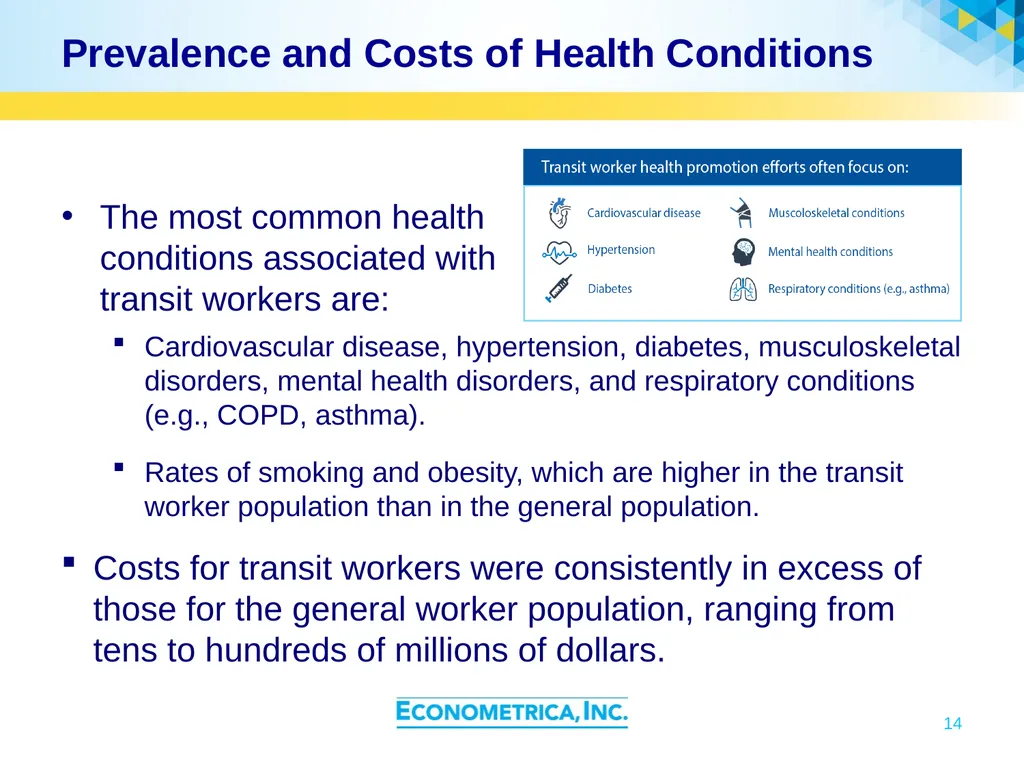
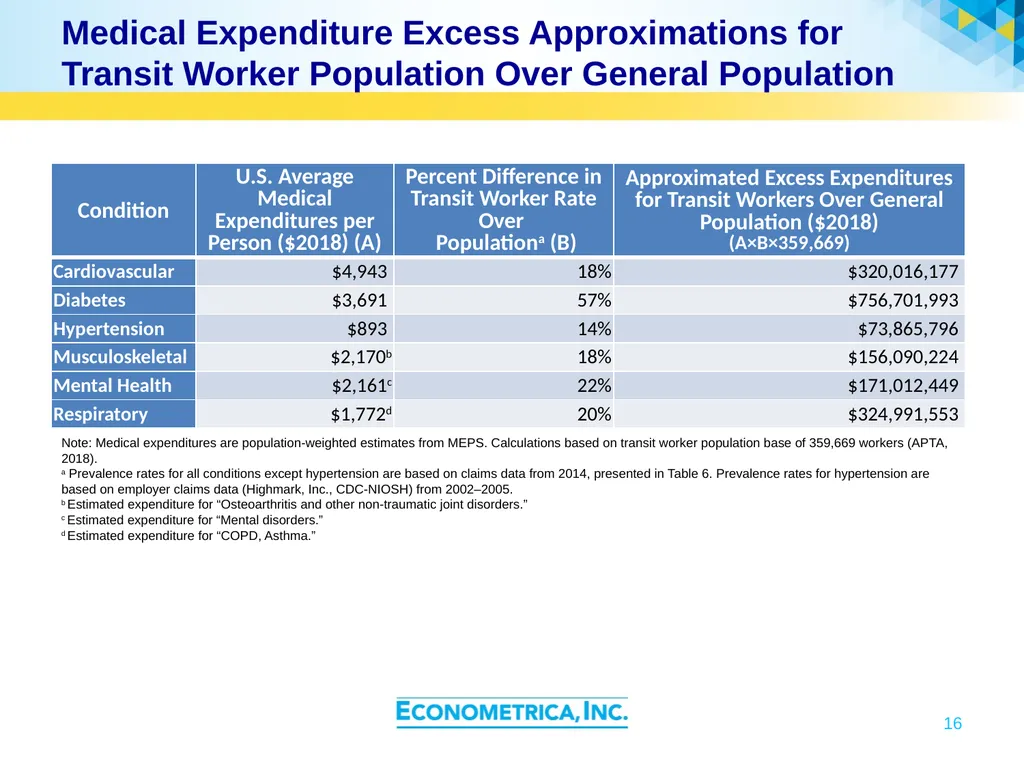
Prevalence and Costs of Health Conditions The most common health conditions associated with transit workers are: 14 Cardiovascular disease, hypertension, diabetes, musculoskeletal disorders, mental health disorders, and respiratory conditions (e.g., COPD, asthma).
Rates of smoking and obesity, which are higher in the transit worker population than in the general population.
Costs for transit workers were consistently in excess of those for the general worker population, ranging from tens to hundreds of millions of dollars.<br>
Rates of smoking and obesity, which are higher in the transit worker population than in the general population.
Costs for transit workers were consistently in excess of those for the general worker population, ranging from tens to hundreds of millions of dollars.<br>
15
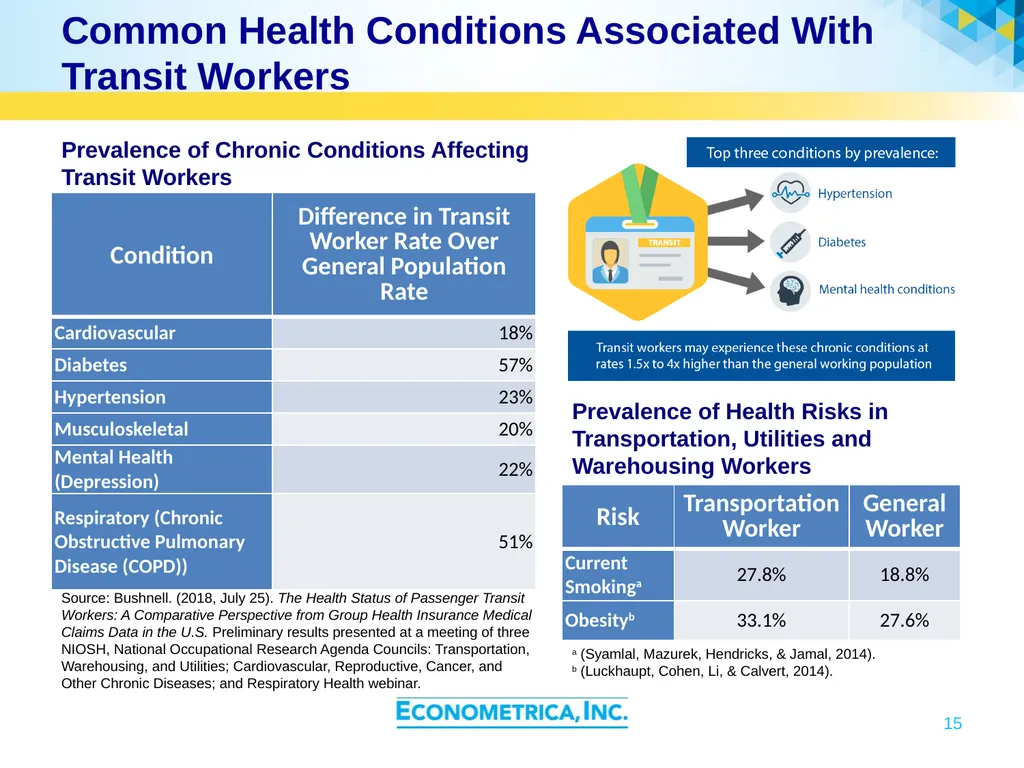
Common Health Conditions Associated With Transit Workers 15 Prevalence of Chronic Conditions Affecting Transit Workers Source: Bushnell. (2018, July 25). The Health Status of Passenger Transit Workers: A Comparative Perspective from Group Health Insurance Medical Claims Data in the U.S. Preliminary results presented at a meeting of three NIOSH, National Occupational Research Agenda Councils: Transportation, Warehousing, and Utilities; Cardiovascular, Reproductive, Cancer, and Other Chronic Diseases; and Respiratory Health webinar. a (Syamlal, Mazurek, Hendricks, & Jamal, 2014).
b (Luckhaupt, Cohen, Li, & Calvert, 2014). Prevalence of Health Risks in Transportation, Utilities and Warehousing Workers<br>
b (Luckhaupt, Cohen, Li, & Calvert, 2014). Prevalence of Health Risks in Transportation, Utilities and Warehousing Workers<br>
16
Medical Expenditure Excess Approximations for Transit Worker Population Over General Population 16 Note: Medical expenditures are population-weighted estimates from MEPS. Calculations based on transit worker population base of 359,669 workers (APTA, 2018).
a Prevalence rates for all conditions except hypertension are based on claims data from 2014, presented in Table 6. Prevalence rates for hypertension are based on employer claims data (Highmark, Inc., CDC-NIOSH) from 2002–2005.
b Estimated expenditure for “Osteoarthritis and other non-traumatic joint disorders.”
c Estimated expenditure for “Mental disorders.”
d Estimated expenditure for “COPD, Asthma.”<br>
a Prevalence rates for all conditions except hypertension are based on claims data from 2014, presented in Table 6. Prevalence rates for hypertension are based on employer claims data (Highmark, Inc., CDC-NIOSH) from 2002–2005.
b Estimated expenditure for “Osteoarthritis and other non-traumatic joint disorders.”
c Estimated expenditure for “Mental disorders.”
d Estimated expenditure for “COPD, Asthma.”<br>
17
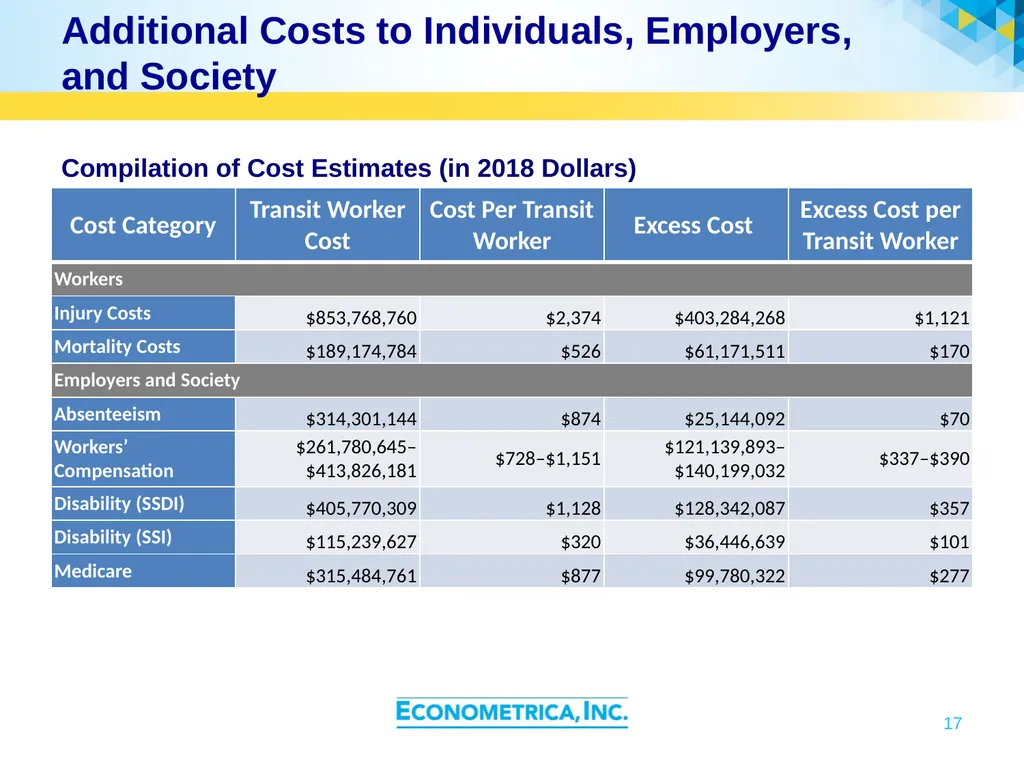
Additional Costs to Individuals, Employers, and Society 17 Compilation of Cost Estimates (in 2018 Dollars)<br>
18
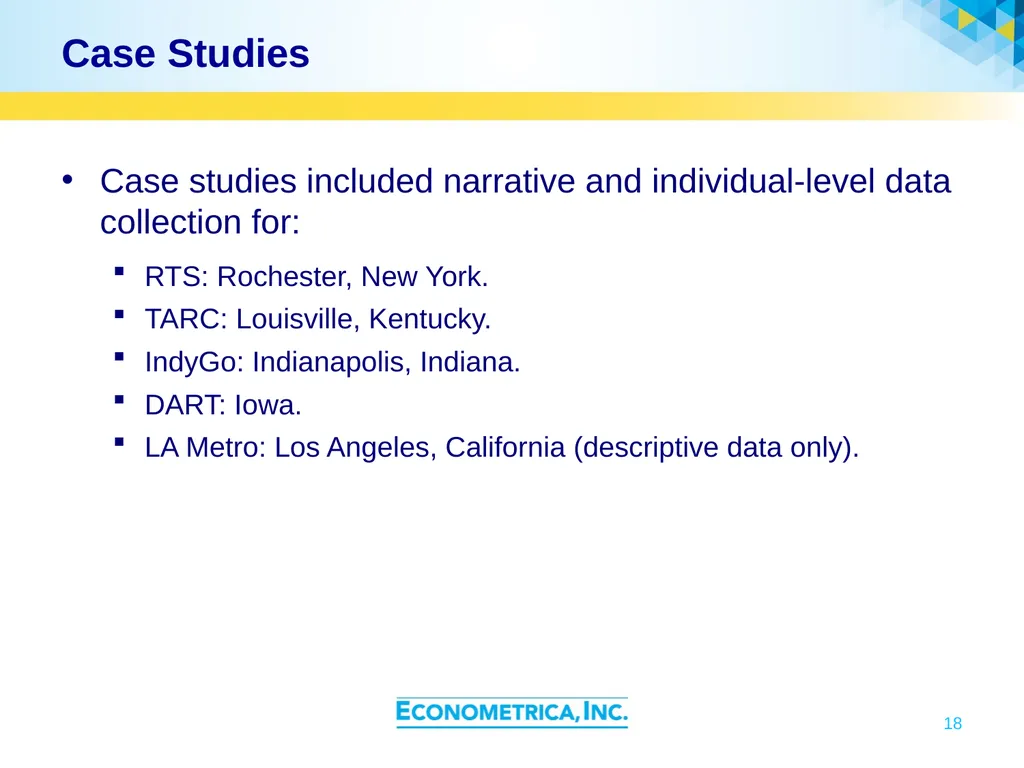
Case Studies Case studies included narrative and individual-level data collection for:
RTS: Rochester, New York.
TARC: Louisville, Kentucky.
IndyGo: Indianapolis, Indiana.
DART: Iowa.
LA Metro: Los Angeles, California (descriptive data only). 18<br>
RTS: Rochester, New York.
TARC: Louisville, Kentucky.
IndyGo: Indianapolis, Indiana.
DART: Iowa.
LA Metro: Los Angeles, California (descriptive data only). 18<br>
19
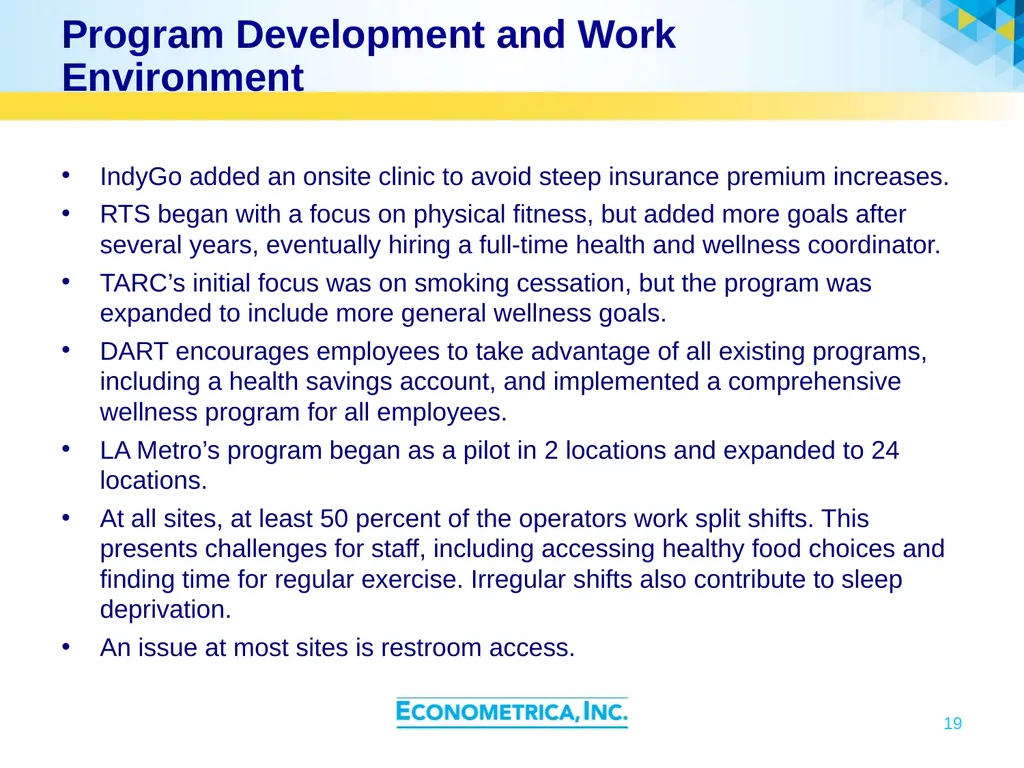
Program Development and Work Environment IndyGo added an onsite clinic to avoid steep insurance premium increases.
RTS began with a focus on physical fitness, but added more goals after several years, eventually hiring a full-time health and wellness coordinator.
TARC’s initial focus was on smoking cessation, but the program was expanded to include more general wellness goals.
DART encourages employees to take advantage of all existing programs, including a health savings account, and implemented a comprehensive wellness program for all employees.
LA Metro’s program began as a pilot in 2 locations and expanded to 24 locations.
At all sites, at least 50 percent of the operators work split shifts. This presents challenges for staff, including accessing healthy food choices and finding time for regular exercise. Irregular shifts also contribute to sleep deprivation.
An issue at most sites is restroom access. 19<br>
RTS began with a focus on physical fitness, but added more goals after several years, eventually hiring a full-time health and wellness coordinator.
TARC’s initial focus was on smoking cessation, but the program was expanded to include more general wellness goals.
DART encourages employees to take advantage of all existing programs, including a health savings account, and implemented a comprehensive wellness program for all employees.
LA Metro’s program began as a pilot in 2 locations and expanded to 24 locations.
At all sites, at least 50 percent of the operators work split shifts. This presents challenges for staff, including accessing healthy food choices and finding time for regular exercise. Irregular shifts also contribute to sleep deprivation.
An issue at most sites is restroom access. 19<br>
20
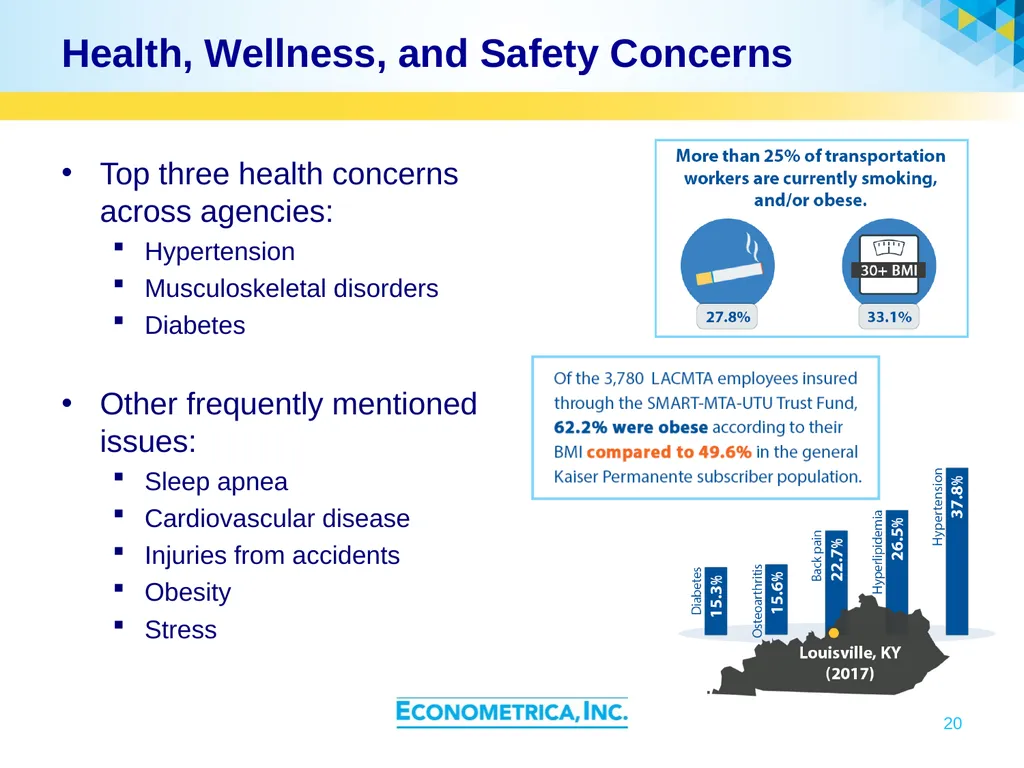
Health, Wellness, and Safety Concerns Top three health concerns across agencies:
Hypertension
Musculoskeletal disorders
Diabetes
Other frequently mentioned issues:
Sleep apnea
Cardiovascular disease
Injuries from accidents
Obesity
Stress 20<br>
Hypertension
Musculoskeletal disorders
Diabetes
Other frequently mentioned issues:
Sleep apnea
Cardiovascular disease
Injuries from accidents
Obesity
Stress 20<br>
21
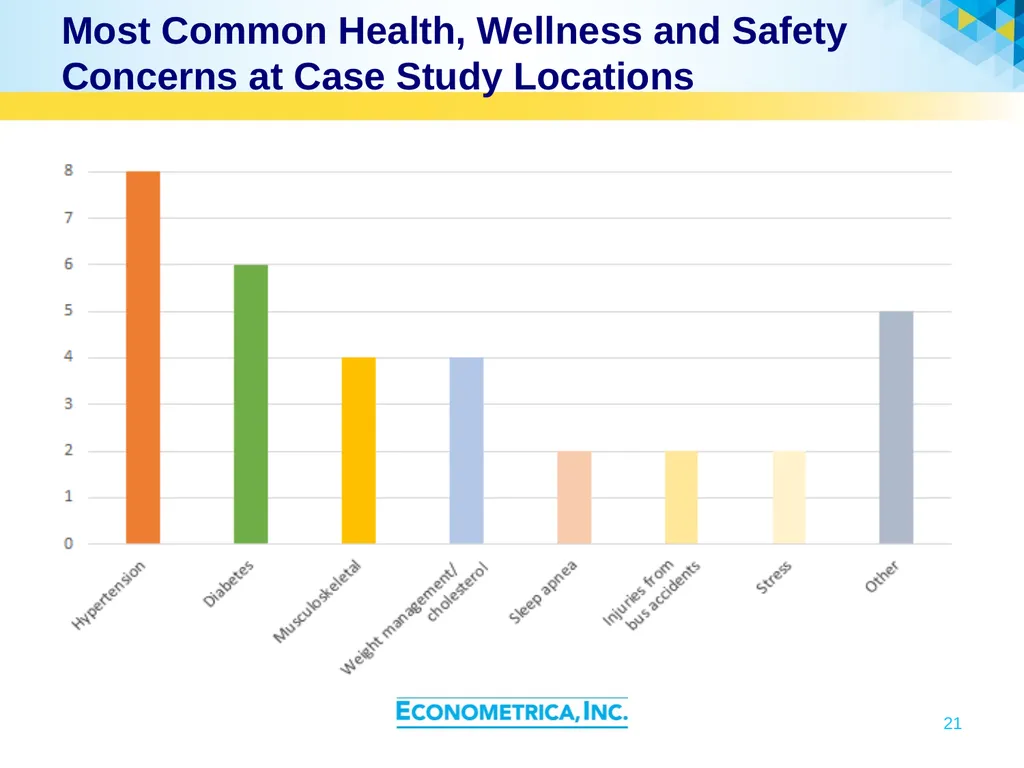
Most Common Health, Wellness and Safety Concerns at Case Study Locations 21<br>
22
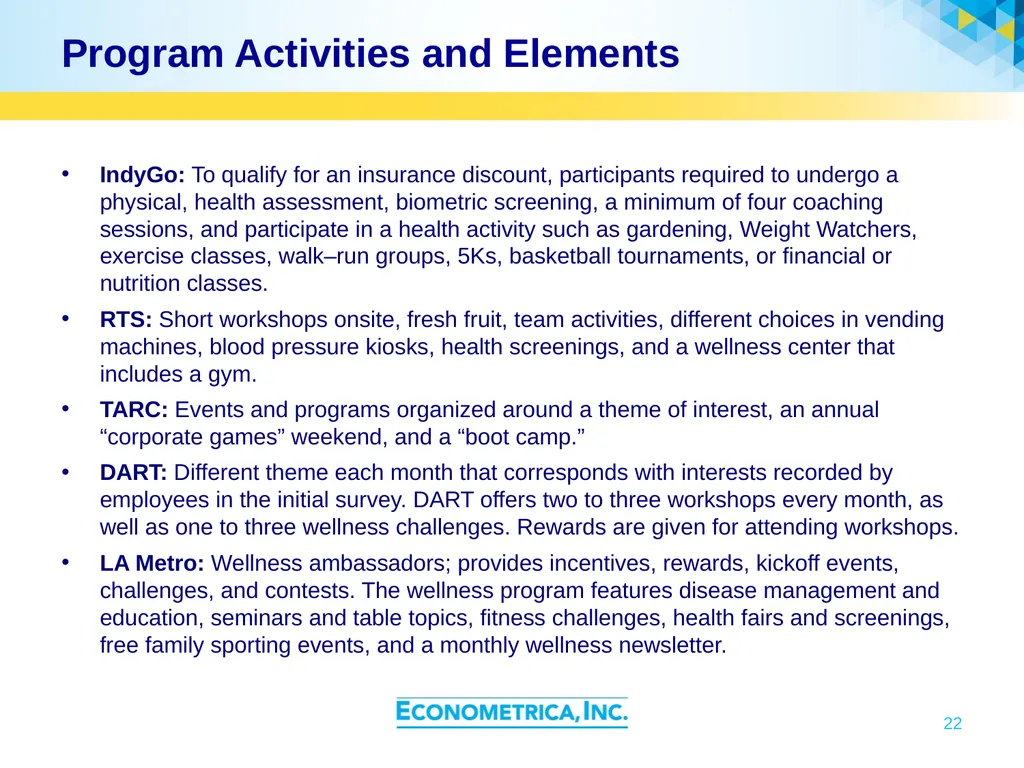
Program Activities and Elements IndyGo: To qualify for an insurance discount, participants required to undergo a physical, health assessment, biometric screening, a minimum of four coaching sessions, and participate in a health activity such as gardening, Weight Watchers, exercise classes, walk–run groups, 5Ks, basketball tournaments, or financial or nutrition classes.
RTS: Short workshops onsite, fresh fruit, team activities, different choices in vending machines, blood pressure kiosks, health screenings, and a wellness center that includes a gym.
TARC: Events and programs organized around a theme of interest, an annual “corporate games” weekend, and a “boot camp.”
DART: Different theme each month that corresponds with interests recorded by employees in the initial survey. DART offers two to three workshops every month, as well as one to three wellness challenges. Rewards are given for attending workshops.
LA Metro: Wellness ambassadors; provides incentives, rewards, kickoff events, challenges, and contests. The wellness program features disease management and education, seminars and table topics, fitness challenges, health fairs and screenings, free family sporting events, and a monthly wellness newsletter. 22<br>
RTS: Short workshops onsite, fresh fruit, team activities, different choices in vending machines, blood pressure kiosks, health screenings, and a wellness center that includes a gym.
TARC: Events and programs organized around a theme of interest, an annual “corporate games” weekend, and a “boot camp.”
DART: Different theme each month that corresponds with interests recorded by employees in the initial survey. DART offers two to three workshops every month, as well as one to three wellness challenges. Rewards are given for attending workshops.
LA Metro: Wellness ambassadors; provides incentives, rewards, kickoff events, challenges, and contests. The wellness program features disease management and education, seminars and table topics, fitness challenges, health fairs and screenings, free family sporting events, and a monthly wellness newsletter. 22<br>
23
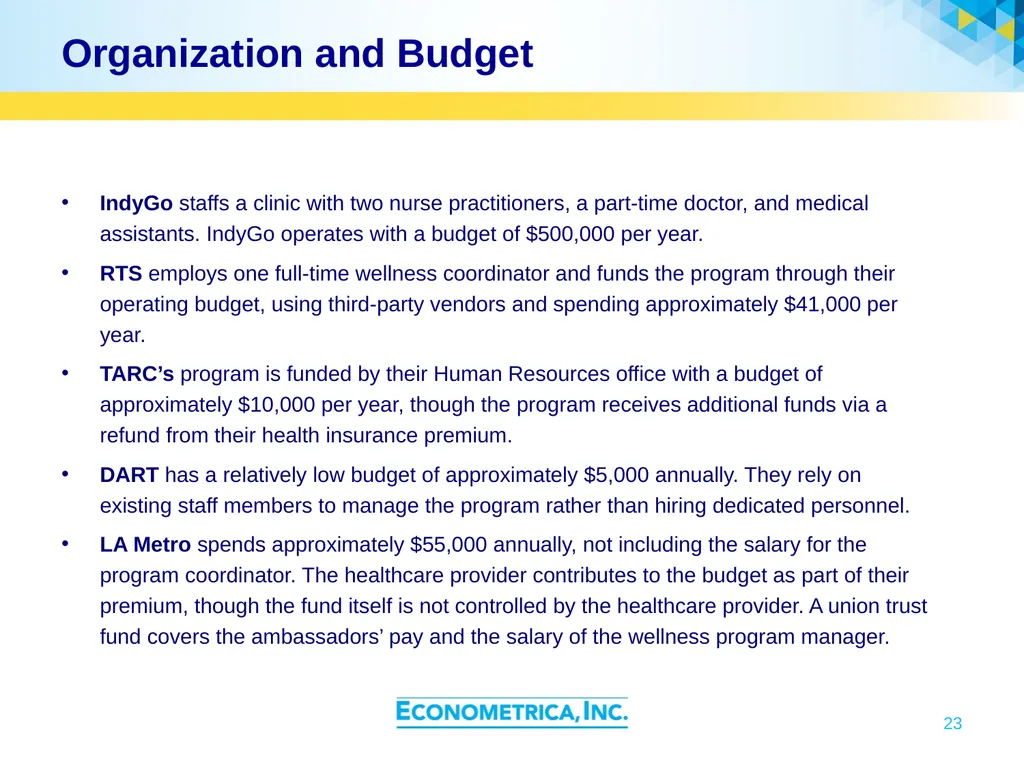
Organization and Budget IndyGo staffs a clinic with two nurse practitioners, a part-time doctor, and medical assistants. IndyGo operates with a budget of $500,000 per year.
RTS employs one full-time wellness coordinator and funds the program through their operating budget, using third-party vendors and spending approximately $41,000 per year.
TARC’s program is funded by their Human Resources office with a budget of approximately $10,000 per year, though the program receives additional funds via a refund from their health insurance premium.
DART has a relatively low budget of approximately $5,000 annually. They rely on existing staff members to manage the program rather than hiring dedicated personnel.
LA Metro spends approximately $55,000 annually, not including the salary for the program coordinator. The healthcare provider contributes to the budget as part of their premium, though the fund itself is not controlled by the healthcare provider. A union trust fund covers the ambassadors’ pay and the salary of the wellness program manager. 23<br>
RTS employs one full-time wellness coordinator and funds the program through their operating budget, using third-party vendors and spending approximately $41,000 per year.
TARC’s program is funded by their Human Resources office with a budget of approximately $10,000 per year, though the program receives additional funds via a refund from their health insurance premium.
DART has a relatively low budget of approximately $5,000 annually. They rely on existing staff members to manage the program rather than hiring dedicated personnel.
LA Metro spends approximately $55,000 annually, not including the salary for the program coordinator. The healthcare provider contributes to the budget as part of their premium, though the fund itself is not controlled by the healthcare provider. A union trust fund covers the ambassadors’ pay and the salary of the wellness program manager. 23<br>
24
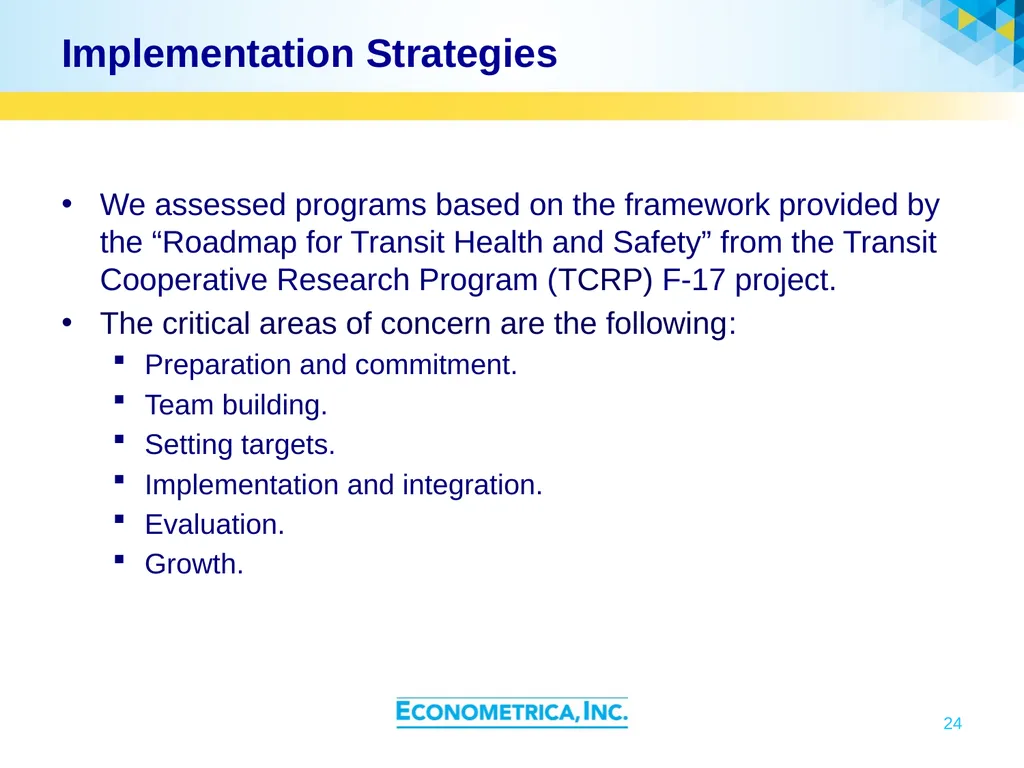
Implementation Strategies We assessed programs based on the framework provided by the “Roadmap for Transit Health and Safety” from the Transit Cooperative Research Program (TCRP) F-17 project.
The critical areas of concern are the following:
Preparation and commitment.
Team building.
Setting targets.
Implementation and integration.
Evaluation.
Growth. 24<br>
The critical areas of concern are the following:
Preparation and commitment.
Team building.
Setting targets.
Implementation and integration.
Evaluation.
Growth. 24<br>
25
Implementation Keys Faced with skyrocketing health premium costs, some transit organizations involved stakeholders from all levels of the organization and partners from outside to tackle the issue.
They paid attention to the underlying causes of the health premium increases: health conditions and health risks and environmental factors. These organizations tried to design programs that would address these causes.
Programs that have strong management and union support, provide strong incentives for employees to participate, and receive the most funding have the longest standing and most positive implementation outcomes.
Analysis did not demonstrate strong statistical findings on the benefit–cost of transit workplace health promotion programs, however.
Organizations and employees recognized tangible and intangible benefits of these programs, regardless of the lack of statistical findings. 25<br>
They paid attention to the underlying causes of the health premium increases: health conditions and health risks and environmental factors. These organizations tried to design programs that would address these causes.
Programs that have strong management and union support, provide strong incentives for employees to participate, and receive the most funding have the longest standing and most positive implementation outcomes.
Analysis did not demonstrate strong statistical findings on the benefit–cost of transit workplace health promotion programs, however.
Organizations and employees recognized tangible and intangible benefits of these programs, regardless of the lack of statistical findings. 25<br>
26
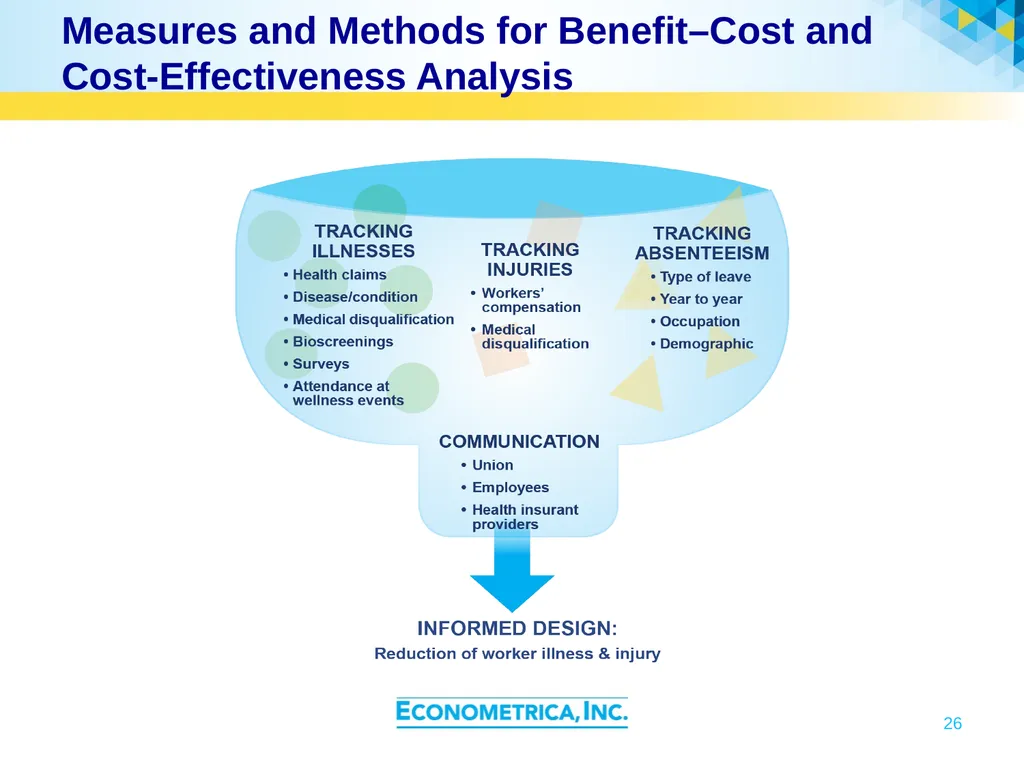
Measures and Methods for Benefit–Cost and Cost-Effectiveness Analysis 26<br>
27
Implementation Planning Review the background research on the types of health issues workers are most likely to experience and the programs that are most effective in addressing them.
Critical steps to take prior to initiation regarding program implementation and evaluation are determining the key issues facing employees, the types of programs they would use, and a means of evaluating impacts.
Over time, assess the programs’ ROI and adjust as needed.
Prior TCRP publications include resources to help design and track programs. For example, you can use the spreadsheet “Transit Operator Workplace Health Protection and Promotion Planning, Evaluation, and ROI Template,” available at http://www.trb.org/Publications/Blurbs/171189.aspx. 27<br>
Critical steps to take prior to initiation regarding program implementation and evaluation are determining the key issues facing employees, the types of programs they would use, and a means of evaluating impacts.
Over time, assess the programs’ ROI and adjust as needed.
Prior TCRP publications include resources to help design and track programs. For example, you can use the spreadsheet “Transit Operator Workplace Health Protection and Promotion Planning, Evaluation, and ROI Template,” available at http://www.trb.org/Publications/Blurbs/171189.aspx. 27<br>
28
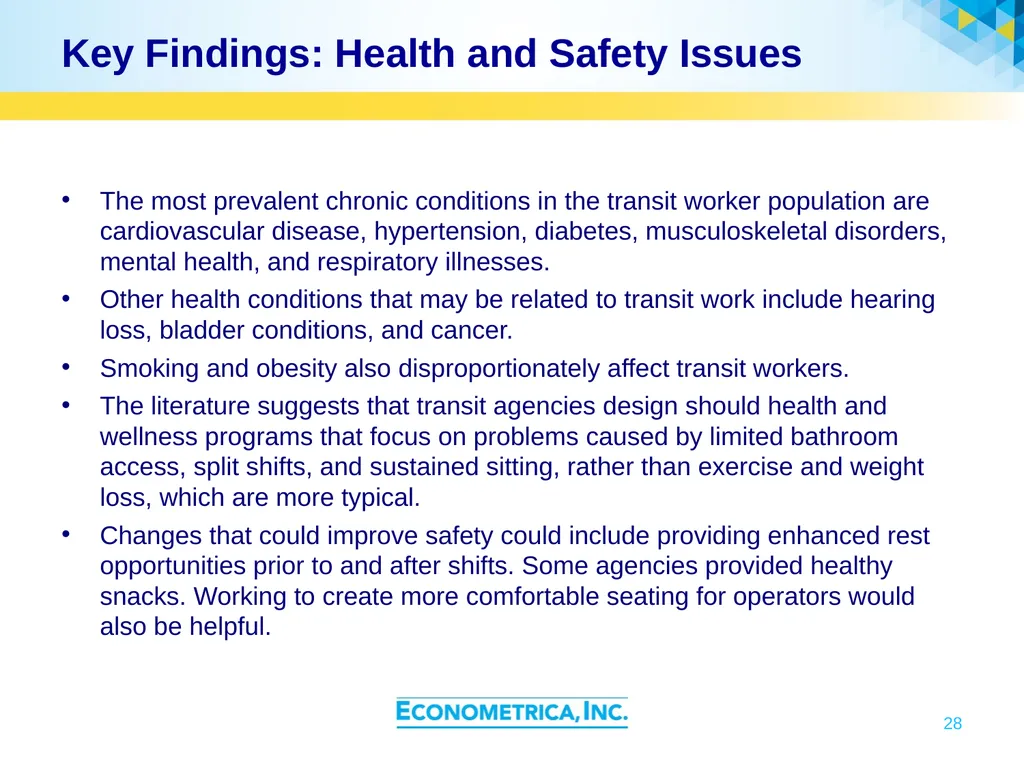
Key Findings: Health and Safety Issues The most prevalent chronic conditions in the transit worker population are cardiovascular disease, hypertension, diabetes, musculoskeletal disorders, mental health, and respiratory illnesses.
Other health conditions that may be related to transit work include hearing loss, bladder conditions, and cancer.
Smoking and obesity also disproportionately affect transit workers.
The literature suggests that transit agencies design should health and wellness programs that focus on problems caused by limited bathroom access, split shifts, and sustained sitting, rather than exercise and weight loss, which are more typical.
Changes that could improve safety could include providing enhanced rest opportunities prior to and after shifts. Some agencies provided healthy snacks. Working to create more comfortable seating for operators would also be helpful. 28<br>
Other health conditions that may be related to transit work include hearing loss, bladder conditions, and cancer.
Smoking and obesity also disproportionately affect transit workers.
The literature suggests that transit agencies design should health and wellness programs that focus on problems caused by limited bathroom access, split shifts, and sustained sitting, rather than exercise and weight loss, which are more typical.
Changes that could improve safety could include providing enhanced rest opportunities prior to and after shifts. Some agencies provided healthy snacks. Working to create more comfortable seating for operators would also be helpful. 28<br>
29
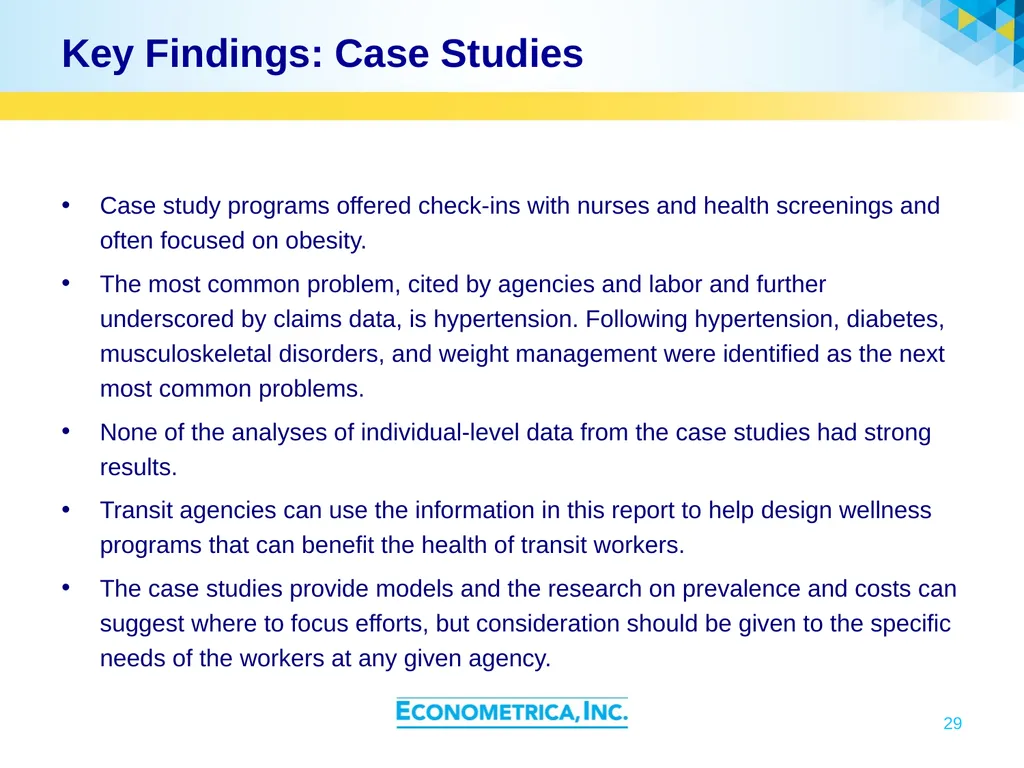
Key Findings: Case Studies Case study programs offered check-ins with nurses and health screenings and often focused on obesity.
The most common problem, cited by agencies and labor and further underscored by claims data, is hypertension. Following hypertension, diabetes, musculoskeletal disorders, and weight management were identified as the next most common problems.
None of the analyses of individual-level data from the case studies had strong results.
Transit agencies can use the information in this report to help design wellness programs that can benefit the health of transit workers.
The case studies provide models and the research on prevalence and costs can suggest where to focus efforts, but consideration should be given to the specific needs of the workers at any given agency. 29<br>
The most common problem, cited by agencies and labor and further underscored by claims data, is hypertension. Following hypertension, diabetes, musculoskeletal disorders, and weight management were identified as the next most common problems.
None of the analyses of individual-level data from the case studies had strong results.
Transit agencies can use the information in this report to help design wellness programs that can benefit the health of transit workers.
The case studies provide models and the research on prevalence and costs can suggest where to focus efforts, but consideration should be given to the specific needs of the workers at any given agency. 29<br>
30
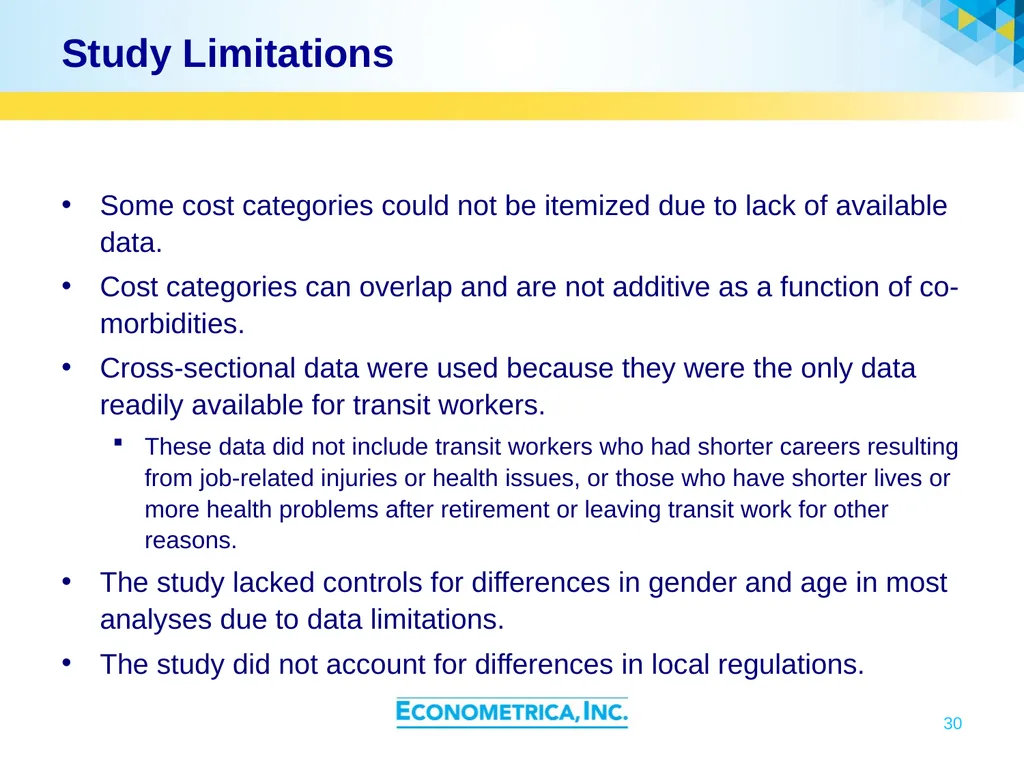
Study Limitations Some cost categories could not be itemized due to lack of available data.
Cost categories can overlap and are not additive as a function of co-morbidities.
Cross-sectional data were used because they were the only data readily available for transit workers.
These data did not include transit workers who had shorter careers resulting from job-related injuries or health issues, or those who have shorter lives or more health problems after retirement or leaving transit work for other reasons.
The study lacked controls for differences in gender and age in most analyses due to data limitations.
The study did not account for differences in local regulations. 30<br>
Cost categories can overlap and are not additive as a function of co-morbidities.
Cross-sectional data were used because they were the only data readily available for transit workers.
These data did not include transit workers who had shorter careers resulting from job-related injuries or health issues, or those who have shorter lives or more health problems after retirement or leaving transit work for other reasons.
The study lacked controls for differences in gender and age in most analyses due to data limitations.
The study did not account for differences in local regulations. 30<br>
31
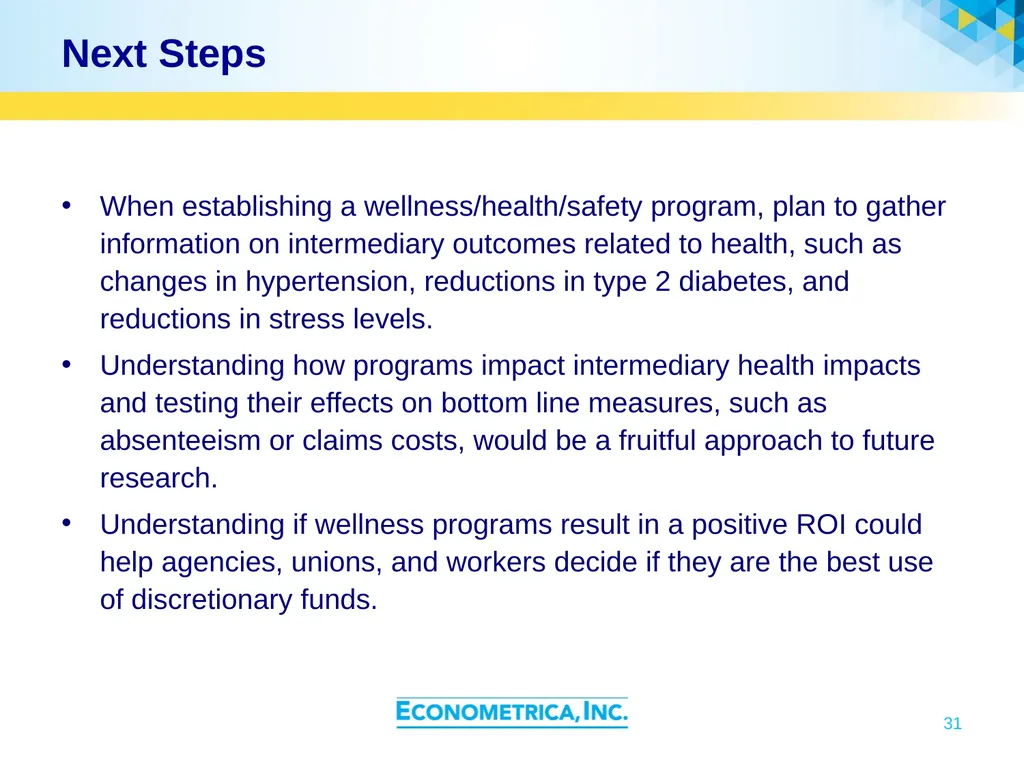
Next Steps When establishing a wellness/health/safety program, plan to gather information on intermediary outcomes related to health, such as changes in hypertension, reductions in type 2 diabetes, and reductions in stress levels.
Understanding how programs impact intermediary health impacts and testing their effects on bottom line measures, such as absenteeism or claims costs, would be a fruitful approach to future research.
Understanding if wellness programs result in a positive ROI could help agencies, unions, and workers decide if they are the best use of discretionary funds. 31<br>
Understanding how programs impact intermediary health impacts and testing their effects on bottom line measures, such as absenteeism or claims costs, would be a fruitful approach to future research.
Understanding if wellness programs result in a positive ROI could help agencies, unions, and workers decide if they are the best use of discretionary funds. 31<br>
32
32 Thank You!<br>
33
Following slides may be deleted Saved these in case we decide to keep them. 33<br>
34
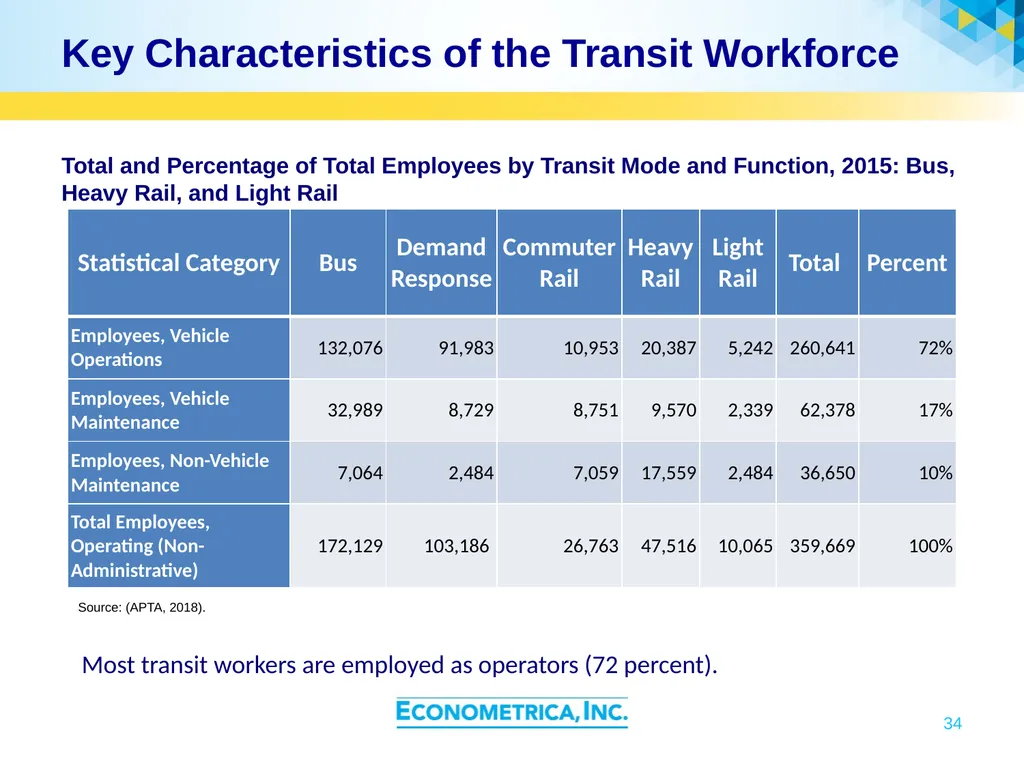
Key Characteristics of the Transit Workforce Total and Percentage of Total Employees by Transit Mode and Function, 2015: Bus, Heavy Rail, and Light Rail 34 Source: (APTA, 2018). Most transit workers are employed as operators (72 percent).<br>
35
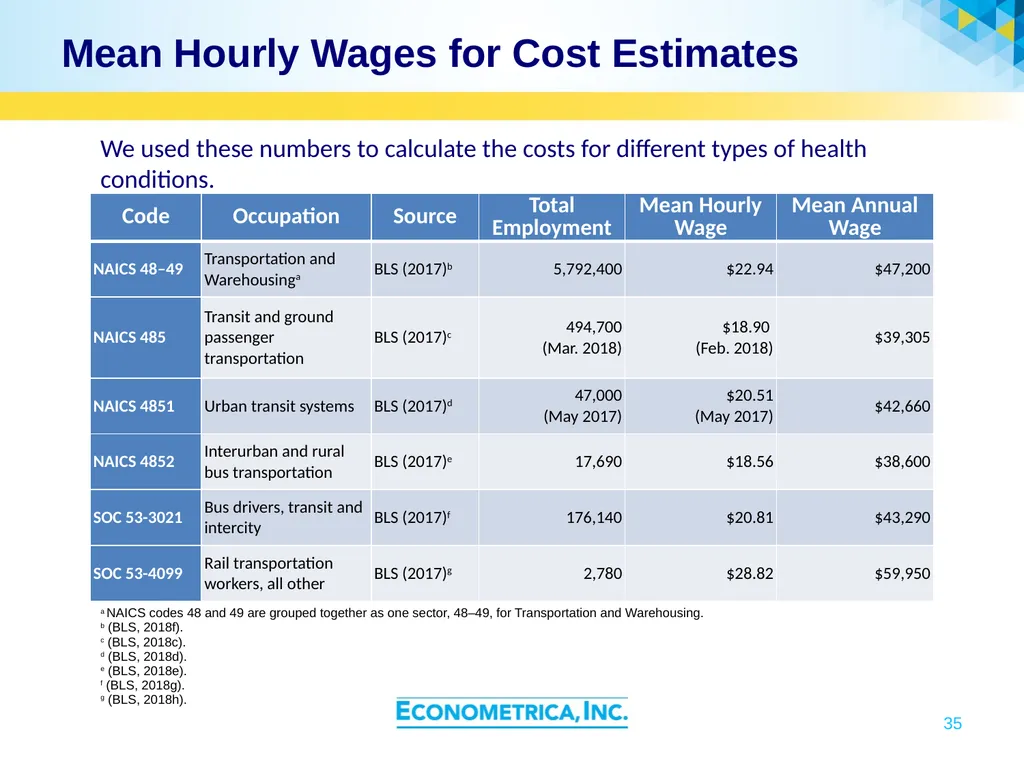
Mean Hourly Wages for Cost Estimates 35 a NAICS codes 48 and 49 are grouped together as one sector, 48–49, for Transportation and Warehousing.
b (BLS, 2018f).
c (BLS, 2018c).
d (BLS, 2018d).
e (BLS, 2018e).
f (BLS, 2018g).
g (BLS, 2018h). We used these numbers to calculate the costs for different types of health conditions.<br>
b (BLS, 2018f).
c (BLS, 2018c).
d (BLS, 2018d).
e (BLS, 2018e).
f (BLS, 2018g).
g (BLS, 2018h). We used these numbers to calculate the costs for different types of health conditions.<br>
36
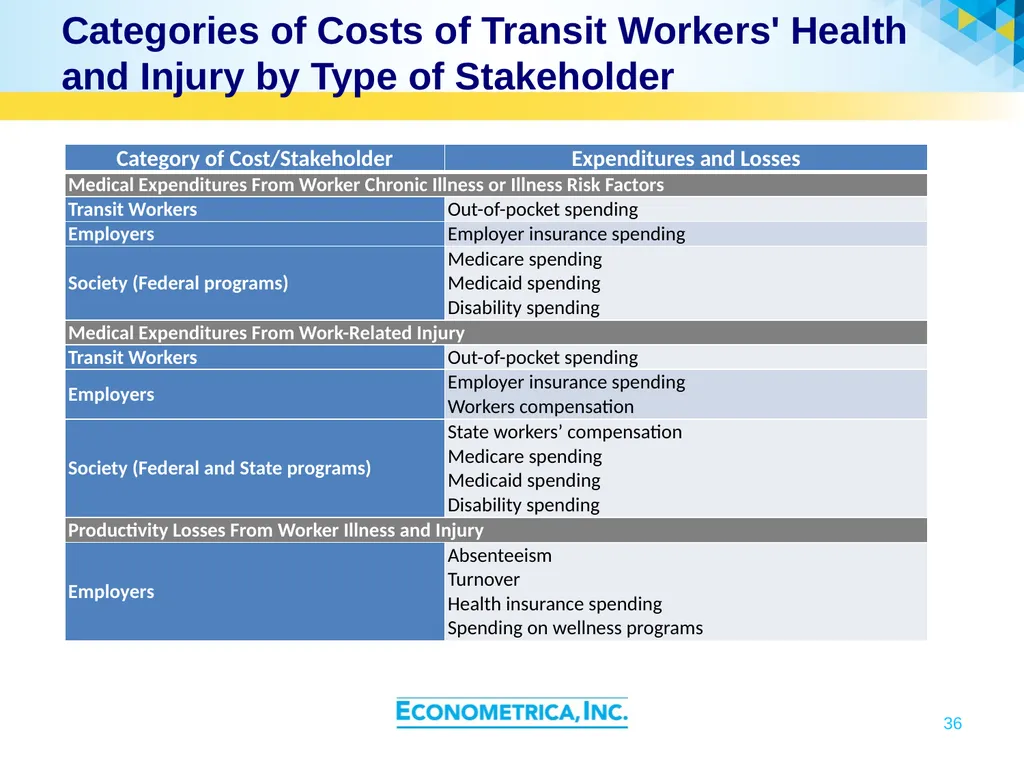
Categories of Costs of Transit Workers' Health and Injury by Type of Stakeholder 36<br>
37
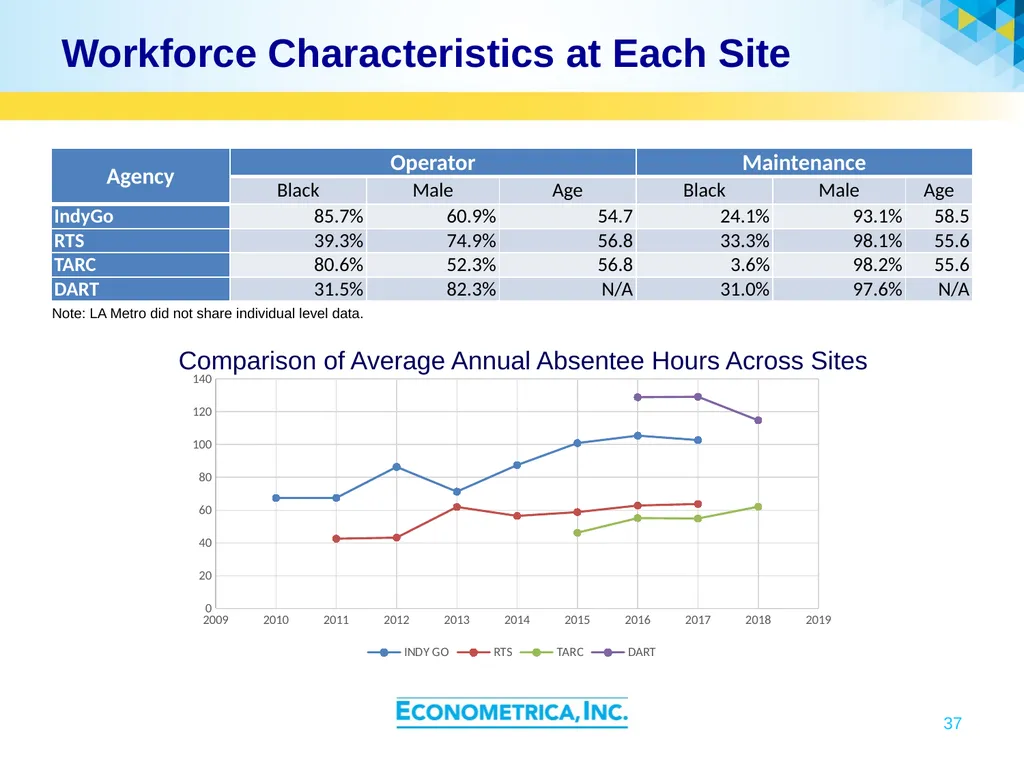
Workforce Characteristics at Each Site 37 Note: LA Metro did not share individual level data. Comparison of Average Annual Absentee Hours Across Sites<br>