
Costrell, ATRS, Risks, Redistribution & Remedies

Description: Costrell, ATRS, Risks, Redistribution Remedies AR Teacher Retirement Plan: Risks, Redistribution Remedies Robert M. Costrell, University of Arkansas (for affiliation only) AR Legislature, Joint Committee on Retirement; September 11,
Related Topics
Download Presentation
"Costrell, ATRS, Risks, Redistribution & Remedies" is the property of its rightful owner. Permission is granted to download and print the materials on this website for personal, non-commercial use only, and to display it on your personal computer provided you do not modify the materials and that you retain all copyright notices contained in the materials. By downloading content from our website, you accept the terms of this agreement.
Presentation Transcript
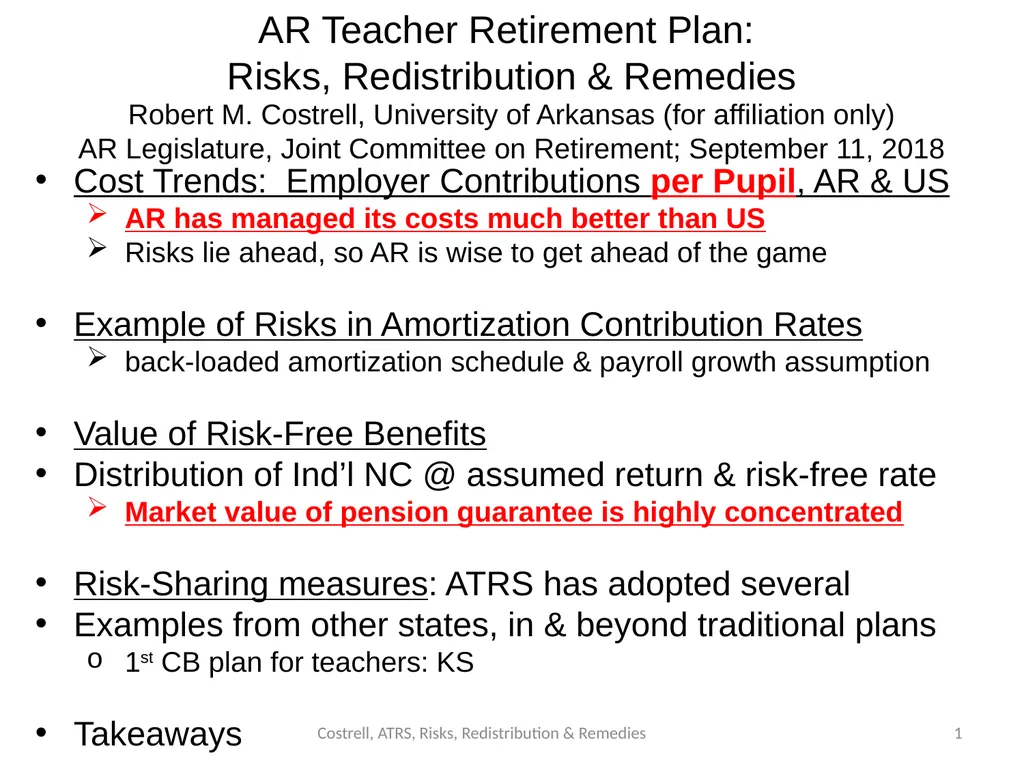
slide1. Costrell, ATRS, Risks, Redistribution & Remedies AR Teacher Retirement Plan:
Risks, Redistribution & Remedies Robert M. Costrell, University of Arkansas (for affiliation only)
AR Legislature, Joint Committee on Retirement; September 11, 2018 1 Cost Trends: Employer Contributions per Pupil, AR & US
AR has managed its costs much better than US
Risks lie ahead, so AR is wise to get ahead of the game
Example of Risks in Amortization Contribution Rates
back-loaded amortization schedule & payroll growth assumption
Value of Risk-Free Benefits
Distribution of Ind’l NC @ assumed return & risk-free rate
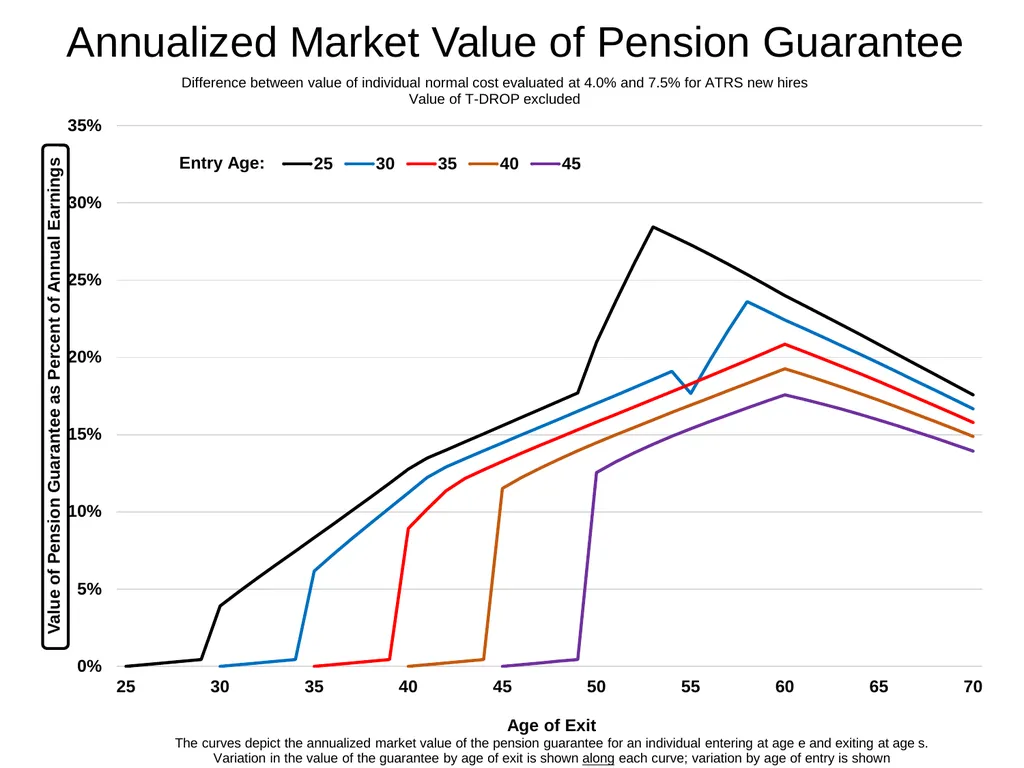
Market value of pension guarantee is highly concentrated
Risk-Sharing measures: ATRS has adopted several
Examples from other states, in & beyond traditional plans
1st CB plan for teachers: KS
Takeaways<br>
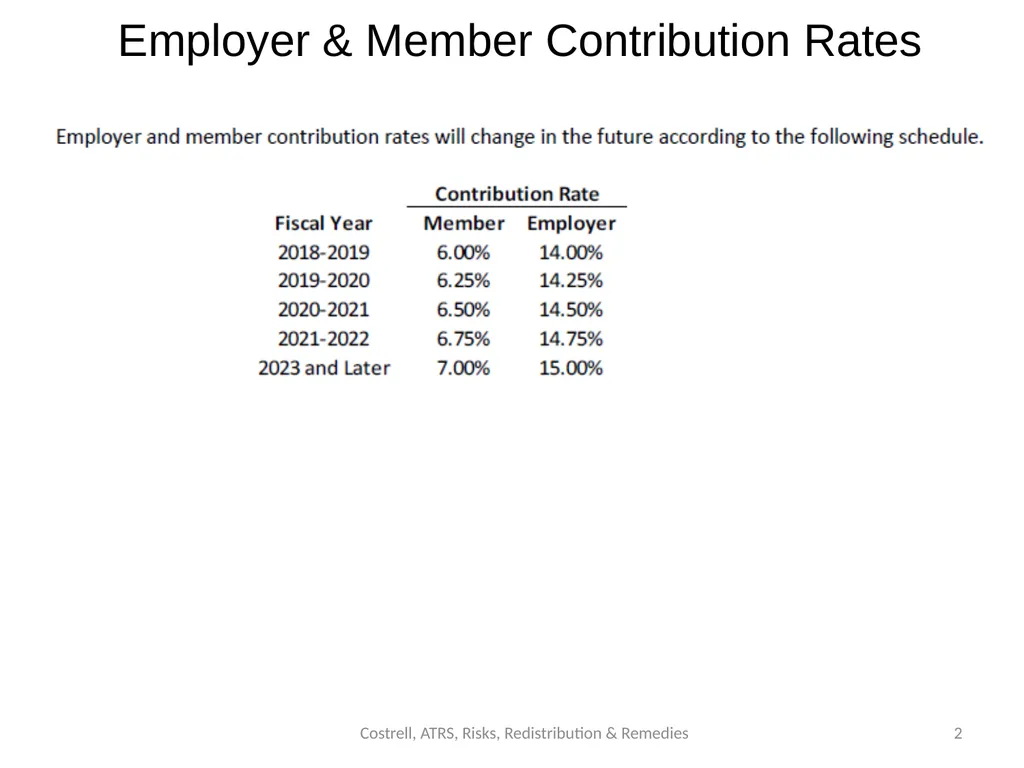
slide2. Costrell, ATRS, Risks, Redistribution & Remedies Employer & Member Contribution Rates 2<br>
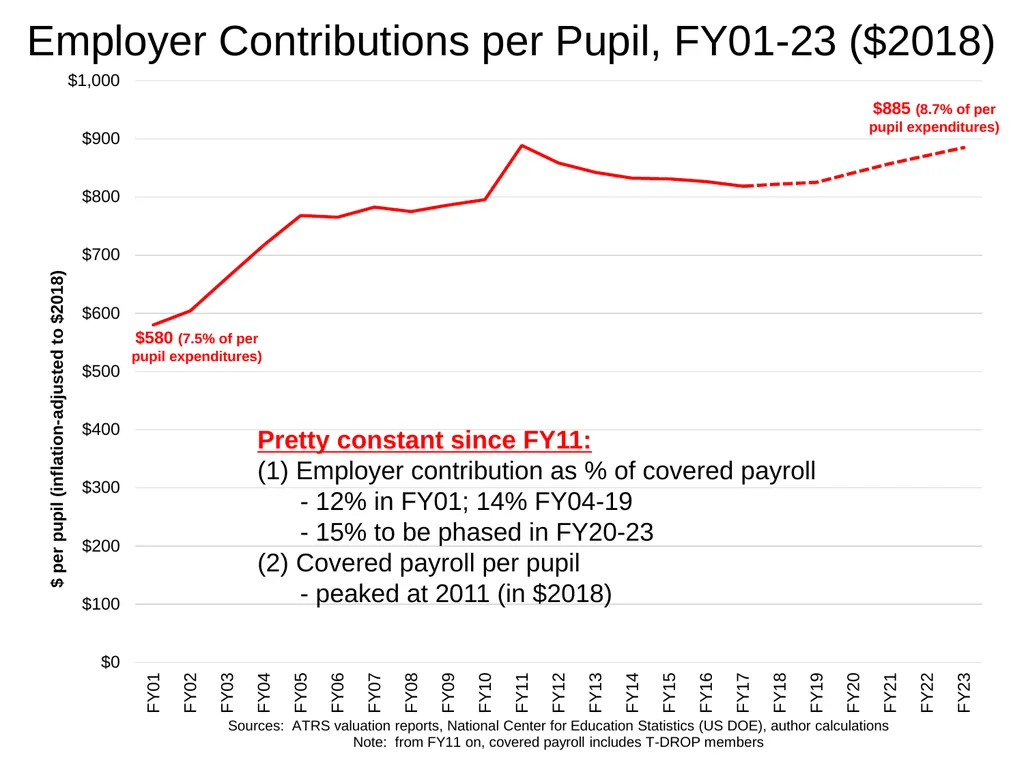
slide3. Costrell, ATRS, Risks, Redistribution & Remedies Employer Contributions per Pupil, FY01-23 ($2018) 3 $580 (7.5% of per pupil expenditures) $885 (8.7% of per pupil expenditures) Pretty constant since FY11:
Employer contribution as % of covered payroll
- 12% in FY01; 14% FY04-19
- 15% to be phased in FY20-23
Covered payroll per pupil
- peaked at 2011 (in $2018)<br>
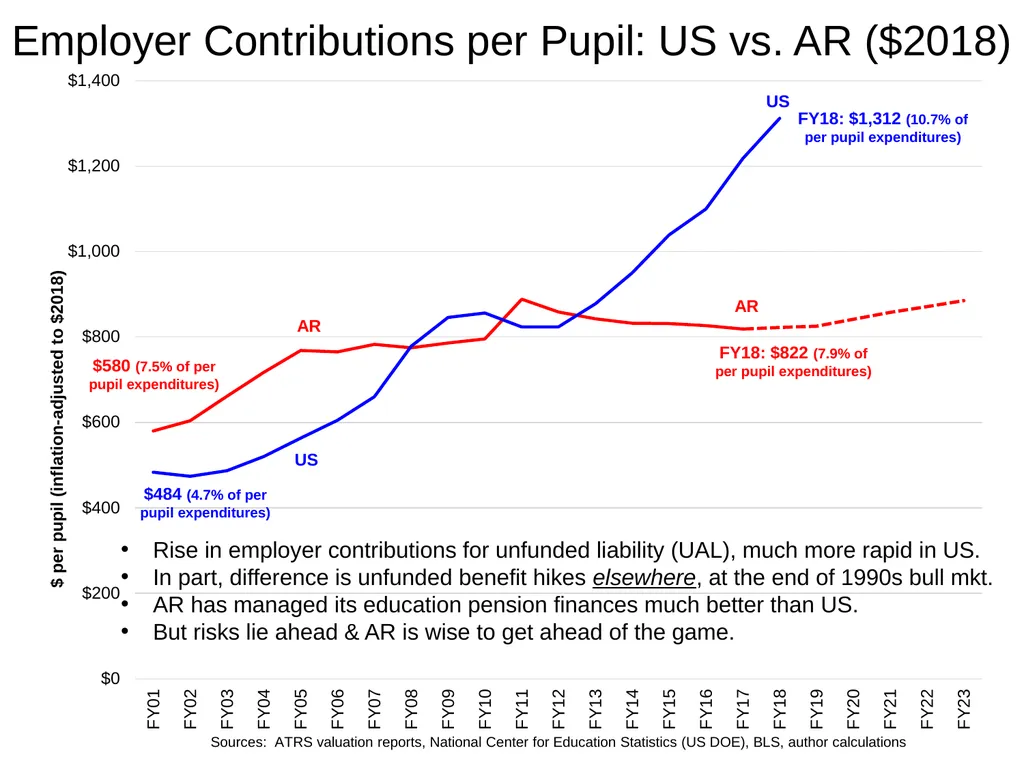
slide4. Employer Contributions per Pupil: US vs. AR ($2018) Costrell, ATRS, Risks, Redistribution & Remedies 4 $580 (7.5% of per pupil expenditures) $484 (4.7% of per pupil expenditures) FY18: $1,312 (10.7% of per pupil expenditures) FY18: $822 (7.9% of per pupil expenditures) Rise in employer contributions for unfunded liability (UAL), much more rapid in US.
In part, difference is unfunded benefit hikes elsewhere, at the end of 1990s bull mkt.
AR has managed its education pension finances much better than US.
But risks lie ahead & AR is wise to get ahead of the game.<br>
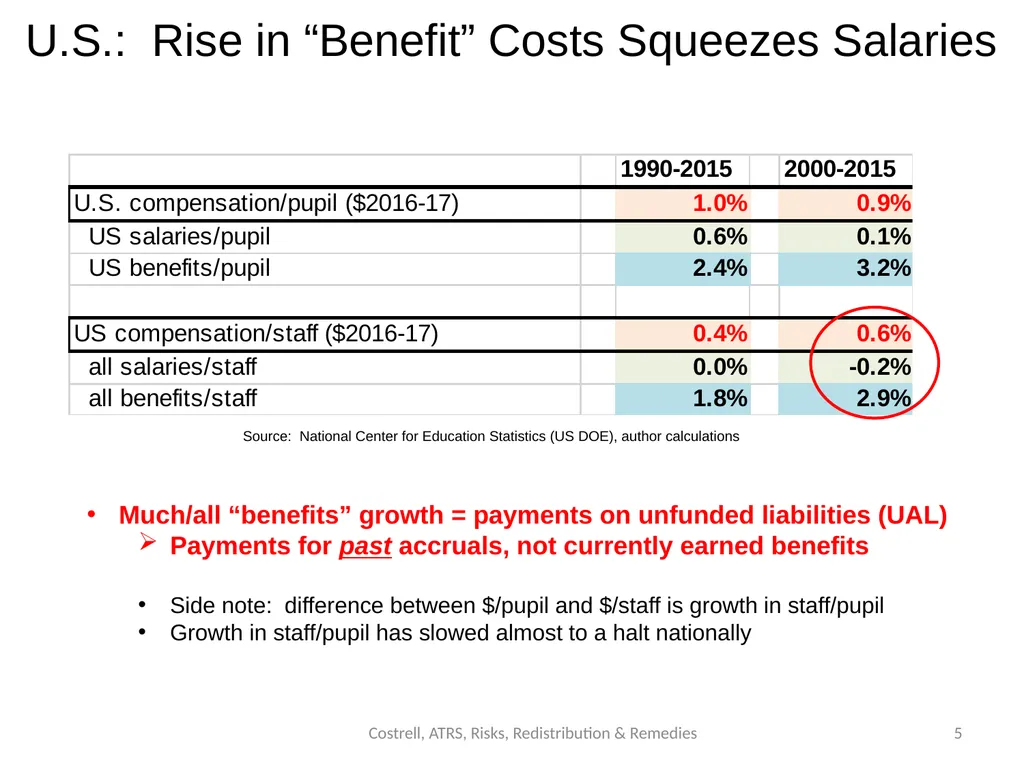
slide5. U.S.: Rise in “Benefit” Costs Squeezes Salaries Costrell, ATRS, Risks, Redistribution & Remedies 5 Much/all “benefits” growth = payments on unfunded liabilities (UAL)
Payments for past accruals, not currently earned benefits
Side note: difference between $/pupil and $/staff is growth in staff/pupil
Growth in staff/pupil has slowed almost to a halt nationally Source: National Center for Education Statistics (US DOE), author calculations<br>
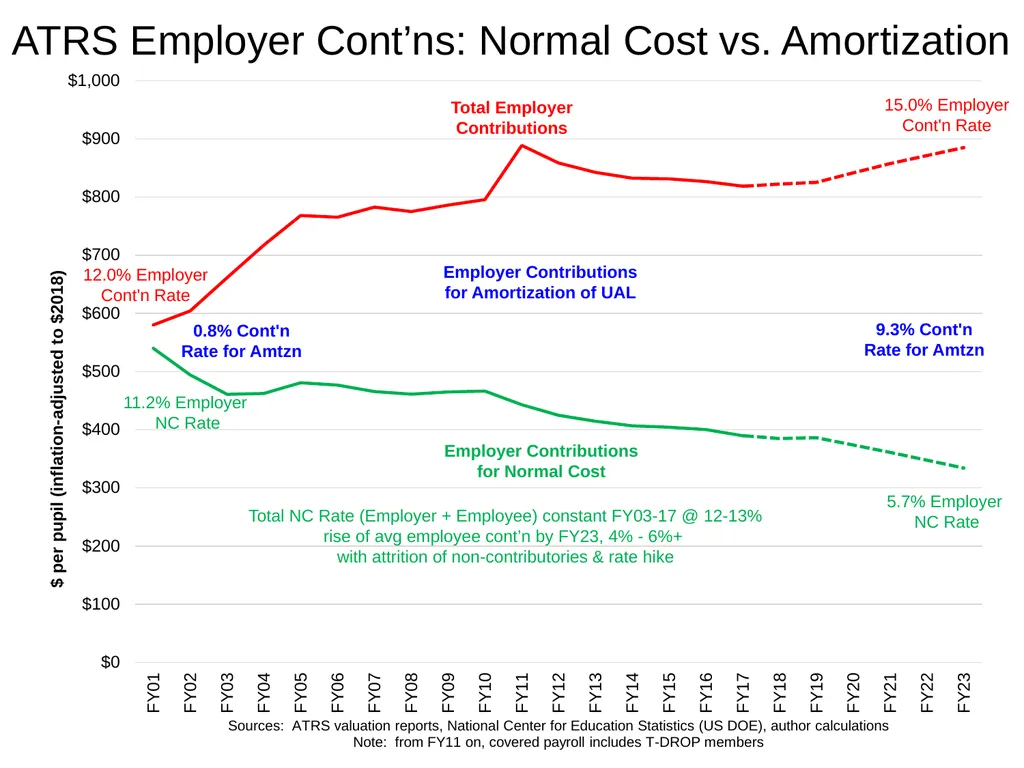
slide6. Costrell, ATRS, Risks, Redistribution & Remedies ATRS Employer Cont’ns: Normal Cost vs. Amortization 6 Total Employer Contributions Employer Contributions for Normal Cost Employer Contributions for Amortization of UAL 11.2% Employer NC Rate 5.7% Employer NC Rate Total NC Rate (Employer + Employee) constant FY03-17 @ 12-13%
rise of avg employee cont’n by FY23, 4% - 6%+ with attrition of non-contributories & rate hike 12.0% Employer Cont'n Rate 15.0% Employer Cont'n Rate 0.8% Cont'n Rate for Amtzn 9.3% Cont'n Rate for Amtzn<br>
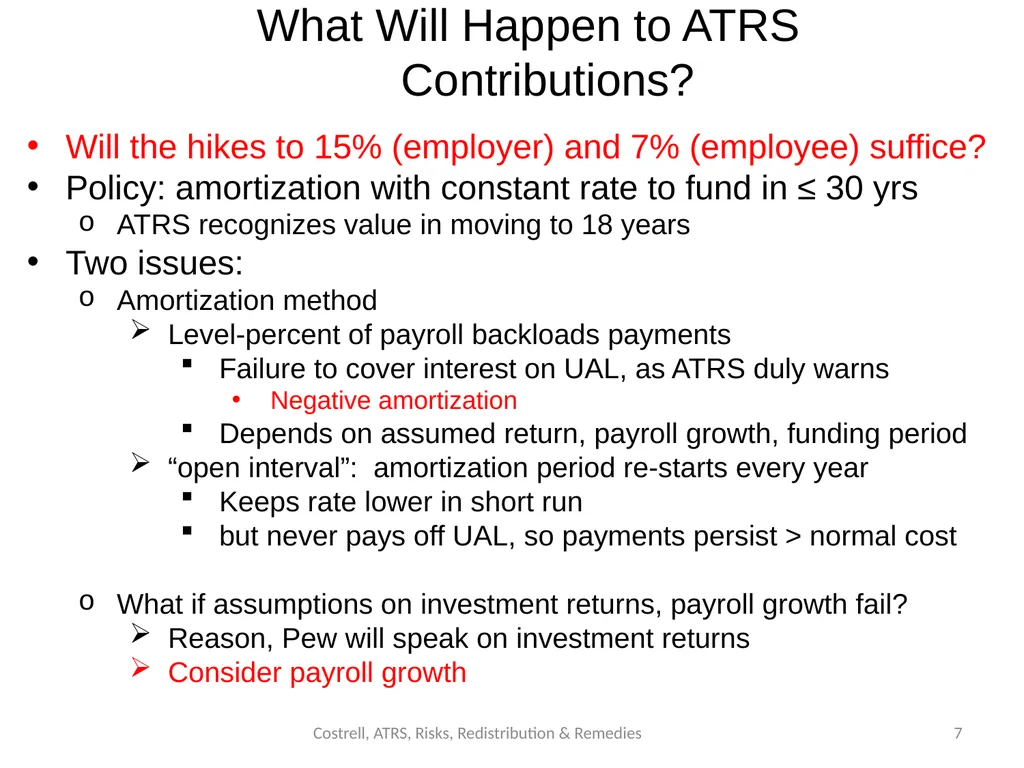
slide7. What Will Happen to ATRS Contributions? Costrell, ATRS, Risks, Redistribution & Remedies 7 Will the hikes to 15% (employer) and 7% (employee) suffice?
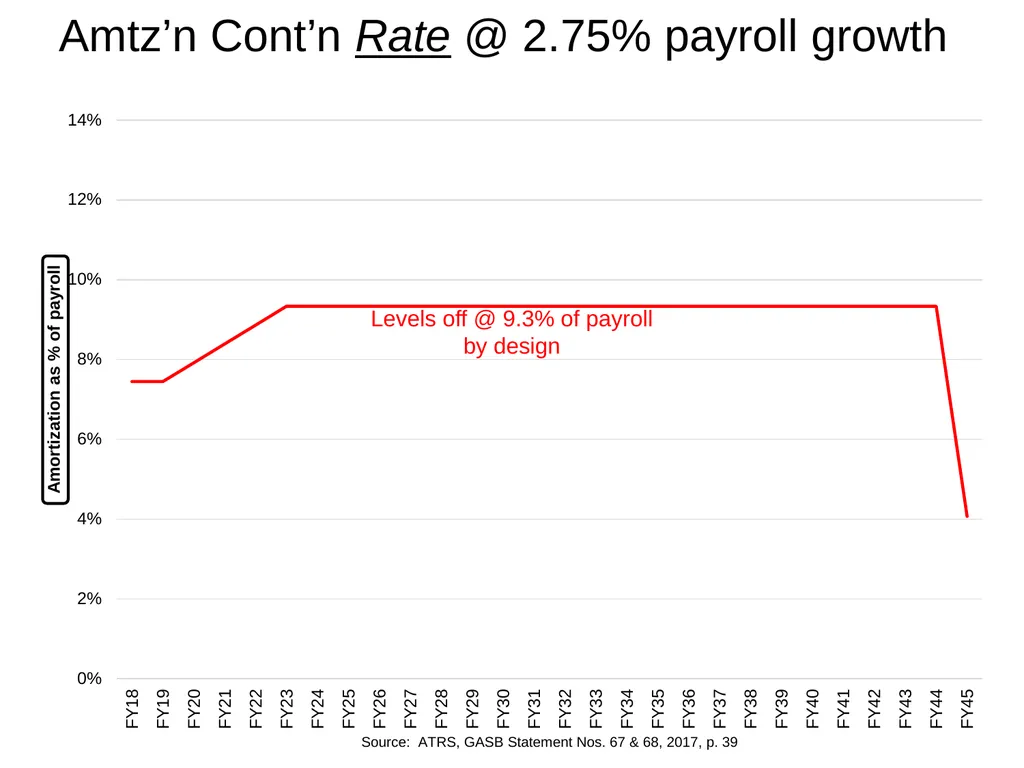
Policy: amortization with constant rate to fund in ≤ 30 yrs
ATRS recognizes value in moving to 18 years
Two issues:
Amortization method
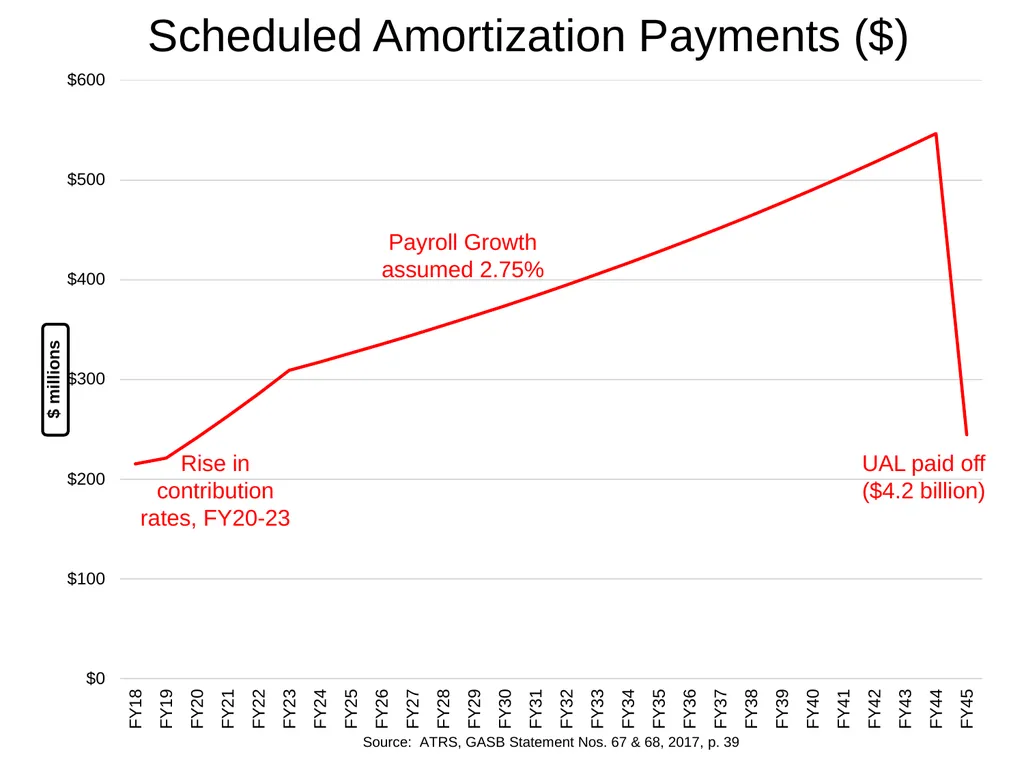
Level-percent of payroll backloads payments
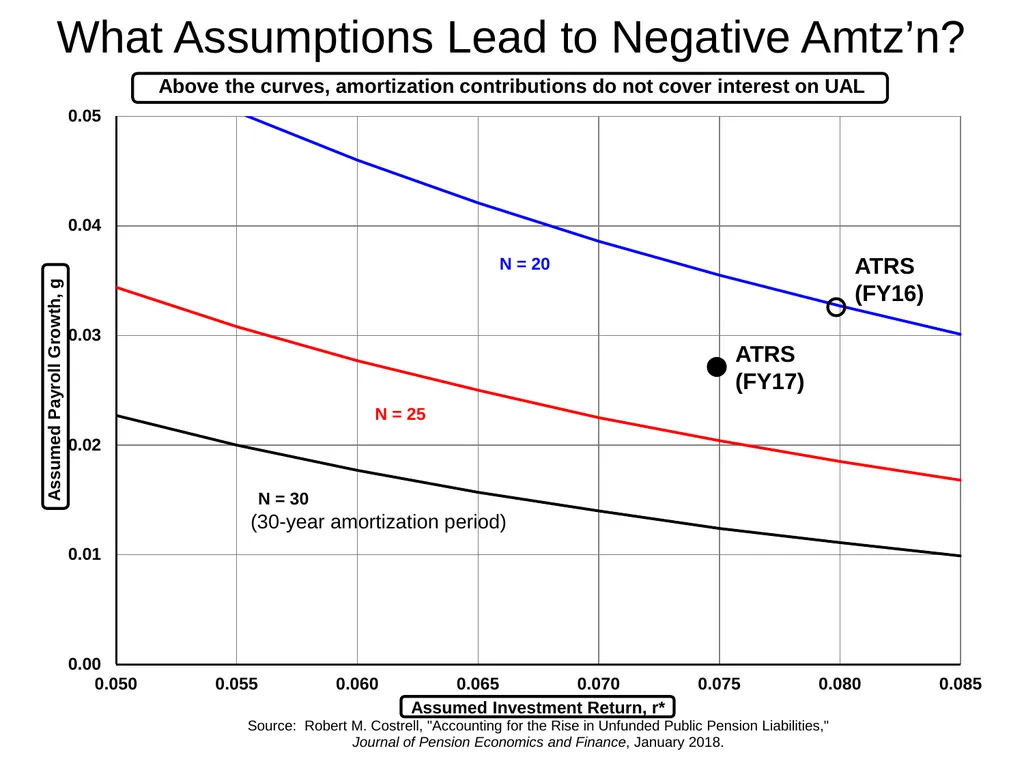
Failure to cover interest on UAL, as ATRS duly warns
Negative amortization
Depends on assumed return, payroll growth, funding period
“open interval”: amortization period re-starts every year
Keeps rate lower in short run
but never pays off UAL, so payments persist > normal cost
What if assumptions on investment returns, payroll growth fail?
Reason, Pew will speak on investment returns
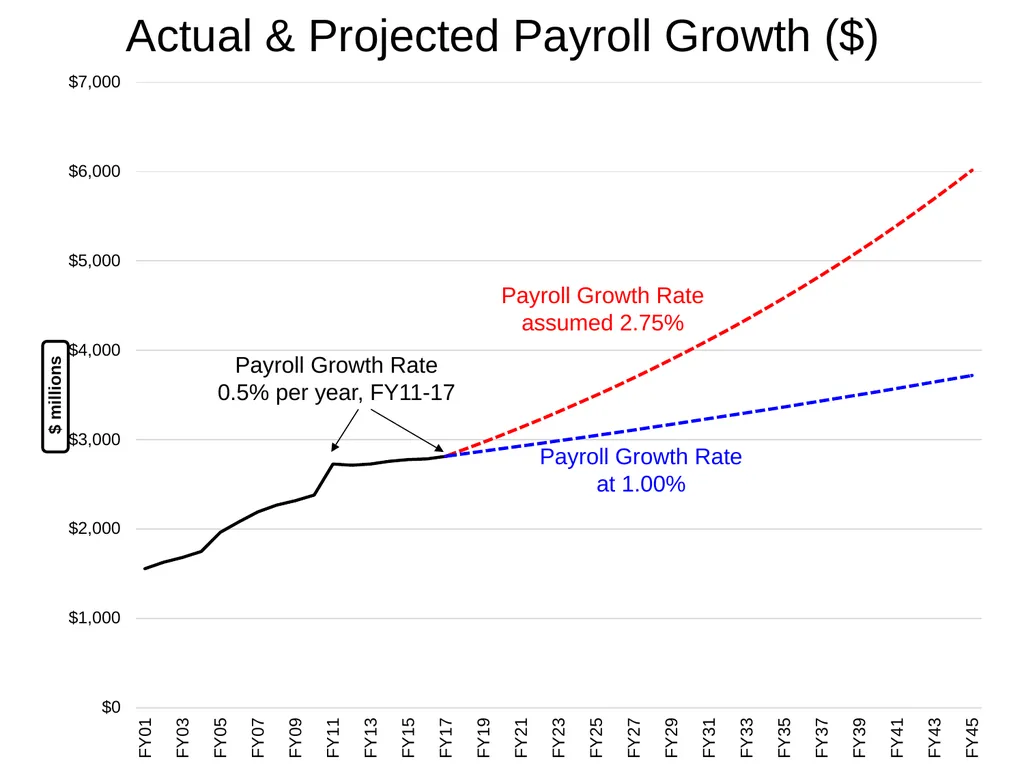
Consider payroll growth<br>
slide8. What Assumptions Lead to Negative Amtz’n? Costrell, ATRS, Risks, Redistribution & Remedies 8 ATRS (FY17) ATRS (FY16) (30-year amortization period)<br>
slide9. Scheduled Amortization Payments ($) Costrell, ATRS, Risks, Redistribution & Remedies 9 Rise in contribution rates, FY20-23 Payroll Growth assumed 2.75% UAL paid off ($4.2 billion)<br>
slide10. Amtz’n Cont’n Rate @ 2.75% payroll growth Costrell, ATRS, Risks, Redistribution & Remedies 10 Levels off @ 9.3% of payroll by design<br>
slide11. Costrell, ATRS, Risks, Redistribution & Remedies Actual & Projected Payroll Growth ($) 11 Payroll Growth Rate assumed 2.75% Payroll Growth Rate at 1.00% Payroll Growth Rate 0.5% per year, FY11-17<br>
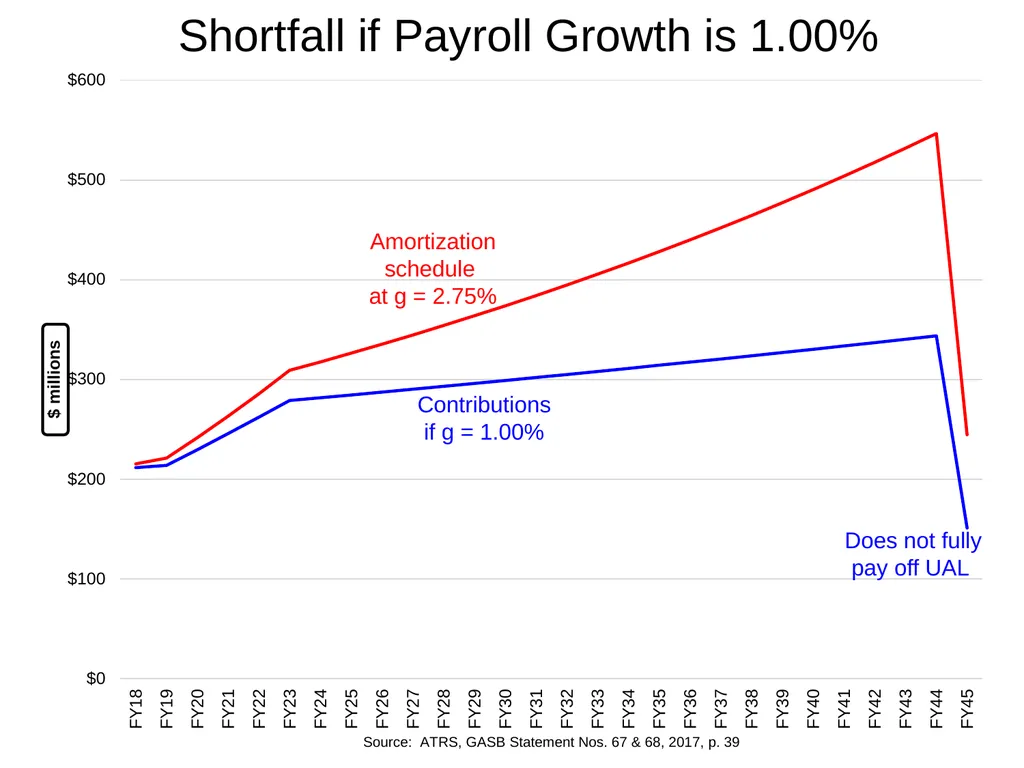
slide12. Shortfall if Payroll Growth is 1.00% Costrell, ATRS, Risks, Redistribution & Remedies 12 Amortization schedule at g = 2.75% Contributions if g = 1.00% Does not fully pay off UAL<br>
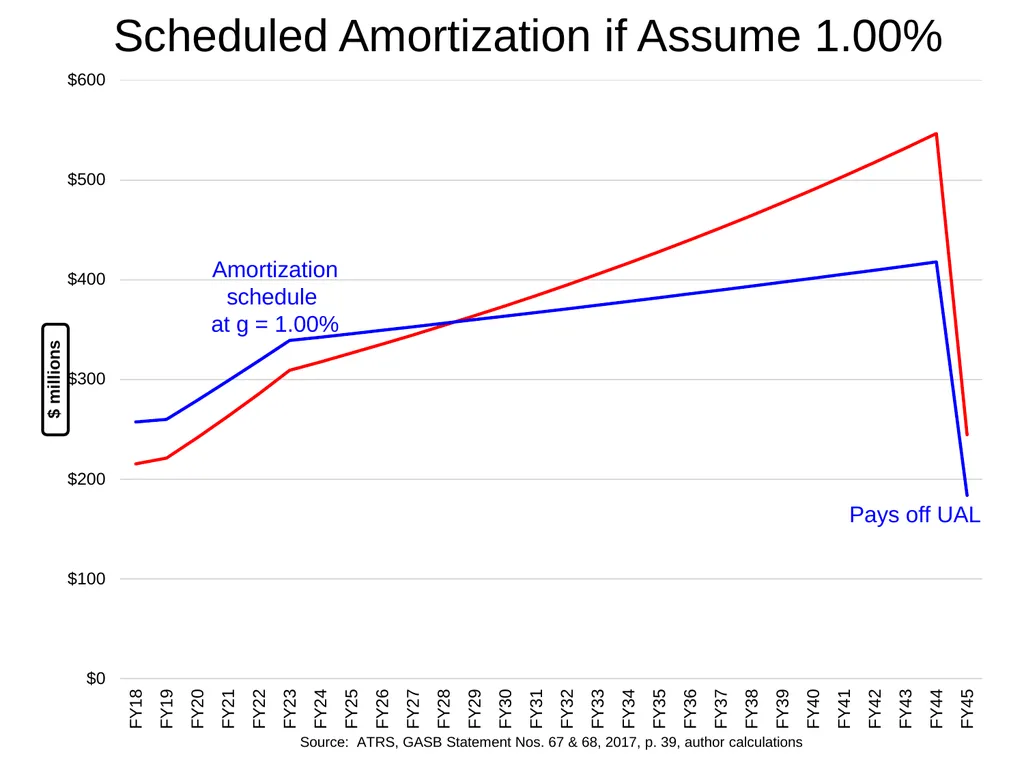
slide13. Costrell, ATRS, Risks, Redistribution & Remedies Scheduled Amortization if Assume 1.00% 13 Amortization schedule at g = 1.00% Pays off UAL<br>
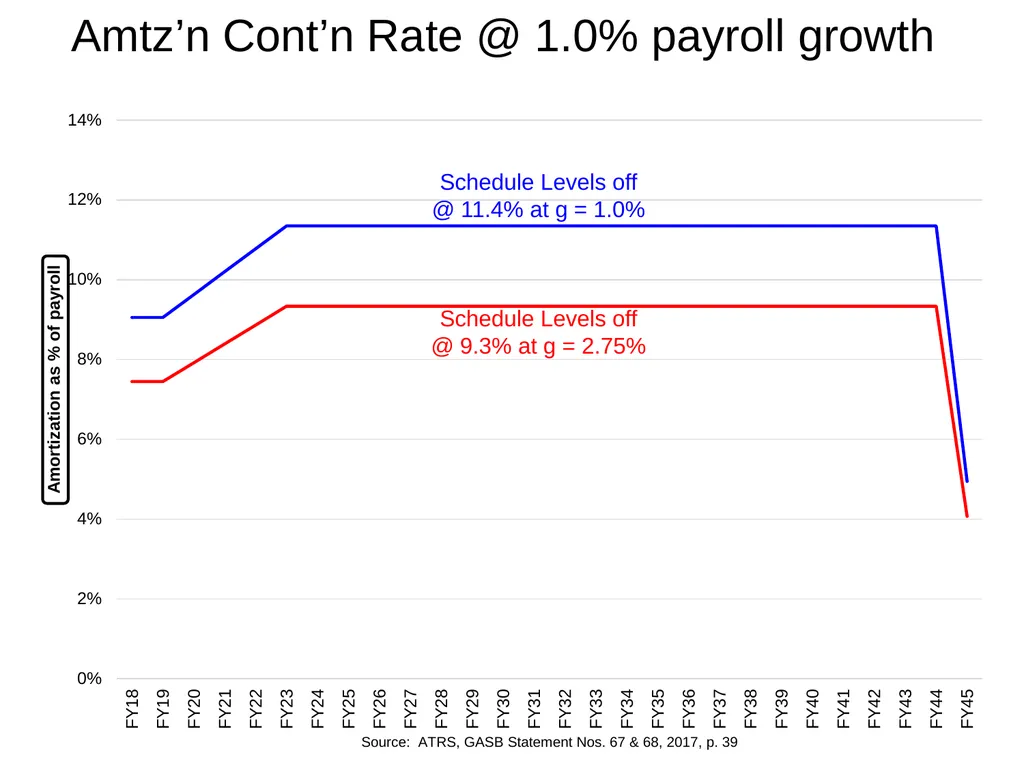
slide14. Amtz’n Cont’n Rate @ 1.0% payroll growth Costrell, ATRS, Risks, Redistribution & Remedies 14 Schedule Levels off @ 9.3% at g = 2.75% Schedule Levels off @ 11.4% at g = 1.0%<br>
slide15. Value of Risk-Free Benefits to Members Costrell, ATRS, Risks, Redistribution & Remedies 15 Shift gears from amortization costs to normal costs
We will look at individual normal costs:
The annual cost to pre-fund individual benefits
Evaluate at expected rate of return, and then at risk-free rate
The difference is value of pension guarantee to members
Risk-sharing will reduce that benefit<br>
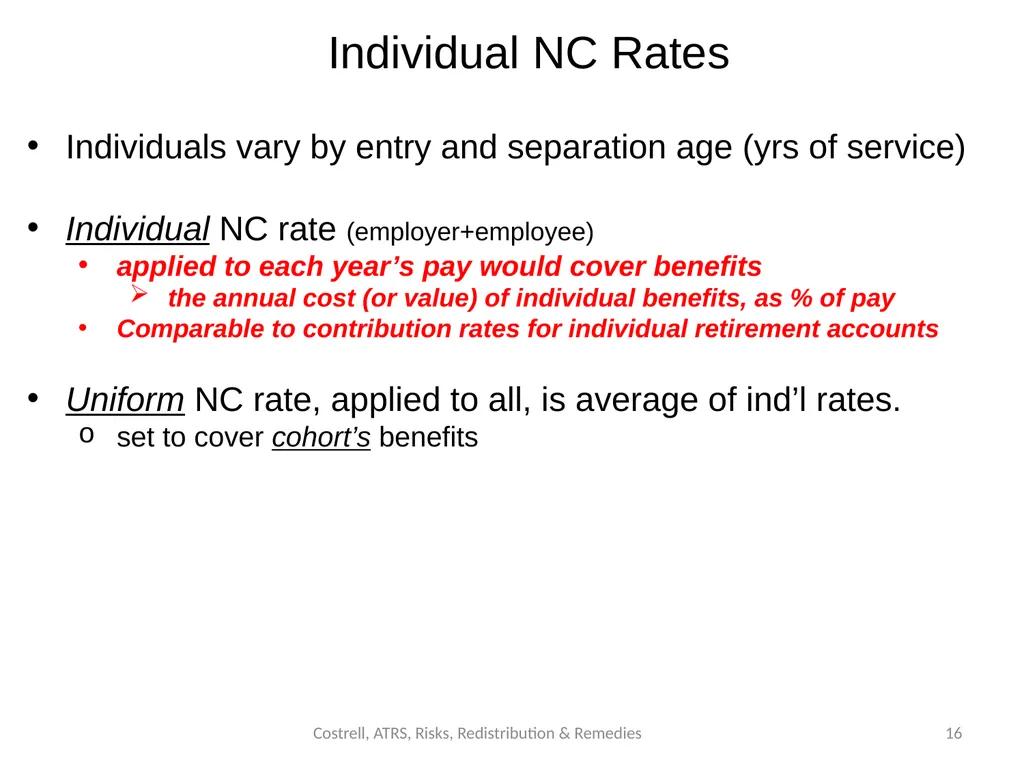
slide16. Individual NC Rates Costrell, ATRS, Risks, Redistribution & Remedies 16 Individuals vary by entry and separation age (yrs of service)
Individual NC rate (employer+employee)
applied to each year’s pay would cover benefits
the annual cost (or value) of individual benefits, as % of pay
Comparable to contribution rates for individual retirement accounts
Uniform NC rate, applied to all, is average of ind’l rates.
set to cover cohort’s benefits<br>
slide17. NC, by Age of Exit, Age 25 entrant, r = 7.5% Costrell, ATRS, Risks, Redistribution & Remedies 17<br>
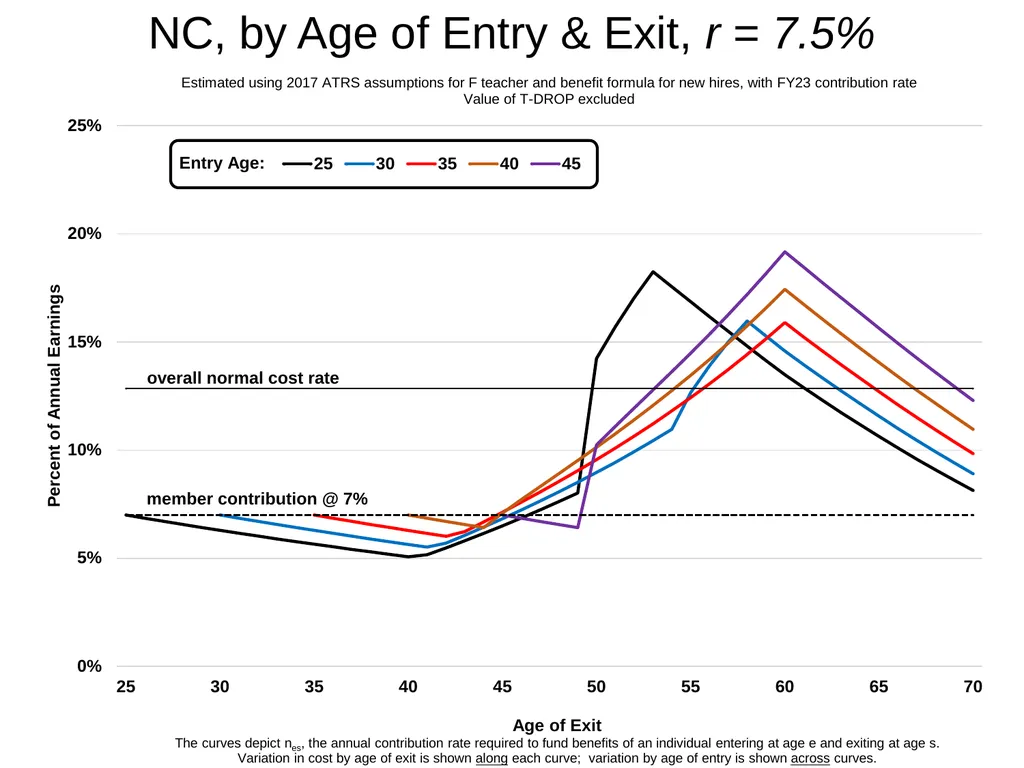
slide18. NC, by Age of Entry & Exit, r = 7.5% Costrell, ATRS, Risks, Redistribution & Remedies 18<br>
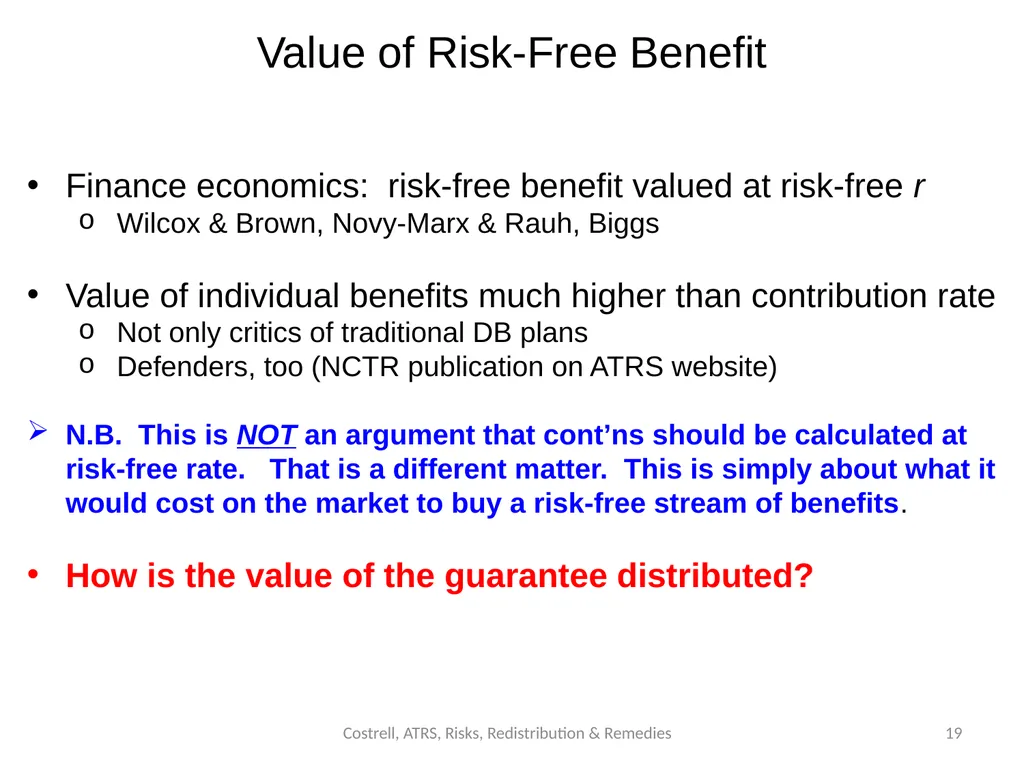
slide19. Value of Risk-Free Benefit Costrell, ATRS, Risks, Redistribution & Remedies 19 Finance economics: risk-free benefit valued at risk-free r
Wilcox & Brown, Novy-Marx & Rauh, Biggs
Value of individual benefits much higher than contribution rate
Not only critics of traditional DB plans
Defenders, too (NCTR publication on ATRS website)
N.B. This is NOT an argument that cont’ns should be calculated at risk-free rate. That is a different matter. This is simply about what it would cost on the market to buy a risk-free stream of benefits.
How is the value of the guarantee distributed?<br>
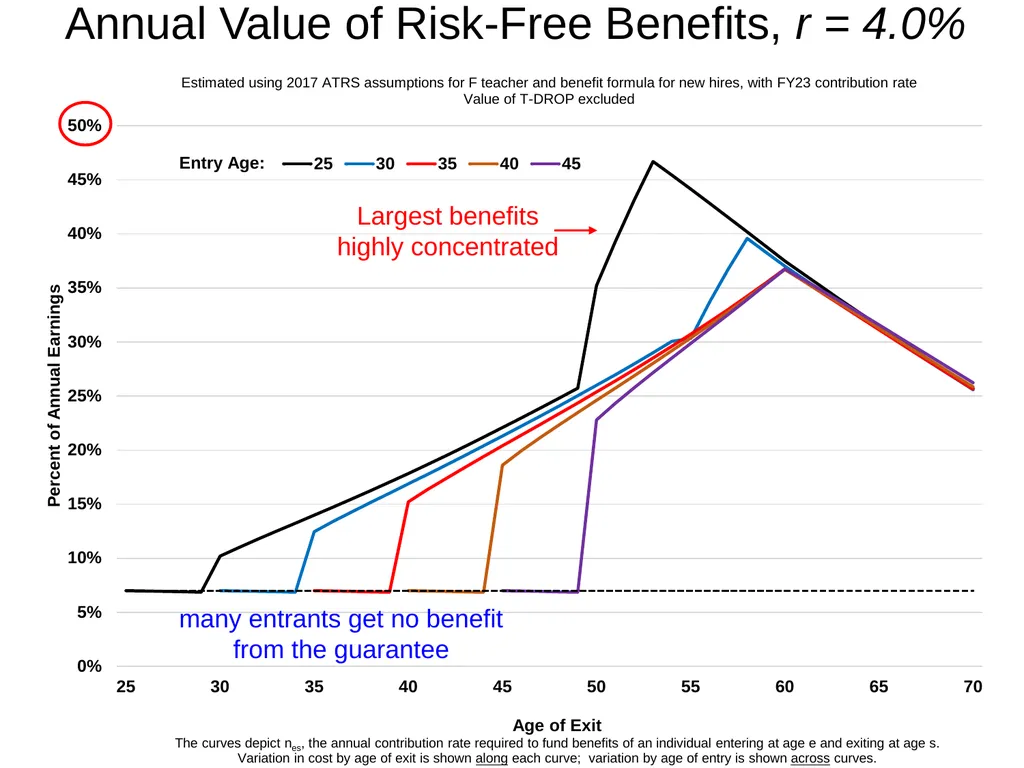
slide20. Costrell, ATRS, Risks, Redistribution & Remedies Annual Value of Risk-Free Benefits, r = 4.0% 20 Largest benefits highly concentrated many entrants get no benefit from the guarantee<br>
slide21. Annualized Market Value of Pension Guarantee Costrell, ATRS, Risks, Redistribution & Remedies 21<br>
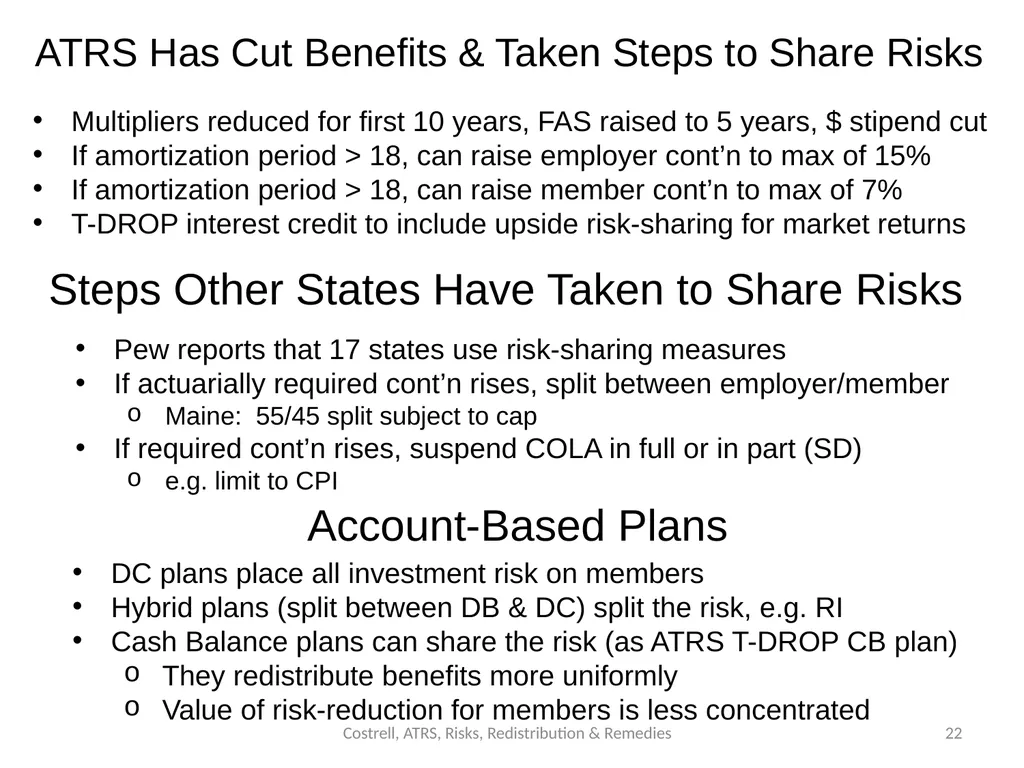
slide22. ATRS Has Cut Benefits & Taken Steps to Share Risks Costrell, ATRS, Risks, Redistribution & Remedies 22 Multipliers reduced for first 10 years, FAS raised to 5 years, $ stipend cut
If amortization period > 18, can raise employer cont’n to max of 15%
If amortization period > 18, can raise member cont’n to max of 7%
T-DROP interest credit to include upside risk-sharing for market returns Steps Other States Have Taken to Share Risks Pew reports that 17 states use risk-sharing measures
If actuarially required cont’n rises, split between employer/member
Maine: 55/45 split subject to cap
If required cont’n rises, suspend COLA in full or in part (SD)
e.g. limit to CPI Account-Based Plans DC plans place all investment risk on members
Hybrid plans (split between DB & DC) split the risk, e.g. RI
Cash Balance plans can share the risk (as ATRS T-DROP CB plan)
They redistribute benefits more uniformly
Value of risk-reduction for members is less concentrated<br>
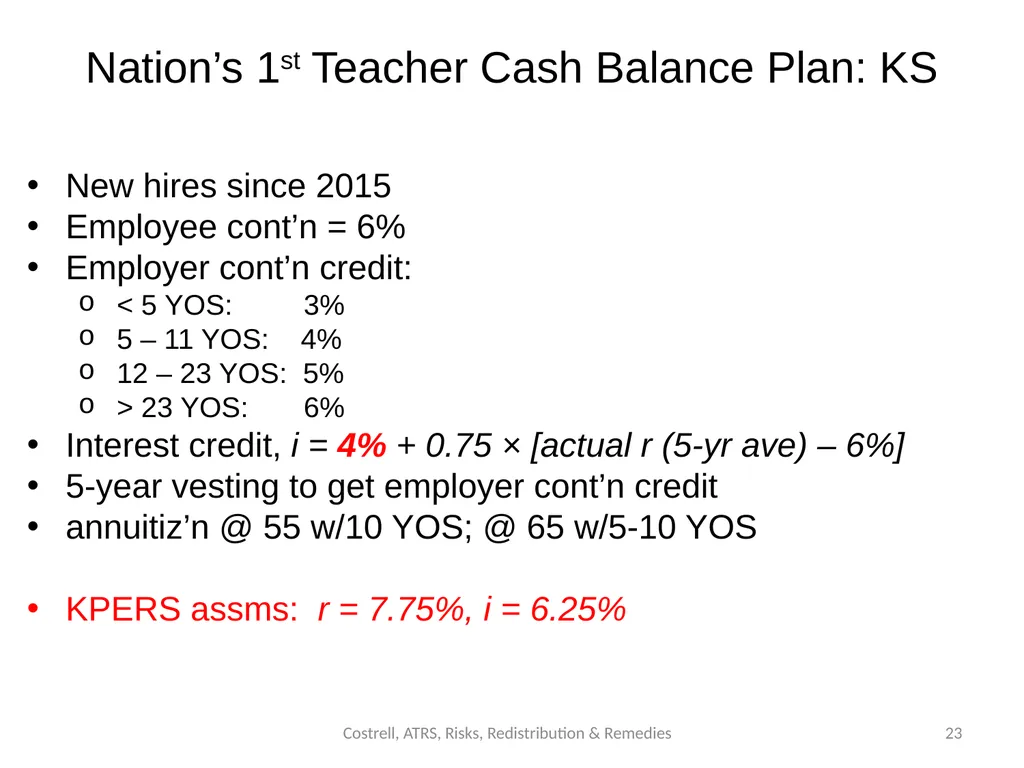
slide23. Nation’s 1st Teacher Cash Balance Plan: KS Costrell, ATRS, Risks, Redistribution & Remedies 23 New hires since 2015
Employee cont’n = 6%
Employer cont’n credit:
< 5 YOS: 3%
5 – 11 YOS: 4%
12 – 23 YOS: 5%
> 23 YOS: 6%
Interest credit, i = 4% + 0.75 × [actual r (5-yr ave) – 6%]
5-year vesting to get employer cont’n credit
annuitiz’n @ 55 w/10 YOS; @ 65 w/5-10 YOS
KPERS assms: r = 7.75%, i = 6.25%<br>
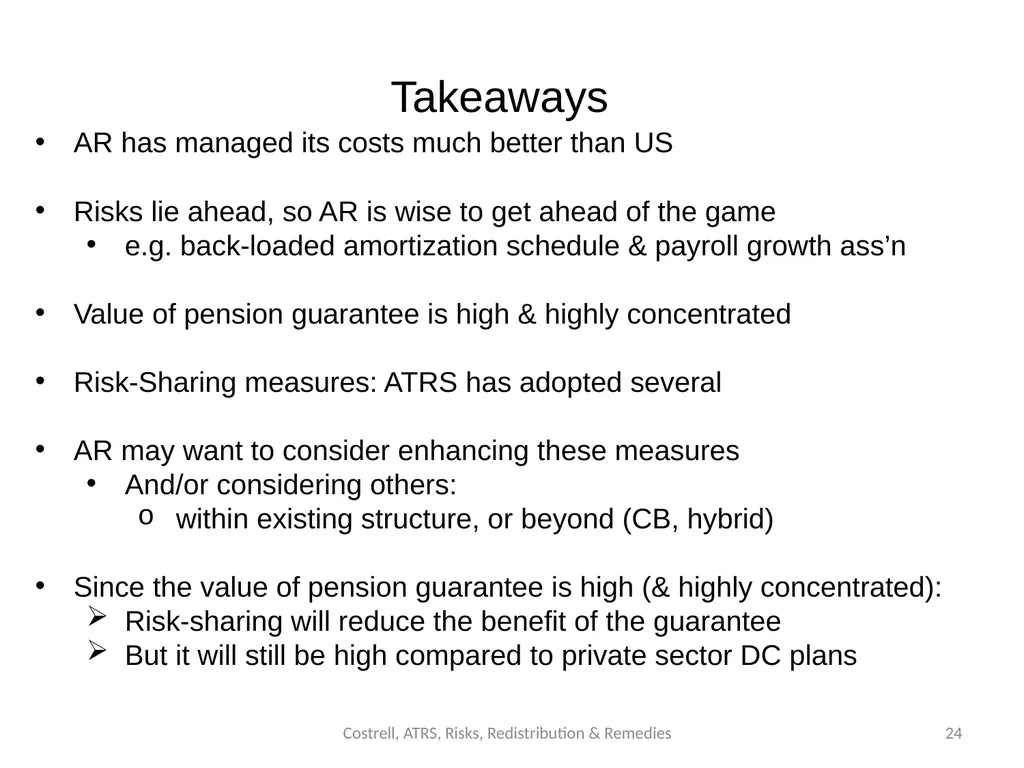
slide24. Takeaways Costrell, ATRS, Risks, Redistribution & Remedies 24 AR has managed its costs much better than US
Risks lie ahead, so AR is wise to get ahead of the game
e.g. back-loaded amortization schedule & payroll growth ass’n
Value of pension guarantee is high & highly concentrated
Risk-Sharing measures: ATRS has adopted several
AR may want to consider enhancing these measures
And/or considering others:
within existing structure, or beyond (CB, hybrid)
Since the value of pension guarantee is high (& highly concentrated):
Risk-sharing will reduce the benefit of the guarantee
But it will still be high compared to private sector DC plans<br>
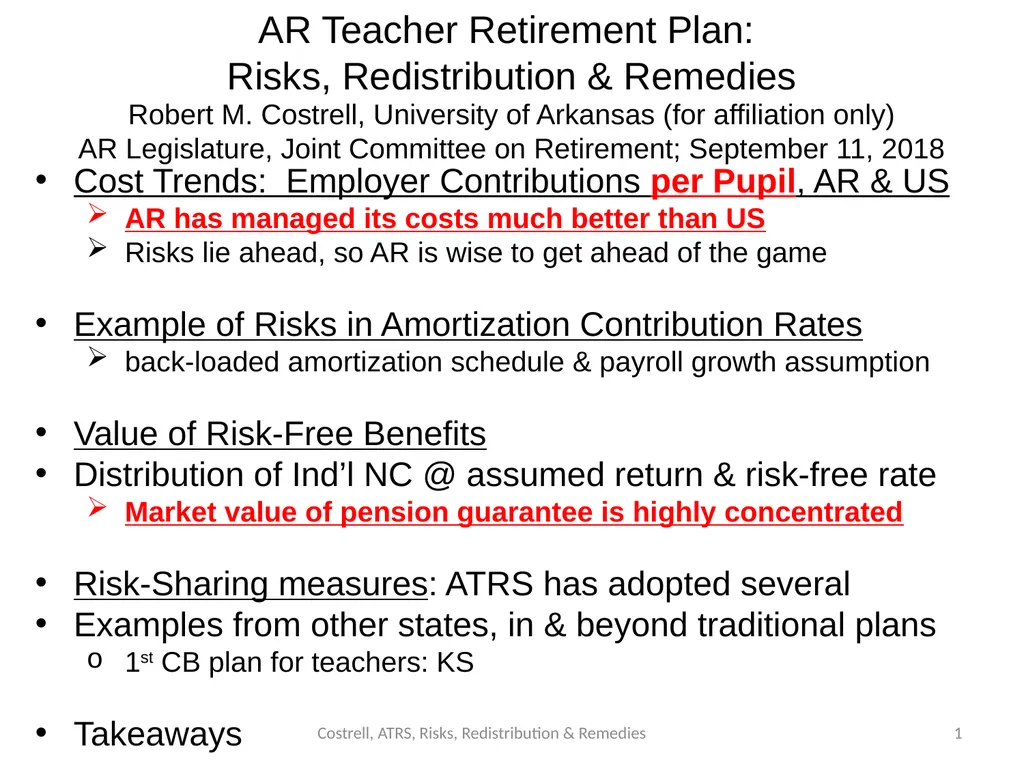
AR has managed its costs much better than US
Risks lie ahead, so AR is wise to get ahead of the game
Example of Risks in Amortization Contribution Rates
back-loaded amortization schedule & payroll growth assumption
Value of Risk-Free Benefits
Distribution of Ind’l NC @ assumed return & risk-free rate
Market value of pension guarantee is highly concentrated
Risk-Sharing measures: ATRS has adopted several
Examples from other states, in & beyond traditional plans
1st CB plan for teachers: KS
Takeaways<br>
slide2. Costrell, ATRS, Risks, Redistribution & Remedies Employer & Member Contribution Rates 2<br>
slide3. Costrell, ATRS, Risks, Redistribution & Remedies Employer Contributions per Pupil, FY01-23 ($2018) 3 $580 (7.5% of per pupil expenditures) $885 (8.7% of per pupil expenditures) Pretty constant since FY11:
Employer contribution as % of covered payroll
- 12% in FY01; 14% FY04-19
- 15% to be phased in FY20-23
Covered payroll per pupil
- peaked at 2011 (in $2018)<br>
slide4. Employer Contributions per Pupil: US vs. AR ($2018) Costrell, ATRS, Risks, Redistribution & Remedies 4 $580 (7.5% of per pupil expenditures) $484 (4.7% of per pupil expenditures) FY18: $1,312 (10.7% of per pupil expenditures) FY18: $822 (7.9% of per pupil expenditures) Rise in employer contributions for unfunded liability (UAL), much more rapid in US.
In part, difference is unfunded benefit hikes elsewhere, at the end of 1990s bull mkt.
AR has managed its education pension finances much better than US.
But risks lie ahead & AR is wise to get ahead of the game.<br>
slide5. U.S.: Rise in “Benefit” Costs Squeezes Salaries Costrell, ATRS, Risks, Redistribution & Remedies 5 Much/all “benefits” growth = payments on unfunded liabilities (UAL)
Payments for past accruals, not currently earned benefits
Side note: difference between $/pupil and $/staff is growth in staff/pupil
Growth in staff/pupil has slowed almost to a halt nationally Source: National Center for Education Statistics (US DOE), author calculations<br>
slide6. Costrell, ATRS, Risks, Redistribution & Remedies ATRS Employer Cont’ns: Normal Cost vs. Amortization 6 Total Employer Contributions Employer Contributions for Normal Cost Employer Contributions for Amortization of UAL 11.2% Employer NC Rate 5.7% Employer NC Rate Total NC Rate (Employer + Employee) constant FY03-17 @ 12-13%
rise of avg employee cont’n by FY23, 4% - 6%+ with attrition of non-contributories & rate hike 12.0% Employer Cont'n Rate 15.0% Employer Cont'n Rate 0.8% Cont'n Rate for Amtzn 9.3% Cont'n Rate for Amtzn<br>
slide7. What Will Happen to ATRS Contributions? Costrell, ATRS, Risks, Redistribution & Remedies 7 Will the hikes to 15% (employer) and 7% (employee) suffice?
Policy: amortization with constant rate to fund in ≤ 30 yrs
ATRS recognizes value in moving to 18 years
Two issues:
Amortization method
Level-percent of payroll backloads payments
Failure to cover interest on UAL, as ATRS duly warns
Negative amortization
Depends on assumed return, payroll growth, funding period
“open interval”: amortization period re-starts every year
Keeps rate lower in short run
but never pays off UAL, so payments persist > normal cost
What if assumptions on investment returns, payroll growth fail?
Reason, Pew will speak on investment returns
Consider payroll growth<br>
slide8. What Assumptions Lead to Negative Amtz’n? Costrell, ATRS, Risks, Redistribution & Remedies 8 ATRS (FY17) ATRS (FY16) (30-year amortization period)<br>
slide9. Scheduled Amortization Payments ($) Costrell, ATRS, Risks, Redistribution & Remedies 9 Rise in contribution rates, FY20-23 Payroll Growth assumed 2.75% UAL paid off ($4.2 billion)<br>
slide10. Amtz’n Cont’n Rate @ 2.75% payroll growth Costrell, ATRS, Risks, Redistribution & Remedies 10 Levels off @ 9.3% of payroll by design<br>
slide11. Costrell, ATRS, Risks, Redistribution & Remedies Actual & Projected Payroll Growth ($) 11 Payroll Growth Rate assumed 2.75% Payroll Growth Rate at 1.00% Payroll Growth Rate 0.5% per year, FY11-17<br>
slide12. Shortfall if Payroll Growth is 1.00% Costrell, ATRS, Risks, Redistribution & Remedies 12 Amortization schedule at g = 2.75% Contributions if g = 1.00% Does not fully pay off UAL<br>
slide13. Costrell, ATRS, Risks, Redistribution & Remedies Scheduled Amortization if Assume 1.00% 13 Amortization schedule at g = 1.00% Pays off UAL<br>
slide14. Amtz’n Cont’n Rate @ 1.0% payroll growth Costrell, ATRS, Risks, Redistribution & Remedies 14 Schedule Levels off @ 9.3% at g = 2.75% Schedule Levels off @ 11.4% at g = 1.0%<br>
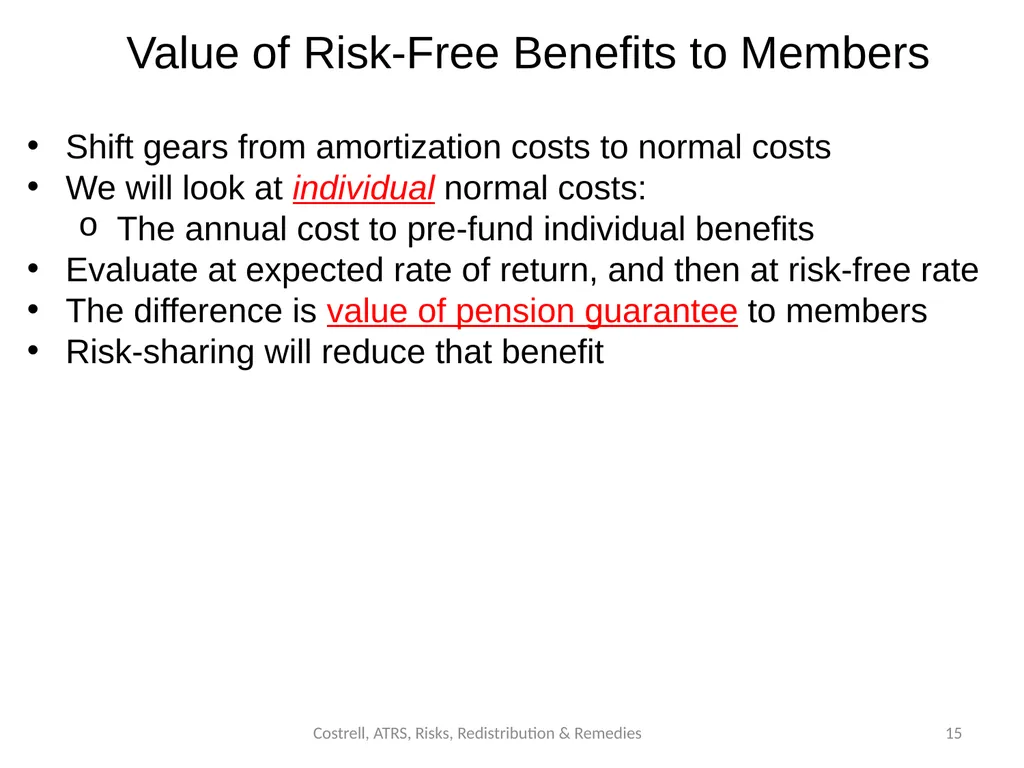
slide15. Value of Risk-Free Benefits to Members Costrell, ATRS, Risks, Redistribution & Remedies 15 Shift gears from amortization costs to normal costs
We will look at individual normal costs:
The annual cost to pre-fund individual benefits
Evaluate at expected rate of return, and then at risk-free rate
The difference is value of pension guarantee to members
Risk-sharing will reduce that benefit<br>
slide16. Individual NC Rates Costrell, ATRS, Risks, Redistribution & Remedies 16 Individuals vary by entry and separation age (yrs of service)
Individual NC rate (employer+employee)
applied to each year’s pay would cover benefits
the annual cost (or value) of individual benefits, as % of pay
Comparable to contribution rates for individual retirement accounts
Uniform NC rate, applied to all, is average of ind’l rates.
set to cover cohort’s benefits<br>
slide17. NC, by Age of Exit, Age 25 entrant, r = 7.5% Costrell, ATRS, Risks, Redistribution & Remedies 17<br>
slide18. NC, by Age of Entry & Exit, r = 7.5% Costrell, ATRS, Risks, Redistribution & Remedies 18<br>
slide19. Value of Risk-Free Benefit Costrell, ATRS, Risks, Redistribution & Remedies 19 Finance economics: risk-free benefit valued at risk-free r
Wilcox & Brown, Novy-Marx & Rauh, Biggs
Value of individual benefits much higher than contribution rate
Not only critics of traditional DB plans
Defenders, too (NCTR publication on ATRS website)
N.B. This is NOT an argument that cont’ns should be calculated at risk-free rate. That is a different matter. This is simply about what it would cost on the market to buy a risk-free stream of benefits.
How is the value of the guarantee distributed?<br>
slide20. Costrell, ATRS, Risks, Redistribution & Remedies Annual Value of Risk-Free Benefits, r = 4.0% 20 Largest benefits highly concentrated many entrants get no benefit from the guarantee<br>
slide21. Annualized Market Value of Pension Guarantee Costrell, ATRS, Risks, Redistribution & Remedies 21<br>
slide22. ATRS Has Cut Benefits & Taken Steps to Share Risks Costrell, ATRS, Risks, Redistribution & Remedies 22 Multipliers reduced for first 10 years, FAS raised to 5 years, $ stipend cut
If amortization period > 18, can raise employer cont’n to max of 15%
If amortization period > 18, can raise member cont’n to max of 7%
T-DROP interest credit to include upside risk-sharing for market returns Steps Other States Have Taken to Share Risks Pew reports that 17 states use risk-sharing measures
If actuarially required cont’n rises, split between employer/member
Maine: 55/45 split subject to cap
If required cont’n rises, suspend COLA in full or in part (SD)
e.g. limit to CPI Account-Based Plans DC plans place all investment risk on members
Hybrid plans (split between DB & DC) split the risk, e.g. RI
Cash Balance plans can share the risk (as ATRS T-DROP CB plan)
They redistribute benefits more uniformly
Value of risk-reduction for members is less concentrated<br>
slide23. Nation’s 1st Teacher Cash Balance Plan: KS Costrell, ATRS, Risks, Redistribution & Remedies 23 New hires since 2015
Employee cont’n = 6%
Employer cont’n credit:
< 5 YOS: 3%
5 – 11 YOS: 4%
12 – 23 YOS: 5%
> 23 YOS: 6%
Interest credit, i = 4% + 0.75 × [actual r (5-yr ave) – 6%]
5-year vesting to get employer cont’n credit
annuitiz’n @ 55 w/10 YOS; @ 65 w/5-10 YOS
KPERS assms: r = 7.75%, i = 6.25%<br>
slide24. Takeaways Costrell, ATRS, Risks, Redistribution & Remedies 24 AR has managed its costs much better than US
Risks lie ahead, so AR is wise to get ahead of the game
e.g. back-loaded amortization schedule & payroll growth ass’n
Value of pension guarantee is high & highly concentrated
Risk-Sharing measures: ATRS has adopted several
AR may want to consider enhancing these measures
And/or considering others:
within existing structure, or beyond (CB, hybrid)
Since the value of pension guarantee is high (& highly concentrated):
Risk-sharing will reduce the benefit of the guarantee
But it will still be high compared to private sector DC plans<br>