CT Violent Death Reporting System Violent Deaths:
Description: CT Violent Death Reporting System Violent Deaths: Connecticut Data CT Violent Death Reporting System Overview National Violent Death Surveillance System Connecticut Violent Death Surveillance System (CTVDRS) Data collection and analysis of
Related Topics
Download Presentation
"CT Violent Death Reporting System Violent Deaths:" is the property of its rightful owner. Permission is granted to download and print the materials on this website for personal, non-commercial use only, and to display it on your personal computer provided you do not modify the materials and that you retain all copyright notices contained in the materials. By downloading content from our website, you accept the terms of this agreement.
Presentation Transcript
slide1. CT Violent Death Reporting System Violent Deaths: Connecticut Data<br>
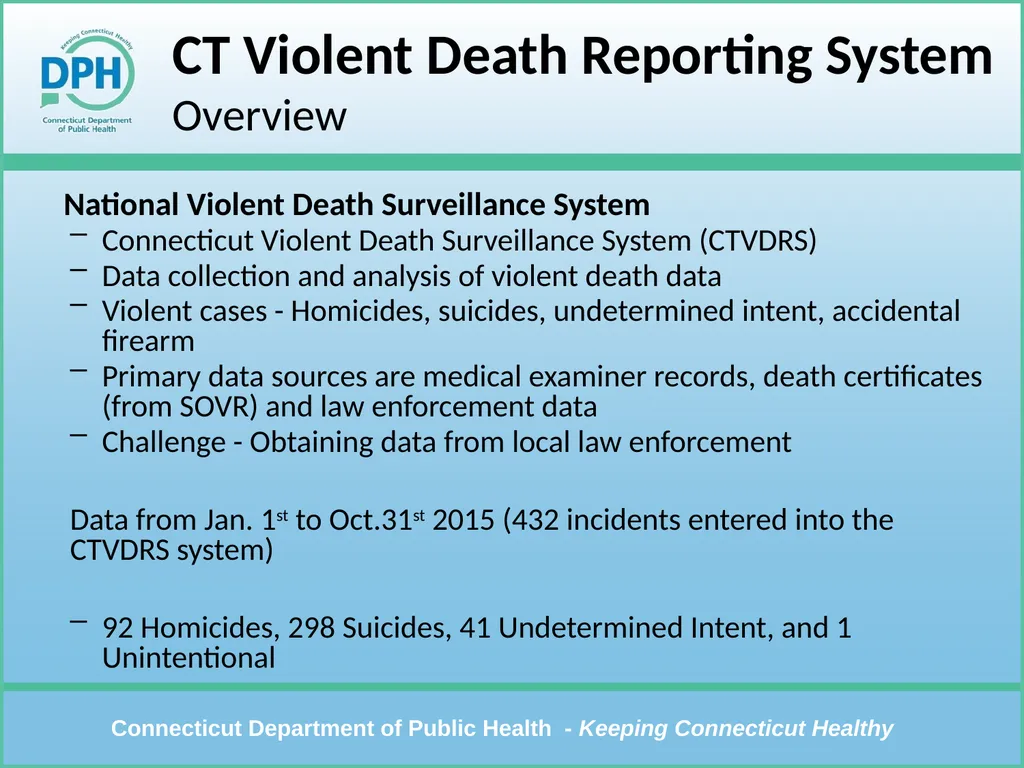
slide2. CT Violent Death Reporting SystemOverview National Violent Death Surveillance System
Connecticut Violent Death Surveillance System (CTVDRS)
Data collection and analysis of violent death data
Violent cases - Homicides, suicides, undetermined intent, accidental firearm
Primary data sources are medical examiner records, death certificates (from SOVR) and law enforcement data
Challenge - Obtaining data from local law enforcement
Data from Jan. 1st to Oct.31st 2015 (432 incidents entered into the CTVDRS system)
92 Homicides, 298 Suicides, 41 Undetermined Intent, and 1 Unintentional<br>
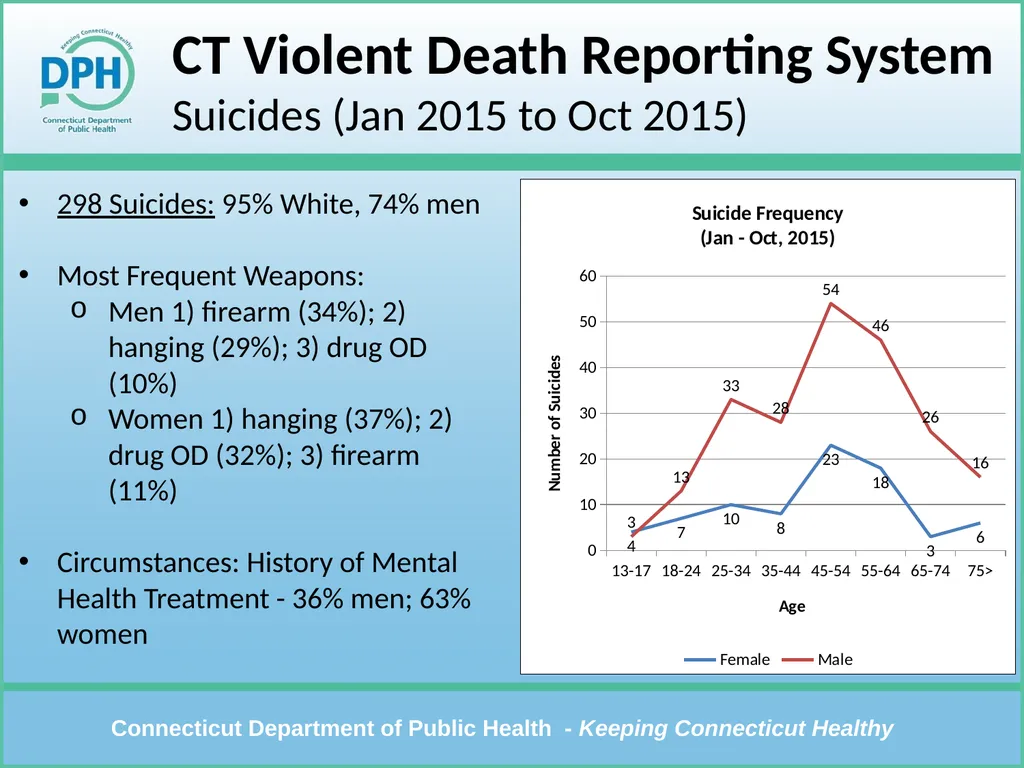
slide3. CT Violent Death Reporting System Suicides (Jan 2015 to Oct 2015) 298 Suicides: 95% White, 74% men
Most Frequent Weapons:
Men 1) firearm (34%); 2) hanging (29%); 3) drug OD (10%)
Women 1) hanging (37%); 2) drug OD (32%); 3) firearm (11%)
Circumstances: History of Mental Health Treatment - 36% men; 63% women<br>
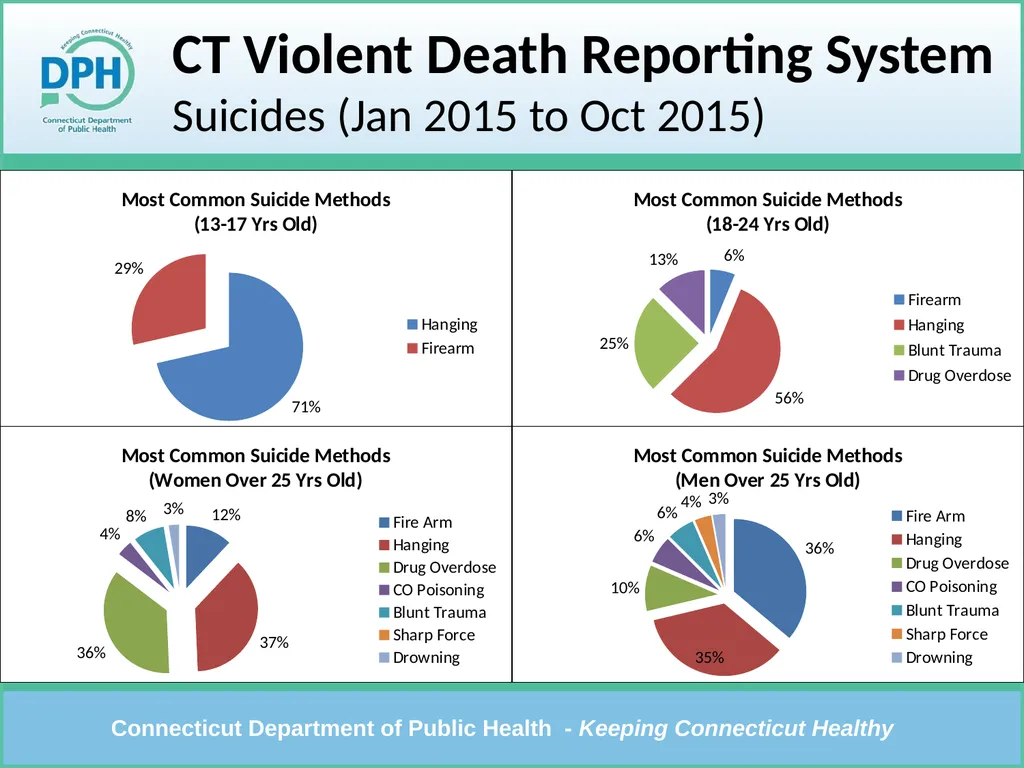
slide4. CT Violent Death Reporting SystemSuicides (Jan 2015 to Oct 2015)<br>
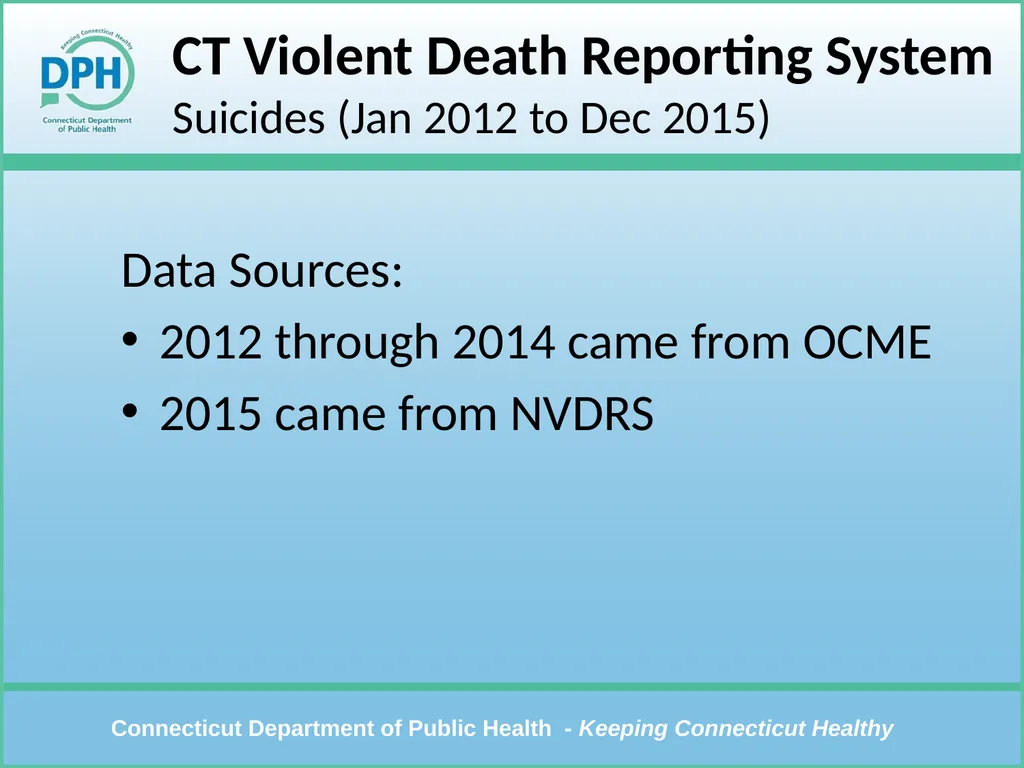
slide5. CT Violent Death Reporting SystemSuicides (Jan 2012 to Dec 2015) Data Sources:
2012 through 2014 came from OCME
2015 came from NVDRS<br>
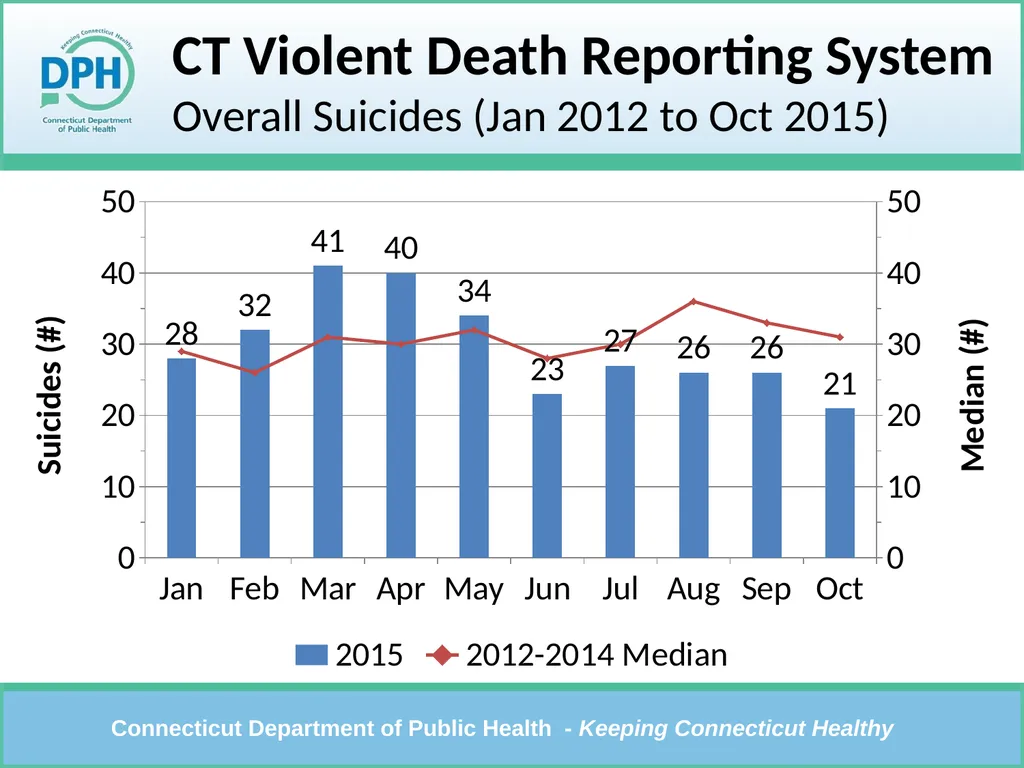
slide6. CT Violent Death Reporting SystemOverall Suicides (Jan 2012 to Oct 2015)<br>
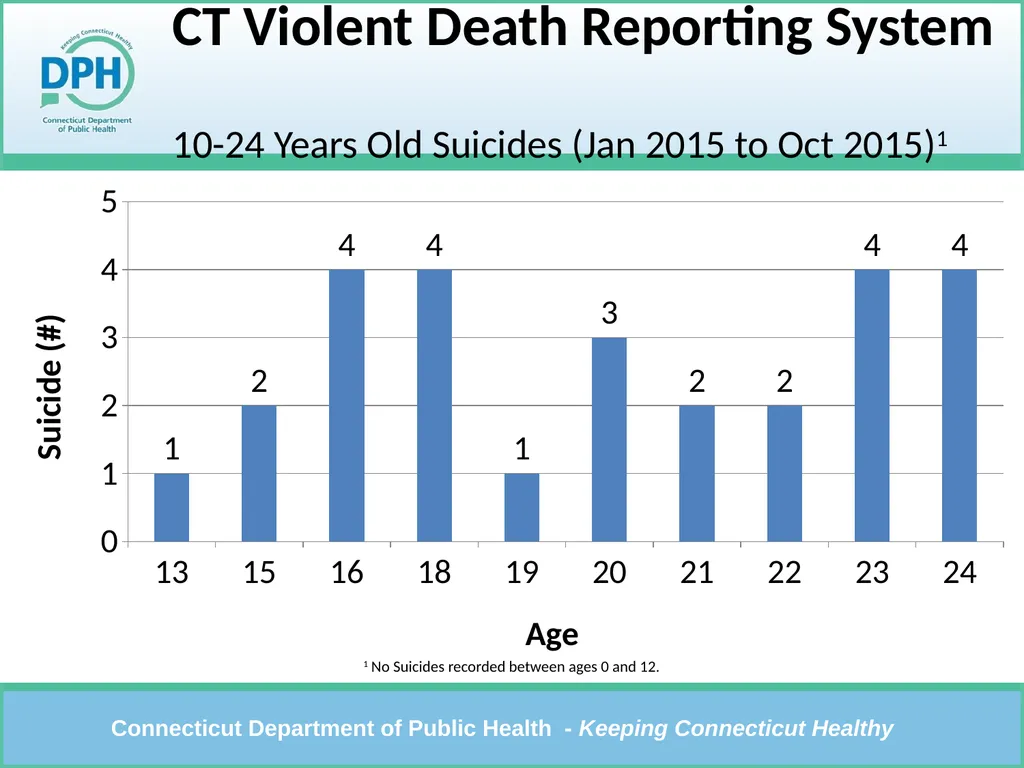
slide7. CT Violent Death Reporting System 10-24 Years Old Suicides (Jan 2015 to Oct 2015)1 1 No Suicides recorded between ages 0 and 12.<br>
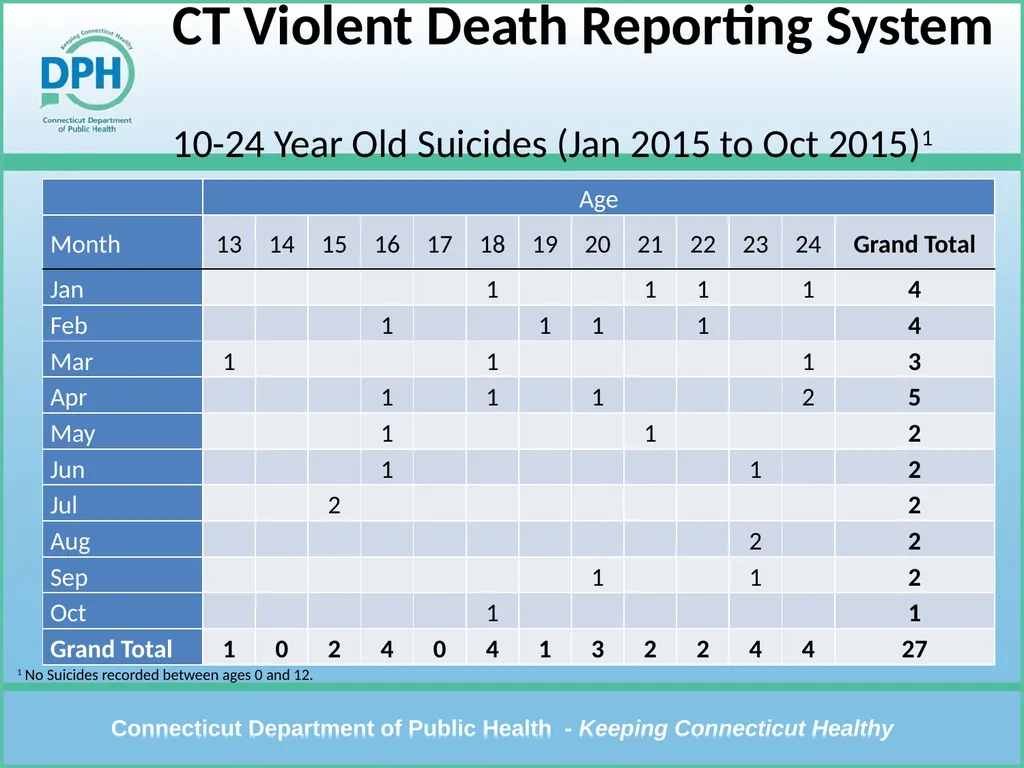
slide8. CT Violent Death Reporting System 10-24 Year Old Suicides (Jan 2015 to Oct 2015)1 1 No Suicides recorded between ages 0 and 12.<br>
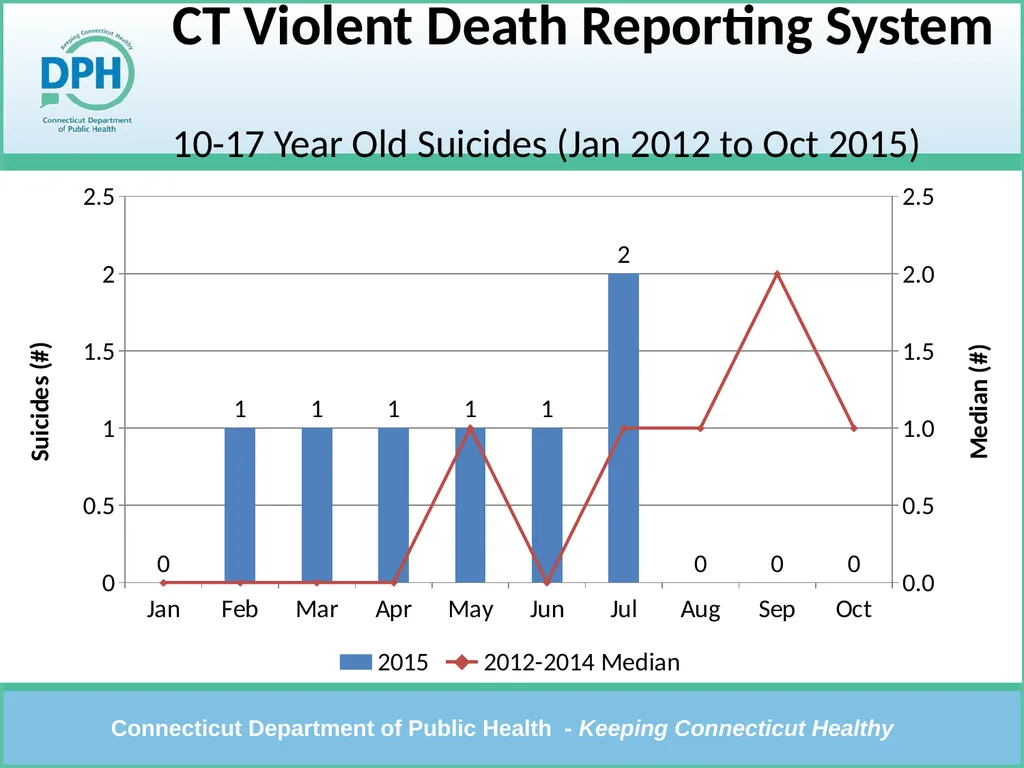
slide9. CT Violent Death Reporting System 10-17 Year Old Suicides (Jan 2012 to Oct 2015)<br>
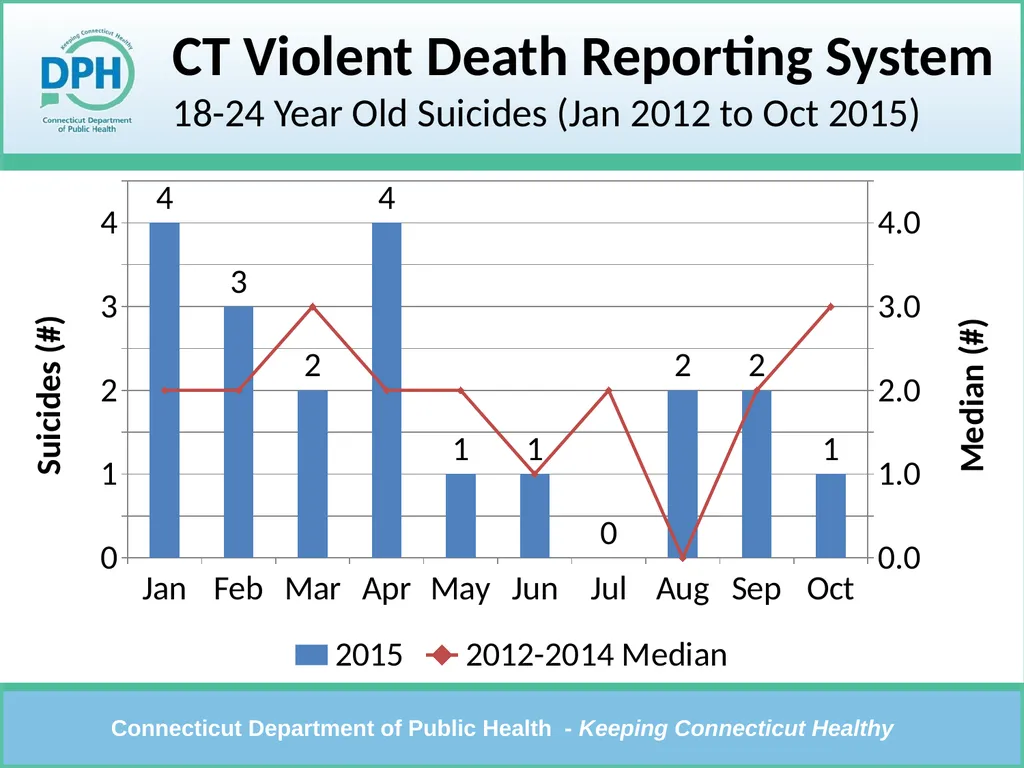
slide10. CT Violent Death Reporting System18-24 Year Old Suicides (Jan 2012 to Oct 2015)<br>
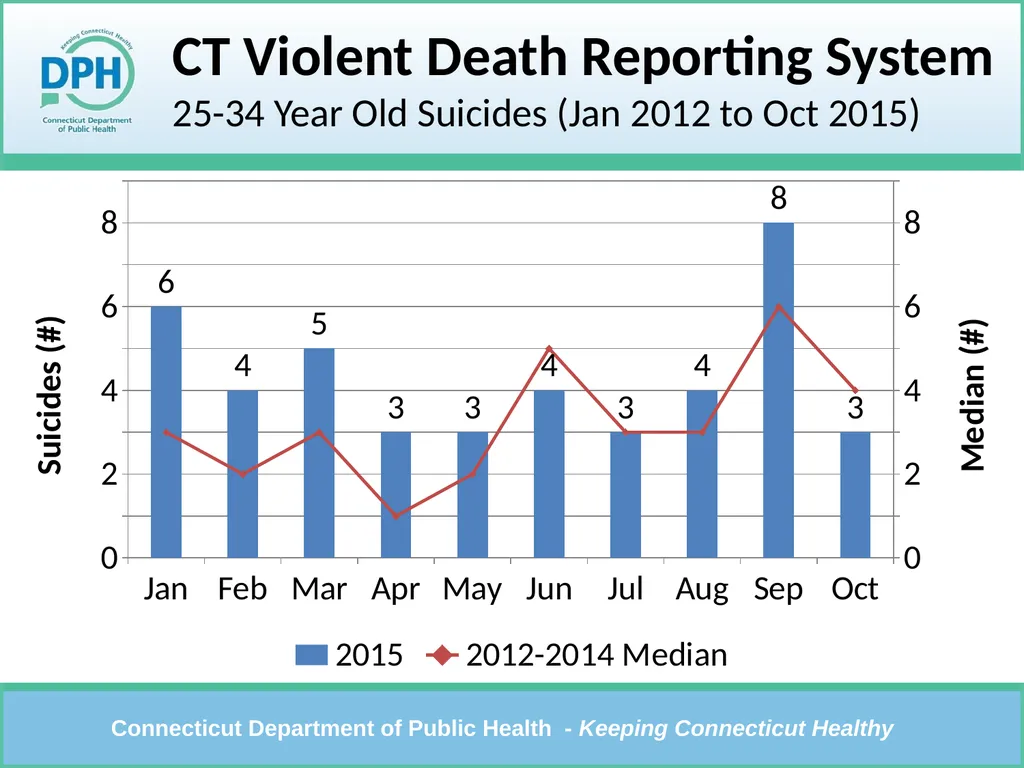
slide11. CT Violent Death Reporting System25-34 Year Old Suicides (Jan 2012 to Oct 2015)<br>
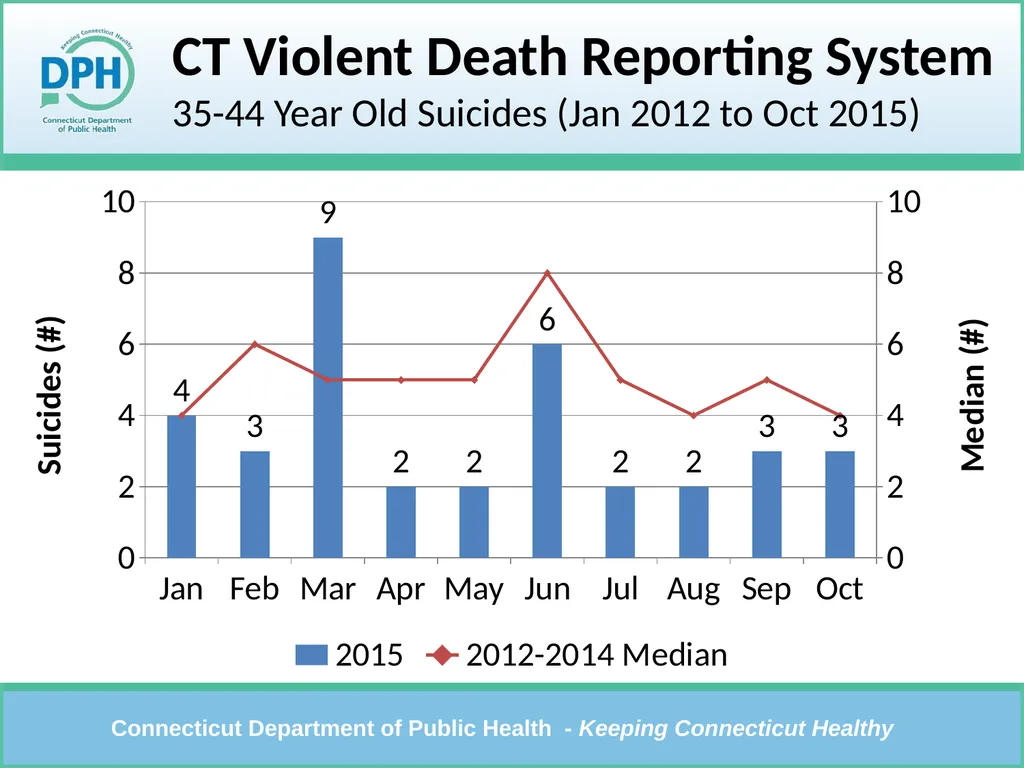
slide12. CT Violent Death Reporting System35-44 Year Old Suicides (Jan 2012 to Oct 2015)<br>
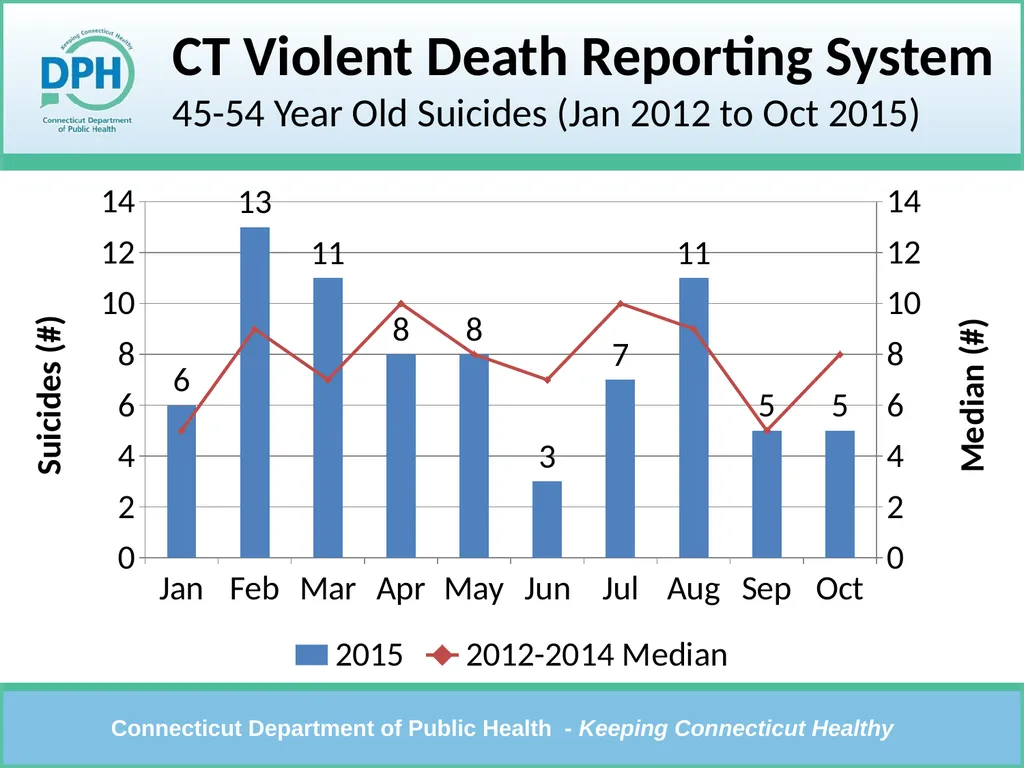
slide13. CT Violent Death Reporting System45-54 Year Old Suicides (Jan 2012 to Oct 2015)<br>
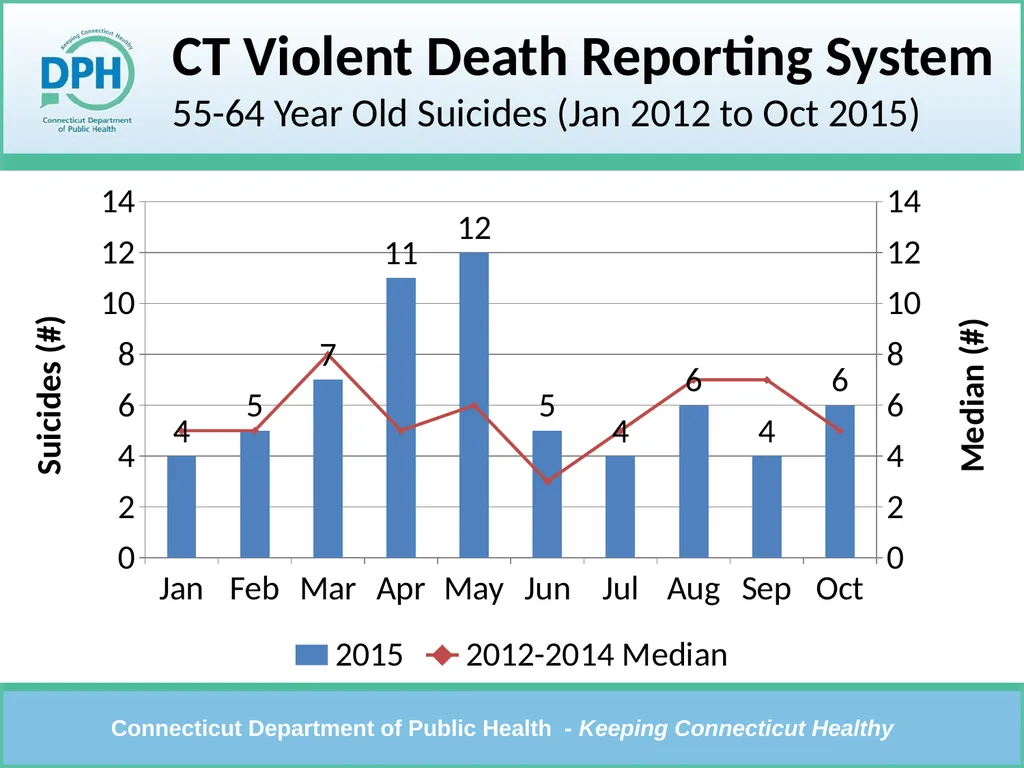
slide14. CT Violent Death Reporting System55-64 Year Old Suicides (Jan 2012 to Oct 2015)<br>
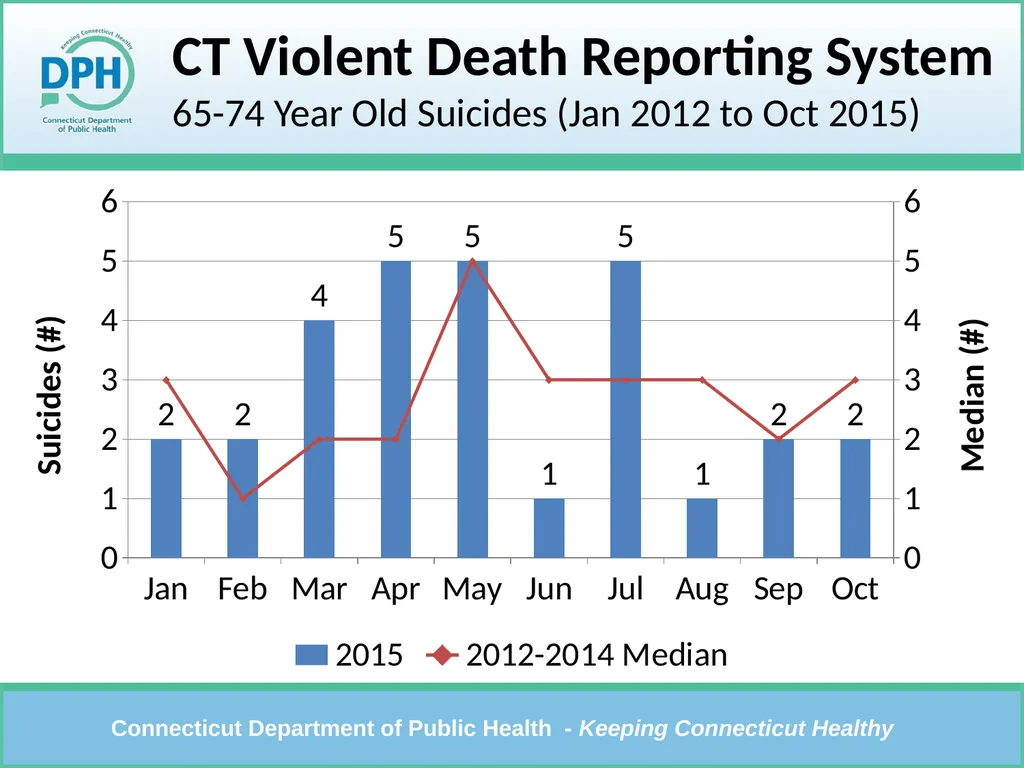
slide15. CT Violent Death Reporting System65-74 Year Old Suicides (Jan 2012 to Oct 2015)<br>
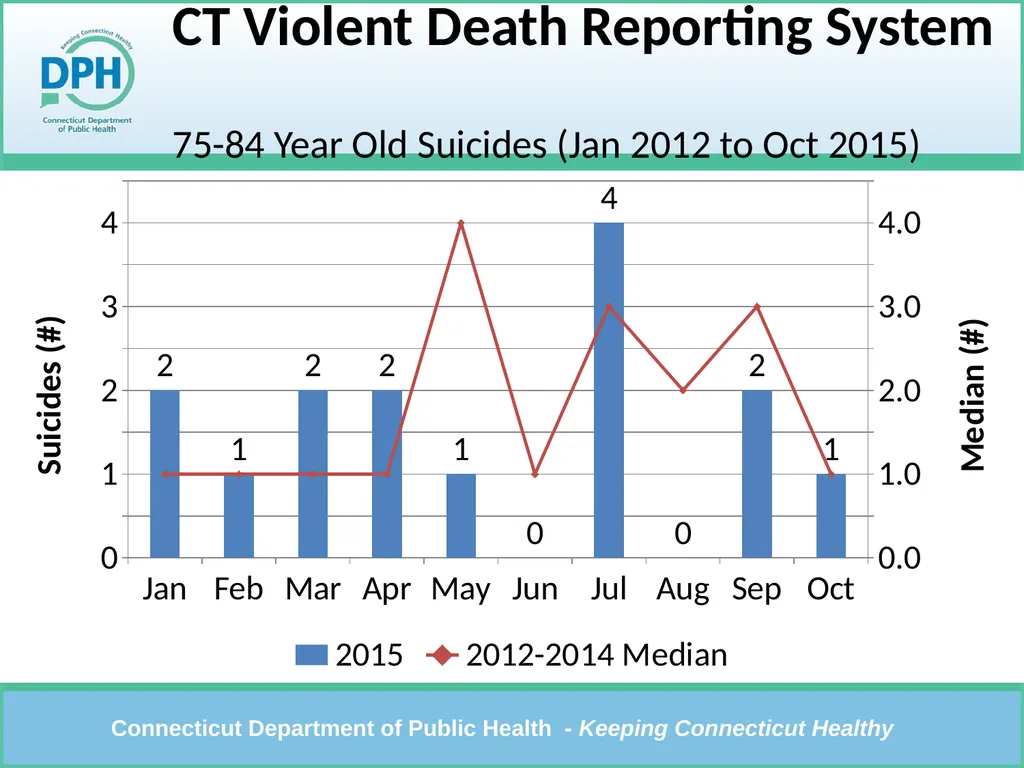
slide16. CT Violent Death Reporting System 75-84 Year Old Suicides (Jan 2012 to Oct 2015)<br>
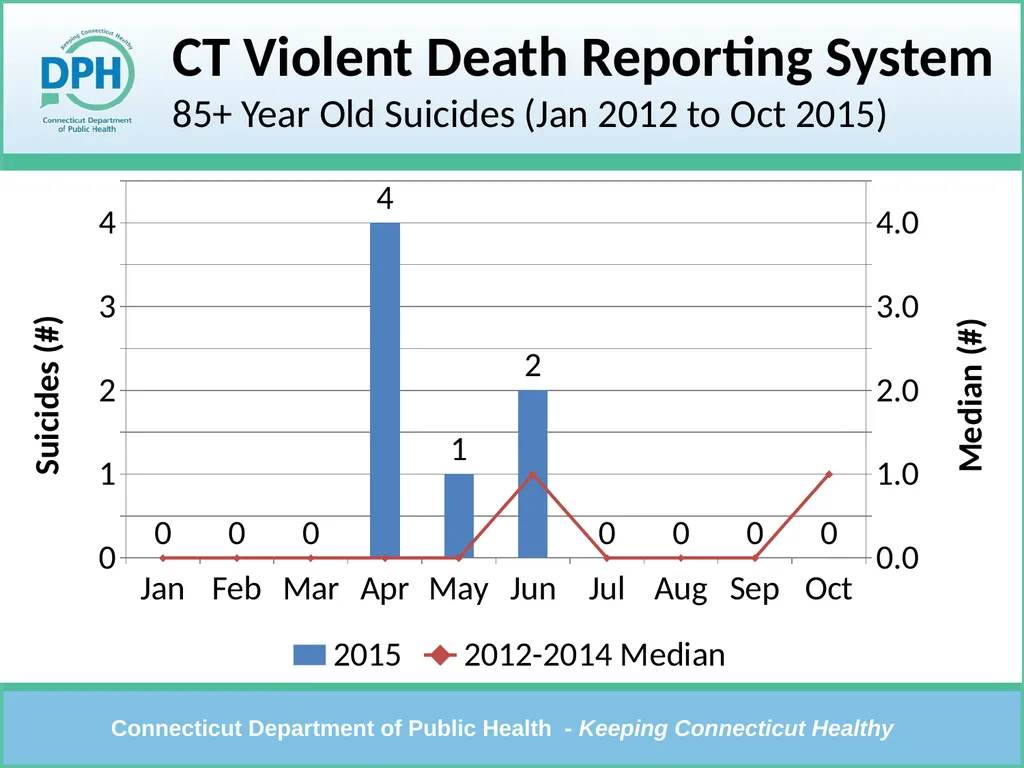
slide17. CT Violent Death Reporting System85+ Year Old Suicides (Jan 2012 to Oct 2015)<br>
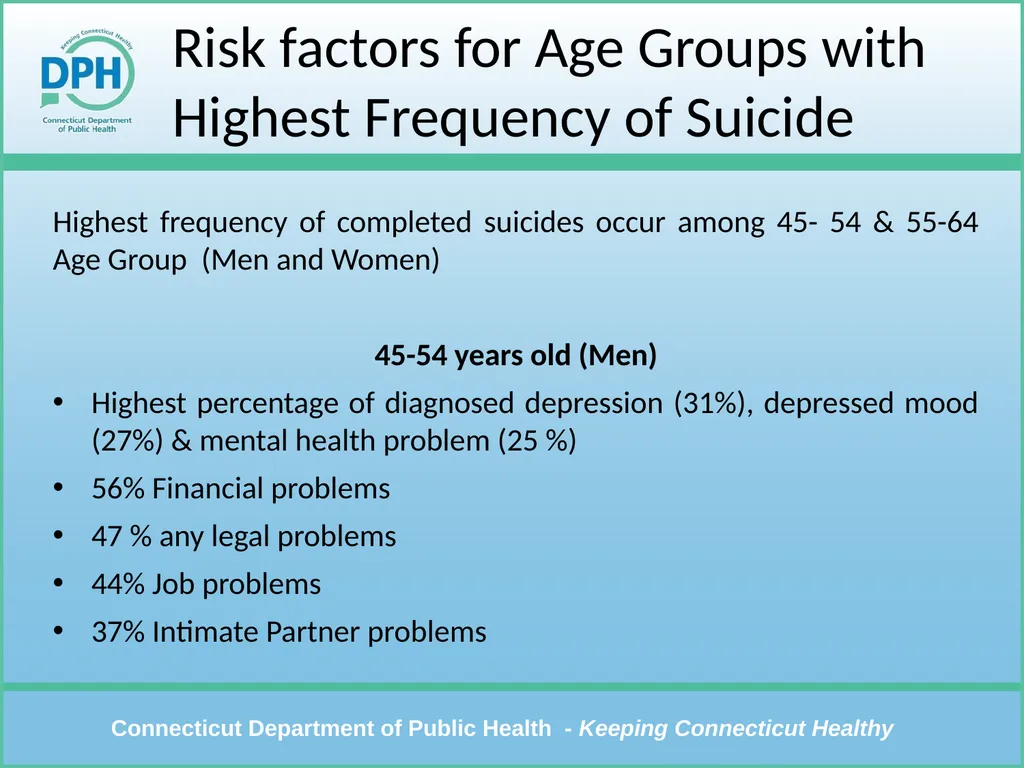
slide18. Risk factors for Age Groups with Highest Frequency of Suicide Highest frequency of completed suicides occur among 45- 54 & 55-64 Age Group (Men and Women)
45-54 years old (Men)
Highest percentage of diagnosed depression (31%), depressed mood (27%) & mental health problem (25 %)
56% Financial problems
47 % any legal problems
44% Job problems
37% Intimate Partner problems<br>
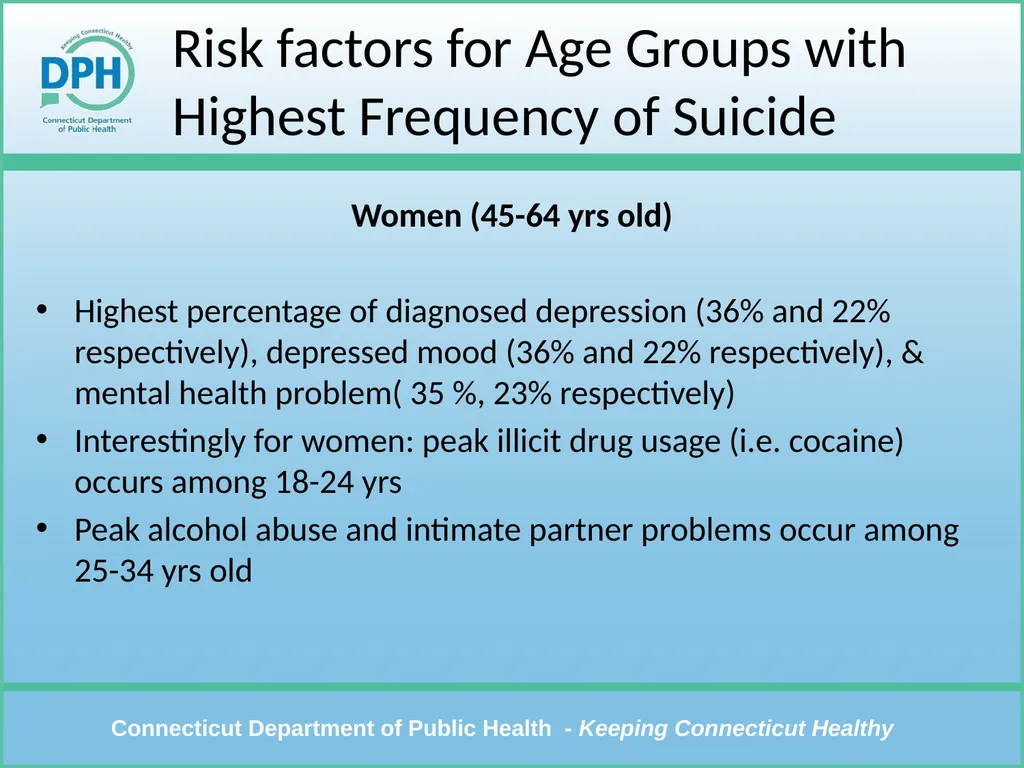
slide19. Risk factors for Age Groups with Highest Frequency of Suicide Women (45-64 yrs old)
Highest percentage of diagnosed depression (36% and 22% respectively), depressed mood (36% and 22% respectively), & mental health problem( 35 %, 23% respectively)
Interestingly for women: peak illicit drug usage (i.e. cocaine) occurs among 18-24 yrs
Peak alcohol abuse and intimate partner problems occur among 25-34 yrs old<br>
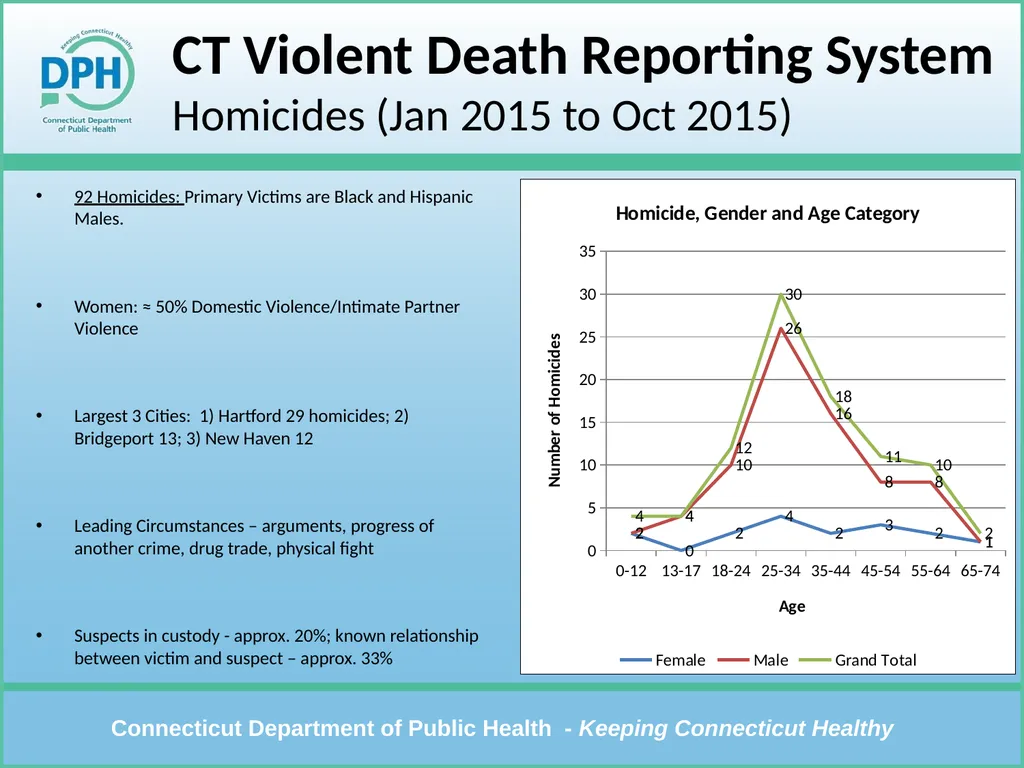
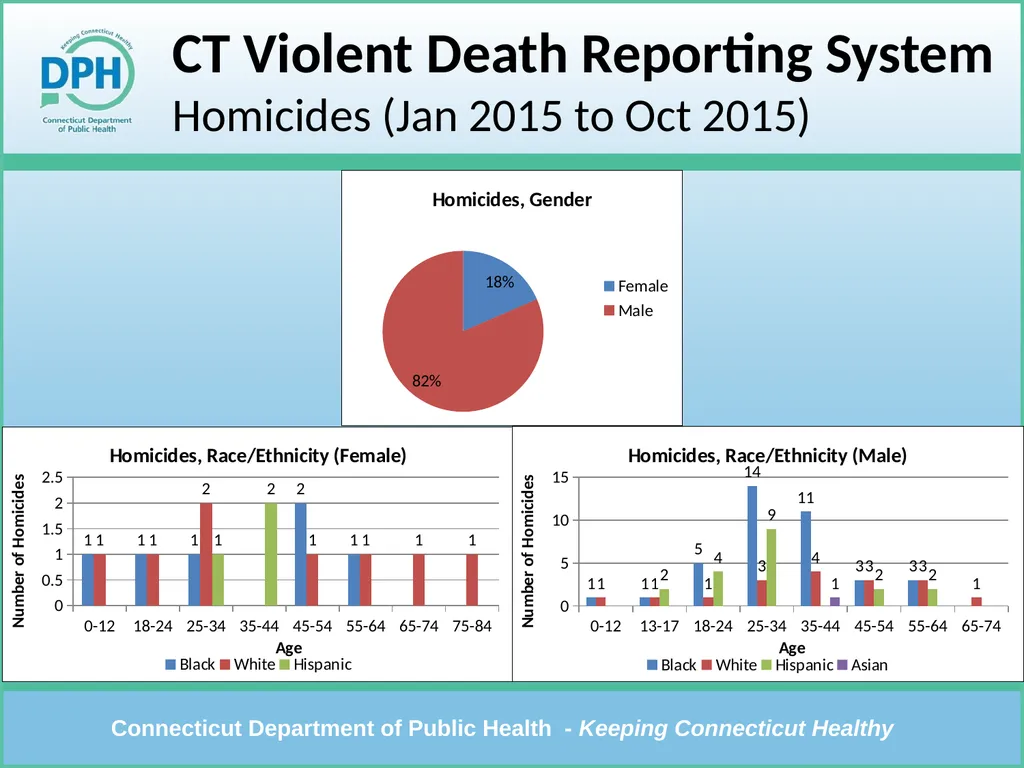
slide20. CT Violent Death Reporting SystemHomicides (Jan 2015 to Oct 2015) 92 Homicides: Primary Victims are Black and Hispanic Males.

Women: ≈ 50% Domestic Violence/Intimate Partner Violence
Largest 3 Cities: 1) Hartford 29 homicides; 2) Bridgeport 13; 3) New Haven 12
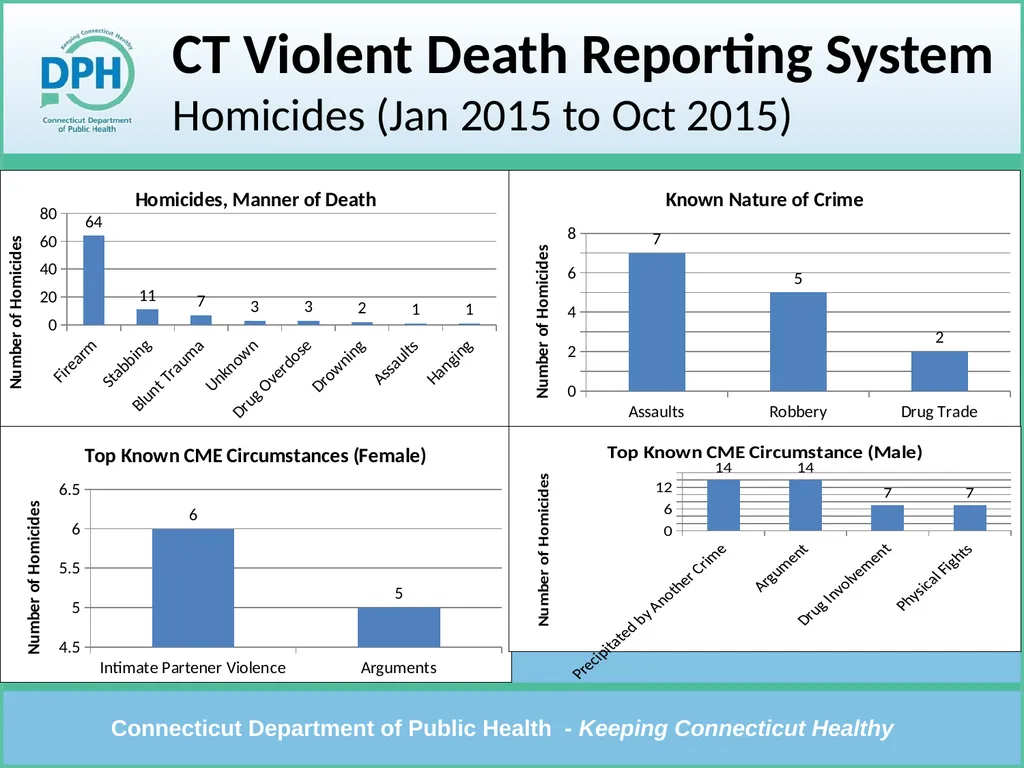
Leading Circumstances – arguments, progress of another crime, drug trade, physical fight
Suspects in custody - approx. 20%; known relationship between victim and suspect – approx. 33%<br>
slide21. CT Violent Death Reporting SystemHomicides (Jan 2015 to Oct 2015)<br>
slide22. CT Violent Death Reporting SystemHomicides (Jan 2015 to Oct 2015)<br>
slide23. CT Violent Death Reporting System Thank you.<br>
slide2. CT Violent Death Reporting SystemOverview National Violent Death Surveillance System
Connecticut Violent Death Surveillance System (CTVDRS)
Data collection and analysis of violent death data
Violent cases - Homicides, suicides, undetermined intent, accidental firearm
Primary data sources are medical examiner records, death certificates (from SOVR) and law enforcement data
Challenge - Obtaining data from local law enforcement
Data from Jan. 1st to Oct.31st 2015 (432 incidents entered into the CTVDRS system)
92 Homicides, 298 Suicides, 41 Undetermined Intent, and 1 Unintentional<br>
slide3. CT Violent Death Reporting System Suicides (Jan 2015 to Oct 2015) 298 Suicides: 95% White, 74% men
Most Frequent Weapons:
Men 1) firearm (34%); 2) hanging (29%); 3) drug OD (10%)
Women 1) hanging (37%); 2) drug OD (32%); 3) firearm (11%)
Circumstances: History of Mental Health Treatment - 36% men; 63% women<br>
slide4. CT Violent Death Reporting SystemSuicides (Jan 2015 to Oct 2015)<br>
slide5. CT Violent Death Reporting SystemSuicides (Jan 2012 to Dec 2015) Data Sources:
2012 through 2014 came from OCME
2015 came from NVDRS<br>
slide6. CT Violent Death Reporting SystemOverall Suicides (Jan 2012 to Oct 2015)<br>
slide7. CT Violent Death Reporting System 10-24 Years Old Suicides (Jan 2015 to Oct 2015)1 1 No Suicides recorded between ages 0 and 12.<br>
slide8. CT Violent Death Reporting System 10-24 Year Old Suicides (Jan 2015 to Oct 2015)1 1 No Suicides recorded between ages 0 and 12.<br>
slide9. CT Violent Death Reporting System 10-17 Year Old Suicides (Jan 2012 to Oct 2015)<br>
slide10. CT Violent Death Reporting System18-24 Year Old Suicides (Jan 2012 to Oct 2015)<br>
slide11. CT Violent Death Reporting System25-34 Year Old Suicides (Jan 2012 to Oct 2015)<br>
slide12. CT Violent Death Reporting System35-44 Year Old Suicides (Jan 2012 to Oct 2015)<br>
slide13. CT Violent Death Reporting System45-54 Year Old Suicides (Jan 2012 to Oct 2015)<br>
slide14. CT Violent Death Reporting System55-64 Year Old Suicides (Jan 2012 to Oct 2015)<br>
slide15. CT Violent Death Reporting System65-74 Year Old Suicides (Jan 2012 to Oct 2015)<br>
slide16. CT Violent Death Reporting System 75-84 Year Old Suicides (Jan 2012 to Oct 2015)<br>
slide17. CT Violent Death Reporting System85+ Year Old Suicides (Jan 2012 to Oct 2015)<br>
slide18. Risk factors for Age Groups with Highest Frequency of Suicide Highest frequency of completed suicides occur among 45- 54 & 55-64 Age Group (Men and Women)
45-54 years old (Men)
Highest percentage of diagnosed depression (31%), depressed mood (27%) & mental health problem (25 %)
56% Financial problems
47 % any legal problems
44% Job problems
37% Intimate Partner problems<br>
slide19. Risk factors for Age Groups with Highest Frequency of Suicide Women (45-64 yrs old)
Highest percentage of diagnosed depression (36% and 22% respectively), depressed mood (36% and 22% respectively), & mental health problem( 35 %, 23% respectively)
Interestingly for women: peak illicit drug usage (i.e. cocaine) occurs among 18-24 yrs
Peak alcohol abuse and intimate partner problems occur among 25-34 yrs old<br>
slide20. CT Violent Death Reporting SystemHomicides (Jan 2015 to Oct 2015) 92 Homicides: Primary Victims are Black and Hispanic Males.
Women: ≈ 50% Domestic Violence/Intimate Partner Violence
Largest 3 Cities: 1) Hartford 29 homicides; 2) Bridgeport 13; 3) New Haven 12
Leading Circumstances – arguments, progress of another crime, drug trade, physical fight
Suspects in custody - approx. 20%; known relationship between victim and suspect – approx. 33%<br>
slide21. CT Violent Death Reporting SystemHomicides (Jan 2015 to Oct 2015)<br>
slide22. CT Violent Death Reporting SystemHomicides (Jan 2015 to Oct 2015)<br>
slide23. CT Violent Death Reporting System Thank you.<br>