
Data Analytics What is Data Analytics Data
LO
Published · 48 slides · 0 views
1 / 1

Description
Data Analytics What is Data Analytics Data analytics is the process of manipulating data to extract useful trends and hidden patterns which can help us derive valuable insights to make business predictions. Use of Data Analytics Improved
Related Topics
Share
Embed code
Download this presentation From Below
"Data Analytics What is Data Analytics Data" is the property of its rightful owner. Permission is granted to download and print the materials on this website for personal, non-commercial use only, and to display it on your personal computer provided you do not modify the materials and that you retain all copyright notices contained in the materials. By downloading content from our website, you accept the terms of this agreement.
Presentation Transcript
01
Data Analytics<br>
02
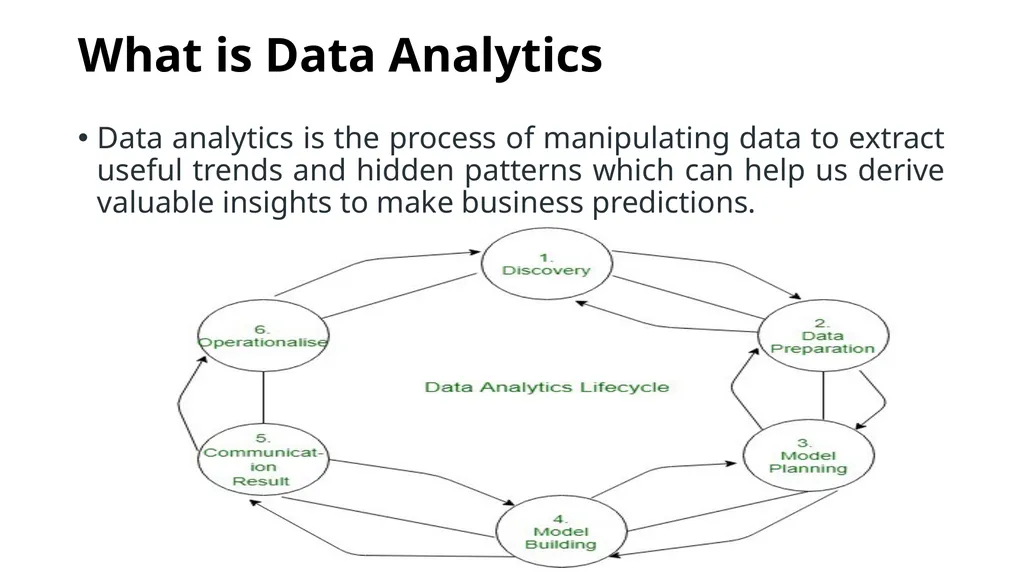
What is Data Analytics Data analytics is the process of manipulating data to extract useful trends and hidden patterns which can help us derive valuable insights to make business predictions.<br>
03
Use of Data Analytics Improved Decision-Making
Better Customer Service
Efficient Operations
Effective Marketing<br>
Better Customer Service
Efficient Operations
Effective Marketing<br>
04
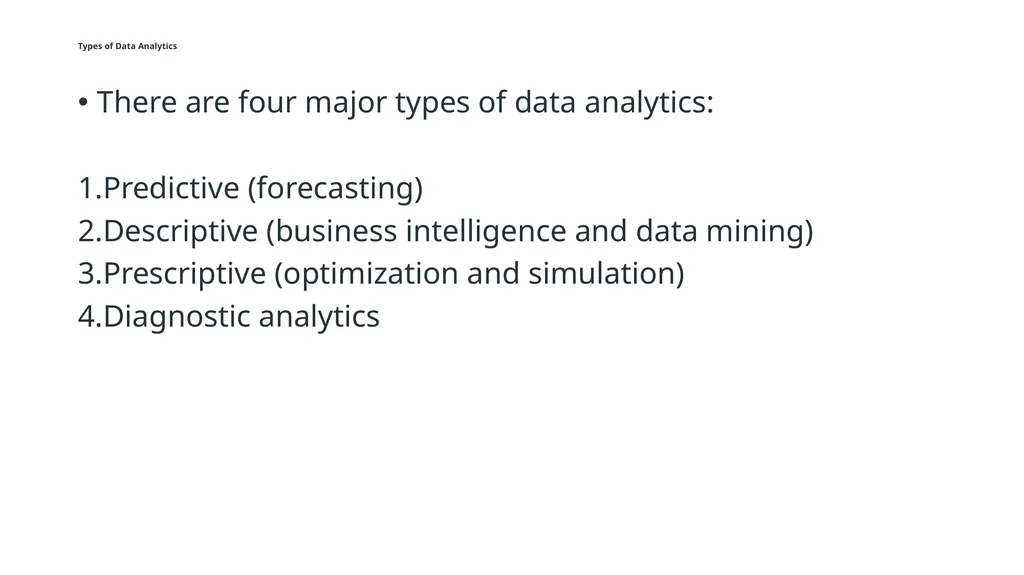
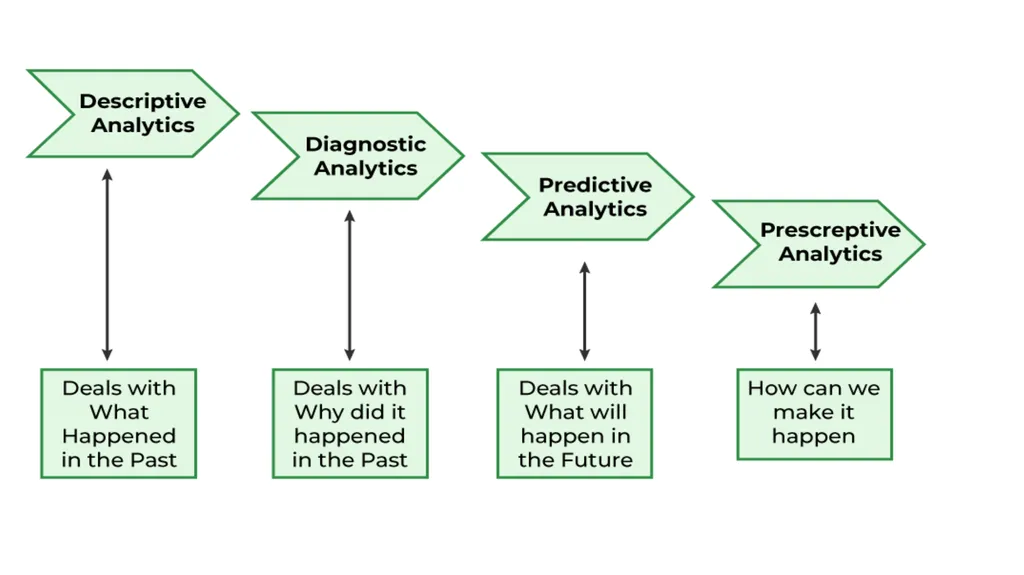
Types of Data Analytics There are four major types of data analytics:
Predictive (forecasting)
Descriptive (business intelligence and data mining)
Prescriptive (optimization and simulation)
Diagnostic analytics<br>
Predictive (forecasting)
Descriptive (business intelligence and data mining)
Prescriptive (optimization and simulation)
Diagnostic analytics<br>
05
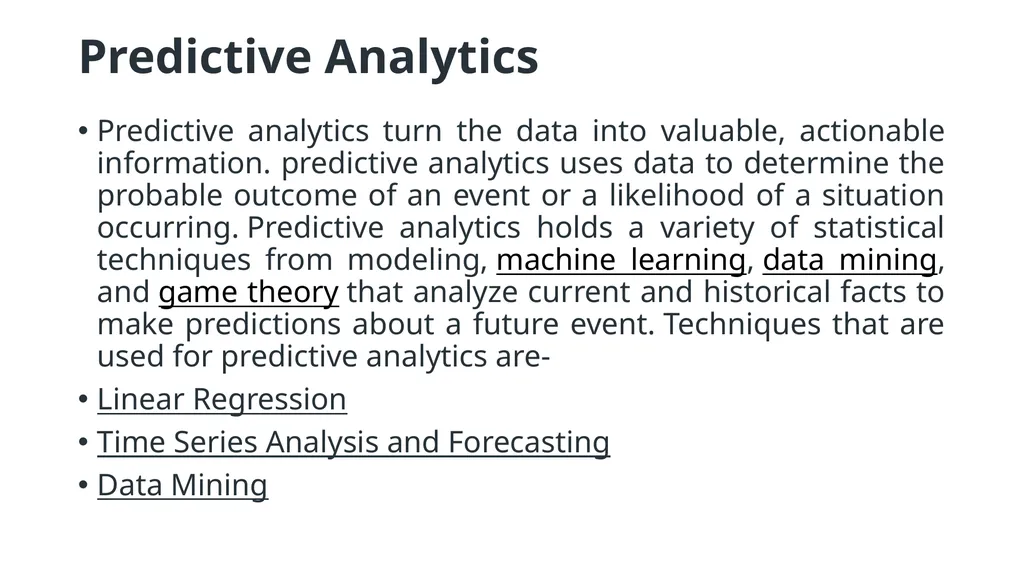
Predictive Analytics Predictive analytics turn the data into valuable, actionable information. predictive analytics uses data to determine the probable outcome of an event or a likelihood of a situation occurring. Predictive analytics holds a variety of statistical techniques from modeling, machine learning, data mining, and game theory that analyze current and historical facts to make predictions about a future event. Techniques that are used for predictive analytics are-
Linear Regression
Time Series Analysis and Forecasting
Data Mining<br>
Linear Regression
Time Series Analysis and Forecasting
Data Mining<br>
06
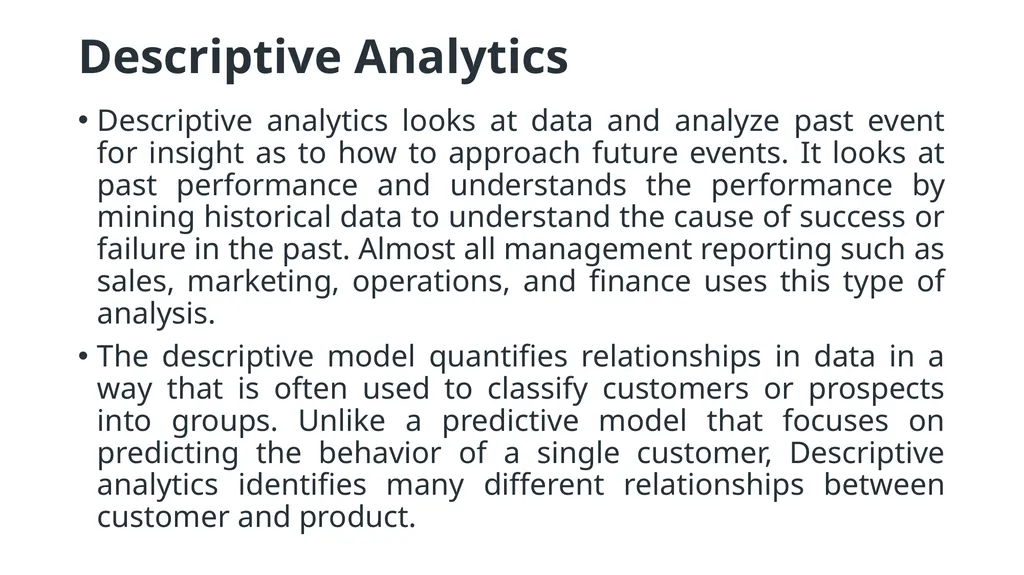
Descriptive Analytics Descriptive analytics looks at data and analyze past event for insight as to how to approach future events. It looks at past performance and understands the performance by mining historical data to understand the cause of success or failure in the past. Almost all management reporting such as sales, marketing, operations, and finance uses this type of analysis.
The descriptive model quantifies relationships in data in a way that is often used to classify customers or prospects into groups. Unlike a predictive model that focuses on predicting the behavior of a single customer, Descriptive analytics identifies many different relationships between customer and product.<br>
The descriptive model quantifies relationships in data in a way that is often used to classify customers or prospects into groups. Unlike a predictive model that focuses on predicting the behavior of a single customer, Descriptive analytics identifies many different relationships between customer and product.<br>
07
Examples Descriptive analytics are company reports that provide historic reviews like:
Data Queries
Reports
Descriptive Statistics
Data dashboard<br>
Data Queries
Reports
Descriptive Statistics
Data dashboard<br>
08
Prescriptive Analytics Prescriptive Analytics automatically synthesize big data, mathematical science, business rule, and machine learning to make a prediction and then suggests a decision option to take advantage of the prediction.
Prescriptive Analytics not only anticipates what will happen and when to happen but also why it will happen. Further, Prescriptive Analytics can suggest decision options on how to take advantage of a future opportunity or mitigate a future risk and illustrate the implication of each decision option.<br>
Prescriptive Analytics not only anticipates what will happen and when to happen but also why it will happen. Further, Prescriptive Analytics can suggest decision options on how to take advantage of a future opportunity or mitigate a future risk and illustrate the implication of each decision option.<br>
09
Examples Prescriptive Analytics can benefit healthcare strategic planning by using analytics to leverage operational and usage data combined with data of external factors such as economic data, population demography, etc<br>
10
Diagnostic Analytics We generally use historical data over other data to answer any question or for the solution of any problem. We try to find any dependency and pattern in the historical data of the particular problem.<br>
11
Example Companies go for this analysis because it gives a great insight into a problem, and they also keep detailed information about their disposal otherwise data collection may turn out individual for every problem and it will be very time-consuming. Common techniques used for Diagnostic Analytics are:
Data discovery
Data mining
Correlations<br>
Data discovery
Data mining
Correlations<br>
12
Future Scope of Data Analytics Retail
Healthcare
Finance
Marketing:
Manufacturing
Transportation<br>
Healthcare
Finance
Marketing:
Manufacturing
Transportation<br>
13
Data Gathering and Preparation<br>
14
What is Data Collection Data Collection is the process of collecting information from relevant sources in order to find a solution to the given statistical enquiry. Collection of Data is the first and foremost step in a statistical investigation.
statistical enquiry means an investigation made by any agency on a topic in which the investigator collects the relevant quantitative information. In simple terms, a statistical enquiry is the search of truth by using statistical methods of collection, compiling, analysis, interpretation, etc. The basic problem for any statistical enquiry is the collection of facts and figures related to this specific phenomenon that is being studied. Therefore, the basic purpose of data collection is collecting evidence to reach a sound and clear solution to a problem.<br>
statistical enquiry means an investigation made by any agency on a topic in which the investigator collects the relevant quantitative information. In simple terms, a statistical enquiry is the search of truth by using statistical methods of collection, compiling, analysis, interpretation, etc. The basic problem for any statistical enquiry is the collection of facts and figures related to this specific phenomenon that is being studied. Therefore, the basic purpose of data collection is collecting evidence to reach a sound and clear solution to a problem.<br>
15
Important Terms related to Data Collection 1. Investigator: An investigator is a person who conducts the statistical enquiry.
2. Enumerators: In order to collect information for statistical enquiry, an investigator needs the help of some people. These people are known as enumerators.(Enumerators collect census data by doing interviews door-to-door)
3. Respondents: A respondent is a person from whom the statistical information required for the enquiry is collected.
4. Survey: It is a method of collecting information from individuals. The basic purpose of a survey is to collect data to describe different characteristics such as usefulness, quality, price, kindness, etc. It involves asking questions about a product or service from a large number of people<br>
2. Enumerators: In order to collect information for statistical enquiry, an investigator needs the help of some people. These people are known as enumerators.(Enumerators collect census data by doing interviews door-to-door)
3. Respondents: A respondent is a person from whom the statistical information required for the enquiry is collected.
4. Survey: It is a method of collecting information from individuals. The basic purpose of a survey is to collect data to describe different characteristics such as usefulness, quality, price, kindness, etc. It involves asking questions about a product or service from a large number of people<br>
16
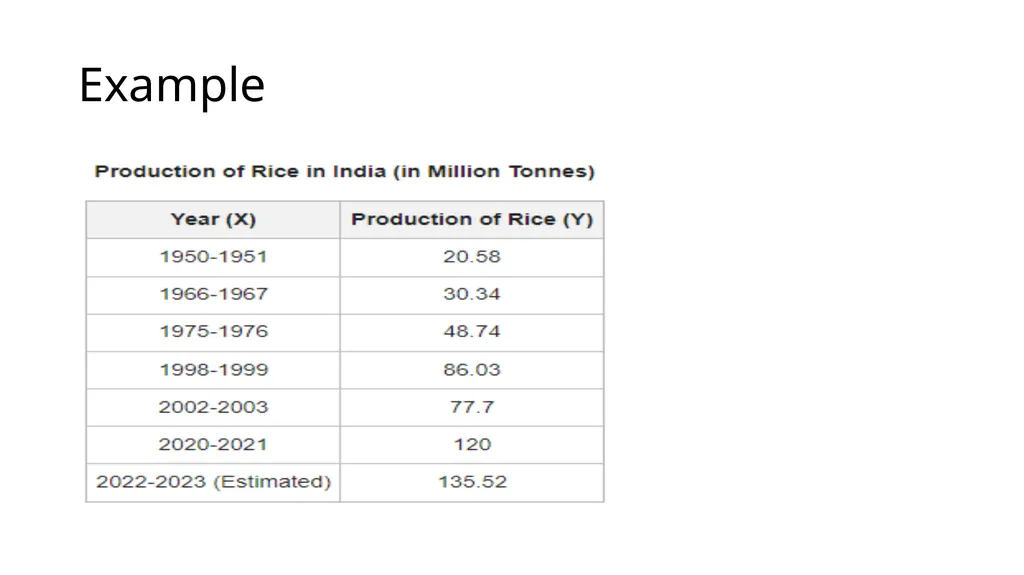
Example<br>
17
Cont.. Data is a tool that helps an investigator in understanding the problem by providing him with the information required. Data can be classified into two types –
Primary Data and Secondary Data. Primary Data is the data collected by the investigator from primary sources for the first time from scratch. However, Secondary Data is the data already in existence that has been previously collected by someone else for other purposes. It does not include any real-time data as the research has already been done on that information.<br>
Primary Data and Secondary Data. Primary Data is the data collected by the investigator from primary sources for the first time from scratch. However, Secondary Data is the data already in existence that has been previously collected by someone else for other purposes. It does not include any real-time data as the research has already been done on that information.<br>
18
Methods for Primary Data Collection Direct Personal Investigation - Personal investigation involves collecting data personally from the source of origin.
Example - Direct contact with the household women to obtain information about their daily routine and schedule
Indirect Oral Investigation - The investigator does not make direct contact with the person from whom he/she needs information.
Example- Collecting data of employees from their superiors or managers<br>
Example - Direct contact with the household women to obtain information about their daily routine and schedule
Indirect Oral Investigation - The investigator does not make direct contact with the person from whom he/she needs information.
Example- Collecting data of employees from their superiors or managers<br>
19
Cont.. Information from Local Sources or Correspondents - The investigator appoints correspondents or local persons at various places, which are then furnished by them to the investigator. With the help of correspondents and local persons, the investigators can cover a wide area.
Information through Questionnaires and Schedules - the investigator, while keeping in mind the motive of the study, prepares a questionnaire. The investigator can collect data through the questionnaire in two ways:<br>
Information through Questionnaires and Schedules - the investigator, while keeping in mind the motive of the study, prepares a questionnaire. The investigator can collect data through the questionnaire in two ways:<br>
20
Methods of Collecting Secondary Data Published Source
Government Publications
Examples - Government publications on Statistics are the Annual Survey of Industries, Statistical Abstract of India, etc.
Semi-Government Publications
Examples - Semi-government bodies are Metropolitan Councils, Municipalities, etc
Publications of Trade Associations
Examples - Data published by Sugar Mills Association regarding different sugar mills in India.<br>
Government Publications
Examples - Government publications on Statistics are the Annual Survey of Industries, Statistical Abstract of India, etc.
Semi-Government Publications
Examples - Semi-government bodies are Metropolitan Councils, Municipalities, etc
Publications of Trade Associations
Examples - Data published by Sugar Mills Association regarding different sugar mills in India.<br>
21
Cont. Journals and Papers
International Publications
Publications of Research Institutions<br>
International Publications
Publications of Research Institutions<br>
22
Unpublished Sources Another source of collecting secondary data is unpublished sources. The data in unpublished sources is collected by different government organizations and other organizations. These organizations usually collect data for their self-use and are not published anywhere. For example, research work done by professors, professionals, teachers and records maintained by business and private enterprises.<br>
23
Data Preprocessing Data preprocessing is an important step in the data analytics process. It refers to the cleaning, transforming, and integrating of data in order to make it ready for analysis. The goal of data preprocessing is to improve the quality of the data and to make it more suitable for the specific data analysis task.<br>
24
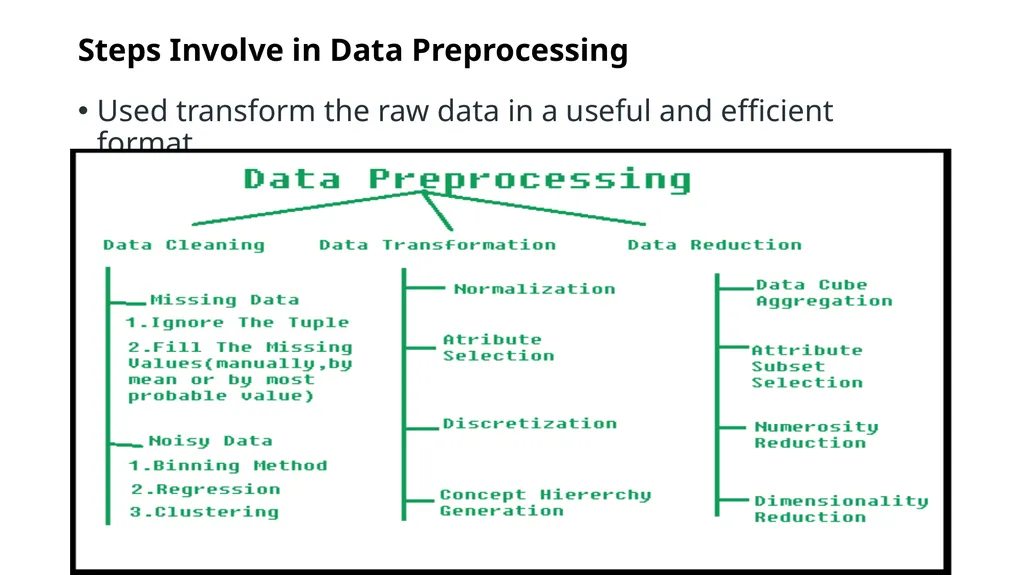
Steps Involve in Data Preprocessing Used transform the raw data in a useful and efficient format.<br>
25
1. Data Cleaning The data can have many irrelevant and missing parts. To handle this part, data cleaning is done. It involves handling of missing data, noisy data etc.<br>
26
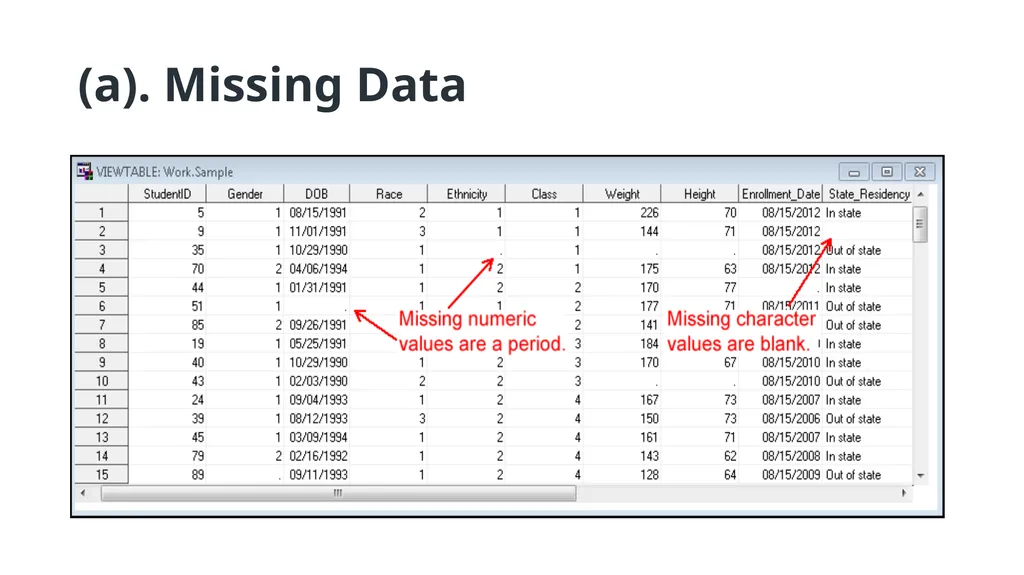
(a). Missing Data<br>
27
Way of Handle Missing Data This situation arises when some data is missing in the data. It can be handled in various ways.
1.Ignore the tuples: This approach is suitable only when the dataset we have is quite large and multiple values are missing within a tuple.
2.Fill the Missing values: There are various ways to do this task. You can choose to fill the missing values manually, by attribute mean or the most probable value<br>
1.Ignore the tuples: This approach is suitable only when the dataset we have is quite large and multiple values are missing within a tuple.
2.Fill the Missing values: There are various ways to do this task. You can choose to fill the missing values manually, by attribute mean or the most probable value<br>
28
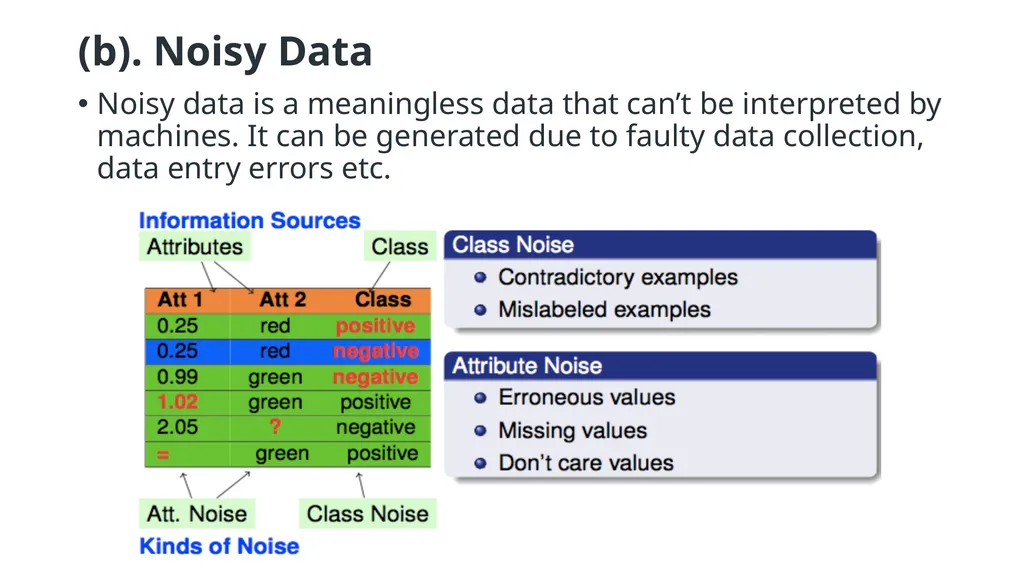
(b). Noisy Data Noisy data is a meaningless data that can’t be interpreted by machines. It can be generated due to faulty data collection, data entry errors etc.<br>
29
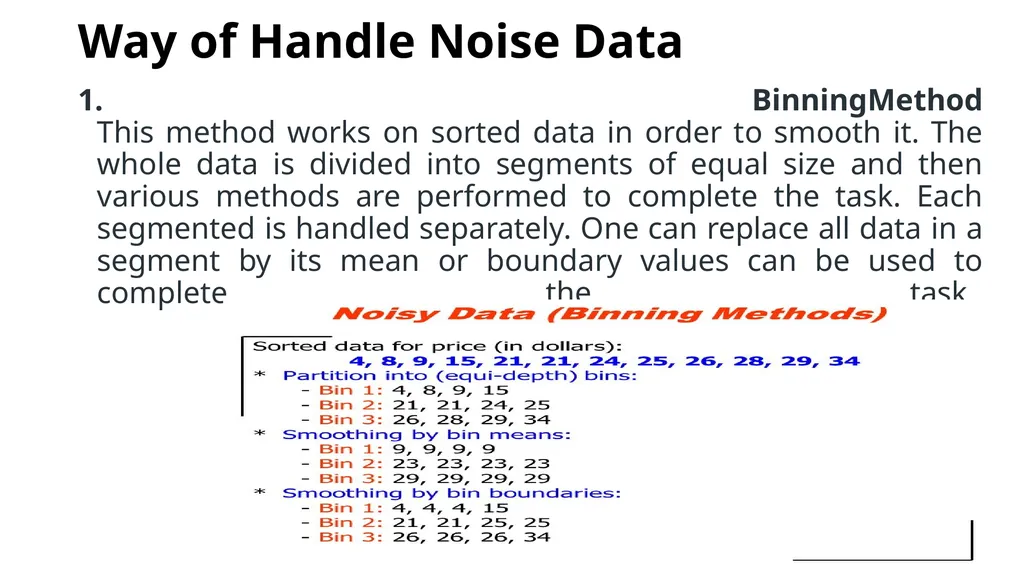
Way of Handle Noise Data BinningMethod
This method works on sorted data in order to smooth it. The whole data is divided into segments of equal size and then various methods are performed to complete the task. Each segmented is handled separately. One can replace all data in a segment by its mean or boundary values can be used to complete the task.<br>
30
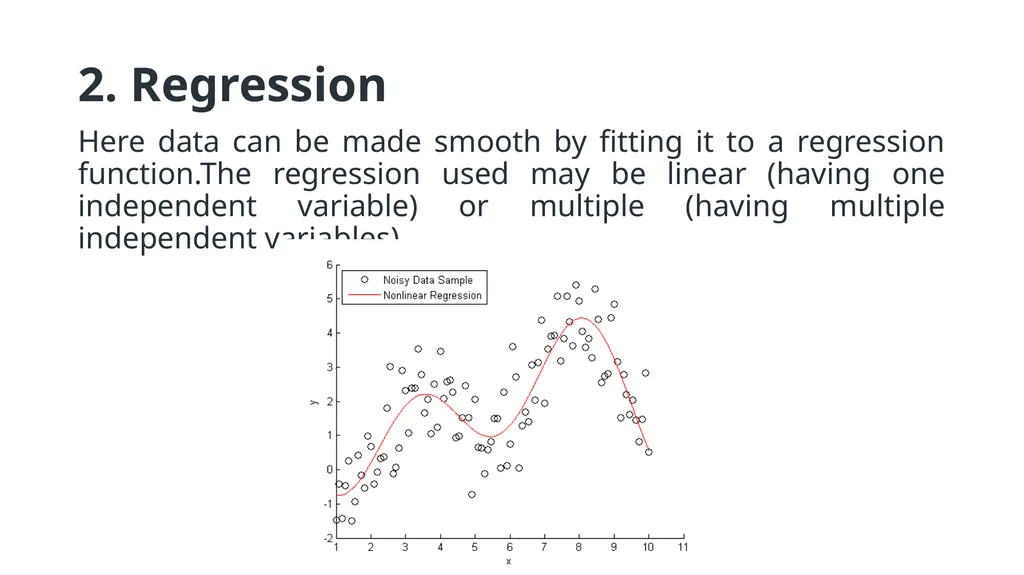
2. Regression Here data can be made smooth by fitting it to a regression function.The regression used may be linear (having one independent variable) or multiple (having multiple independent variables).<br>
31
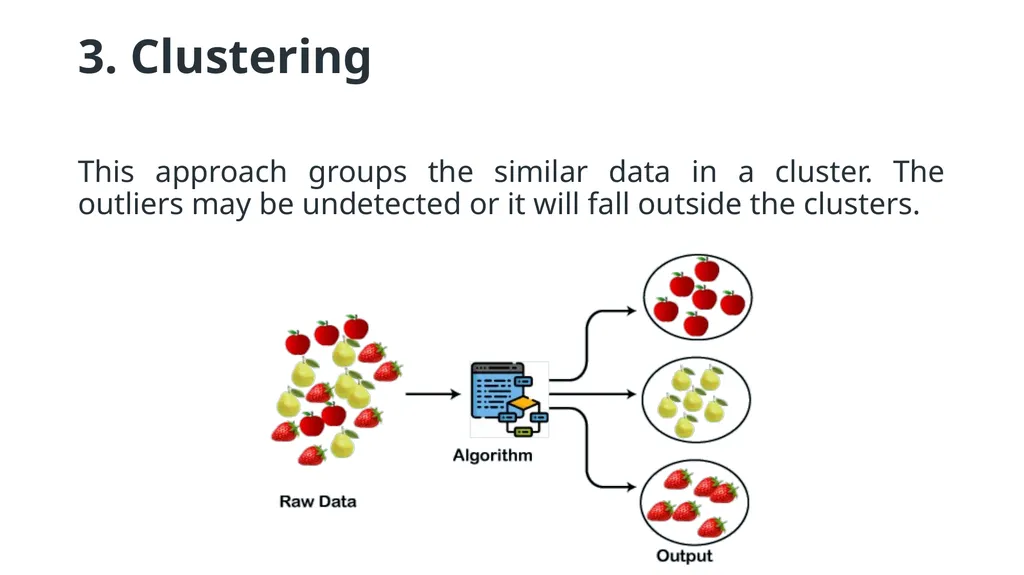
3. Clustering This approach groups the similar data in a cluster. The outliers may be undetected or it will fall outside the clusters.<br>
32
2. Data Transformation This step is taken in order to transform the data in appropriate forms suitable for analysis process. This involves following ways
Normalization: It is done in order to scale the data values in a specified range (-1.0 to 1.0 or 0.0 to 1.0)
Attribute Selection: In this strategy, new attributes are constructed from the given set of attributes to help the mining process.<br>
Normalization: It is done in order to scale the data values in a specified range (-1.0 to 1.0 or 0.0 to 1.0)
Attribute Selection: In this strategy, new attributes are constructed from the given set of attributes to help the mining process.<br>
33
2. Data Transformation This step is taken in order to transform the data in appropriate forms suitable for mining process. This involves following ways:
Normalization: It is done in order to scale the data values in a specified range (-1.0 to 1.0 or 0.0 to 1.0)
Attribute Selection: In this strategy, new attributes are constructed from the given set of attributes to help the mining process.<br>
Normalization: It is done in order to scale the data values in a specified range (-1.0 to 1.0 or 0.0 to 1.0)
Attribute Selection: In this strategy, new attributes are constructed from the given set of attributes to help the mining process.<br>
34
Cont.. Discretization
This is done to replace the raw values of numeric attribute by interval levels or conceptual levels.
Concept Hierarchy Generation
Here attributes are converted from lower level to higher level in hierarchy. For Example-The attribute “city” can be converted to “country”.<br>
This is done to replace the raw values of numeric attribute by interval levels or conceptual levels.
Concept Hierarchy Generation
Here attributes are converted from lower level to higher level in hierarchy. For Example-The attribute “city” can be converted to “country”.<br>
35
3. Data Reduction Data reduction is a crucial step in the data mining process that involves reducing the size of the dataset while preserving the important information. This is done to improve the efficiency of data analysis and to avoid overfitting of the model. Some common steps involved in data reduction are:
Feature Selection
Feature Extraction
Sampling
Clustering
Compression<br>
Feature Selection
Feature Extraction
Sampling
Clustering
Compression<br>
36
What is a Data Format? Data format is the definition of the structure of data within a database or file system that gives the information its meaning. Structured data is usually defined by rows and columns, where columns represent different fields corresponding to, for example, name, address, and phone number, and each field has a defined type, such as integers, floating point numbers, characters, and Boolean. Rows then represent individual records that fill in each column with its corresponding value. Unstructured data includes audio or video objects with a format that can be recognized and played back by software capable of decoding the data from that object.<br>
37
Why is Data Format Important? Source data can come in many different data formats. To run analytics effectively, a data scientist must first convert that source data to a common format for each model to process. With many different data sources and different analytic routines, that data wrangling can take 80 to 90 percent of the time spent on developing a new model. Having a model-driven architecture that simplifies the conversion of the source data to a standard, easy-to-use format ready for analytics reduces the overall time required and allows the data scientist to focus on machine learning model development and the training life cycle.<br>
38
Commonly used file formats in Data Science The file format also tells the computer how to display or process its content.
Common file formats, such as CSV, XLSX, ZIP, TXT, JSON, HTML etc<br>
Common file formats, such as CSV, XLSX, ZIP, TXT, JSON, HTML etc<br>
39
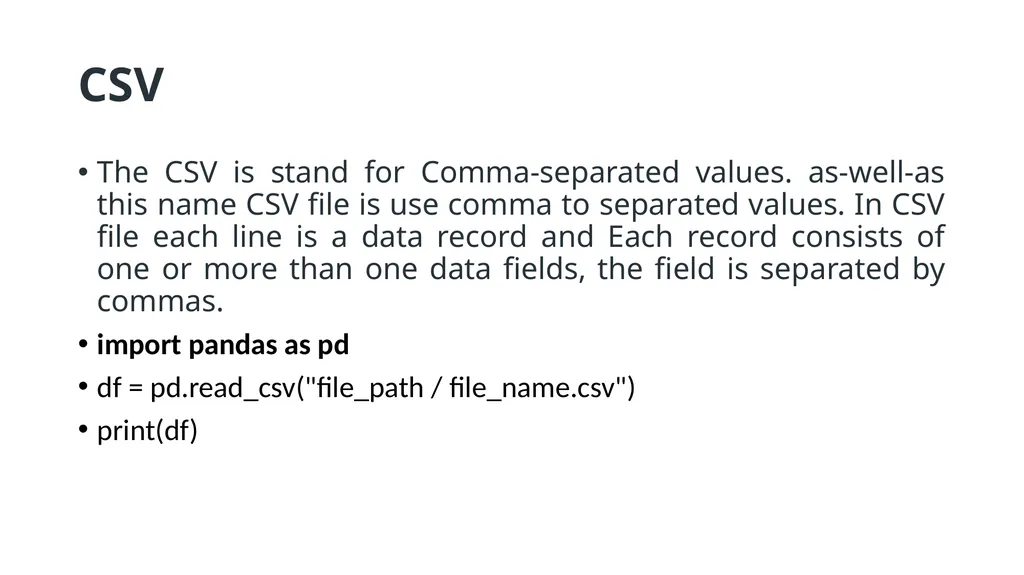
CSV The CSV is stand for Comma-separated values. as-well-as this name CSV file is use comma to separated values. In CSV file each line is a data record and Each record consists of one or more than one data fields, the field is separated by commas.
import pandas as pd
df = pd.read_csv("file_path / file_name.csv")
print(df)<br>
import pandas as pd
df = pd.read_csv("file_path / file_name.csv")
print(df)<br>
40
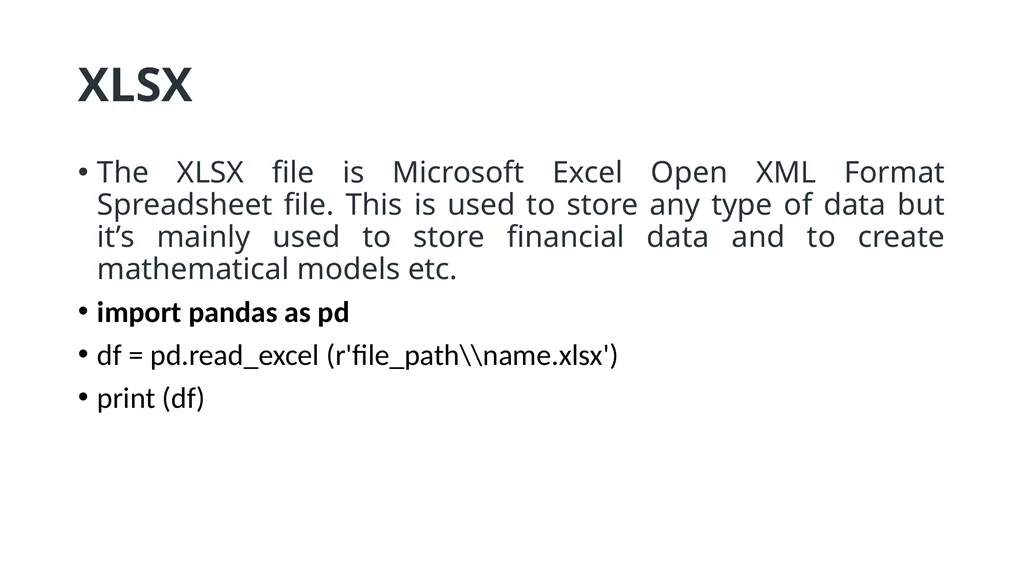
XLSX The XLSX file is Microsoft Excel Open XML Format Spreadsheet file. This is used to store any type of data but it’s mainly used to store financial data and to create mathematical models etc.
import pandas as pd
df = pd.read_excel (r'file_path\\name.xlsx')
print (df)<br>
import pandas as pd
df = pd.read_excel (r'file_path\\name.xlsx')
print (df)<br>
41
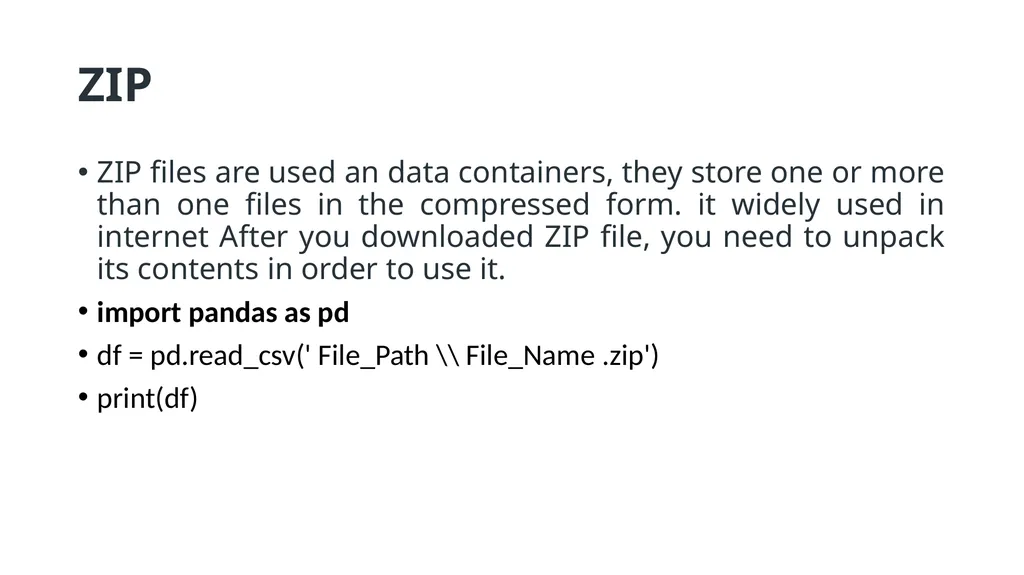
ZIP ZIP files are used an data containers, they store one or more than one files in the compressed form. it widely used in internet After you downloaded ZIP file, you need to unpack its contents in order to use it.
import pandas as pd
df = pd.read_csv(' File_Path \\ File_Name .zip')
print(df)<br>
import pandas as pd
df = pd.read_csv(' File_Path \\ File_Name .zip')
print(df)<br>
42
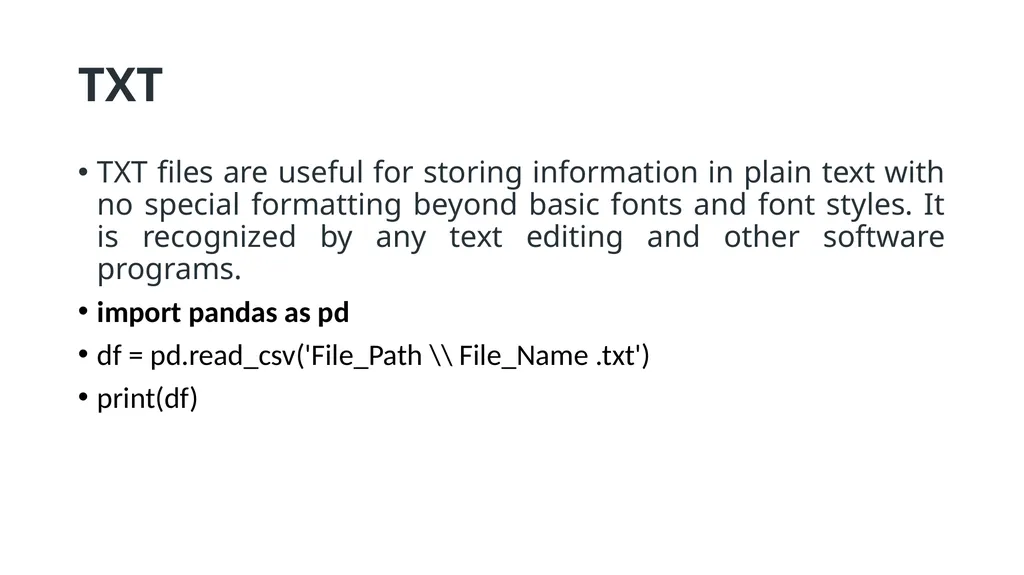
TXT TXT files are useful for storing information in plain text with no special formatting beyond basic fonts and font styles. It is recognized by any text editing and other software programs.
import pandas as pd
df = pd.read_csv('File_Path \\ File_Name .txt')
print(df)<br>
import pandas as pd
df = pd.read_csv('File_Path \\ File_Name .txt')
print(df)<br>
43
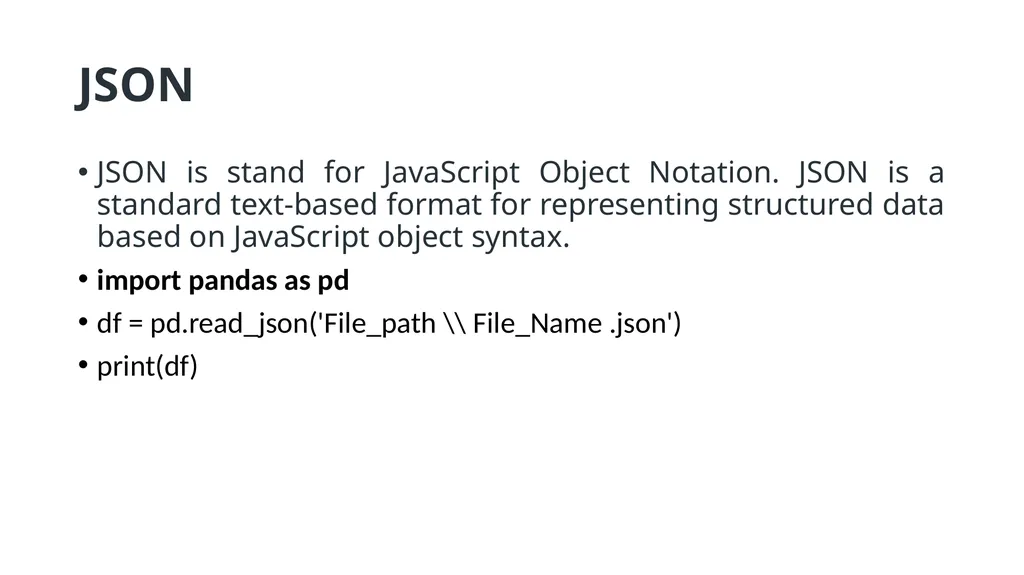
JSON JSON is stand for JavaScript Object Notation. JSON is a standard text-based format for representing structured data based on JavaScript object syntax.
import pandas as pd
df = pd.read_json('File_path \\ File_Name .json')
print(df)<br>
import pandas as pd
df = pd.read_json('File_path \\ File_Name .json')
print(df)<br>
44
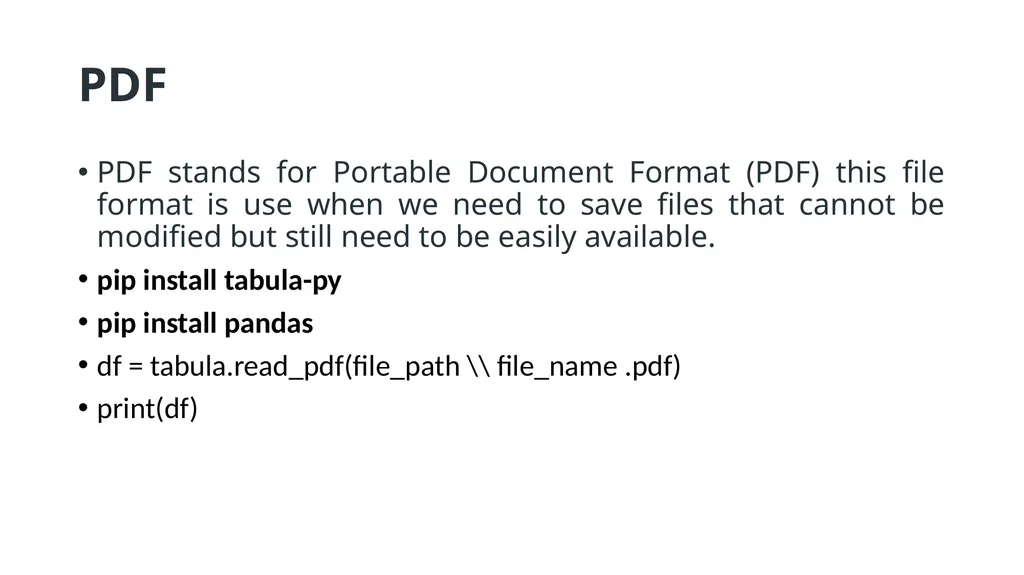
PDF PDF stands for Portable Document Format (PDF) this file format is use when we need to save files that cannot be modified but still need to be easily available.
pip install tabula-py
pip install pandas
df = tabula.read_pdf(file_path \\ file_name .pdf)
print(df)<br>
pip install tabula-py
pip install pandas
df = tabula.read_pdf(file_path \\ file_name .pdf)
print(df)<br>
45
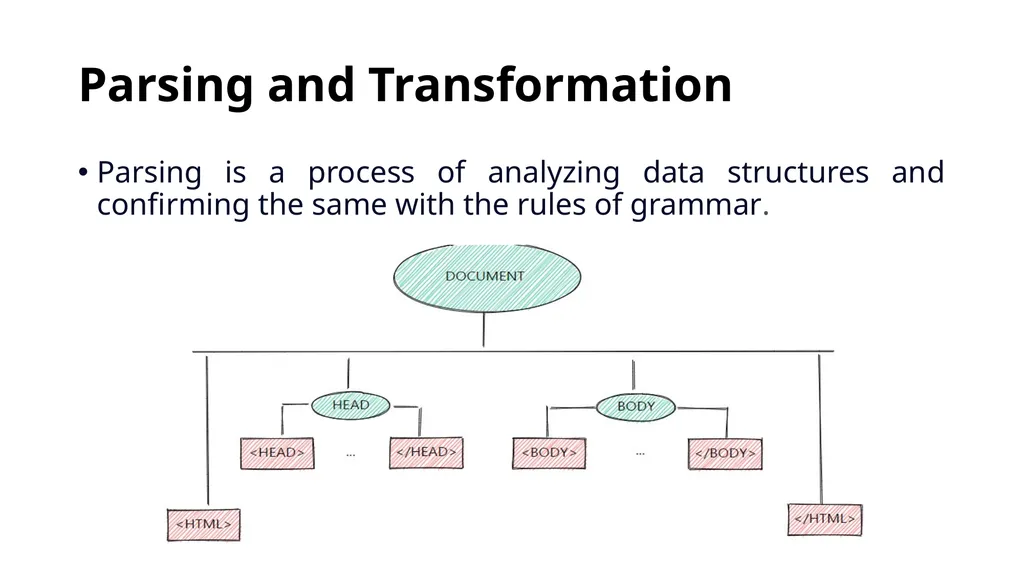
Parsing and Transformation Parsing is a process of analyzing data structures and confirming the same with the rules of grammar.<br>
46
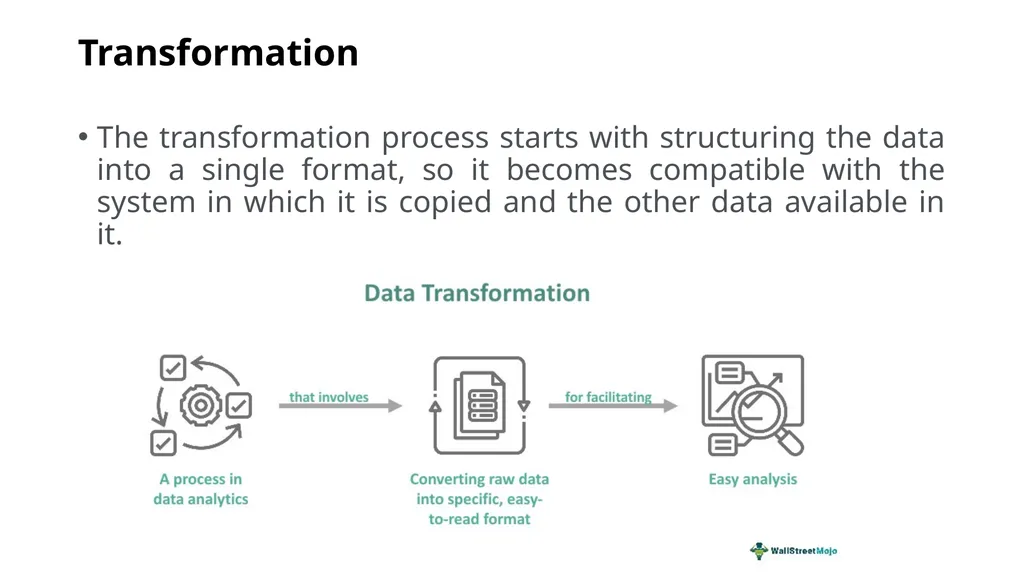
Transformation The transformation process starts with structuring the data into a single format, so it becomes compatible with the system in which it is copied and the other data available in it.<br>
47
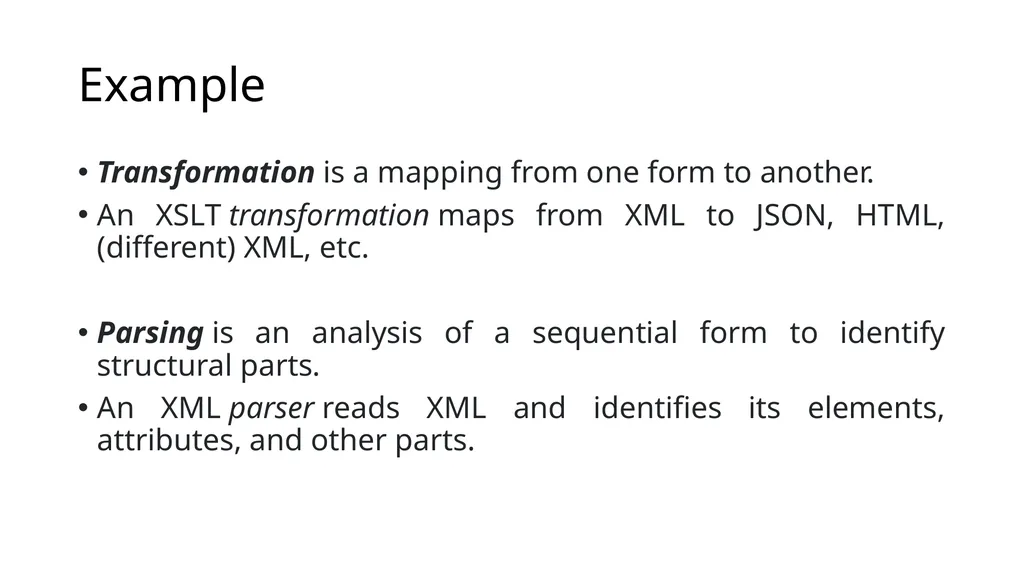
Example Transformation is a mapping from one form to another.
An XSLT transformation maps from XML to JSON, HTML, (different) XML, etc.
Parsing is an analysis of a sequential form to identify structural parts.
An XML parser reads XML and identifies its elements, attributes, and other parts.<br>
An XSLT transformation maps from XML to JSON, HTML, (different) XML, etc.
Parsing is an analysis of a sequential form to identify structural parts.
An XML parser reads XML and identifies its elements, attributes, and other parts.<br>