
Data Manipulation in SAS CTSI BERD Core Seminar
PT
Published · 42 slides · 0 views
1 / 1
Description
Data Manipulation in SAS CTSI BERD Core Seminar Emily K.Q. Sisson June 15, 2017 Using SAS for analysis: Overview Have data in some foreign format (Excel, CSV, SPSS, etc.) Import data into SAS Look at the data in SAS Transform the data
Related Topics
Share
Embed code
Download this presentation From Below
"Data Manipulation in SAS CTSI BERD Core Seminar" is the property of its rightful owner. Permission is granted to download and print the materials on this website for personal, non-commercial use only, and to display it on your personal computer provided you do not modify the materials and that you retain all copyright notices contained in the materials. By downloading content from our website, you accept the terms of this agreement.
Presentation Transcript
01
Data Manipulation in SAS CTSI BERD Core Seminar
Emily K.Q. Sisson
June 15, 2017<br>
Emily K.Q. Sisson
June 15, 2017<br>
02
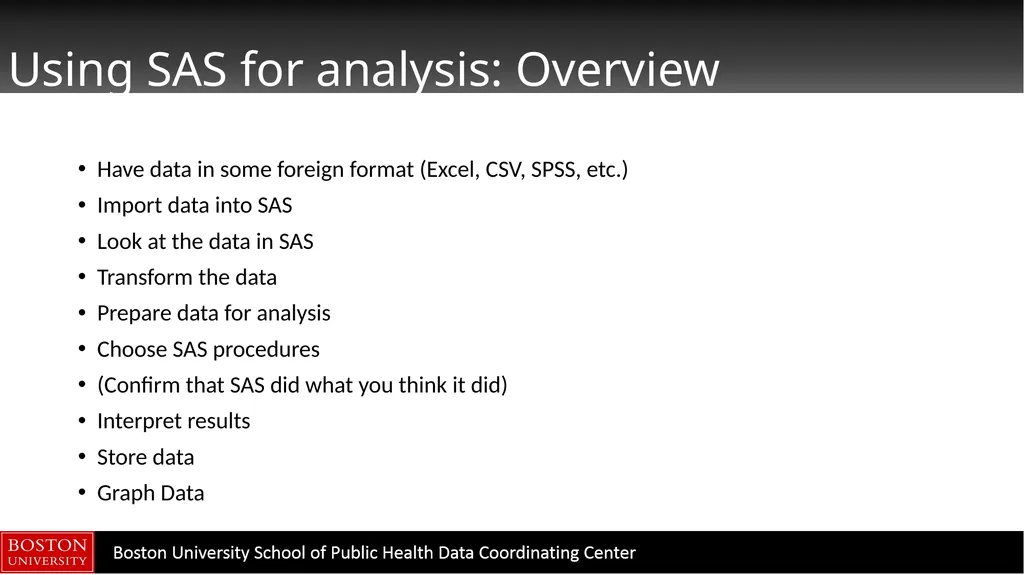
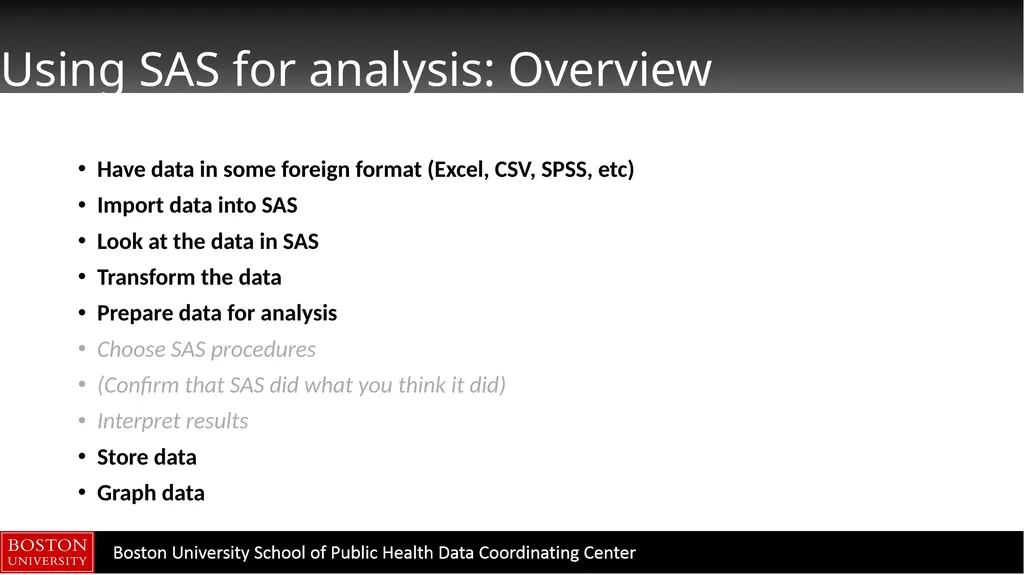
Using SAS for analysis: Overview Have data in some foreign format (Excel, CSV, SPSS, etc.)
Import data into SAS
Look at the data in SAS
Transform the data
Prepare data for analysis
Choose SAS procedures
(Confirm that SAS did what you think it did)
Interpret results
Store data
Graph Data<br>
Import data into SAS
Look at the data in SAS
Transform the data
Prepare data for analysis
Choose SAS procedures
(Confirm that SAS did what you think it did)
Interpret results
Store data
Graph Data<br>
03
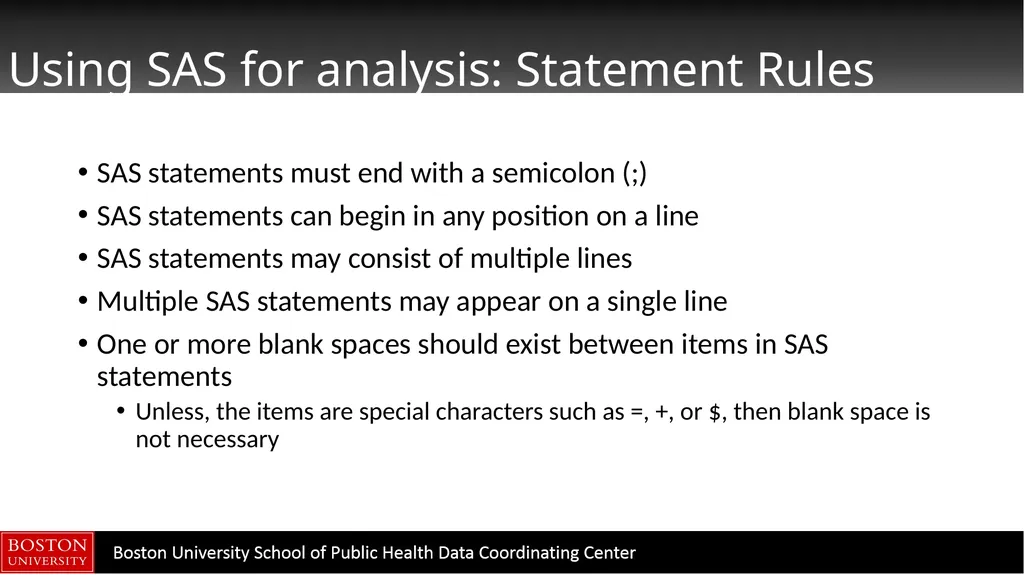
Using SAS for analysis: Statement Rules SAS statements must end with a semicolon (;)
SAS statements can begin in any position on a line
SAS statements may consist of multiple lines
Multiple SAS statements may appear on a single line
One or more blank spaces should exist between items in SAS statements
Unless, the items are special characters such as =, +, or $, then blank space is not necessary<br>
SAS statements can begin in any position on a line
SAS statements may consist of multiple lines
Multiple SAS statements may appear on a single line
One or more blank spaces should exist between items in SAS statements
Unless, the items are special characters such as =, +, or $, then blank space is not necessary<br>
04
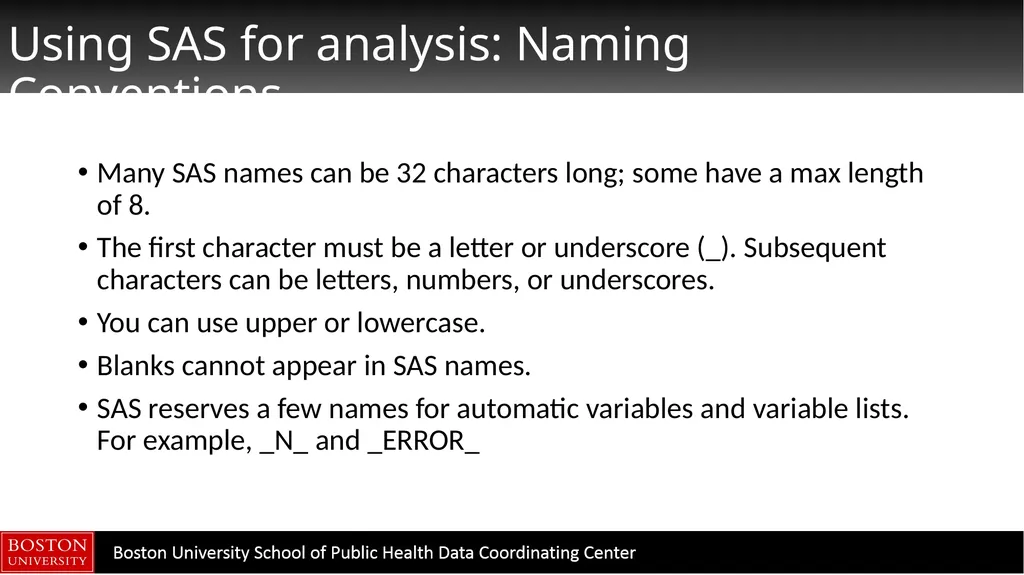
Using SAS for analysis: Naming Conventions Many SAS names can be 32 characters long; some have a max length of 8.
The first character must be a letter or underscore (_). Subsequent characters can be letters, numbers, or underscores.
You can use upper or lowercase.
Blanks cannot appear in SAS names.
SAS reserves a few names for automatic variables and variable lists. For example, _N_ and _ERROR_<br>
The first character must be a letter or underscore (_). Subsequent characters can be letters, numbers, or underscores.
You can use upper or lowercase.
Blanks cannot appear in SAS names.
SAS reserves a few names for automatic variables and variable lists. For example, _N_ and _ERROR_<br>
05
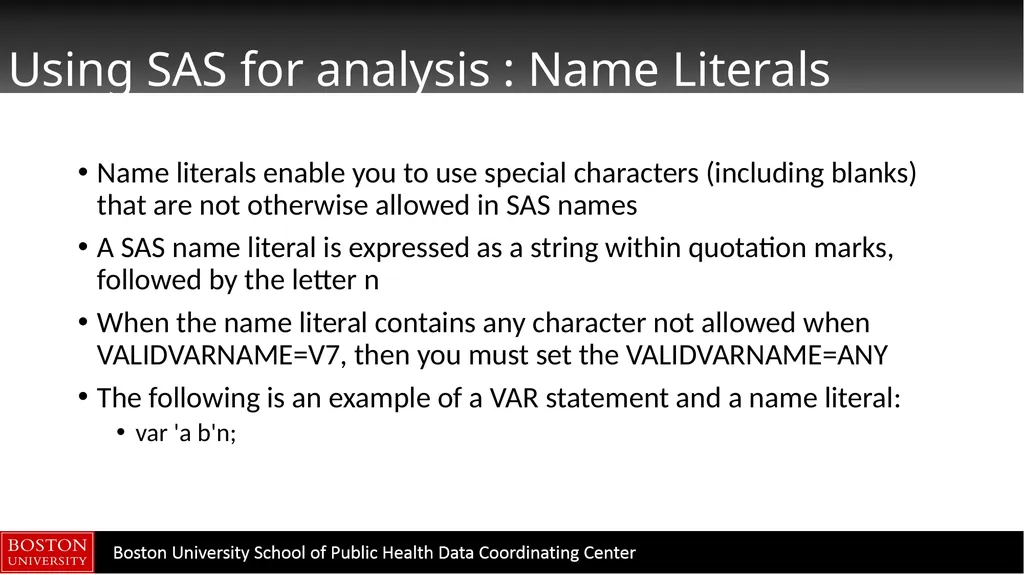
Using SAS for analysis : Name Literals Name literals enable you to use special characters (including blanks) that are not otherwise allowed in SAS names
A SAS name literal is expressed as a string within quotation marks, followed by the letter n
When the name literal contains any character not allowed when VALIDVARNAME=V7, then you must set the VALIDVARNAME=ANY
The following is an example of a VAR statement and a name literal:
var 'a b'n;<br>
A SAS name literal is expressed as a string within quotation marks, followed by the letter n
When the name literal contains any character not allowed when VALIDVARNAME=V7, then you must set the VALIDVARNAME=ANY
The following is an example of a VAR statement and a name literal:
var 'a b'n;<br>
06
Using SAS for analysis: Overview Have data in some foreign format (Excel, CSV, SPSS, etc)
Import data into SAS
Look at the data in SAS
Transform the data
Prepare data for analysis
Choose SAS procedures
(Confirm that SAS did what you think it did)
Interpret results
Store data
Graph data<br>
Import data into SAS
Look at the data in SAS
Transform the data
Prepare data for analysis
Choose SAS procedures
(Confirm that SAS did what you think it did)
Interpret results
Store data
Graph data<br>
07
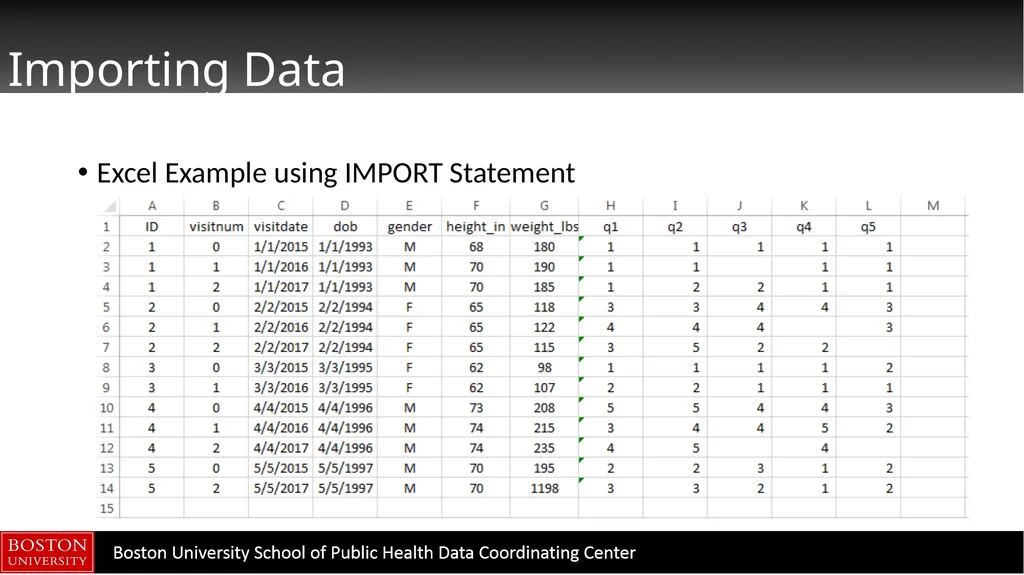
Importing Data Excel Example using IMPORT Statement<br>
08
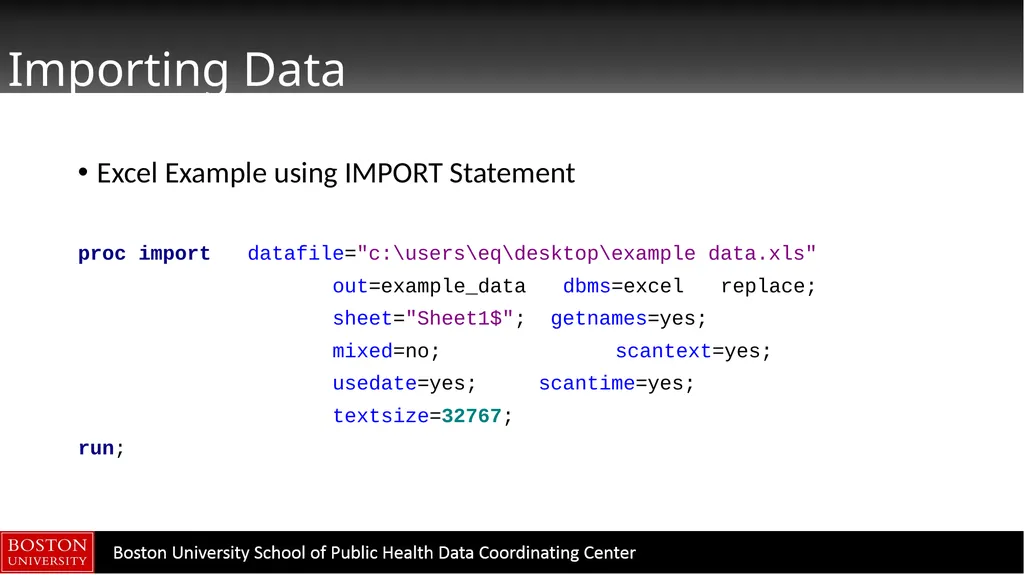
Importing Data Excel Example using IMPORT Statement
proc import datafile="c:\users\eq\desktop\example data.xls"
out=example_data dbms=excel replace;
sheet="Sheet1$"; getnames=yes;
mixed=no; scantext=yes;
usedate=yes; scantime=yes;
textsize=32767;
run;<br>
proc import datafile="c:\users\eq\desktop\example data.xls"
out=example_data dbms=excel replace;
sheet="Sheet1$"; getnames=yes;
mixed=no; scantext=yes;
usedate=yes; scantime=yes;
textsize=32767;
run;<br>
09
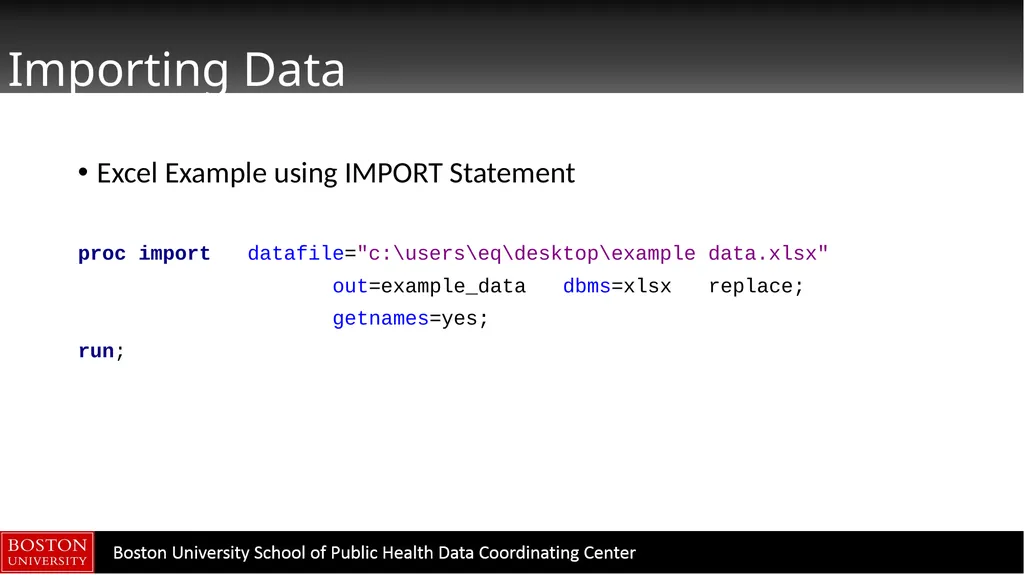
Importing Data Excel Example using IMPORT Statement
proc import datafile="c:\users\eq\desktop\example data.xlsx"
out=example_data dbms=xlsx replace;
getnames=yes;
run;<br>
proc import datafile="c:\users\eq\desktop\example data.xlsx"
out=example_data dbms=xlsx replace;
getnames=yes;
run;<br>
10
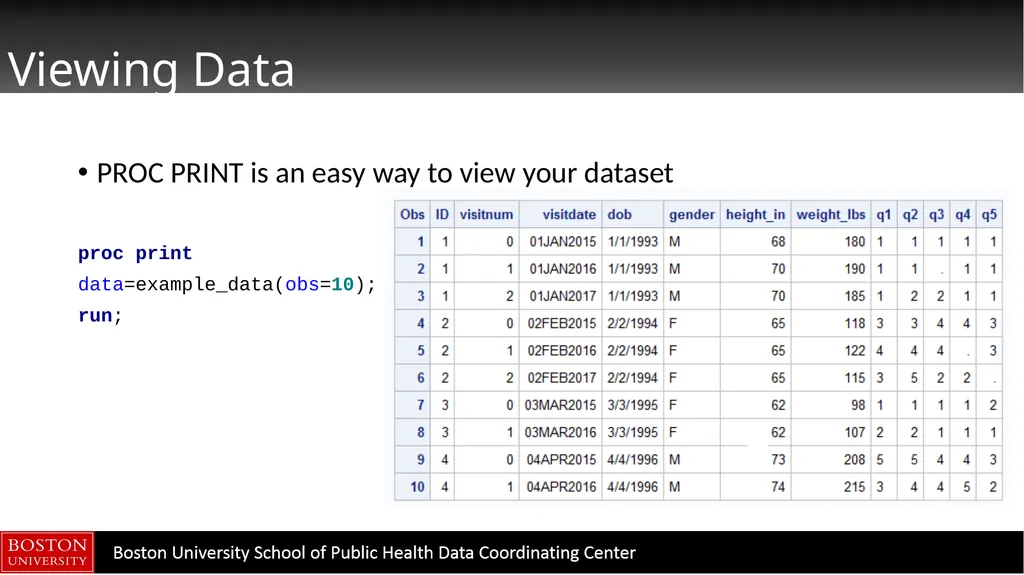
Viewing Data PROC PRINT is an easy way to view your dataset
proc print
data=example_data(obs=10);
run;<br>
proc print
data=example_data(obs=10);
run;<br>
11
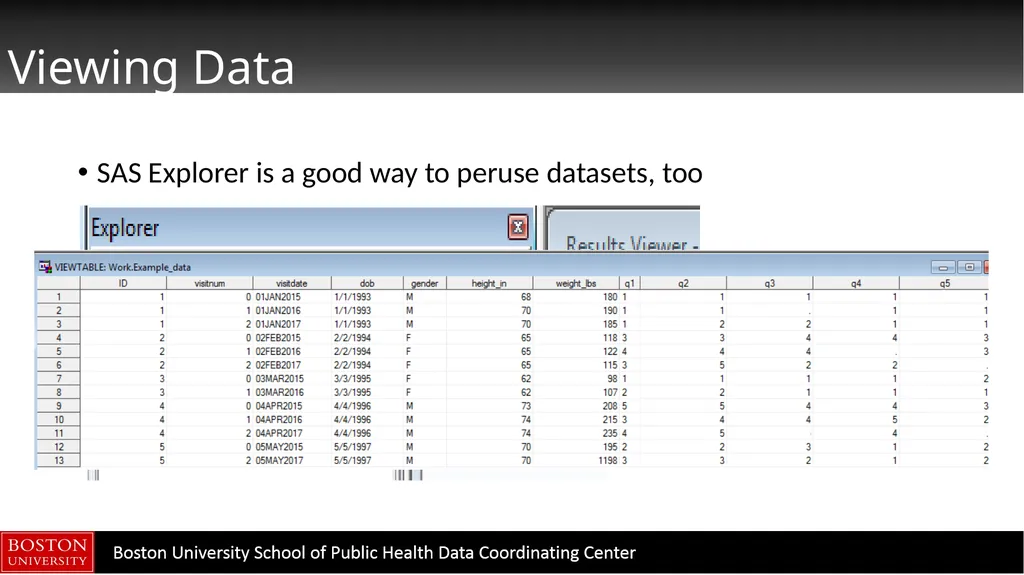
Viewing Data SAS Explorer is a good way to peruse datasets, too<br>
12
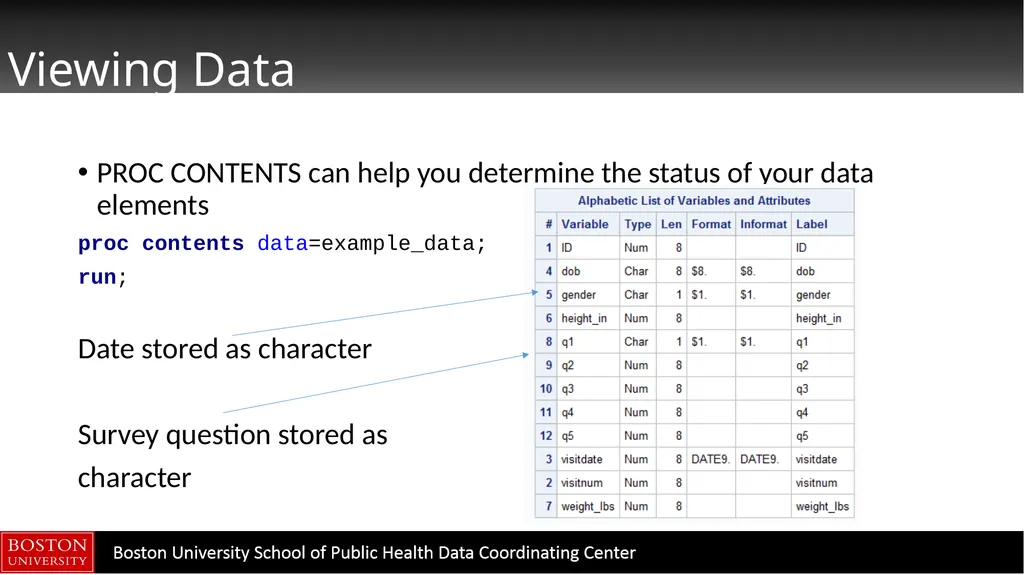
Viewing Data PROC CONTENTS can help you determine the status of your data elements
proc contents data=example_data;
run;
Date stored as character
Survey question stored as
character<br>
proc contents data=example_data;
run;
Date stored as character
Survey question stored as
character<br>
13
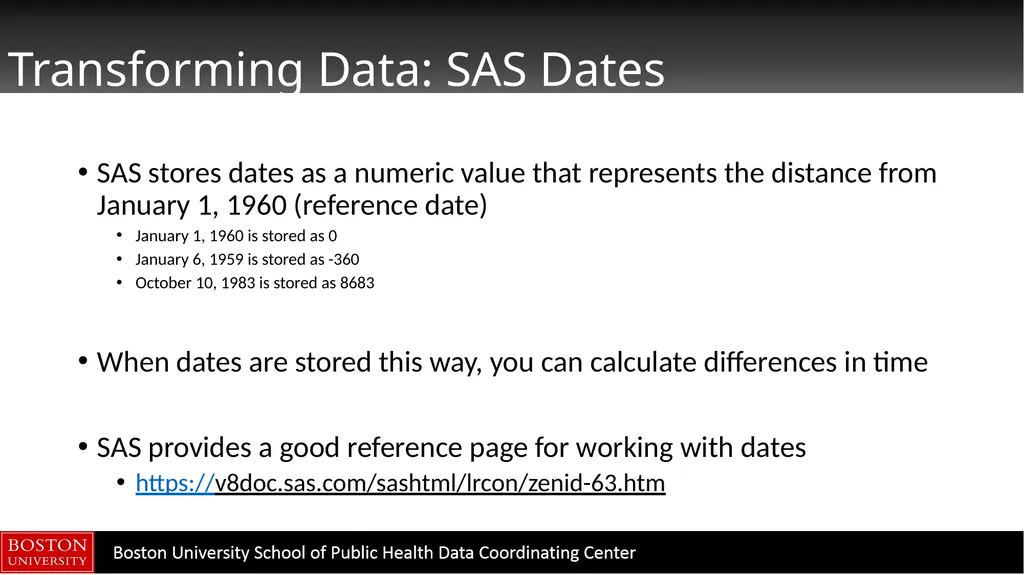
Transforming Data: SAS Dates SAS stores dates as a numeric value that represents the distance from January 1, 1960 (reference date)
January 1, 1960 is stored as 0
January 6, 1959 is stored as -360
October 10, 1983 is stored as 8683
When dates are stored this way, you can calculate differences in time
SAS provides a good reference page for working with dates
https://v8doc.sas.com/sashtml/lrcon/zenid-63.htm<br>
January 1, 1960 is stored as 0
January 6, 1959 is stored as -360
October 10, 1983 is stored as 8683
When dates are stored this way, you can calculate differences in time
SAS provides a good reference page for working with dates
https://v8doc.sas.com/sashtml/lrcon/zenid-63.htm<br>
14
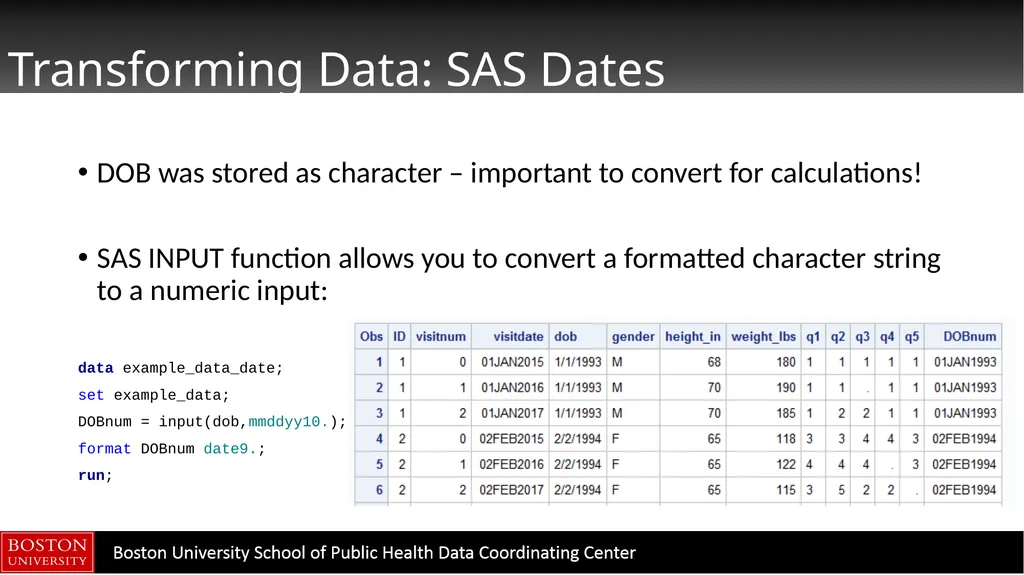
Transforming Data: SAS Dates DOB was stored as character – important to convert for calculations!
SAS INPUT function allows you to convert a formatted character string to a numeric input:
data example_data_date;
set example_data;
DOBnum = input(dob,mmddyy10.);
format DOBnum date9.;
run;<br>
SAS INPUT function allows you to convert a formatted character string to a numeric input:
data example_data_date;
set example_data;
DOBnum = input(dob,mmddyy10.);
format DOBnum date9.;
run;<br>
15
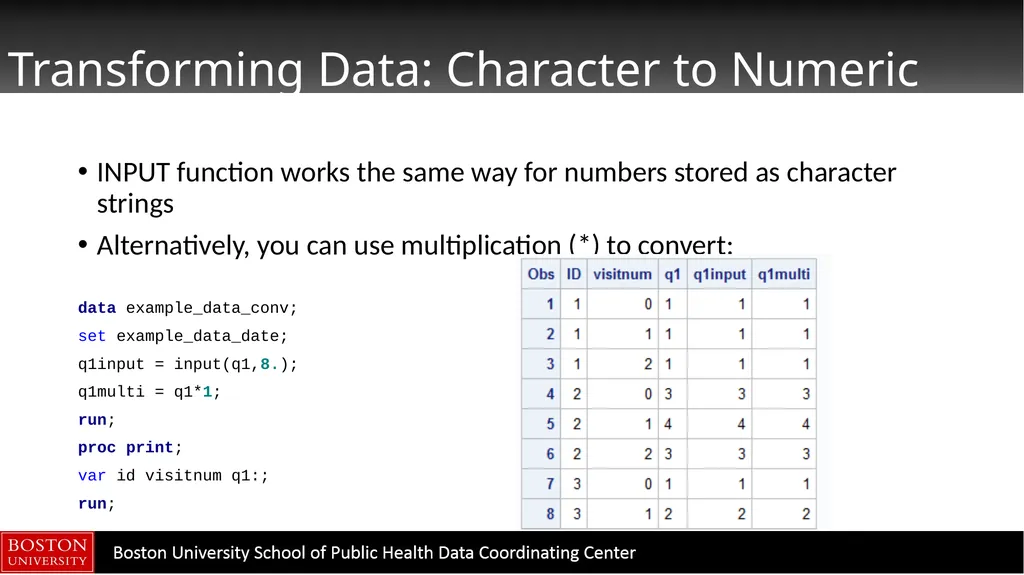
Transforming Data: Character to Numeric INPUT function works the same way for numbers stored as character strings
Alternatively, you can use multiplication (*) to convert:
data example_data_conv;
set example_data_date;
q1input = input(q1,8.);
q1multi = q1*1;
run;
proc print;
var id visitnum q1:;
run;<br>
Alternatively, you can use multiplication (*) to convert:
data example_data_conv;
set example_data_date;
q1input = input(q1,8.);
q1multi = q1*1;
run;
proc print;
var id visitnum q1:;
run;<br>
16
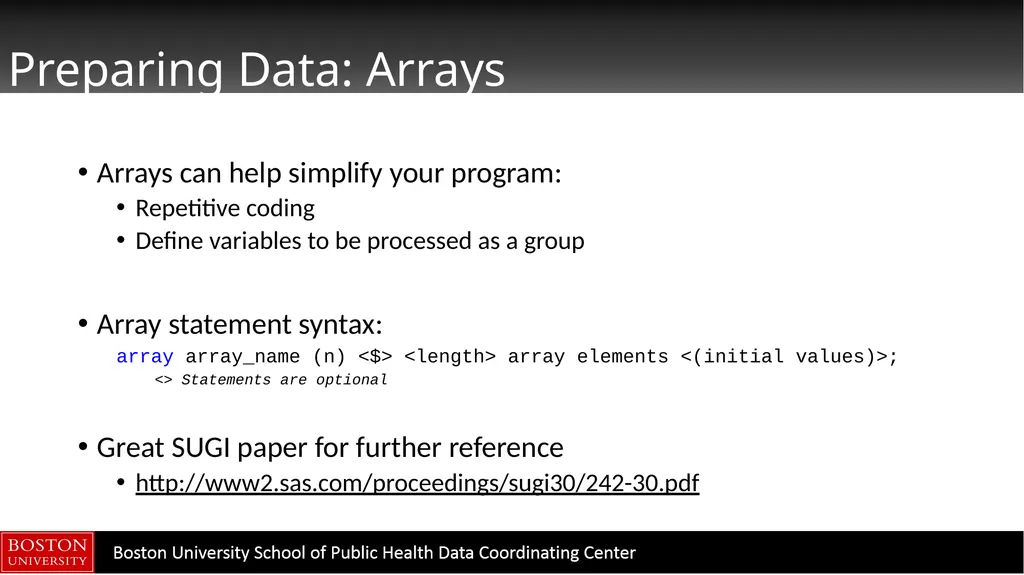
Preparing Data: Arrays Arrays can help simplify your program:
Repetitive coding
Define variables to be processed as a group
Array statement syntax:
array array_name (n) <$> <length> array elements <(initial values)>;
<> Statements are optional
Great SUGI paper for further reference
http://www2.sas.com/proceedings/sugi30/242-30.pdf<br>
Repetitive coding
Define variables to be processed as a group
Array statement syntax:
array array_name (n) <$> <length> array elements <(initial values)>;
<> Statements are optional
Great SUGI paper for further reference
http://www2.sas.com/proceedings/sugi30/242-30.pdf<br>
17
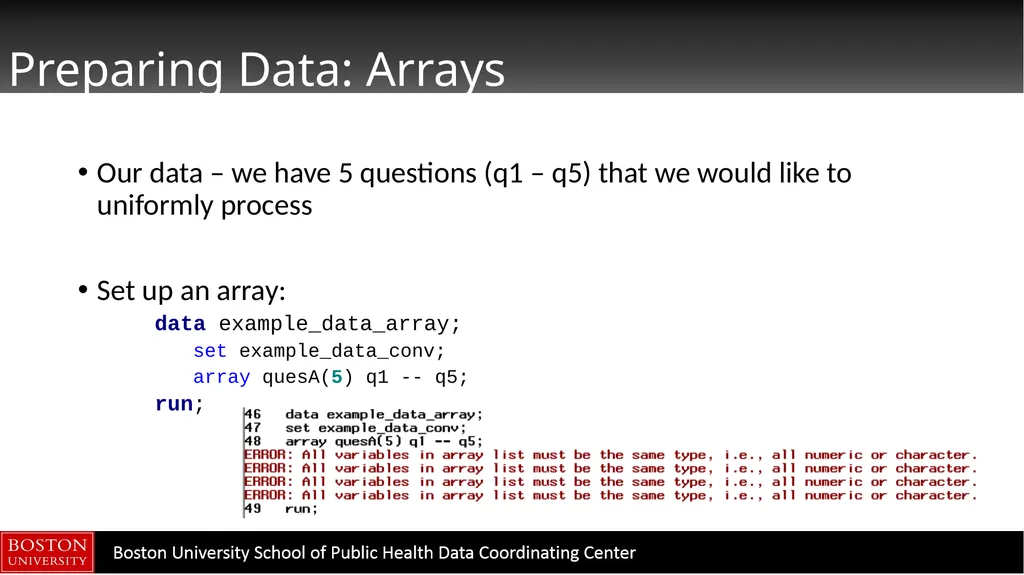
Preparing Data: Arrays Our data – we have 5 questions (q1 – q5) that we would like to uniformly process
Set up an array:
data example_data_array;
set example_data_conv;
array quesA(5) q1 -- q5;
run;<br>
Set up an array:
data example_data_array;
set example_data_conv;
array quesA(5) q1 -- q5;
run;<br>
18
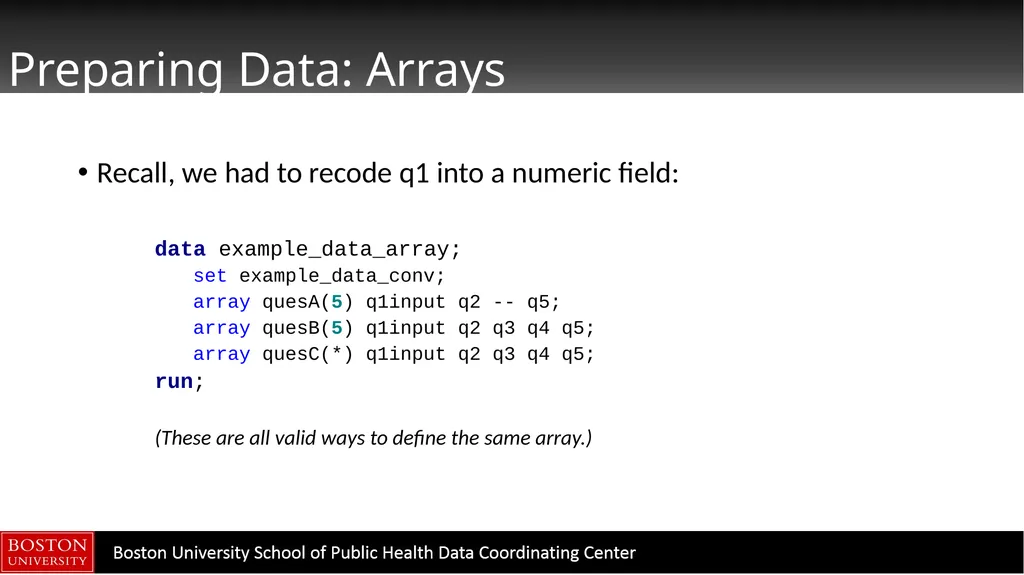
Preparing Data: Arrays Recall, we had to recode q1 into a numeric field:
data example_data_array;
set example_data_conv;
array quesA(5) q1input q2 -- q5;
array quesB(5) q1input q2 q3 q4 q5;
array quesC(*) q1input q2 q3 q4 q5;
run;
(These are all valid ways to define the same array.)<br>
data example_data_array;
set example_data_conv;
array quesA(5) q1input q2 -- q5;
array quesB(5) q1input q2 q3 q4 q5;
array quesC(*) q1input q2 q3 q4 q5;
run;
(These are all valid ways to define the same array.)<br>
19
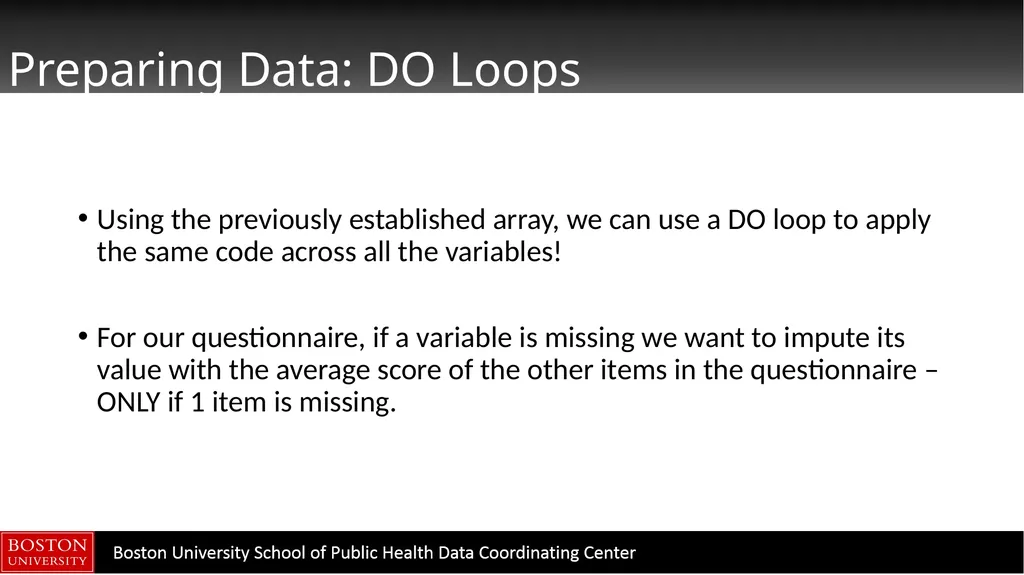
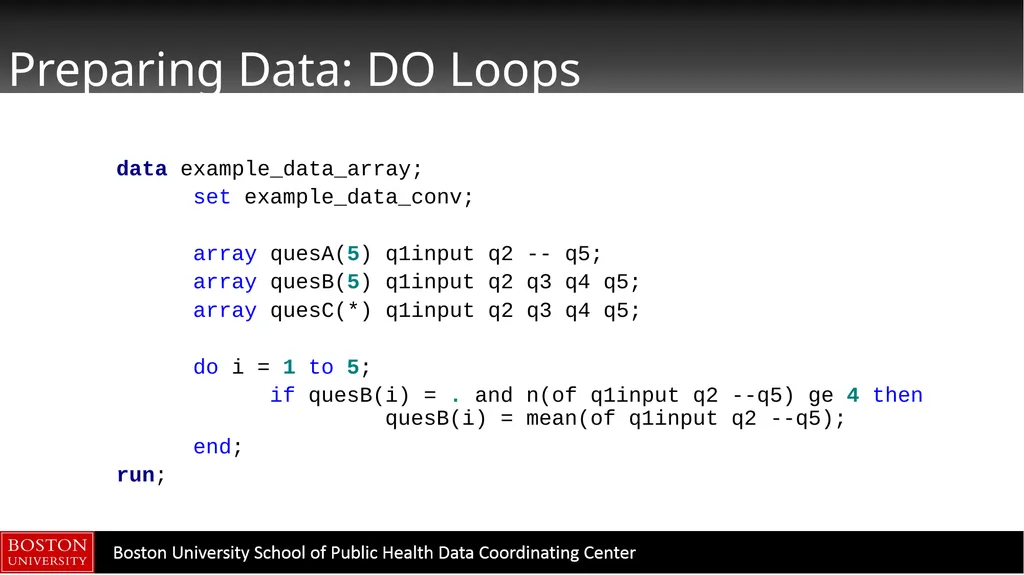
Preparing Data: DO Loops Using the previously established array, we can use a DO loop to apply the same code across all the variables!
For our questionnaire, if a variable is missing we want to impute its value with the average score of the other items in the questionnaire – ONLY if 1 item is missing.<br>
For our questionnaire, if a variable is missing we want to impute its value with the average score of the other items in the questionnaire – ONLY if 1 item is missing.<br>
20
Preparing Data: DO Loops data example_data_array;
set example_data_conv;
array quesA(5) q1input q2 -- q5;
array quesB(5) q1input q2 q3 q4 q5;
array quesC(*) q1input q2 q3 q4 q5;
do i = 1 to 5;
if quesB(i) = . and n(of q1input q2 --q5) ge 4 then quesB(i) = mean(of q1input q2 --q5);
end;
run;<br>
set example_data_conv;
array quesA(5) q1input q2 -- q5;
array quesB(5) q1input q2 q3 q4 q5;
array quesC(*) q1input q2 q3 q4 q5;
do i = 1 to 5;
if quesB(i) = . and n(of q1input q2 --q5) ge 4 then quesB(i) = mean(of q1input q2 --q5);
end;
run;<br>
21
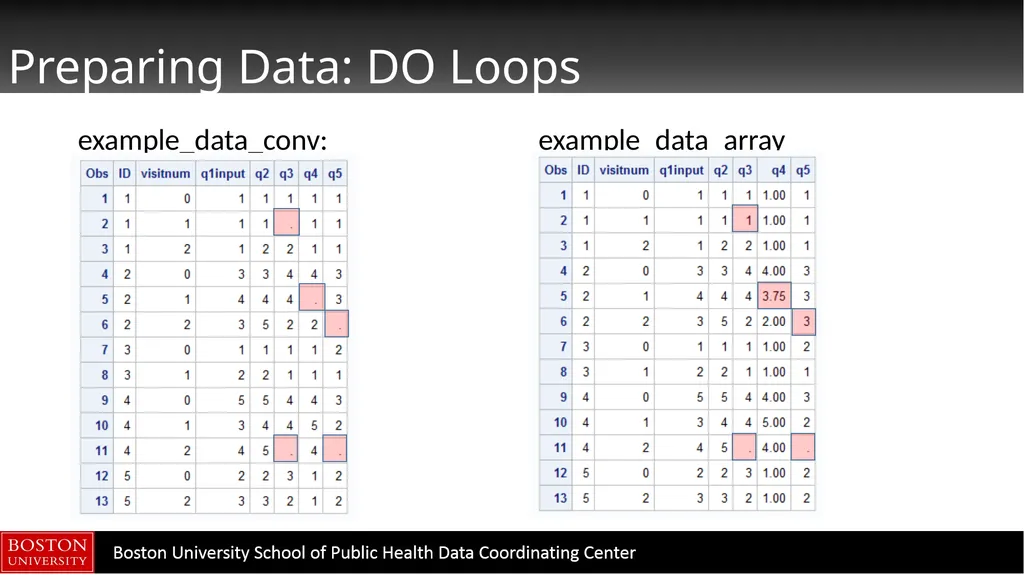
Preparing Data: DO Loops example_data_conv: example_data_array<br>
22
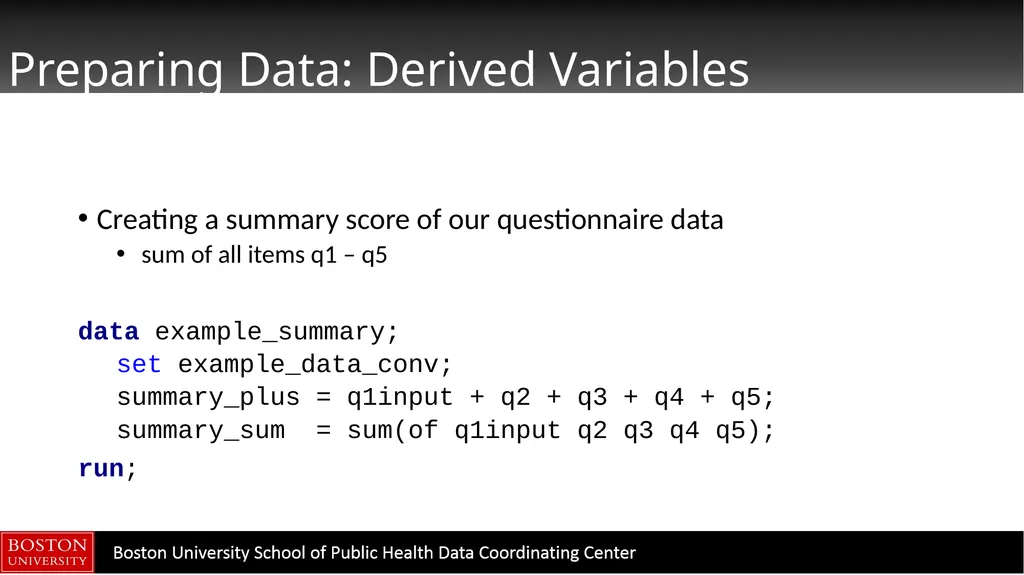
Preparing Data: Derived Variables Creating a summary score of our questionnaire data
sum of all items q1 – q5
data example_summary;
set example_data_conv;
summary_plus = q1input + q2 + q3 + q4 + q5;
summary_sum = sum(of q1input q2 q3 q4 q5);
run;<br>
sum of all items q1 – q5
data example_summary;
set example_data_conv;
summary_plus = q1input + q2 + q3 + q4 + q5;
summary_sum = sum(of q1input q2 q3 q4 q5);
run;<br>
23
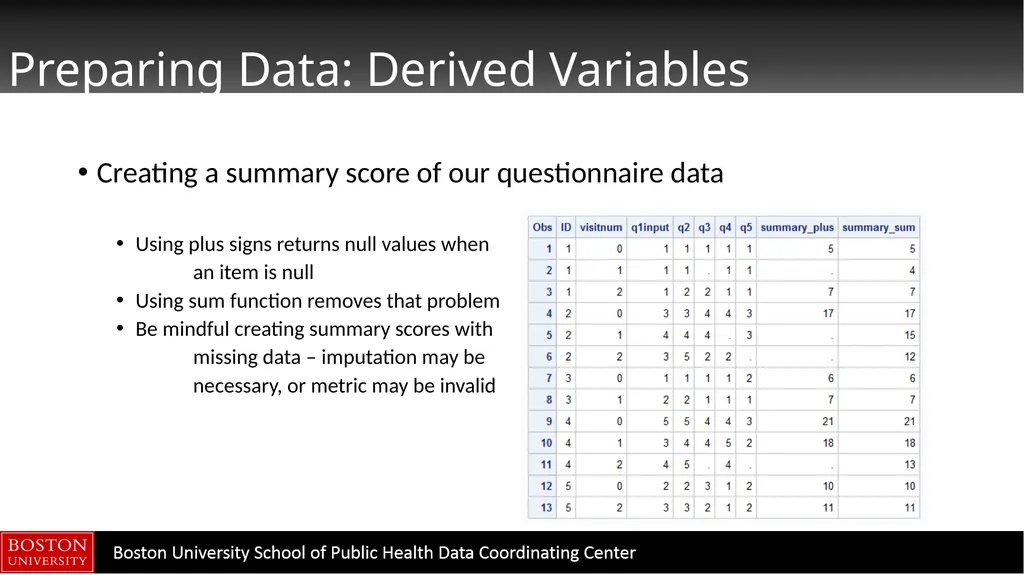
Preparing Data: Derived Variables Creating a summary score of our questionnaire data
Using plus signs returns null values when
an item is null
Using sum function removes that problem
Be mindful creating summary scores with
missing data – imputation may be
necessary, or metric may be invalid<br>
Using plus signs returns null values when
an item is null
Using sum function removes that problem
Be mindful creating summary scores with
missing data – imputation may be
necessary, or metric may be invalid<br>
24
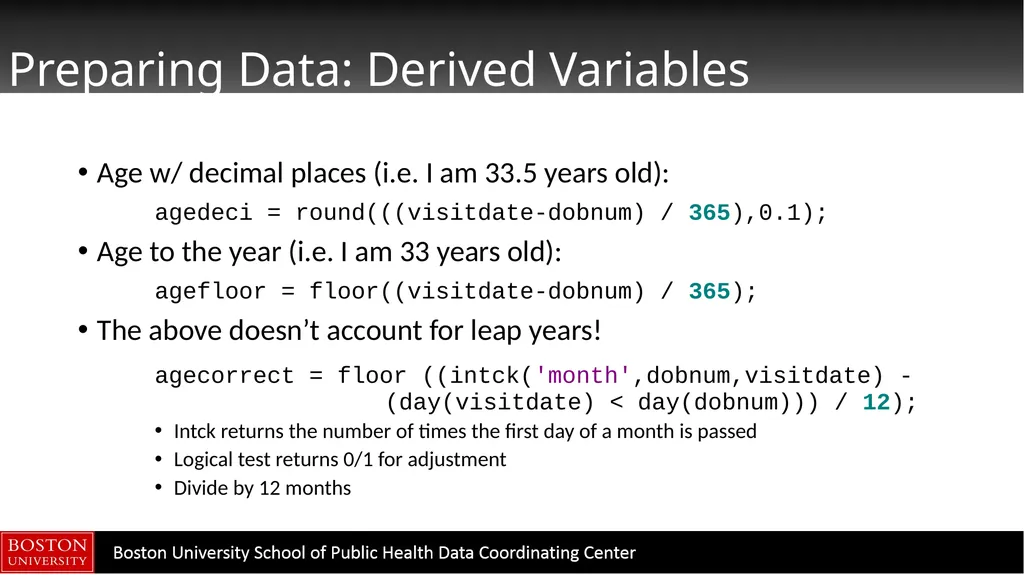
Preparing Data: Derived Variables Age w/ decimal places (i.e. I am 33.5 years old):
agedeci = round(((visitdate-dobnum) / 365),0.1);
Age to the year (i.e. I am 33 years old):
agefloor = floor((visitdate-dobnum) / 365);
The above doesn’t account for leap years!
agecorrect = floor ((intck('month',dobnum,visitdate) - (day(visitdate) < day(dobnum))) / 12);
Intck returns the number of times the first day of a month is passed
Logical test returns 0/1 for adjustment
Divide by 12 months<br>
agedeci = round(((visitdate-dobnum) / 365),0.1);
Age to the year (i.e. I am 33 years old):
agefloor = floor((visitdate-dobnum) / 365);
The above doesn’t account for leap years!
agecorrect = floor ((intck('month',dobnum,visitdate) - (day(visitdate) < day(dobnum))) / 12);
Intck returns the number of times the first day of a month is passed
Logical test returns 0/1 for adjustment
Divide by 12 months<br>
25
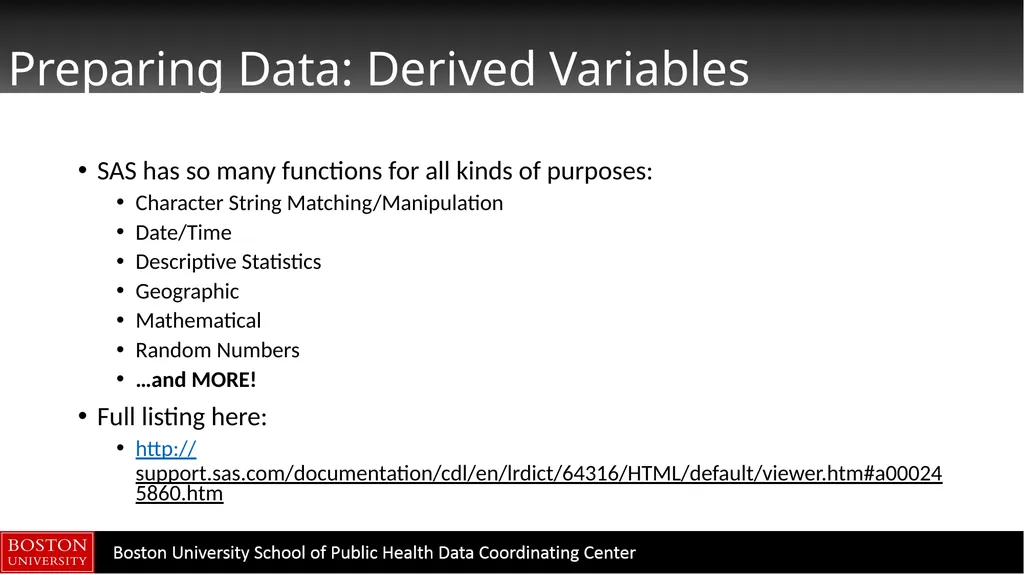
Preparing Data: Derived Variables SAS has so many functions for all kinds of purposes:
Character String Matching/Manipulation
Date/Time
Descriptive Statistics
Geographic
Mathematical
Random Numbers
…and MORE!
Full listing here:
http://support.sas.com/documentation/cdl/en/lrdict/64316/HTML/default/viewer.htm#a000245860.htm<br>
Character String Matching/Manipulation
Date/Time
Descriptive Statistics
Geographic
Mathematical
Random Numbers
…and MORE!
Full listing here:
http://support.sas.com/documentation/cdl/en/lrdict/64316/HTML/default/viewer.htm#a000245860.htm<br>
26
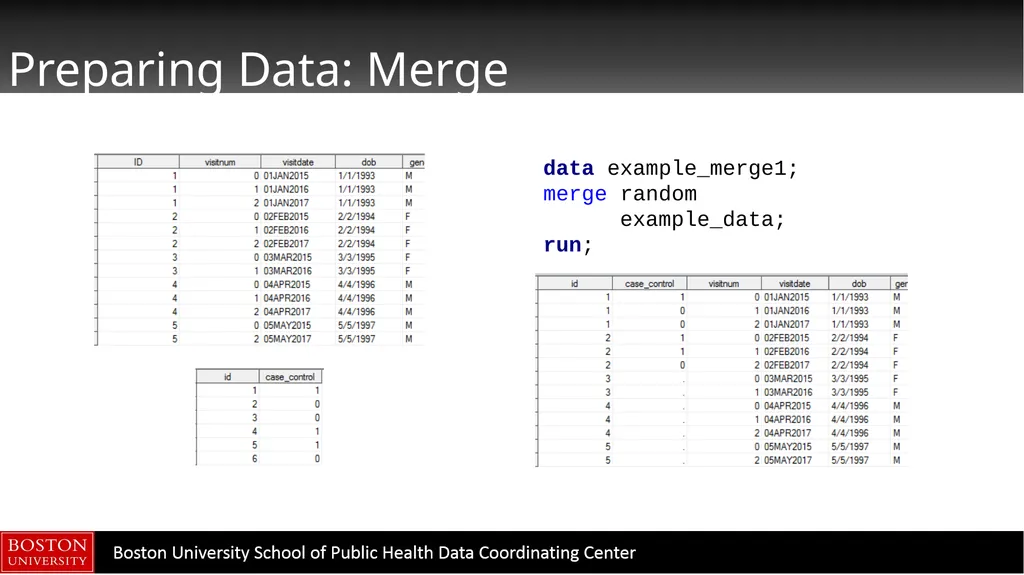
Preparing Data: Merge data example_merge1;
merge random
example_data;
run;<br>
merge random
example_data;
run;<br>
27
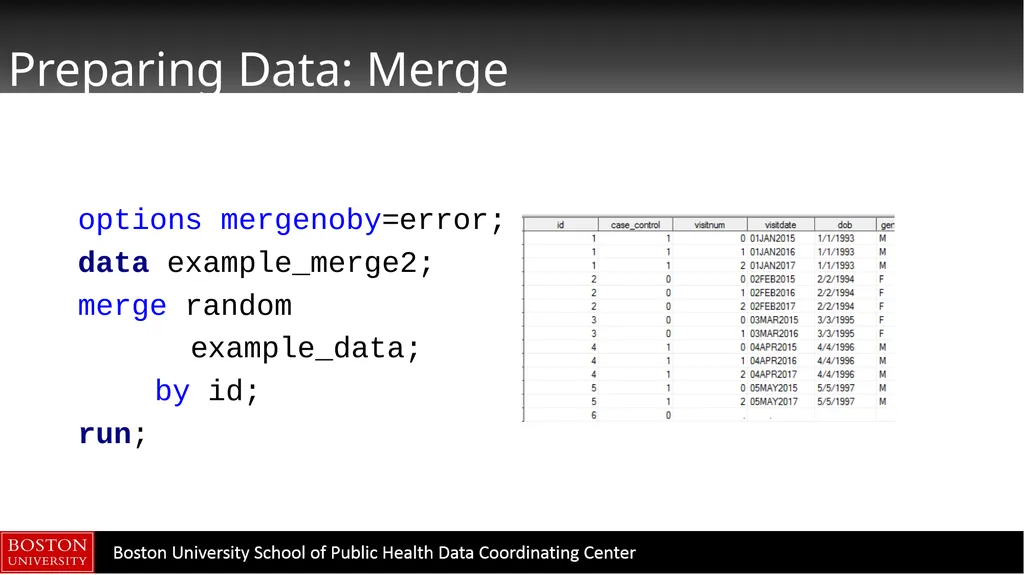
Preparing Data: Merge options mergenoby=error;
data example_merge2;
merge random
example_data;
by id;
run;<br>
data example_merge2;
merge random
example_data;
by id;
run;<br>
28
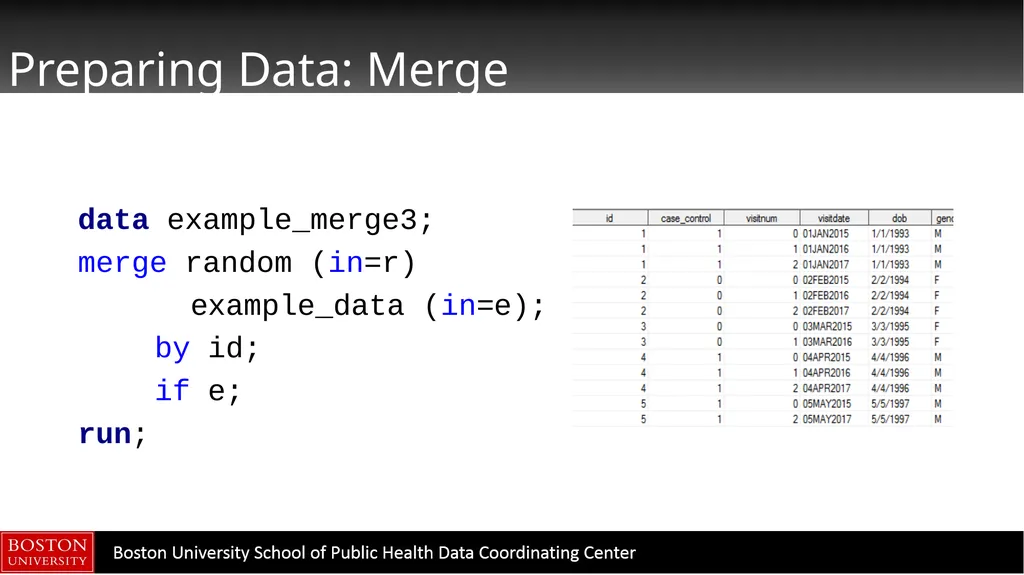
Preparing Data: Merge data example_merge3;
merge random (in=r)
example_data (in=e);
by id;
if e;
run;<br>
merge random (in=r)
example_data (in=e);
by id;
if e;
run;<br>
29
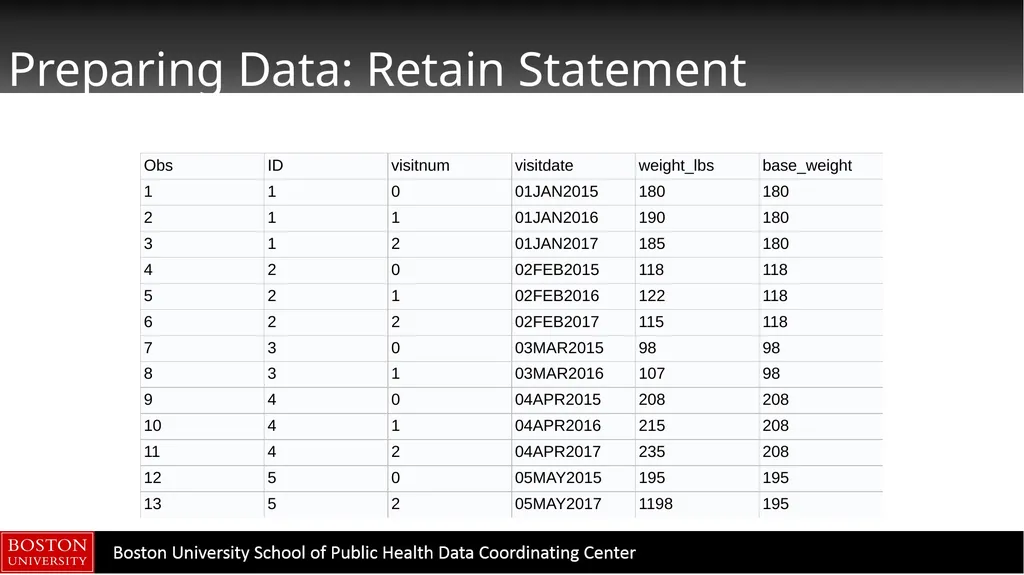
Preparing Data: Retain Statement The RETAIN statement can be used to carry data points from one observation to the next
Particularly useful in assigning “baseline” values to future time points
Good overview paper:
https://www.mwsug.org/proceedings/2009/stats/MWSUG-2009-D14.pdf<br>
Particularly useful in assigning “baseline” values to future time points
Good overview paper:
https://www.mwsug.org/proceedings/2009/stats/MWSUG-2009-D14.pdf<br>
30
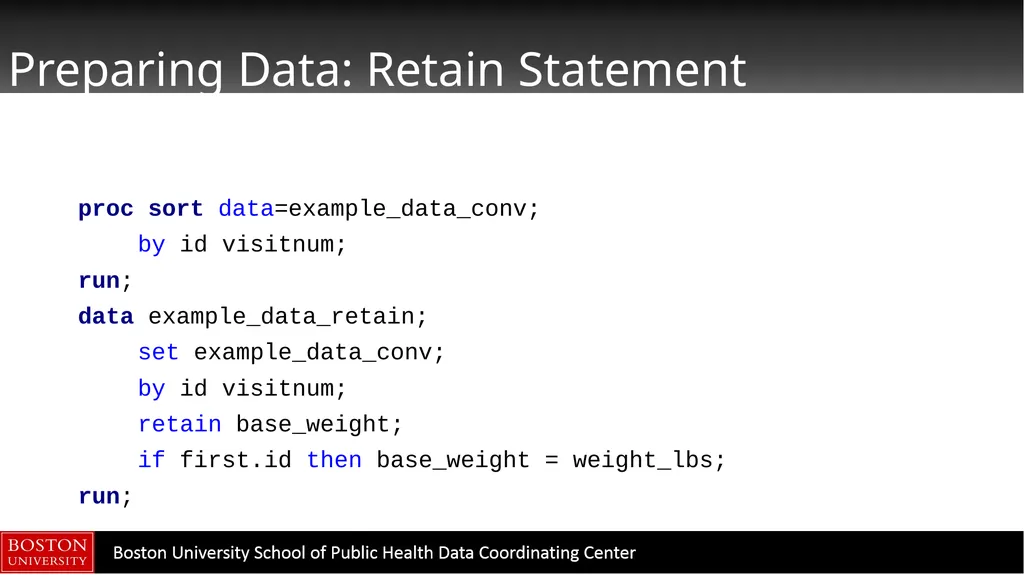
Preparing Data: Retain Statement proc sort data=example_data_conv;
by id visitnum;
run;
data example_data_retain;
set example_data_conv;
by id visitnum;
retain base_weight;
if first.id then base_weight = weight_lbs;
run;<br>
by id visitnum;
run;
data example_data_retain;
set example_data_conv;
by id visitnum;
retain base_weight;
if first.id then base_weight = weight_lbs;
run;<br>
31
Preparing Data: Retain Statement<br>
32
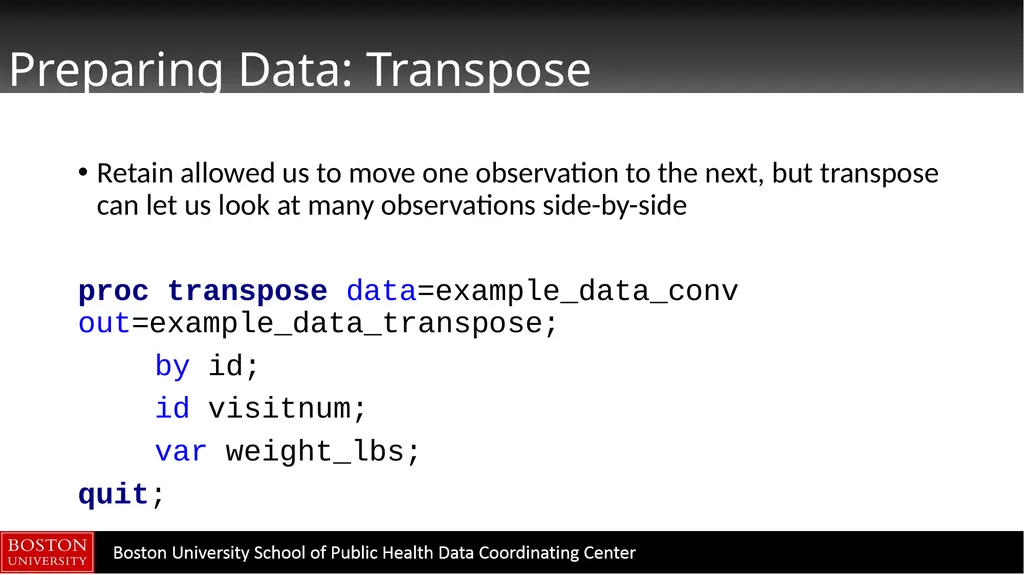
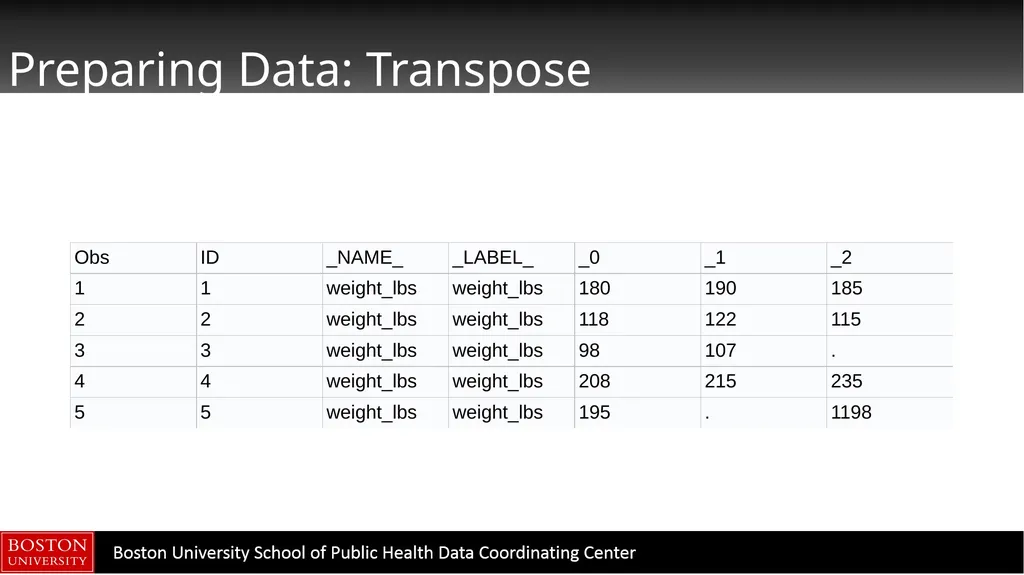
Preparing Data: Transpose Retain allowed us to move one observation to the next, but transpose can let us look at many observations side-by-side
proc transpose data=example_data_conv out=example_data_transpose;
by id;
id visitnum;
var weight_lbs;
quit;<br>
proc transpose data=example_data_conv out=example_data_transpose;
by id;
id visitnum;
var weight_lbs;
quit;<br>
33
Preparing Data: Transpose<br>
34
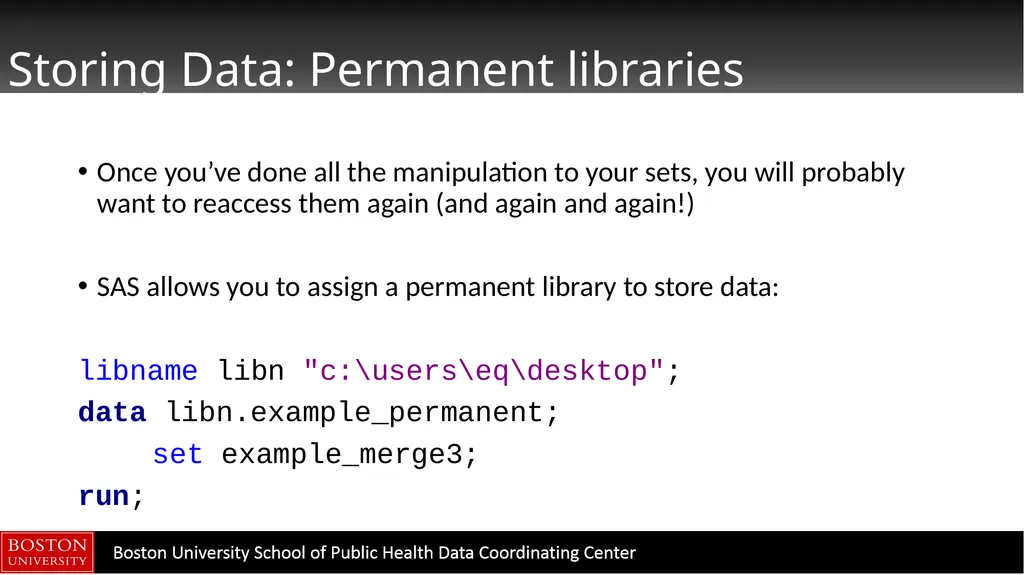
Storing Data: Permanent libraries Once you’ve done all the manipulation to your sets, you will probably want to reaccess them again (and again and again!)
SAS allows you to assign a permanent library to store data:
libname libn "c:\users\eq\desktop";
data libn.example_permanent;
set example_merge3;
run;<br>
SAS allows you to assign a permanent library to store data:
libname libn "c:\users\eq\desktop";
data libn.example_permanent;
set example_merge3;
run;<br>
35
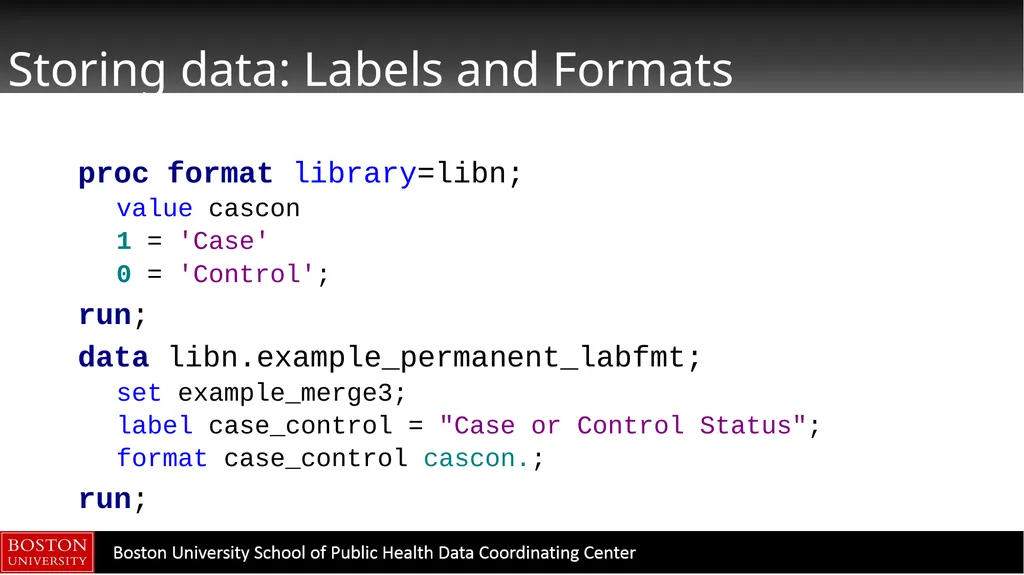
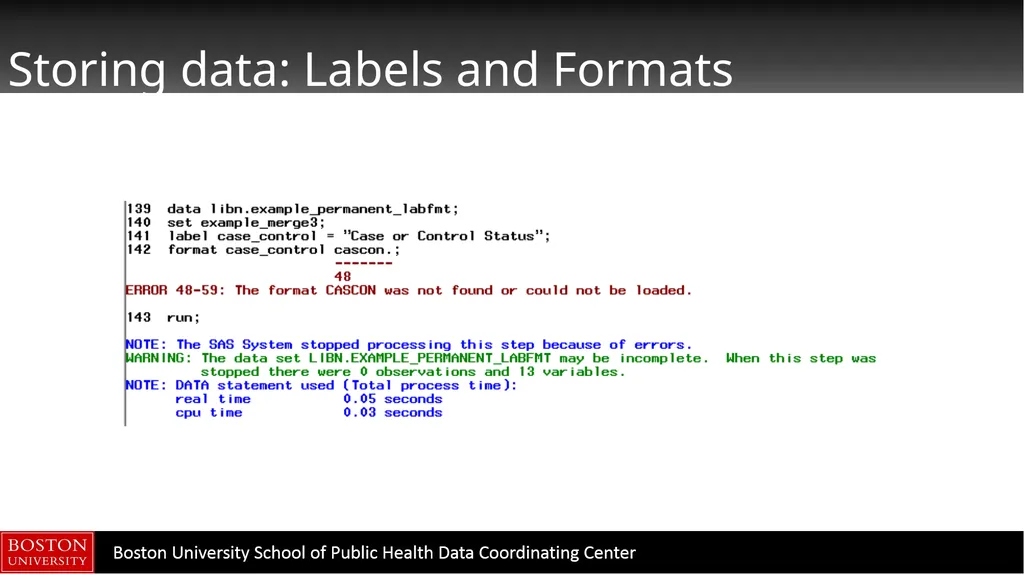
Storing data: Labels and Formats proc format library=libn;
value cascon
1 = 'Case'
0 = 'Control';
run;
data libn.example_permanent_labfmt;
set example_merge3;
label case_control = "Case or Control Status";
format case_control cascon.;
run;<br>
value cascon
1 = 'Case'
0 = 'Control';
run;
data libn.example_permanent_labfmt;
set example_merge3;
label case_control = "Case or Control Status";
format case_control cascon.;
run;<br>
36
Storing data: Labels and Formats<br>
37
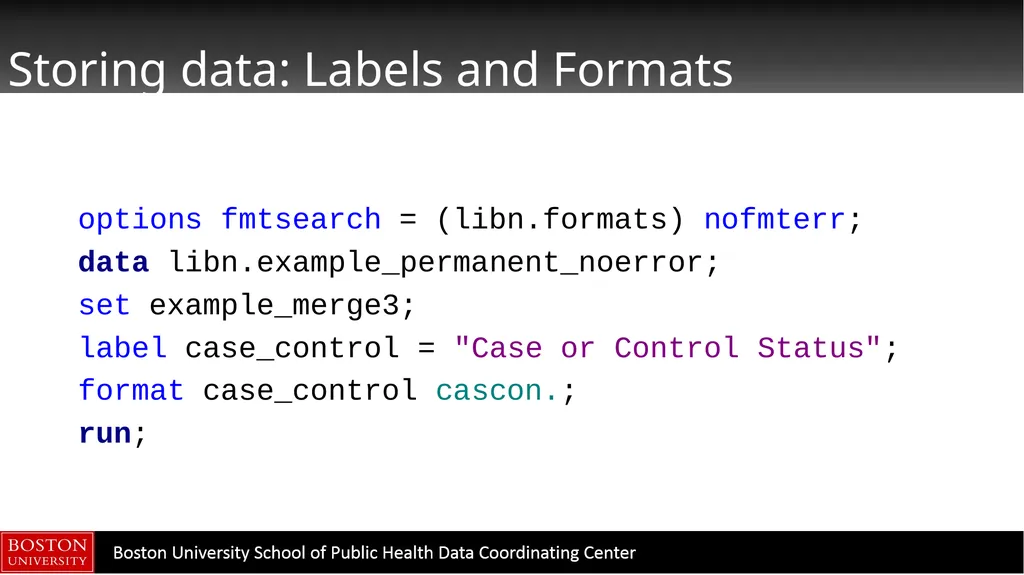
Storing data: Labels and Formats options fmtsearch = (libn.formats) nofmterr;
data libn.example_permanent_noerror;
set example_merge3;
label case_control = "Case or Control Status";
format case_control cascon.;
run;<br>
data libn.example_permanent_noerror;
set example_merge3;
label case_control = "Case or Control Status";
format case_control cascon.;
run;<br>
38
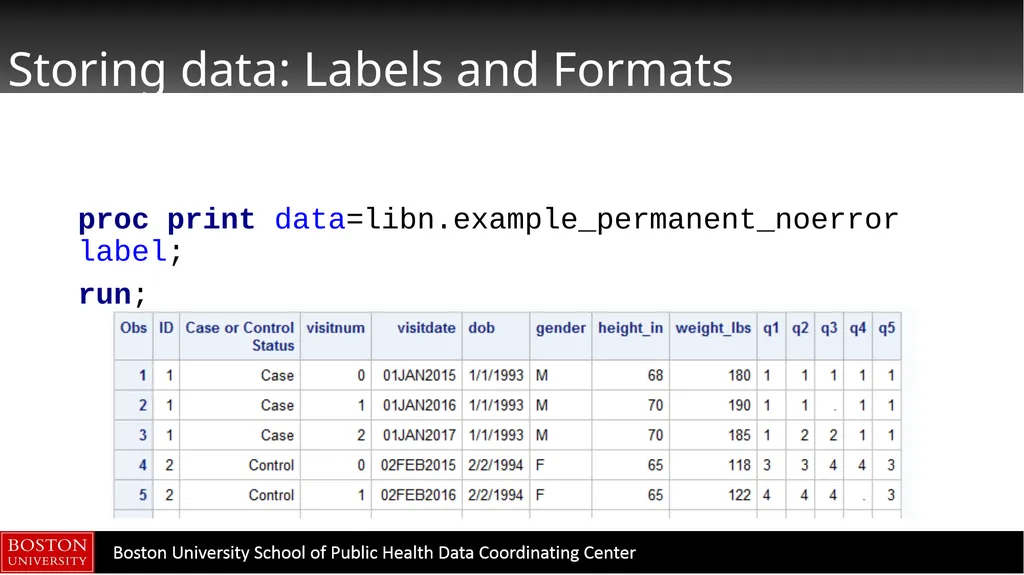
Storing data: Labels and Formats proc print data=libn.example_permanent_noerror label;
run;<br>
run;<br>
39
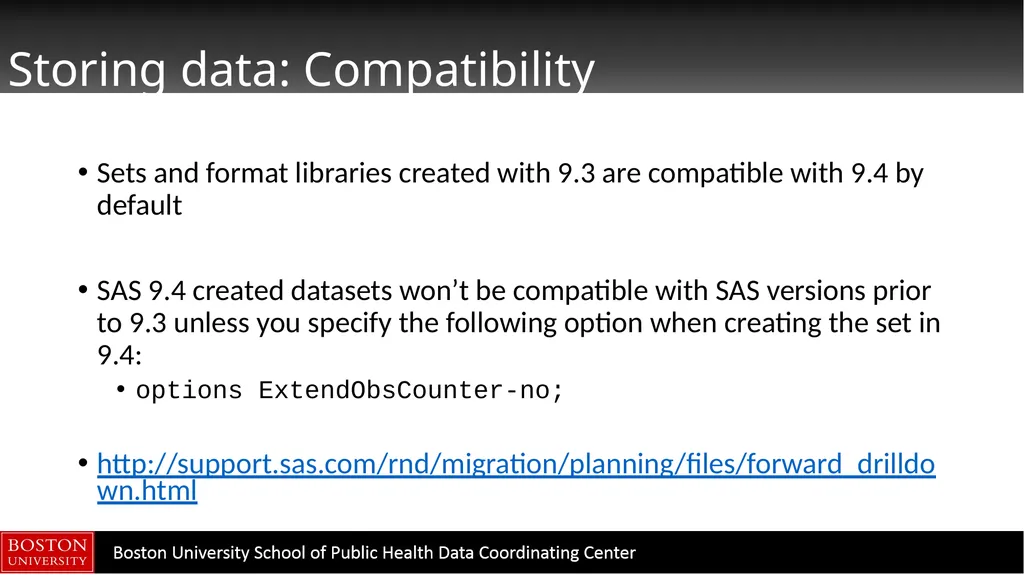
Storing data: Compatibility Sets and format libraries created with 9.3 are compatible with 9.4 by default
SAS 9.4 created datasets won’t be compatible with SAS versions prior to 9.3 unless you specify the following option when creating the set in 9.4:
options ExtendObsCounter-no;
http://support.sas.com/rnd/migration/planning/files/forward_drilldown.html<br>
SAS 9.4 created datasets won’t be compatible with SAS versions prior to 9.3 unless you specify the following option when creating the set in 9.4:
options ExtendObsCounter-no;
http://support.sas.com/rnd/migration/planning/files/forward_drilldown.html<br>
40
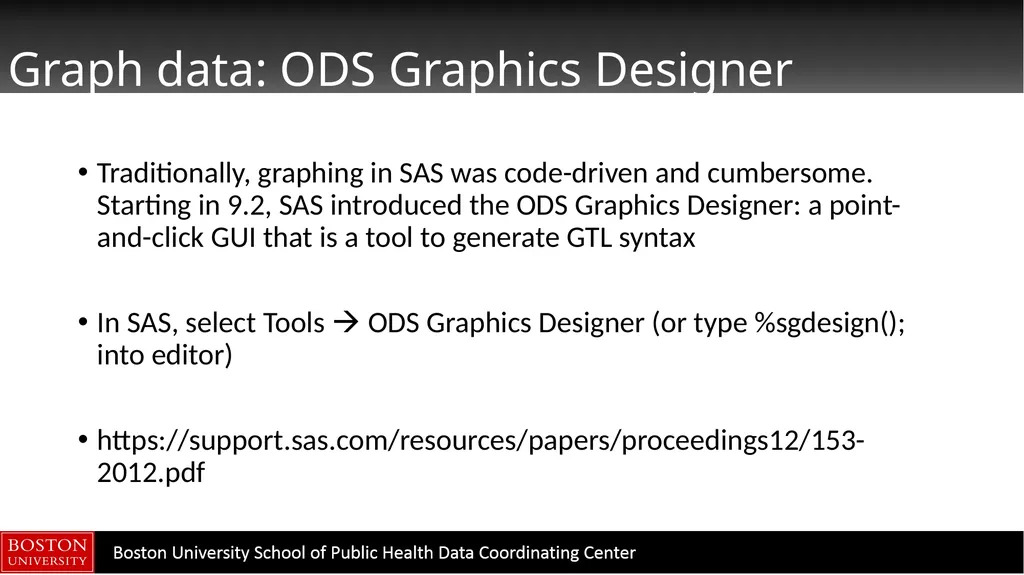
Graph data: ODS Graphics Designer Traditionally, graphing in SAS was code-driven and cumbersome. Starting in 9.2, SAS introduced the ODS Graphics Designer: a point-and-click GUI that is a tool to generate GTL syntax
In SAS, select Tools ODS Graphics Designer (or type %sgdesign(); into editor)
https://support.sas.com/resources/papers/proceedings12/153-2012.pdf<br>
In SAS, select Tools ODS Graphics Designer (or type %sgdesign(); into editor)
https://support.sas.com/resources/papers/proceedings12/153-2012.pdf<br>
41
Graph data: ODS Graphics Designer Demonstration<br>
42
Contact THANK YOU!
For questions, please contact:
Emily Sisson
Boston University SPH Data Coordinating Center
617-638-5869
eq@bu.edu<br>
For questions, please contact:
Emily Sisson
Boston University SPH Data Coordinating Center
617-638-5869
eq@bu.edu<br>