
Data quality workshop: getting it right –




Description: Data quality workshop: getting it right financial regulatory metrics Steve Smedley, Acuity Agenda 1) Benchmarking basics reminder 2) Sector metrics: how they relate ( a bit about VFM) 3) 4 key Acuity cost metrics 4) Regulatory
Related Topics
Download Presentation
"Data quality workshop: getting it right –" is the property of its rightful owner. Permission is granted to download and print the materials on this website for personal, non-commercial use only, and to display it on your personal computer provided you do not modify the materials and that you retain all copyright notices contained in the materials. By downloading content from our website, you accept the terms of this agreement.
Presentation Transcript
slide1. Data quality workshop: getting it right – financial & regulatory metrics Steve Smedley, Acuity<br>
slide2. Agenda 1) Benchmarking basics – reminder
2) Sector metrics: how they relate (& a bit about VFM)
3) 4 key Acuity cost metrics
4) Regulatory metrics
Put away any sharp objects now<br>
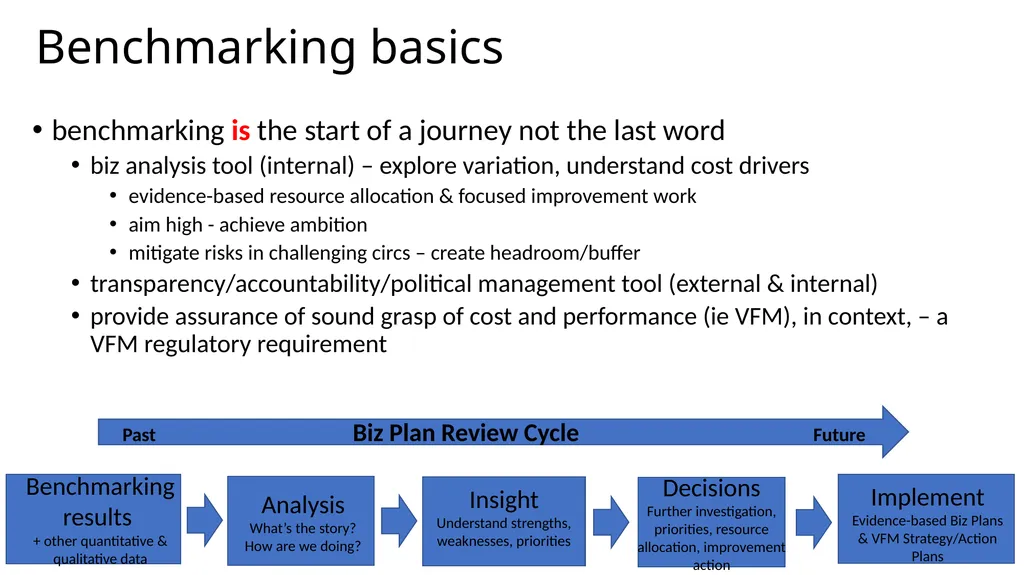
slide3. Benchmarking results
+ other quantitative & qualitative data Analysis
What’s the story?
How are we doing? Insight
Understand strengths, weaknesses, priorities Decisions
Further investigation, priorities, resource allocation, improvement action Past Biz Plan Review Cycle Future Implement
Evidence-based Biz Plans & VFM Strategy/Action Plans benchmarking is the start of a journey not the last word
biz analysis tool (internal) – explore variation, understand cost drivers
evidence-based resource allocation & focused improvement work
aim high - achieve ambition
mitigate risks in challenging circs – create headroom/buffer
transparency/accountability/political management tool (external & internal)
provide assurance of sound grasp of cost and performance (ie VFM), in context, – a VFM regulatory requirement Benchmarking basics<br>
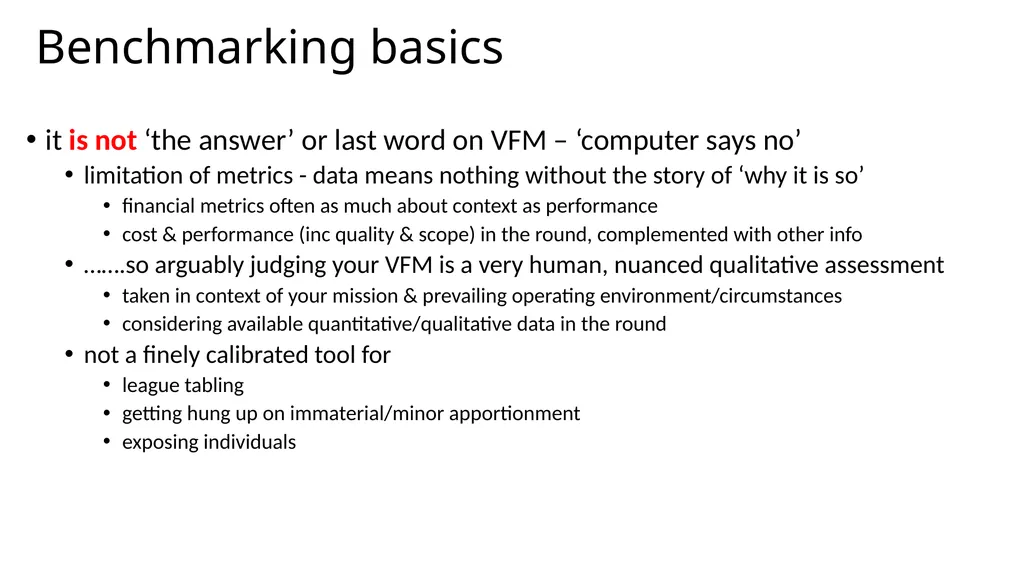
slide4. Benchmarking basics it is not ‘the answer’ or last word on VFM – ‘computer says no’
limitation of metrics - data means nothing without the story of ‘why it is so’
financial metrics often as much about context as performance
cost & performance (inc quality & scope) in the round, complemented with other info
…….so arguably judging your VFM is a very human, nuanced qualitative assessment
taken in context of your mission & prevailing operating environment/circumstances
considering available quantitative/qualitative data in the round
not a finely calibrated tool for
league tabling
getting hung up on immaterial/minor apportionment
exposing individuals<br>
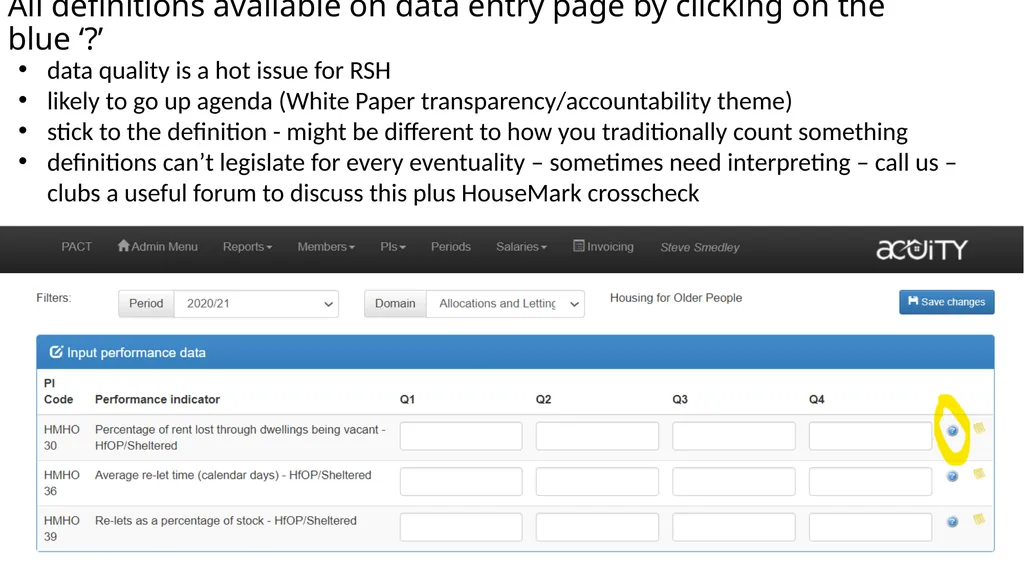
slide5. All definitions available on data entry page by clicking on the blue ‘?’ data quality is a hot issue for RSH
likely to go up agenda (White Paper transparency/accountability theme)
stick to the definition - might be different to how you traditionally count something
definitions can’t legislate for every eventuality – sometimes need interpreting – call us – clubs a useful forum to discuss this plus HouseMark crosscheck<br>
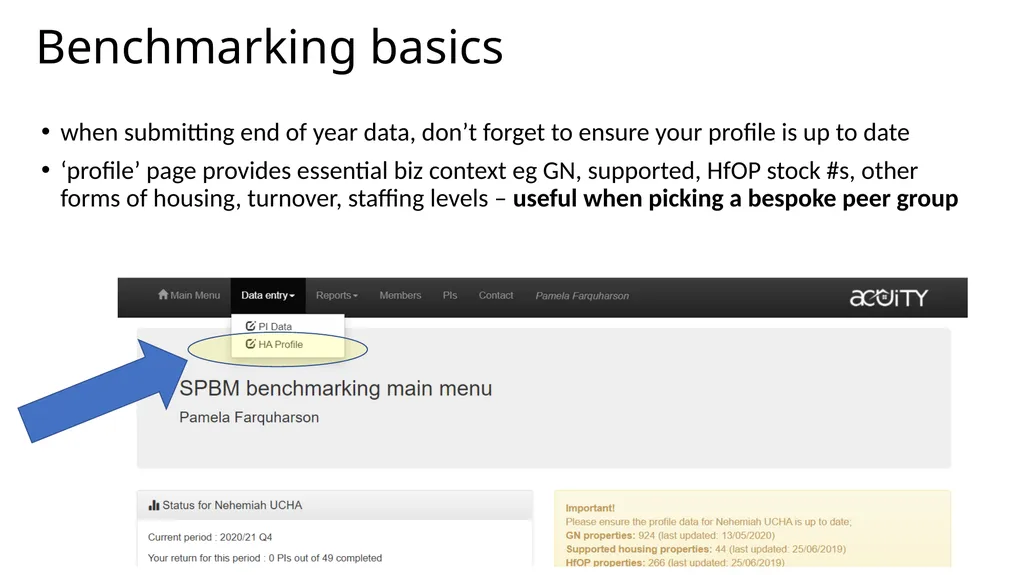
slide6. Benchmarking basics when submitting end of year data, don’t forget to ensure your profile is up to date
‘profile’ page provides essential biz context eg GN, supported, HfOP stock #s, other forms of housing, turnover, staffing levels – useful when picking a bespoke peer group<br>
slide7. Sector metrics: how they relate & a bit about VFM<br>
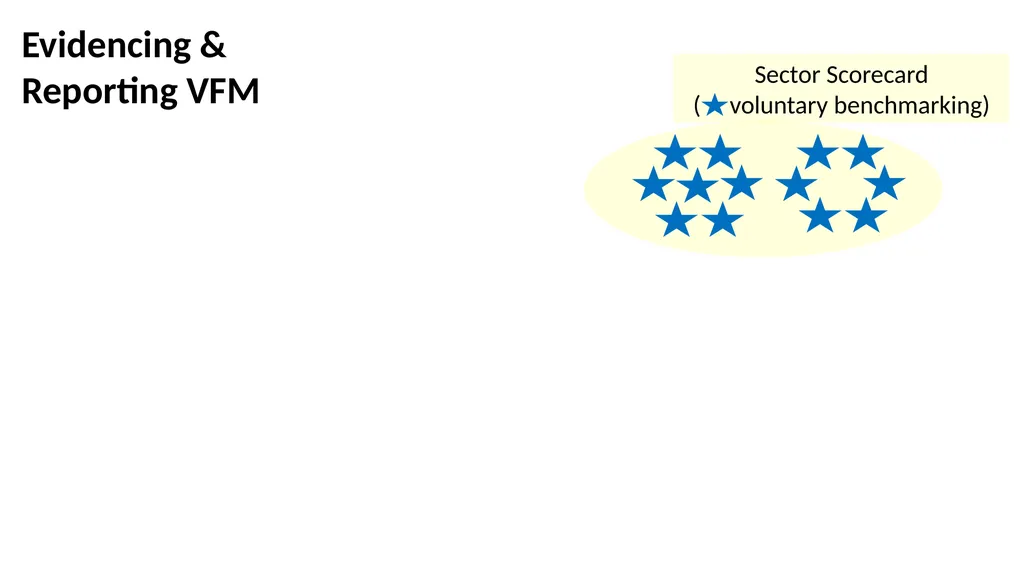
slide8. Sector Scorecard
( voluntary benchmarking) Evidencing & Reporting VFM<br>
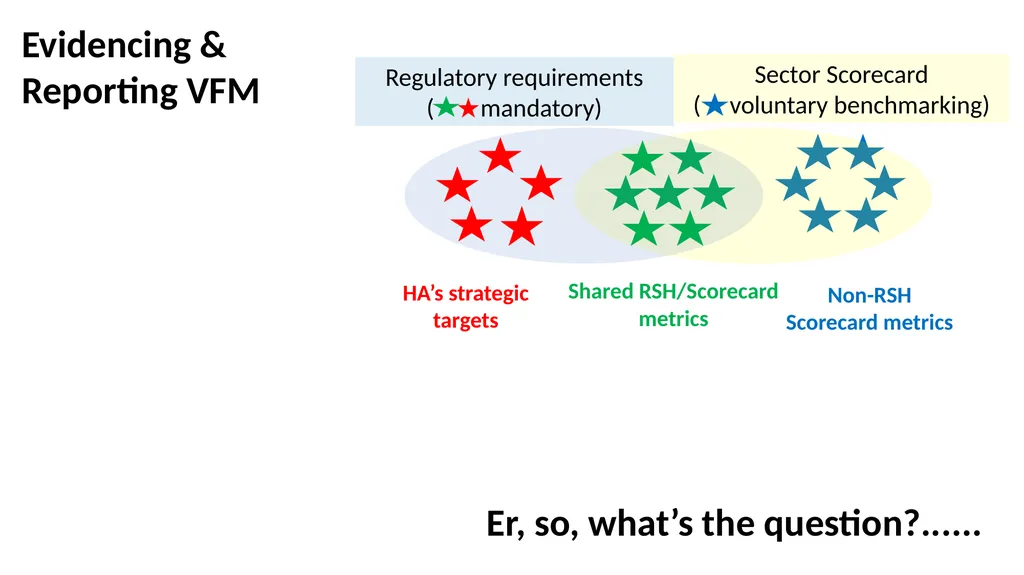
slide9. Sector Scorecard
( voluntary benchmarking) Evidencing & Reporting VFM Regulatory requirements
( mandatory) Shared RSH/Scorecard metrics Non-RSH Scorecard metrics HA’s strategic targets Er, so, what’s the question?......<br>
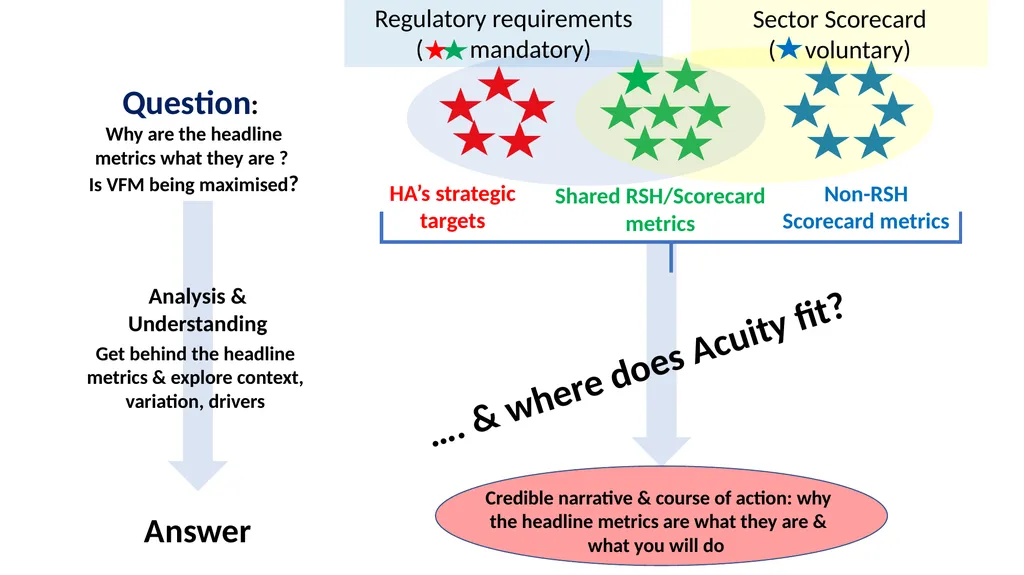
slide10. Shared RSH/Scorecard metrics Answer HA’s strategic targets Question:
Why are the headline metrics what they are ?
Is VFM being maximised? Non-RSH Scorecard metrics Credible narrative & course of action: why the headline metrics are what they are & what you will do Get behind the headline metrics & explore context, variation, drivers Analysis & Understanding Regulatory requirements
( mandatory) Sector Scorecard
( voluntary) …. & where does Acuity fit?<br>
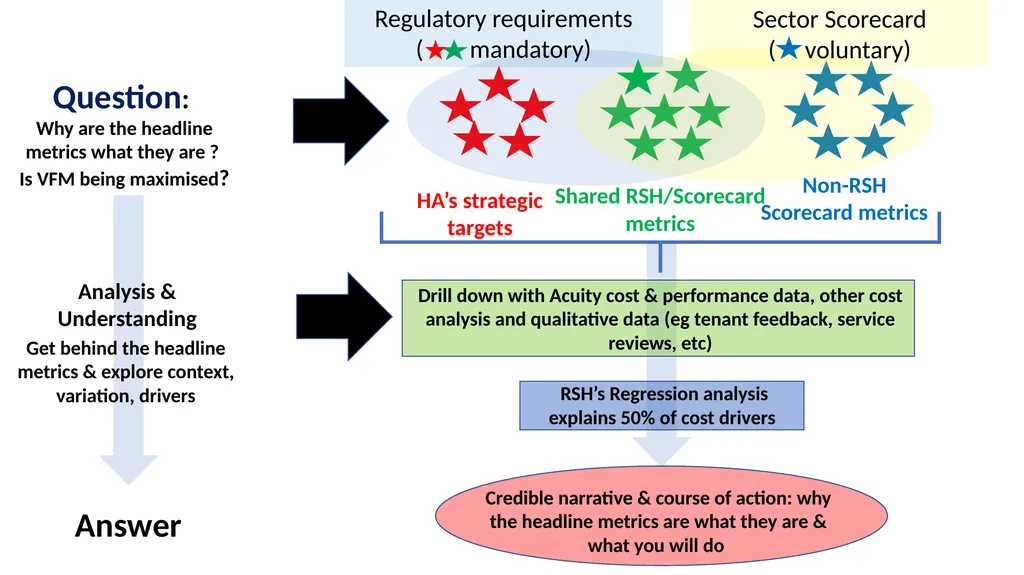
slide11. Shared RSH/Scorecard metrics Drill down with Acuity cost & performance data, other cost analysis and qualitative data (eg tenant feedback, service reviews, etc) Answer RSH’s Regression analysis explains 50% of cost drivers HA’s strategic targets Question:
Why are the headline metrics what they are ?
Is VFM being maximised? Non-RSH Scorecard metrics Credible narrative & course of action: why the headline metrics are what they are & what you will do Get behind the headline metrics & explore context, variation, drivers Analysis & Understanding Regulatory requirements
( mandatory) Sector Scorecard
( voluntary)<br>
slide12. Where do 23ish consumer metrics leave the scorecard?<br>
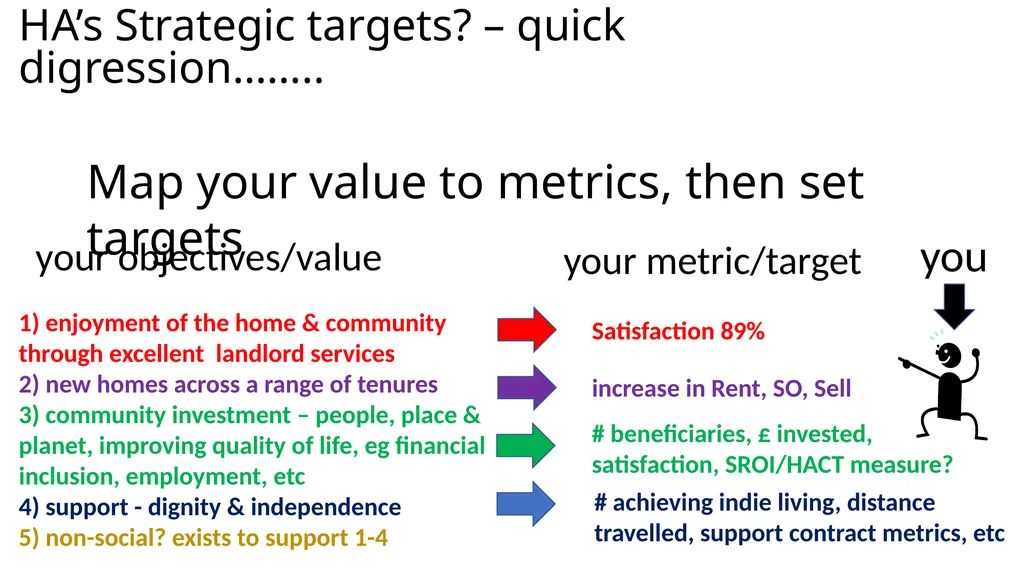
slide13. HA’s Strategic targets? – quick digression…….. 1) enjoyment of the home & community through excellent landlord services
2) new homes across a range of tenures
3) community investment – people, place & planet, improving quality of life, eg financial inclusion, employment, etc
4) support - dignity & independence
5) non-social? exists to support 1-4 you your objectives/value your metric/target Satisfaction 89% increase in Rent, SO, Sell # beneficiaries, £ invested, satisfaction, SROI/HACT measure? # achieving indie living, distance travelled, support contract metrics, etc Map your value to metrics, then set targets<br>
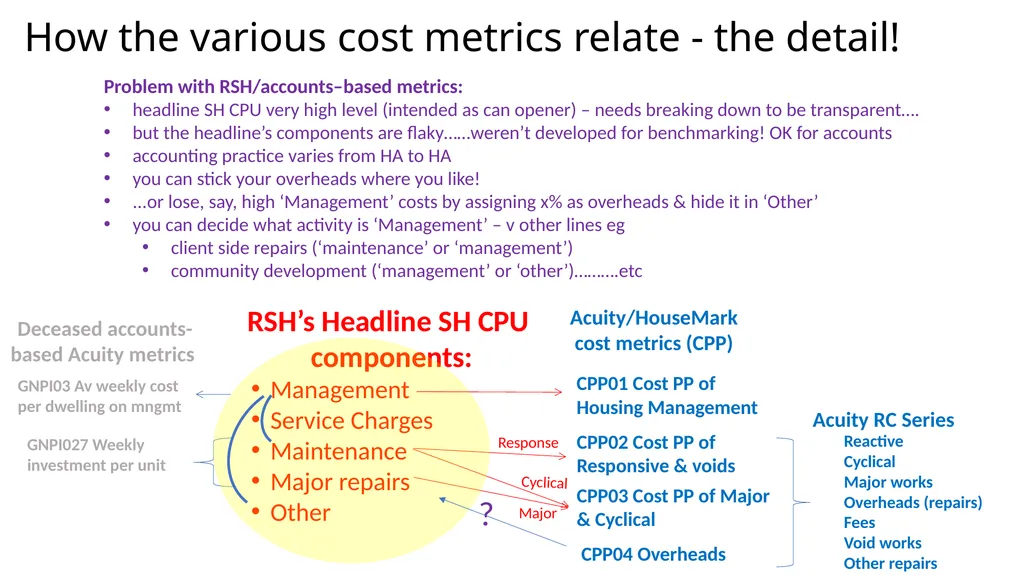
slide14. RSH’s Headline SH CPU
components:
Management
Service Charges
Maintenance
Major repairs
Other GNPI03 Av weekly cost per dwelling on mngmt GNPI027 Weekly investment per unit Deceased accounts-based Acuity metrics CPP01 Cost PP of Housing Management CPP02 Cost PP of Responsive & voids CPP03 Cost PP of Major & Cyclical Acuity/HouseMark cost metrics (CPP) Acuity RC Series Reactive
Cyclical
Major works
Overheads (repairs)
Fees
Void works
Other repairs Cyclical Response Major How the various cost metrics relate - the detail! CPP04 Overheads ? Problem with RSH/accounts–based metrics:
headline SH CPU very high level (intended as can opener) – needs breaking down to be transparent….
but the headline’s components are flaky……weren’t developed for benchmarking! OK for accounts
accounting practice varies from HA to HA
you can stick your overheads where you like!
...or lose, say, high ‘Management’ costs by assigning x% as overheads & hide it in ‘Other’
you can decide what activity is ‘Management’ – v other lines eg
client side repairs (‘maintenance’ or ‘management’)
community development (‘management’ or ‘other’)……….etc<br>
slide15. 4 key Acuity cost metrics<br>
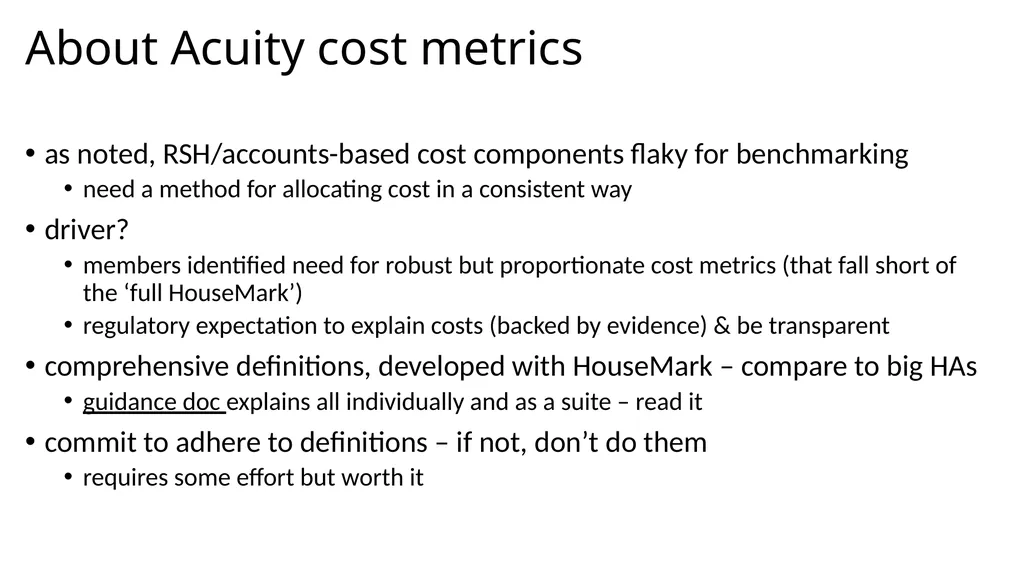
slide16. About Acuity cost metrics as noted, RSH/accounts-based cost components flaky for benchmarking
need a method for allocating cost in a consistent way
driver?
members identified need for robust but proportionate cost metrics (that fall short of the ‘full HouseMark’)
regulatory expectation to explain costs (backed by evidence) & be transparent
comprehensive definitions, developed with HouseMark – compare to big HAs
guidance doc explains all individually and as a suite – read it
commit to adhere to definitions – if not, don’t do them
requires some effort but worth it<br>
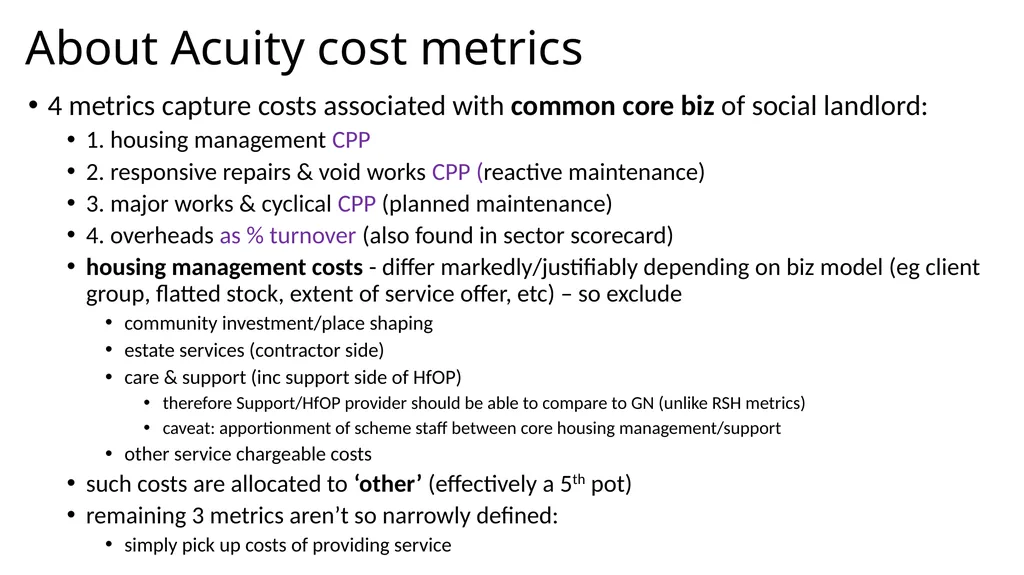
slide17. About Acuity cost metrics 4 metrics capture costs associated with common core biz of social landlord:
1. housing management CPP
2. responsive repairs & void works CPP (reactive maintenance)
3. major works & cyclical CPP (planned maintenance)
4. overheads as % turnover (also found in sector scorecard)
housing management costs - differ markedly/justifiably depending on biz model (eg client group, flatted stock, extent of service offer, etc) – so exclude
community investment/place shaping
estate services (contractor side)
care & support (inc support side of HfOP)
therefore Support/HfOP provider should be able to compare to GN (unlike RSH metrics)
caveat: apportionment of scheme staff between core housing management/support
other service chargeable costs
such costs are allocated to ‘other’ (effectively a 5th pot)
remaining 3 metrics aren’t so narrowly defined:
simply pick up costs of providing service<br>
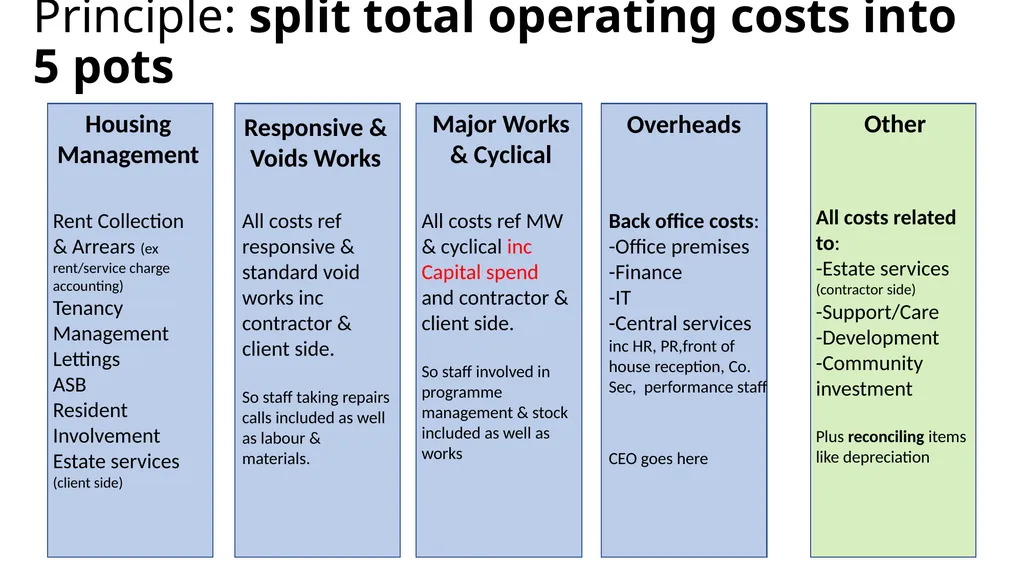
slide18. Principle: split total operating costs into 5 pots Housing Management Other Overheads Major Works & Cyclical Responsive & Voids Works Rent Collection & Arrears (ex rent/service charge accounting)
Tenancy Management
Lettings
ASB
Resident Involvement
Estate services (client side) All costs ref responsive & standard void works inc contractor & client side.
So staff taking repairs calls included as well as labour & materials. All costs ref MW & cyclical inc Capital spend and contractor & client side.
So staff involved in programme management & stock included as well as works Back office costs:
-Office premises
-Finance
-IT
-Central services inc HR, PR,front of house reception, Co. Sec, performance staff
CEO goes here All costs related to:
-Estate services (contractor side)
-Support/Care
-Development
-Community investment
Plus reconciling items like depreciation<br>
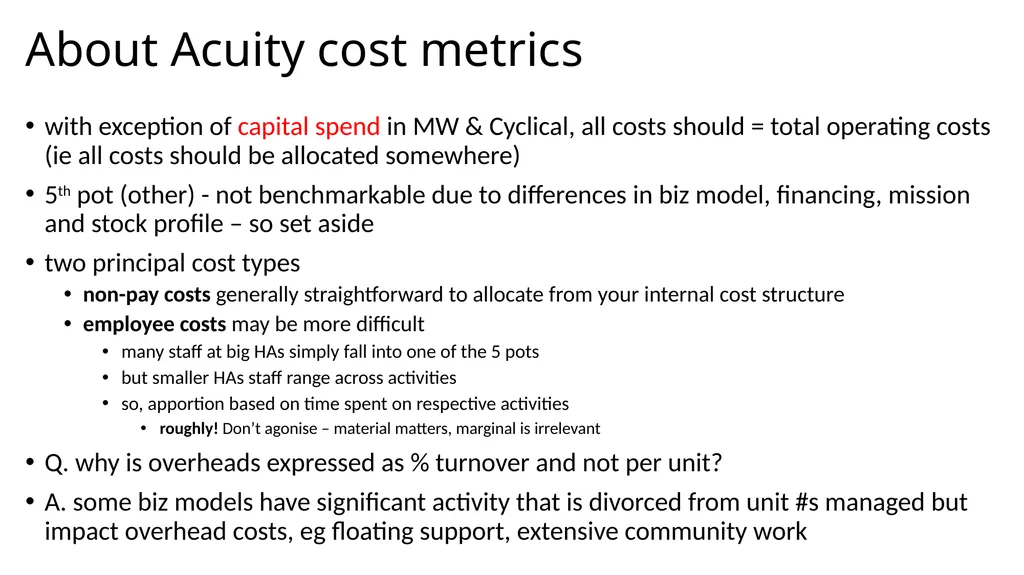
slide19. About Acuity cost metrics with exception of capital spend in MW & Cyclical, all costs should = total operating costs (ie all costs should be allocated somewhere)
5th pot (other) - not benchmarkable due to differences in biz model, financing, mission and stock profile – so set aside
two principal cost types
non-pay costs generally straightforward to allocate from your internal cost structure
employee costs may be more difficult
many staff at big HAs simply fall into one of the 5 pots
but smaller HAs staff range across activities
so, apportion based on time spent on respective activities
roughly! Don’t agonise – material matters, marginal is irrelevant
Q. why is overheads expressed as % turnover and not per unit?
A. some biz models have significant activity that is divorced from unit #s managed but impact overhead costs, eg floating support, extensive community work<br>
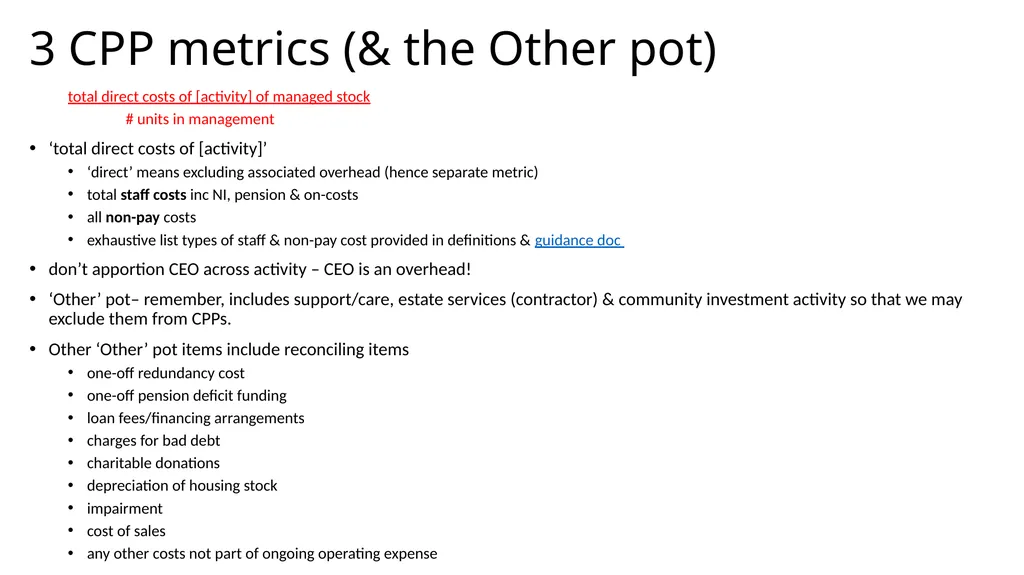
slide20. total direct costs of [activity] of managed stock
# units in management
‘total direct costs of [activity]’
‘direct’ means excluding associated overhead (hence separate metric)
total staff costs inc NI, pension & on-costs
all non-pay costs
exhaustive list types of staff & non-pay cost provided in definitions & guidance doc
don’t apportion CEO across activity – CEO is an overhead!
‘Other’ pot– remember, includes support/care, estate services (contractor) & community investment activity so that we may exclude them from CPPs.
Other ‘Other’ pot items include reconciling items
one-off redundancy cost
one-off pension deficit funding
loan fees/financing arrangements
charges for bad debt
charitable donations
depreciation of housing stock
impairment
cost of sales
any other costs not part of ongoing operating expense 3 CPP metrics (& the Other pot)<br>
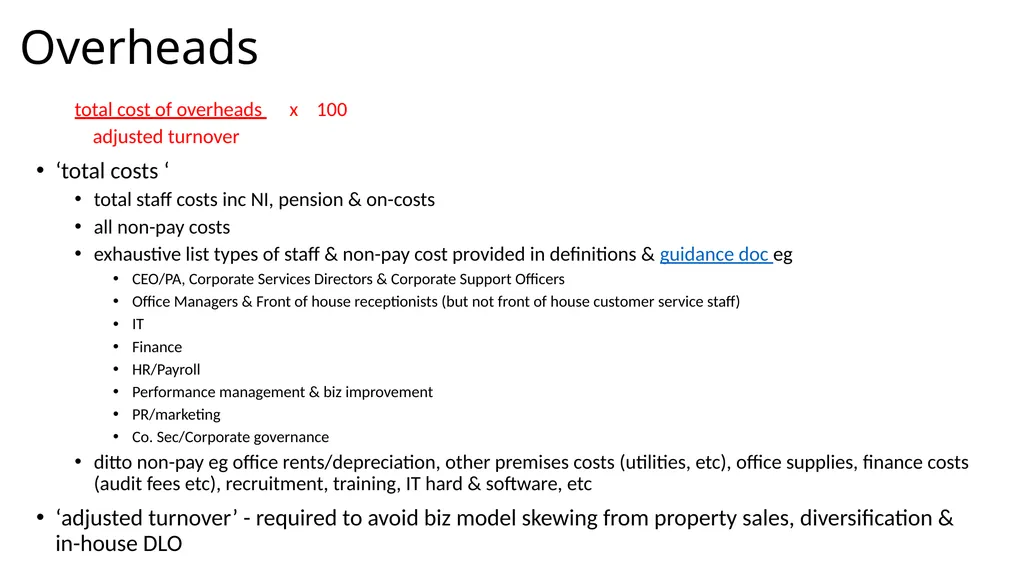
slide21. Overheads total cost of overheads x 100
adjusted turnover
‘total costs ‘
total staff costs inc NI, pension & on-costs
all non-pay costs
exhaustive list types of staff & non-pay cost provided in definitions & guidance doc eg
CEO/PA, Corporate Services Directors & Corporate Support Officers
Office Managers & Front of house receptionists (but not front of house customer service staff)
IT
Finance
HR/Payroll
Performance management & biz improvement
PR/marketing
Co. Sec/Corporate governance
ditto non-pay eg office rents/depreciation, other premises costs (utilities, etc), office supplies, finance costs (audit fees etc), recruitment, training, IT hard & software, etc
‘adjusted turnover’ - required to avoid biz model skewing from property sales, diversification & in-house DLO<br>
slide22. Regulatory metrics<br>
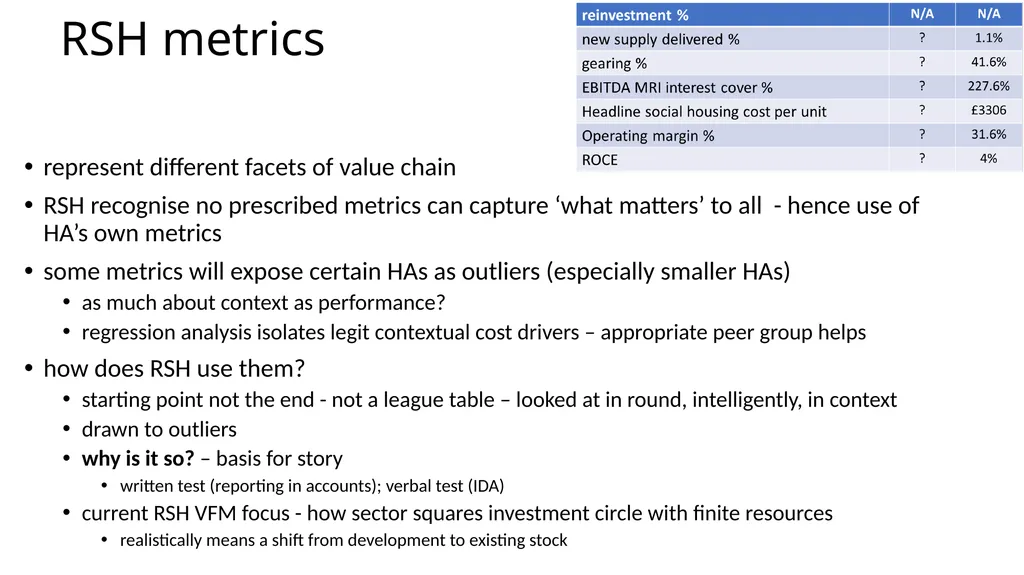
slide23. RSH metrics represent different facets of value chain
RSH recognise no prescribed metrics can capture ‘what matters’ to all - hence use of HA’s own metrics
some metrics will expose certain HAs as outliers (especially smaller HAs)
as much about context as performance?
regression analysis isolates legit contextual cost drivers – appropriate peer group helps
how does RSH use them?
starting point not the end - not a league table – looked at in round, intelligently, in context
drawn to outliers
why is it so? – basis for story
written test (reporting in accounts); verbal test (IDA)
current RSH VFM focus - how sector squares investment circle with finite resources
realistically means a shift from development to existing stock<br>
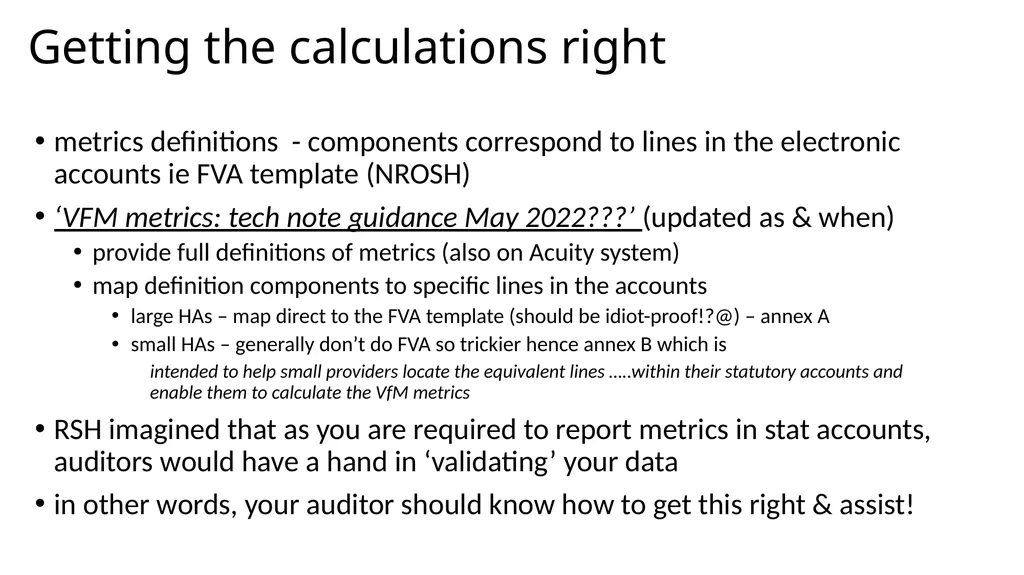
slide24. Getting the calculations right metrics definitions - components correspond to lines in the electronic accounts ie FVA template (NROSH)
‘VFM metrics: tech note guidance May 2022???’ (updated as & when)
provide full definitions of metrics (also on Acuity system)
map definition components to specific lines in the accounts
large HAs – map direct to the FVA template (should be idiot-proof!?@) – annex A
small HAs – generally don’t do FVA so trickier hence annex B which is
intended to help small providers locate the equivalent lines …..within their statutory accounts and enable them to calculate the VfM metrics
RSH imagined that as you are required to report metrics in stat accounts, auditors would have a hand in ‘validating’ your data
in other words, your auditor should know how to get this right & assist!<br>
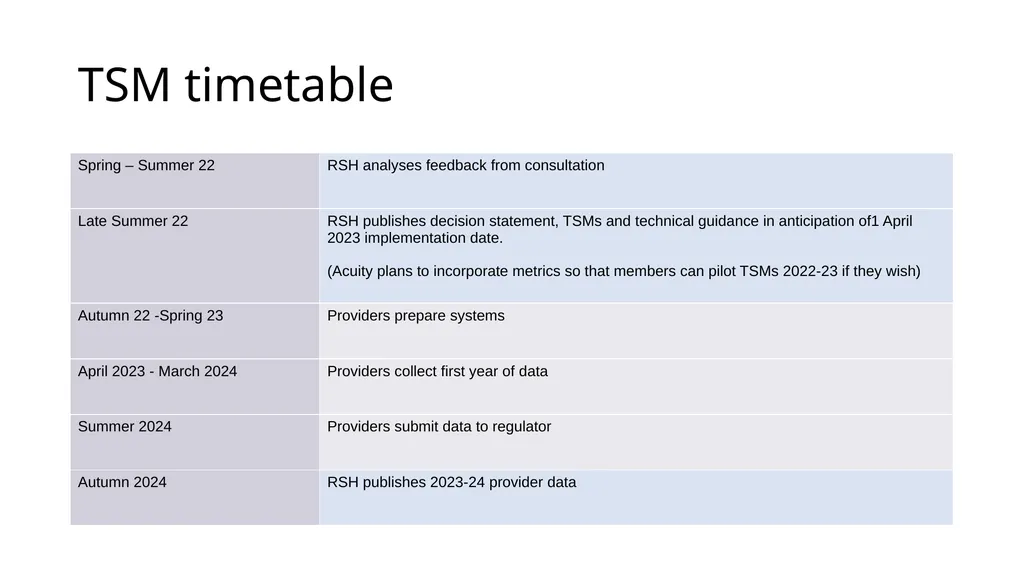
slide25. TSM timetable<br>
slide26. Get in touch about any further issues steve.smedley@arap.co.uk
07814 424426<br>
slide2. Agenda 1) Benchmarking basics – reminder
2) Sector metrics: how they relate (& a bit about VFM)
3) 4 key Acuity cost metrics
4) Regulatory metrics
Put away any sharp objects now<br>
slide3. Benchmarking results
+ other quantitative & qualitative data Analysis
What’s the story?
How are we doing? Insight
Understand strengths, weaknesses, priorities Decisions
Further investigation, priorities, resource allocation, improvement action Past Biz Plan Review Cycle Future Implement
Evidence-based Biz Plans & VFM Strategy/Action Plans benchmarking is the start of a journey not the last word
biz analysis tool (internal) – explore variation, understand cost drivers
evidence-based resource allocation & focused improvement work
aim high - achieve ambition
mitigate risks in challenging circs – create headroom/buffer
transparency/accountability/political management tool (external & internal)
provide assurance of sound grasp of cost and performance (ie VFM), in context, – a VFM regulatory requirement Benchmarking basics<br>
slide4. Benchmarking basics it is not ‘the answer’ or last word on VFM – ‘computer says no’
limitation of metrics - data means nothing without the story of ‘why it is so’
financial metrics often as much about context as performance
cost & performance (inc quality & scope) in the round, complemented with other info
…….so arguably judging your VFM is a very human, nuanced qualitative assessment
taken in context of your mission & prevailing operating environment/circumstances
considering available quantitative/qualitative data in the round
not a finely calibrated tool for
league tabling
getting hung up on immaterial/minor apportionment
exposing individuals<br>
slide5. All definitions available on data entry page by clicking on the blue ‘?’ data quality is a hot issue for RSH
likely to go up agenda (White Paper transparency/accountability theme)
stick to the definition - might be different to how you traditionally count something
definitions can’t legislate for every eventuality – sometimes need interpreting – call us – clubs a useful forum to discuss this plus HouseMark crosscheck<br>
slide6. Benchmarking basics when submitting end of year data, don’t forget to ensure your profile is up to date
‘profile’ page provides essential biz context eg GN, supported, HfOP stock #s, other forms of housing, turnover, staffing levels – useful when picking a bespoke peer group<br>
slide7. Sector metrics: how they relate & a bit about VFM<br>
slide8. Sector Scorecard
( voluntary benchmarking) Evidencing & Reporting VFM<br>
slide9. Sector Scorecard
( voluntary benchmarking) Evidencing & Reporting VFM Regulatory requirements
( mandatory) Shared RSH/Scorecard metrics Non-RSH Scorecard metrics HA’s strategic targets Er, so, what’s the question?......<br>
slide10. Shared RSH/Scorecard metrics Answer HA’s strategic targets Question:
Why are the headline metrics what they are ?
Is VFM being maximised? Non-RSH Scorecard metrics Credible narrative & course of action: why the headline metrics are what they are & what you will do Get behind the headline metrics & explore context, variation, drivers Analysis & Understanding Regulatory requirements
( mandatory) Sector Scorecard
( voluntary) …. & where does Acuity fit?<br>
slide11. Shared RSH/Scorecard metrics Drill down with Acuity cost & performance data, other cost analysis and qualitative data (eg tenant feedback, service reviews, etc) Answer RSH’s Regression analysis explains 50% of cost drivers HA’s strategic targets Question:
Why are the headline metrics what they are ?
Is VFM being maximised? Non-RSH Scorecard metrics Credible narrative & course of action: why the headline metrics are what they are & what you will do Get behind the headline metrics & explore context, variation, drivers Analysis & Understanding Regulatory requirements
( mandatory) Sector Scorecard
( voluntary)<br>
slide12. Where do 23ish consumer metrics leave the scorecard?<br>
slide13. HA’s Strategic targets? – quick digression…….. 1) enjoyment of the home & community through excellent landlord services
2) new homes across a range of tenures
3) community investment – people, place & planet, improving quality of life, eg financial inclusion, employment, etc
4) support - dignity & independence
5) non-social? exists to support 1-4 you your objectives/value your metric/target Satisfaction 89% increase in Rent, SO, Sell # beneficiaries, £ invested, satisfaction, SROI/HACT measure? # achieving indie living, distance travelled, support contract metrics, etc Map your value to metrics, then set targets<br>
slide14. RSH’s Headline SH CPU
components:
Management
Service Charges
Maintenance
Major repairs
Other GNPI03 Av weekly cost per dwelling on mngmt GNPI027 Weekly investment per unit Deceased accounts-based Acuity metrics CPP01 Cost PP of Housing Management CPP02 Cost PP of Responsive & voids CPP03 Cost PP of Major & Cyclical Acuity/HouseMark cost metrics (CPP) Acuity RC Series Reactive
Cyclical
Major works
Overheads (repairs)
Fees
Void works
Other repairs Cyclical Response Major How the various cost metrics relate - the detail! CPP04 Overheads ? Problem with RSH/accounts–based metrics:
headline SH CPU very high level (intended as can opener) – needs breaking down to be transparent….
but the headline’s components are flaky……weren’t developed for benchmarking! OK for accounts
accounting practice varies from HA to HA
you can stick your overheads where you like!
...or lose, say, high ‘Management’ costs by assigning x% as overheads & hide it in ‘Other’
you can decide what activity is ‘Management’ – v other lines eg
client side repairs (‘maintenance’ or ‘management’)
community development (‘management’ or ‘other’)……….etc<br>
slide15. 4 key Acuity cost metrics<br>
slide16. About Acuity cost metrics as noted, RSH/accounts-based cost components flaky for benchmarking
need a method for allocating cost in a consistent way
driver?
members identified need for robust but proportionate cost metrics (that fall short of the ‘full HouseMark’)
regulatory expectation to explain costs (backed by evidence) & be transparent
comprehensive definitions, developed with HouseMark – compare to big HAs
guidance doc explains all individually and as a suite – read it
commit to adhere to definitions – if not, don’t do them
requires some effort but worth it<br>
slide17. About Acuity cost metrics 4 metrics capture costs associated with common core biz of social landlord:
1. housing management CPP
2. responsive repairs & void works CPP (reactive maintenance)
3. major works & cyclical CPP (planned maintenance)
4. overheads as % turnover (also found in sector scorecard)
housing management costs - differ markedly/justifiably depending on biz model (eg client group, flatted stock, extent of service offer, etc) – so exclude
community investment/place shaping
estate services (contractor side)
care & support (inc support side of HfOP)
therefore Support/HfOP provider should be able to compare to GN (unlike RSH metrics)
caveat: apportionment of scheme staff between core housing management/support
other service chargeable costs
such costs are allocated to ‘other’ (effectively a 5th pot)
remaining 3 metrics aren’t so narrowly defined:
simply pick up costs of providing service<br>
slide18. Principle: split total operating costs into 5 pots Housing Management Other Overheads Major Works & Cyclical Responsive & Voids Works Rent Collection & Arrears (ex rent/service charge accounting)
Tenancy Management
Lettings
ASB
Resident Involvement
Estate services (client side) All costs ref responsive & standard void works inc contractor & client side.
So staff taking repairs calls included as well as labour & materials. All costs ref MW & cyclical inc Capital spend and contractor & client side.
So staff involved in programme management & stock included as well as works Back office costs:
-Office premises
-Finance
-IT
-Central services inc HR, PR,front of house reception, Co. Sec, performance staff
CEO goes here All costs related to:
-Estate services (contractor side)
-Support/Care
-Development
-Community investment
Plus reconciling items like depreciation<br>
slide19. About Acuity cost metrics with exception of capital spend in MW & Cyclical, all costs should = total operating costs (ie all costs should be allocated somewhere)
5th pot (other) - not benchmarkable due to differences in biz model, financing, mission and stock profile – so set aside
two principal cost types
non-pay costs generally straightforward to allocate from your internal cost structure
employee costs may be more difficult
many staff at big HAs simply fall into one of the 5 pots
but smaller HAs staff range across activities
so, apportion based on time spent on respective activities
roughly! Don’t agonise – material matters, marginal is irrelevant
Q. why is overheads expressed as % turnover and not per unit?
A. some biz models have significant activity that is divorced from unit #s managed but impact overhead costs, eg floating support, extensive community work<br>
slide20. total direct costs of [activity] of managed stock
# units in management
‘total direct costs of [activity]’
‘direct’ means excluding associated overhead (hence separate metric)
total staff costs inc NI, pension & on-costs
all non-pay costs
exhaustive list types of staff & non-pay cost provided in definitions & guidance doc
don’t apportion CEO across activity – CEO is an overhead!
‘Other’ pot– remember, includes support/care, estate services (contractor) & community investment activity so that we may exclude them from CPPs.
Other ‘Other’ pot items include reconciling items
one-off redundancy cost
one-off pension deficit funding
loan fees/financing arrangements
charges for bad debt
charitable donations
depreciation of housing stock
impairment
cost of sales
any other costs not part of ongoing operating expense 3 CPP metrics (& the Other pot)<br>
slide21. Overheads total cost of overheads x 100
adjusted turnover
‘total costs ‘
total staff costs inc NI, pension & on-costs
all non-pay costs
exhaustive list types of staff & non-pay cost provided in definitions & guidance doc eg
CEO/PA, Corporate Services Directors & Corporate Support Officers
Office Managers & Front of house receptionists (but not front of house customer service staff)
IT
Finance
HR/Payroll
Performance management & biz improvement
PR/marketing
Co. Sec/Corporate governance
ditto non-pay eg office rents/depreciation, other premises costs (utilities, etc), office supplies, finance costs (audit fees etc), recruitment, training, IT hard & software, etc
‘adjusted turnover’ - required to avoid biz model skewing from property sales, diversification & in-house DLO<br>
slide22. Regulatory metrics<br>
slide23. RSH metrics represent different facets of value chain
RSH recognise no prescribed metrics can capture ‘what matters’ to all - hence use of HA’s own metrics
some metrics will expose certain HAs as outliers (especially smaller HAs)
as much about context as performance?
regression analysis isolates legit contextual cost drivers – appropriate peer group helps
how does RSH use them?
starting point not the end - not a league table – looked at in round, intelligently, in context
drawn to outliers
why is it so? – basis for story
written test (reporting in accounts); verbal test (IDA)
current RSH VFM focus - how sector squares investment circle with finite resources
realistically means a shift from development to existing stock<br>
slide24. Getting the calculations right metrics definitions - components correspond to lines in the electronic accounts ie FVA template (NROSH)
‘VFM metrics: tech note guidance May 2022???’ (updated as & when)
provide full definitions of metrics (also on Acuity system)
map definition components to specific lines in the accounts
large HAs – map direct to the FVA template (should be idiot-proof!?@) – annex A
small HAs – generally don’t do FVA so trickier hence annex B which is
intended to help small providers locate the equivalent lines …..within their statutory accounts and enable them to calculate the VfM metrics
RSH imagined that as you are required to report metrics in stat accounts, auditors would have a hand in ‘validating’ your data
in other words, your auditor should know how to get this right & assist!<br>
slide25. TSM timetable<br>
slide26. Get in touch about any further issues steve.smedley@arap.co.uk
07814 424426<br>