
Data Uses and Dissemination These materials have

Description: Data Uses and Dissemination These materials have been developed by the National Center for Health Statistics, International Statistics Program, Hyattsville, Md., as part of the CDC Global Program for Civil Registration and Vital Statistics
Related Topics
Download Presentation
"Data Uses and Dissemination These materials have" is the property of its rightful owner. Permission is granted to download and print the materials on this website for personal, non-commercial use only, and to display it on your personal computer provided you do not modify the materials and that you retain all copyright notices contained in the materials. By downloading content from our website, you accept the terms of this agreement.
Presentation Transcript
slide1. Data Uses and Dissemination These materials have been developed by the National Center for Health Statistics, International Statistics Program, Hyattsville, Md., as part of the CDC Global Program for Civil Registration and Vital Statistics Improvement.<br>
slide2. Outline Using vital statistics
Publications
Electronic media/internet
Special uses of data
Professional/technical meetings
International comparisons<br>
slide3. NOTE Goal of presentation: to explain how vital statistics processes should work
Information may not be directly relevant to your work, but you can:
Use the information to evaluate available CRVS data
Advocate for improvements to CRVS system
Apply the information in own work setting (i.e. local area or hospital)<br>
slide4. Using Vital Statistics United Nations minimal goals:
1) Total monthly or quarterly summary counts prompt enough to provide info for administrative or other needs
2) Detailed annual tabulations for vital events cross classified by demographic and socioeconomic characteristics SOURCES: PRVSS2, Chapter II.D.4; NCHS, 15:6.<br>
slide5. Using Vital Statistics Central agency needs to:
Identify and assess needs of users
Understand problems of VS suppliers & users
Make sure VS suppliers & users understand their obligations and constraints
Disseminate VS information widely
Alternative: make micro-level data available to outside users/researchers SOURCES: PRVSS2, Chapter II.D.4; NCHS, 15:6.<br>
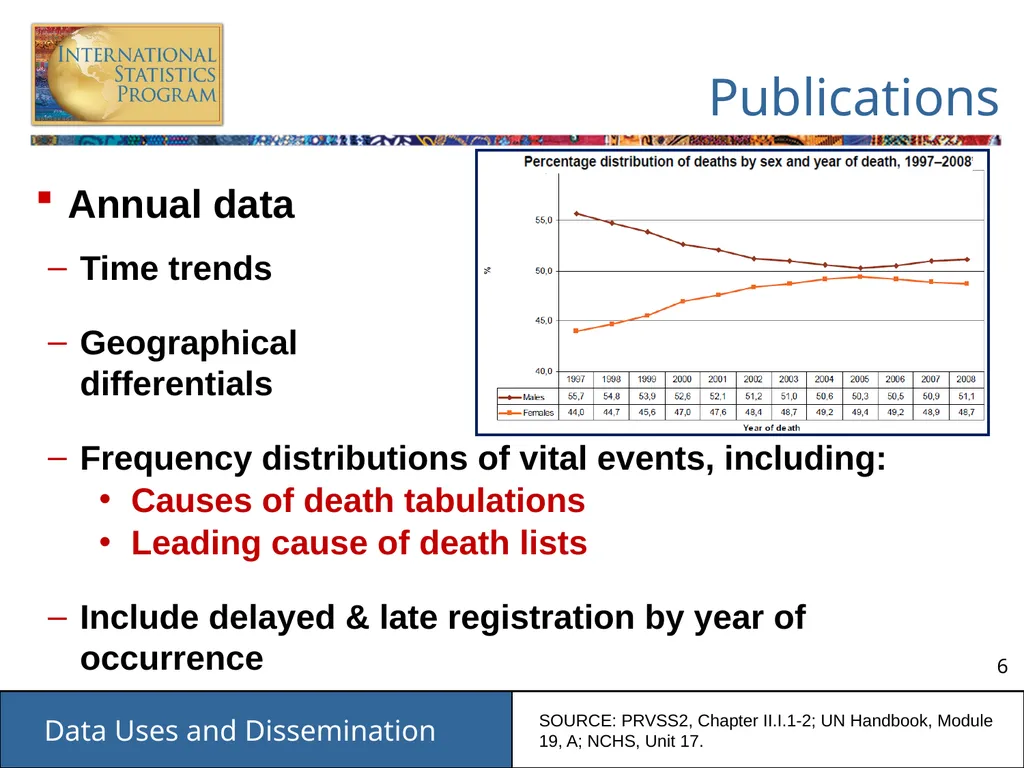
slide6. Publications Annual data
Time trends
Geographical differentials
Frequency distributions of vital events, including:
Causes of death tabulations
Leading cause of death lists
Include delayed & late registration by year of occurrence SOURCE: PRVSS2, Chapter II.I.1-2; UN Handbook, Module 19, A; NCHS, Unit 17.<br>
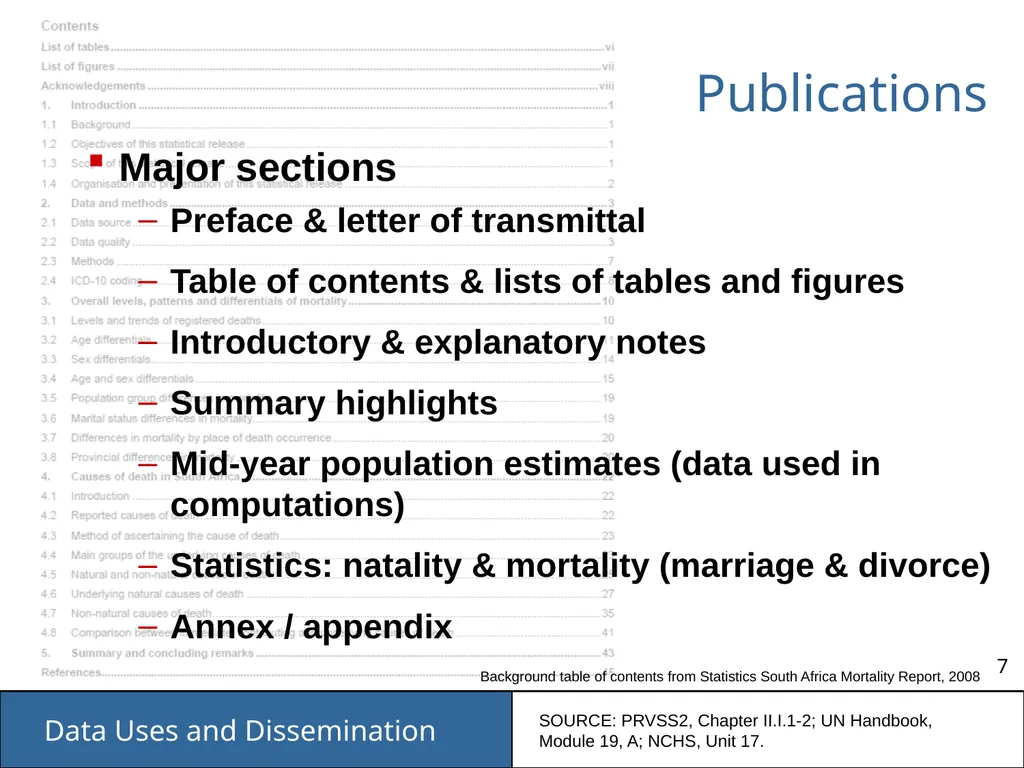
slide7. Publications Major sections
Preface & letter of transmittal
Table of contents & lists of tables and figures
Introductory & explanatory notes
Summary highlights
Mid-year population estimates (data used in computations)
Statistics: natality & mortality (marriage & divorce)
Annex / appendix SOURCE: PRVSS2, Chapter II.I.1-2; UN Handbook, Module 19, A; NCHS, Unit 17. Background table of contents from Statistics South Africa Mortality Report, 2008<br>
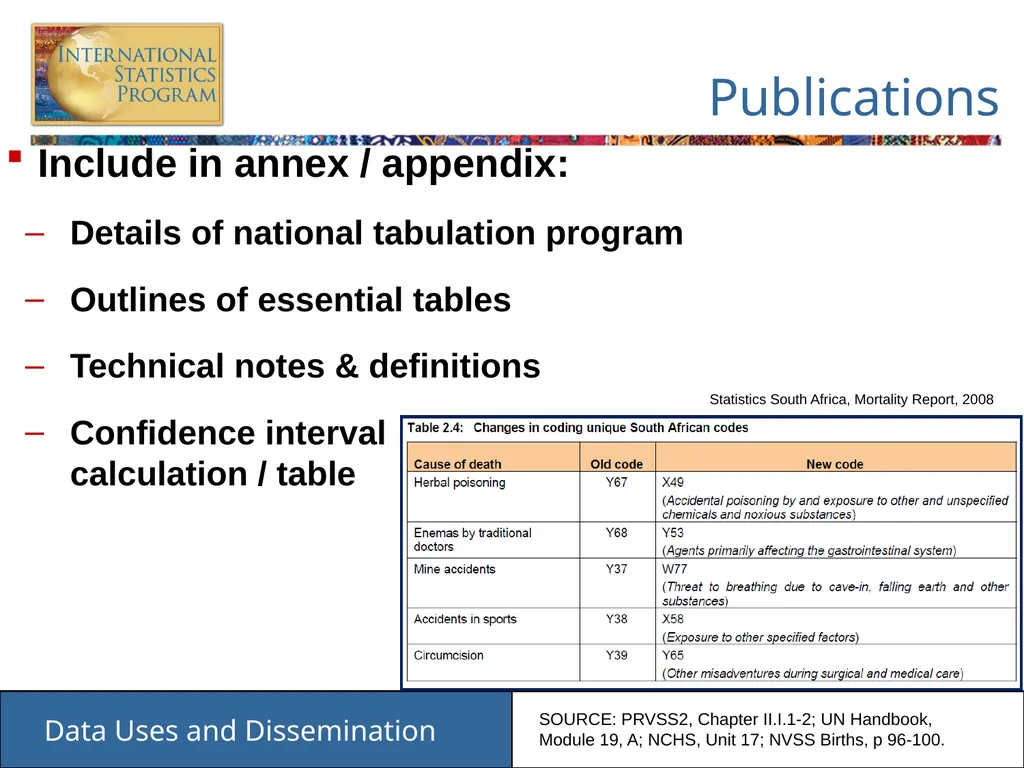
slide8. Publications Include in annex / appendix:
Details of national tabulation program
Outlines of essential tables
Technical notes & definitions
Confidence interval calculation / table Statistics South Africa, Mortality Report, 2008 SOURCE: PRVSS2, Chapter II.I.1-2; UN Handbook, Module 19, A; NCHS, Unit 17; NVSS Births, p 96-100.<br>
slide9. Publications Available on a regular & timely basis
Printed report
Ad hoc tabulations
CDs, diskettes, online, other media
Conform to a designed plan to meet user needs
Part of a series
Easily identifiable for filing and reference in libraries SOURCE: PRVSS2, Chapter II.I.1-2; UN Handbook, Module 19, A; NCHS, Unit 17.<br>
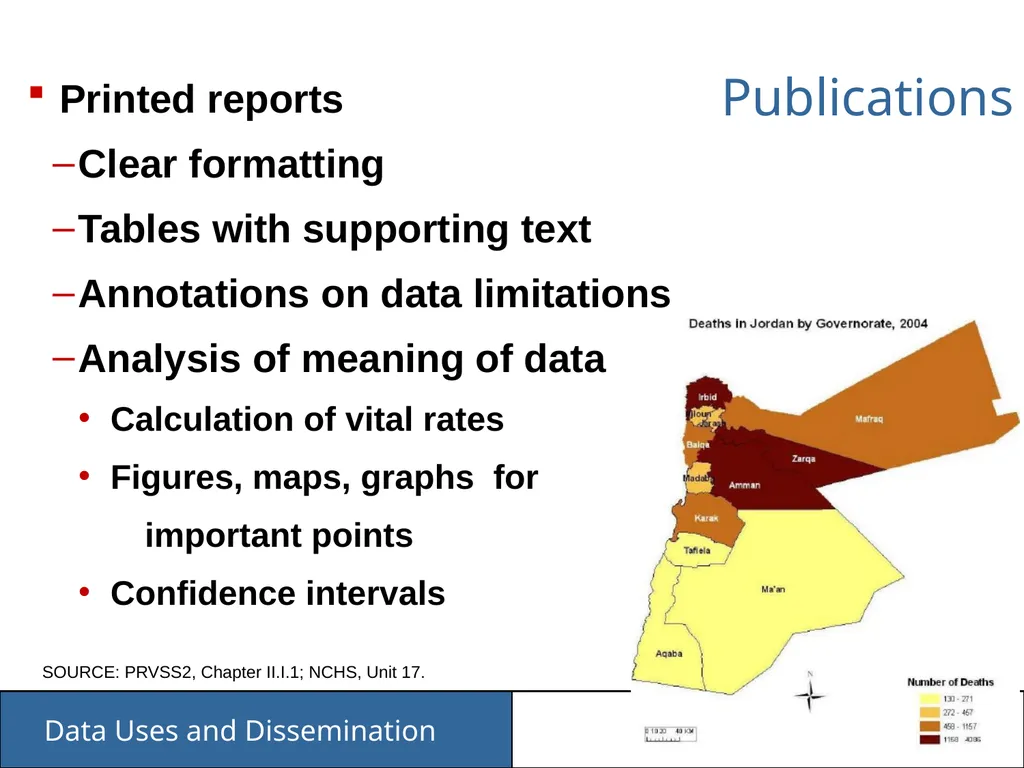
slide10. Publications Printed reports
Clear formatting
Tables with supporting text
Annotations on data limitations
Analysis of meaning of data
Calculation of vital rates
Figures, maps, graphs for
important points
Confidence intervals SOURCE: PRVSS2, Chapter II.I.1; NCHS, Unit 17.<br>
slide11. Discuss What items might go into the technical appendices of a printed annual report?<br>
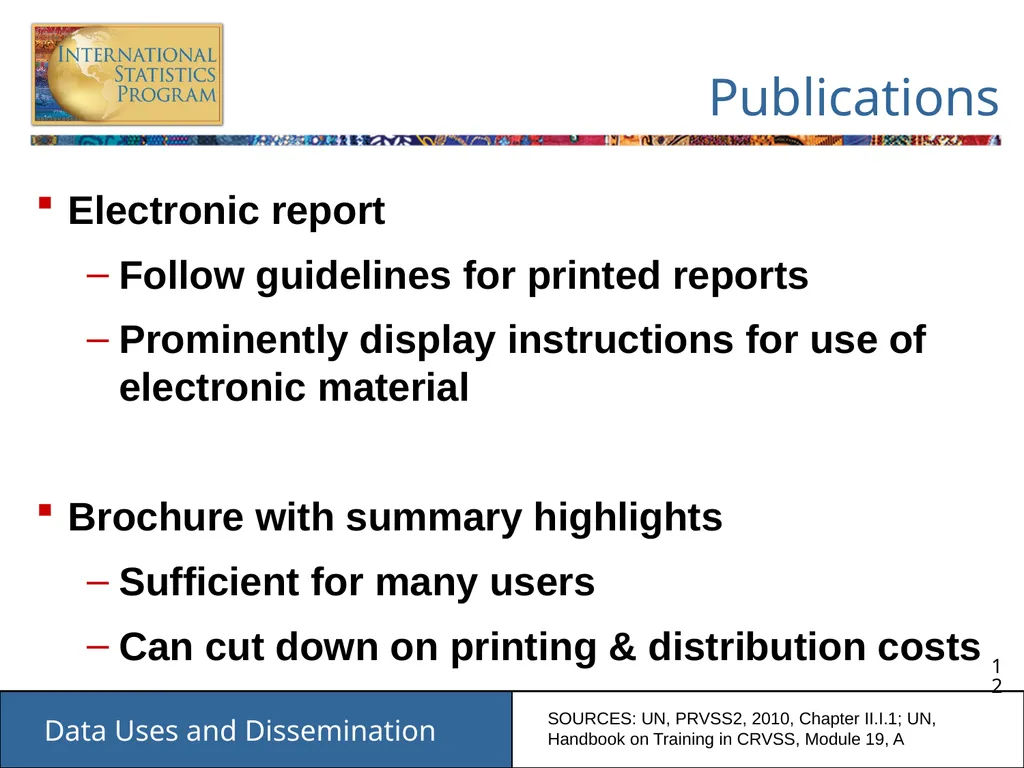
slide12. Publications Electronic report
Follow guidelines for printed reports
Prominently display instructions for use of electronic material
Brochure with summary highlights
Sufficient for many users
Can cut down on printing & distribution costs SOURCES: UN, PRVSS2, 2010, Chapter II.I.1; UN, Handbook on Training in CRVSS, Module 19, A<br>
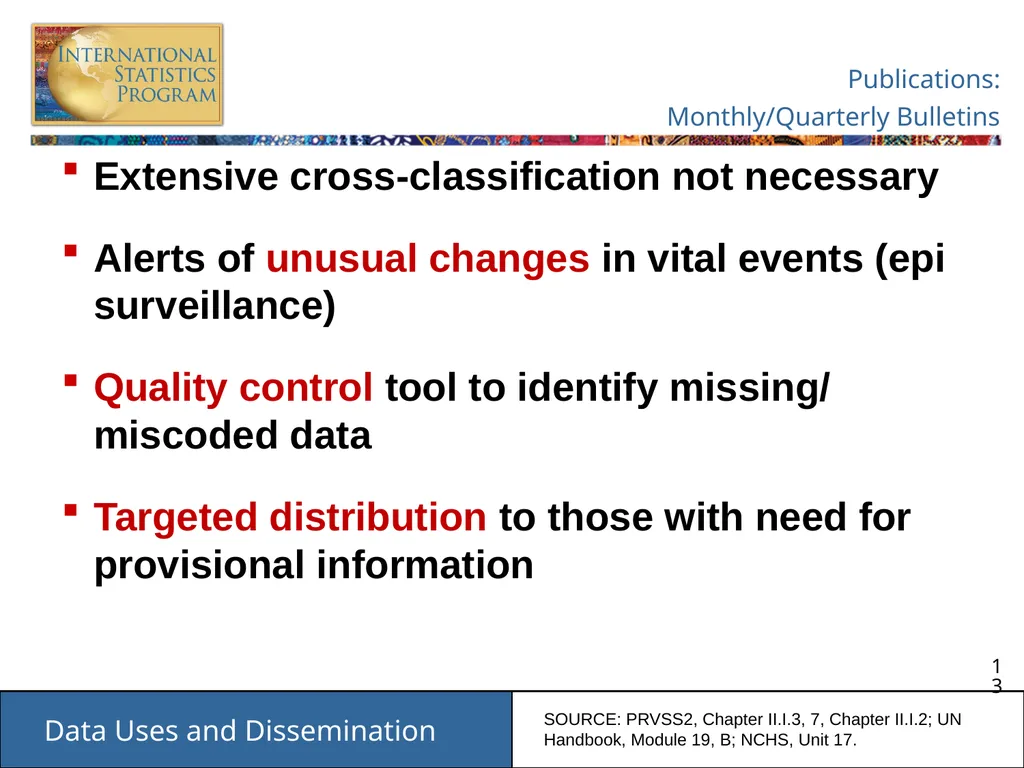
slide13. Publications: Monthly/Quarterly Bulletins Extensive cross-classification not necessary
Alerts of unusual changes in vital events (epi surveillance)
Quality control tool to identify missing/ miscoded data
Targeted distribution to those with need for provisional information SOURCE: PRVSS2, Chapter II.I.3, 7, Chapter II.I.2; UN Handbook, Module 19, B; NCHS, Unit 17.<br>
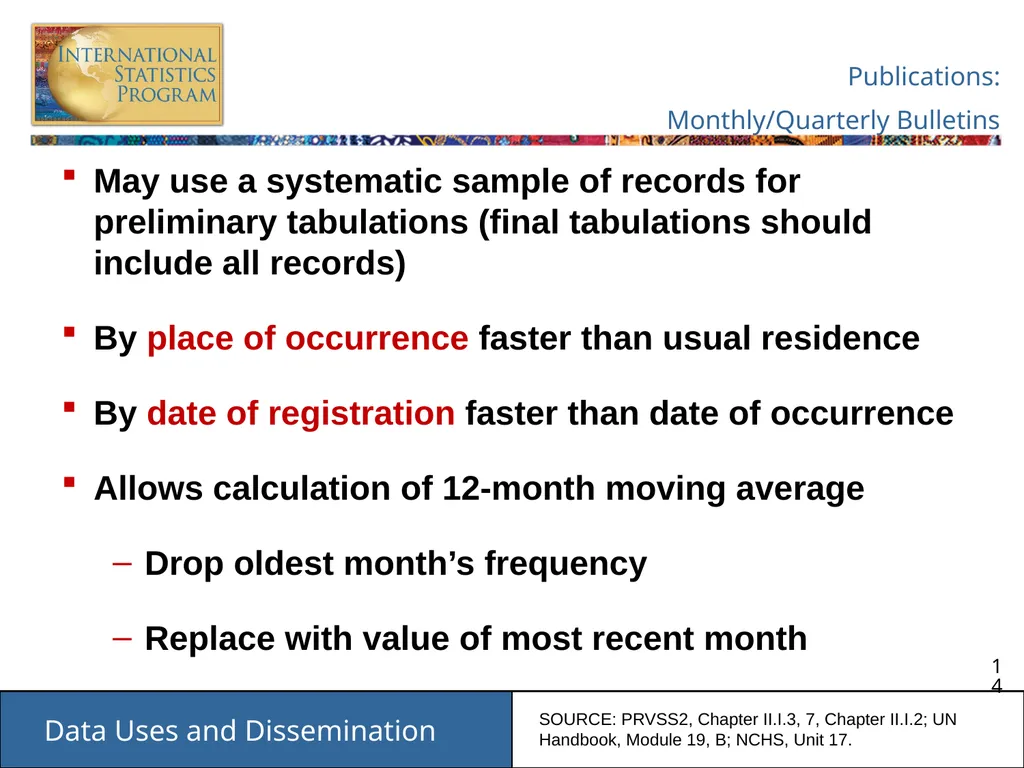
slide14. Publications: Monthly/Quarterly Bulletins May use a systematic sample of records for preliminary tabulations (final tabulations should include all records)
By place of occurrence faster than usual residence
By date of registration faster than date of occurrence
Allows calculation of 12-month moving average
Drop oldest month’s frequency
Replace with value of most recent month SOURCE: PRVSS2, Chapter II.I.3, 7, Chapter II.I.2; UN Handbook, Module 19, B; NCHS, Unit 17.<br>
slide15. Publications in [Country] Slide to describe the types of vital statistics publications that are produced in the country.<br>
slide16. Discuss What are some advantages and disadvantages of utilizing sampling rather than all records in preparing vital statistics reports?<br>
slide17. Publications: Directory of Users Efficient & targeted dissemination of reports
Track publication users and dissemination activities
Record names, addresses, fax numbers, email addresses, & products of interest (i.e. monthly report)
Update regularly SOURCE: PRVSS2, Chapter II.I.3, 7, Chapter II.I.2; UN Handbook, Module 19, B, F.<br>
slide18. Publications: Directory of Users For announcing release of products & meetings
Separate by publication type
General distribution list can include:
Demographic & other research centers
Major libraries
Health, education, planning ministries
Commercial users
Vital statistics offices of selected countries
International agencies SOURCE: NCHS, Unit 17.<br>
slide19. Review: Publications Annual data
Major sections
Availability
Design plan
Printed & electronic reports
Monthly/quarterly bulletins
Directory of users<br>
slide20. Discuss What factors would you consider in determining the contents of vital statistics reports?<br>
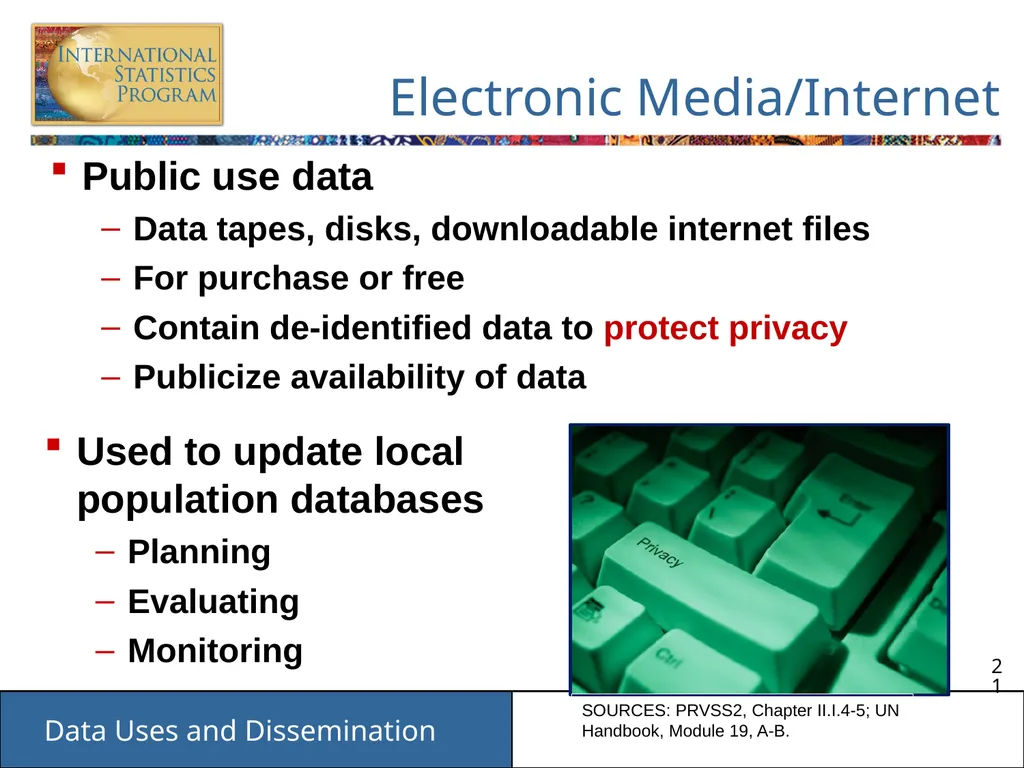
slide21. Electronic Media/Internet Public use data
Data tapes, disks, downloadable internet files
For purchase or free
Contain de-identified data to protect privacy
Publicize availability of data SOURCES: PRVSS2, Chapter II.I.4-5; UN Handbook, Module 19, A-B. Used to update local population databases
Planning
Evaluating
Monitoring<br>
slide22. Special Uses of Data: Special Files for Research “Public use” data
Availability of original datasets
Without corrections (editing and imputations)
Need documentation of changes made
With/without identifiers (need approval for identifiable data)
Administrative procedures for requests, guarantees of confidentiality SOURCE: PRVSS2, Chapter II.I.4-5; UN Handbook, Module 19, A,B; NCHS, Unit 17; Freedman, p 8.<br>
slide23. Special tabulations on request
Examples:
Small area data analysis
Sample data analysis
Analysis of VS data matched to another source
Helpful to offer analytic consulting
Recommendations on use & interpretation of data, including confidence intervals SOURCE: PRVSS2, Chapter II.I.4-5; UN Handbook, Module 19, D. Special Uses of Data: Special Files for Research<br>
slide24. Special Uses of Data: Information for Non-health Uses Potential Users
Police
Social security
Worker’s insurance
School planning
Economic planning
Population projections
Sampling frame for various projects Considerations for data use
Terms of use
Limitations of data SOURCE: NCHS, Unit 17.<br>
slide25. Review: Special Uses of Data Research
Public use data
Original data sets
Special tabulations
Non-health data users<br>
slide26. Special Uses of Vital Statistics Data in [COUNTRY] If applicable, list special uses of vital statistics data in [country].<br>
slide27. Discuss How would you disseminate vital statistics to the general public? How and to whom would you distribute the vital statistics reports?<br>
slide28. Professional/Technical Meetings Good communication with data users is essential, especially for:
Data released in electronic format
Special tabulations
Periodic meetings to discuss data with users
Content of data files
Limitations of data
Best uses of data SOURCE: PRVSS2, Chapter II.I.6; UN Handbook, Module 19, E, F; NCHS, 15:7.<br>
slide29. Professional/Technical Meetings Reduce questions for office
Help frequent users of vital statistics info
Forum to solicit direct user input to stay attuned to needed changes
Announce widely
Address media needs SOURCE: PRVSS2, Chapter II.I.6; UN Handbook, Module 19, E, F; NCHS, 15:7.<br>
slide30. Professional/Technical Meetings in [COUNTRY] List professional or technical meetings that are hosted in [COUNTRY] to help users better understand the country’s vital statistics data.<br>
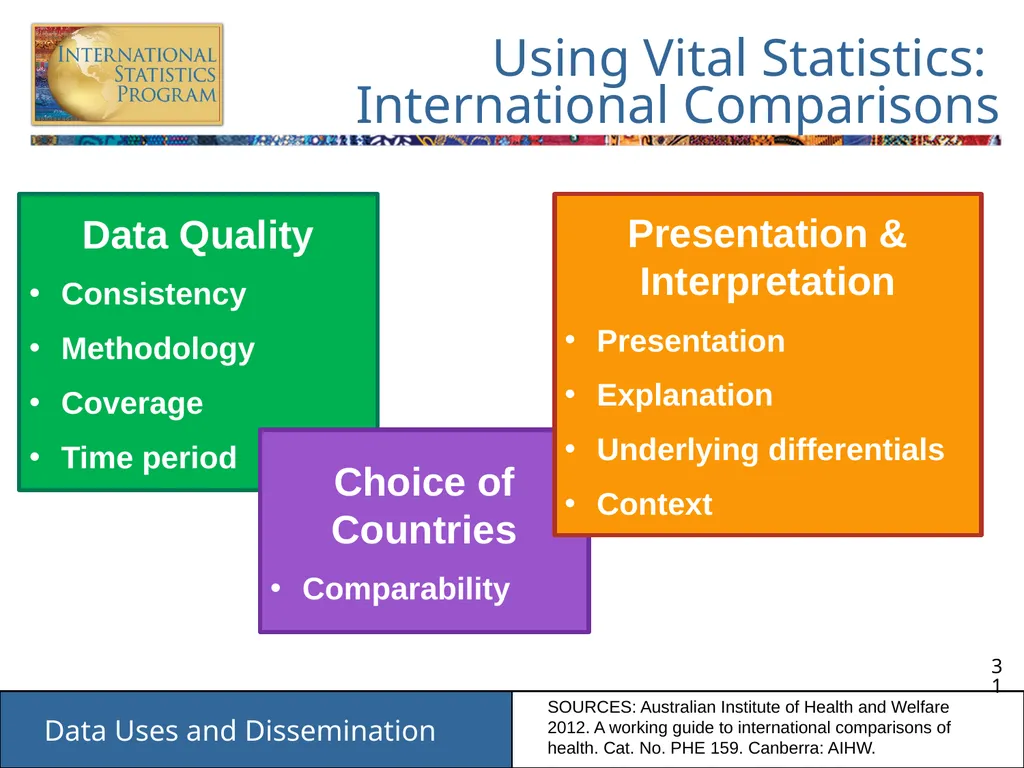
slide31. Using Vital Statistics: International Comparisons SOURCES: Australian Institute of Health and Welfare 2012. A working guide to international comparisons of health. Cat. No. PHE 159. Canberra: AIHW.<br>
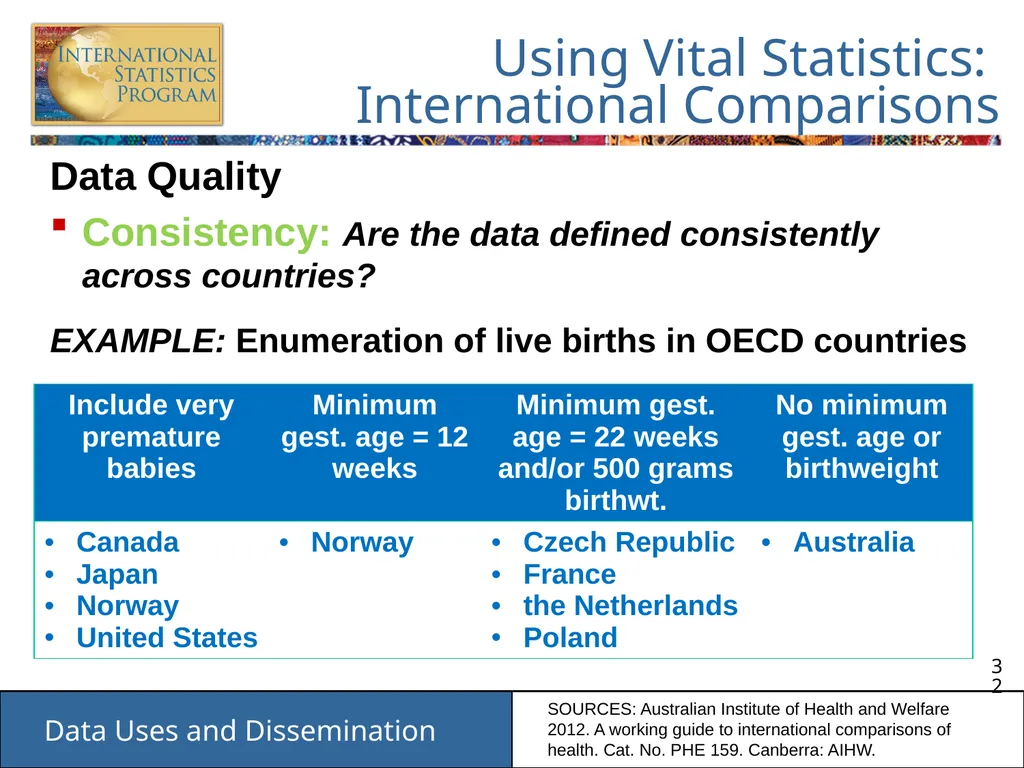
slide32. Data Quality
Consistency: Are the data defined consistently across countries?
EXAMPLE: Enumeration of live births in OECD countries SOURCES: Australian Institute of Health and Welfare 2012. A working guide to international comparisons of health. Cat. No. PHE 159. Canberra: AIHW. Using Vital Statistics: International Comparisons<br>
slide33. Data Quality
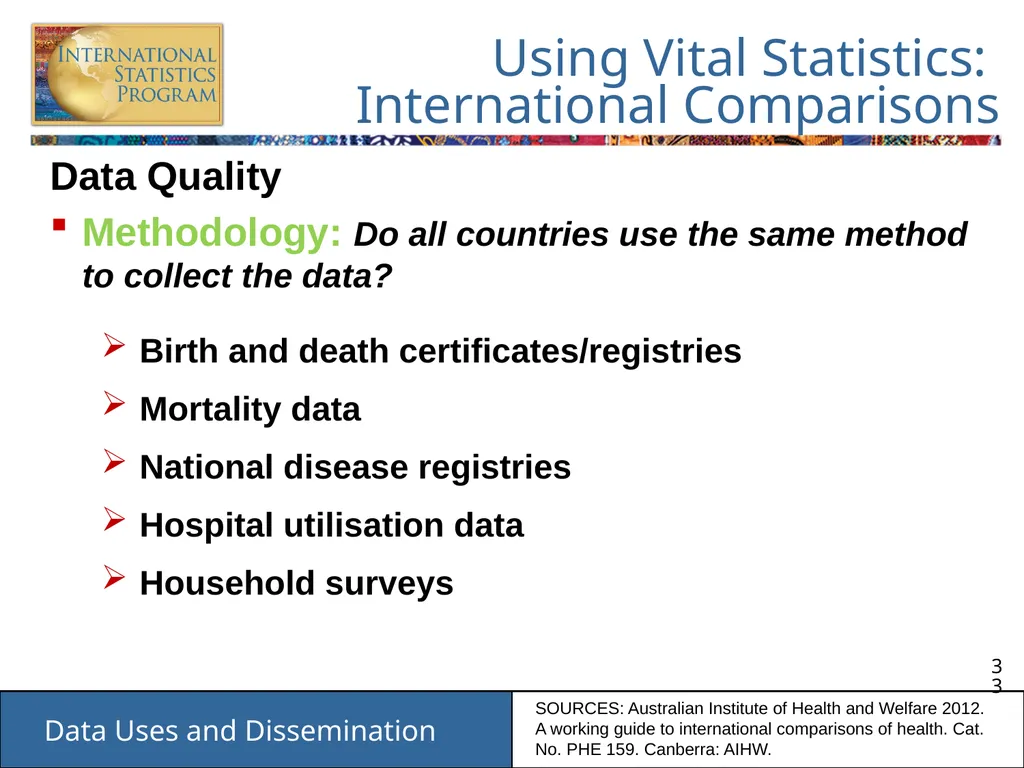
Methodology: Do all countries use the same method to collect the data?
Birth and death certificates/registries
Mortality data
National disease registries
Hospital utilisation data
Household surveys SOURCES: Australian Institute of Health and Welfare 2012. A working guide to international comparisons of health. Cat. No. PHE 159. Canberra: AIHW. Using Vital Statistics: International Comparisons<br>
slide34. Data Quality
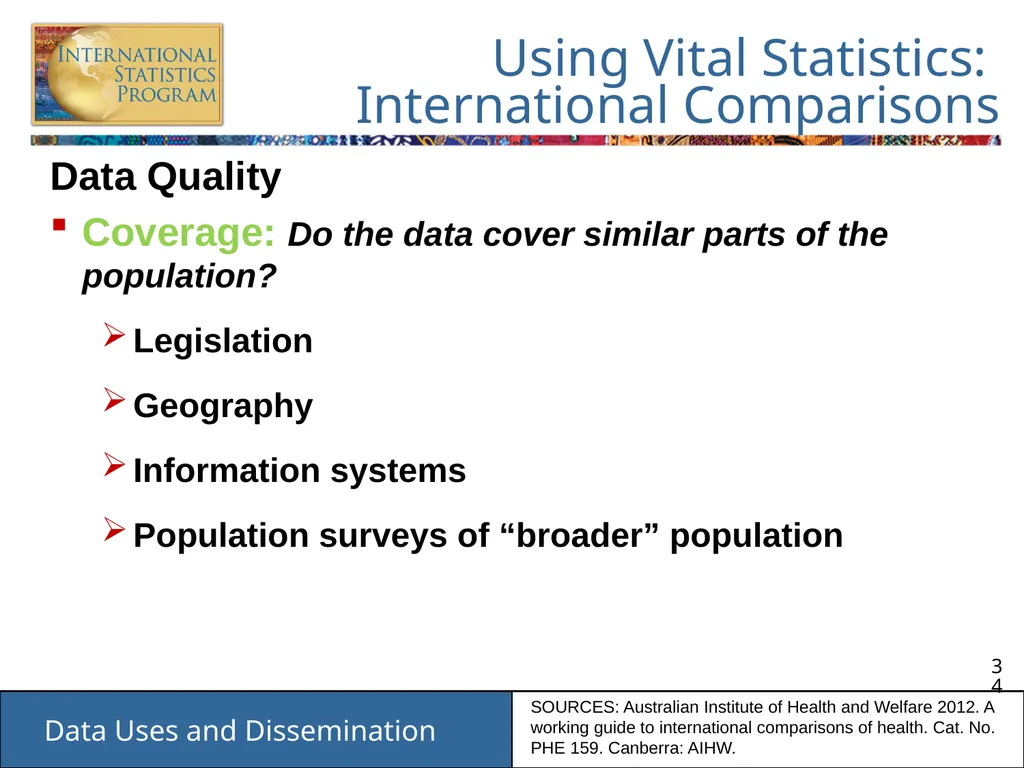
Coverage: Do the data cover similar parts of the population?
Legislation
Geography
Information systems
Population surveys of “broader” population SOURCES: Australian Institute of Health and Welfare 2012. A working guide to international comparisons of health. Cat. No. PHE 159. Canberra: AIHW. Using Vital Statistics: International Comparisons<br>
slide35. Data Quality
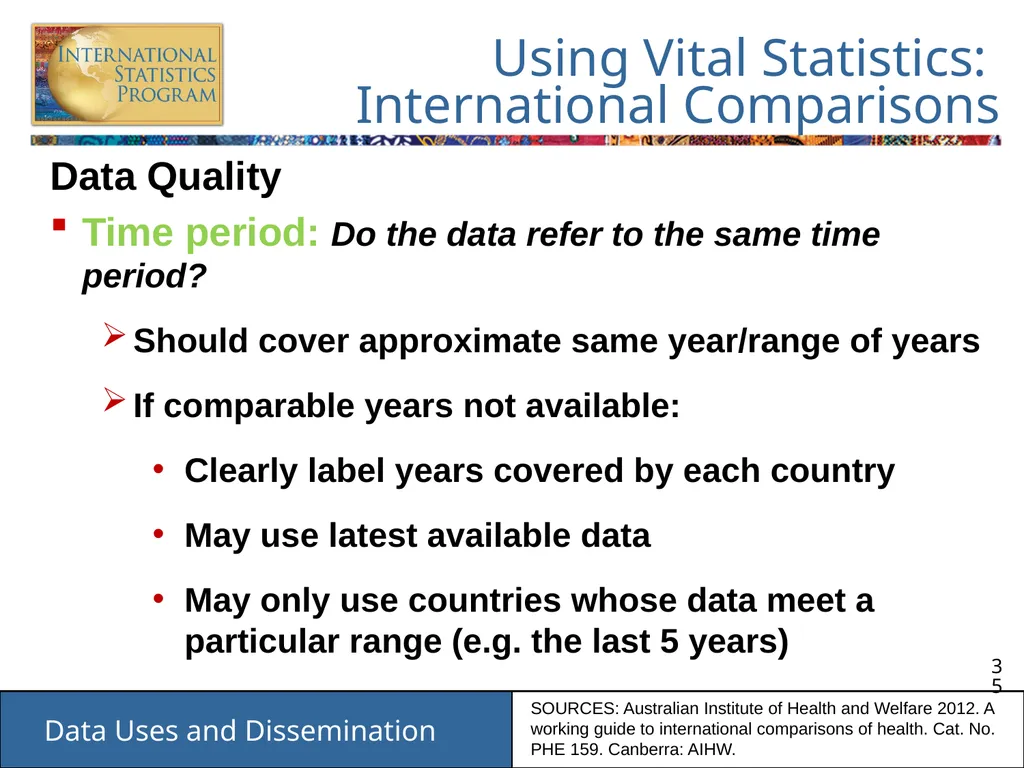
Time period: Do the data refer to the same time period?
Should cover approximate same year/range of years
If comparable years not available:
Clearly label years covered by each country
May use latest available data
May only use countries whose data meet a particular range (e.g. the last 5 years) SOURCES: Australian Institute of Health and Welfare 2012. A working guide to international comparisons of health. Cat. No. PHE 159. Canberra: AIHW. Using Vital Statistics: International Comparisons<br>
slide36. Discuss Review the table comparing maternal mortality ratio across European countries. What issues with data quality are noted? Source: EURO-PERISTAT Project, with SCPE, EUROCAT, EURONEOSTAT. European Perinatal Health Report. Data from 204. 2008. Available: www.europeristat.com (Table 6.1)<br>
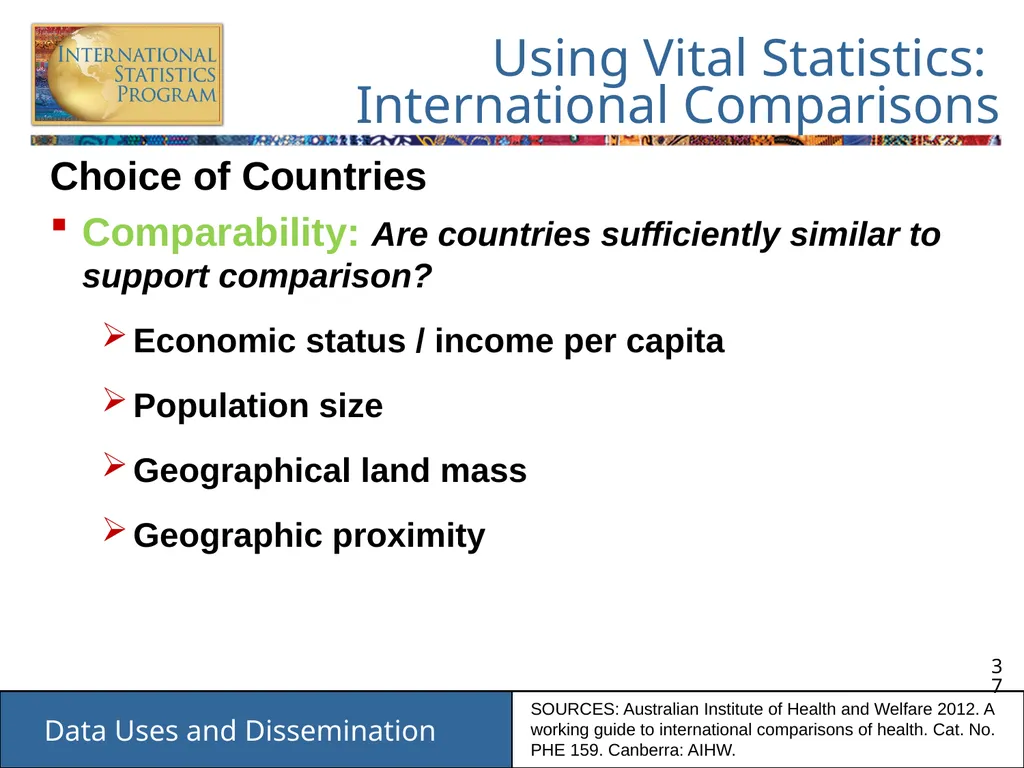
slide37. Choice of Countries
Comparability: Are countries sufficiently similar to support comparison?
Economic status / income per capita
Population size
Geographical land mass
Geographic proximity SOURCES: Australian Institute of Health and Welfare 2012. A working guide to international comparisons of health. Cat. No. PHE 159. Canberra: AIHW. Using Vital Statistics: International Comparisons<br>
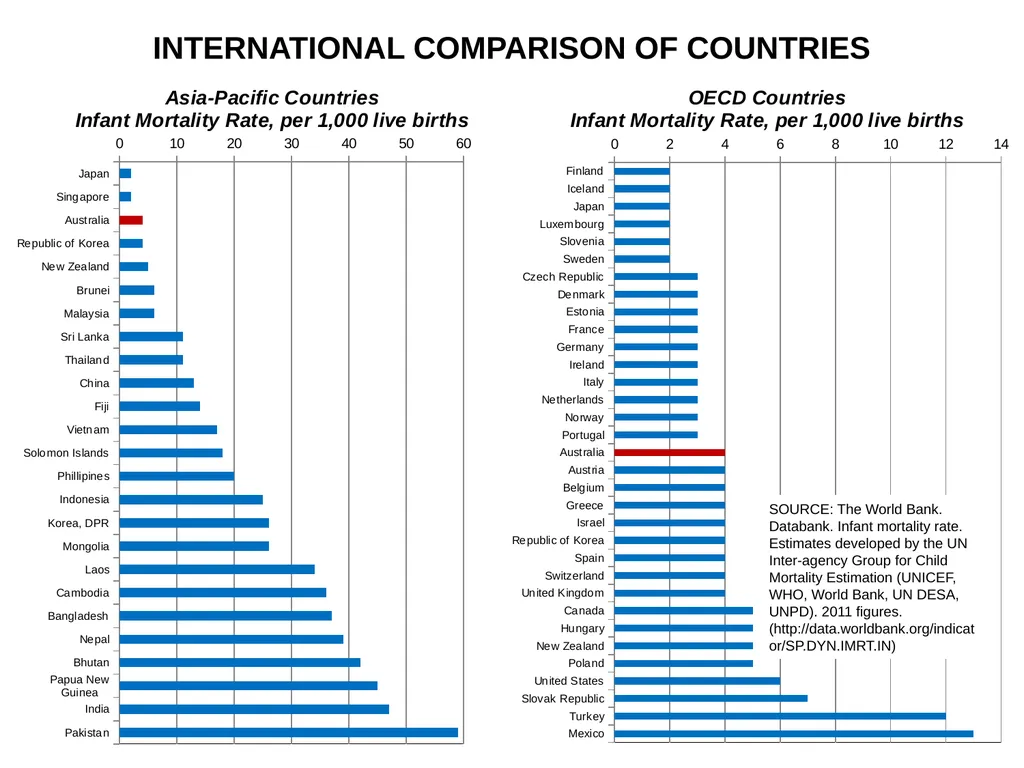
slide38. INTERNATIONAL COMPARISON OF COUNTRIES SOURCE: The World Bank. Databank. Infant mortality rate. Estimates developed by the UN Inter-agency Group for Child Mortality Estimation (UNICEF, WHO, World Bank, UN DESA, UNPD). 2011 figures. (http://data.worldbank.org/indicator/SP.DYN.IMRT.IN)<br>
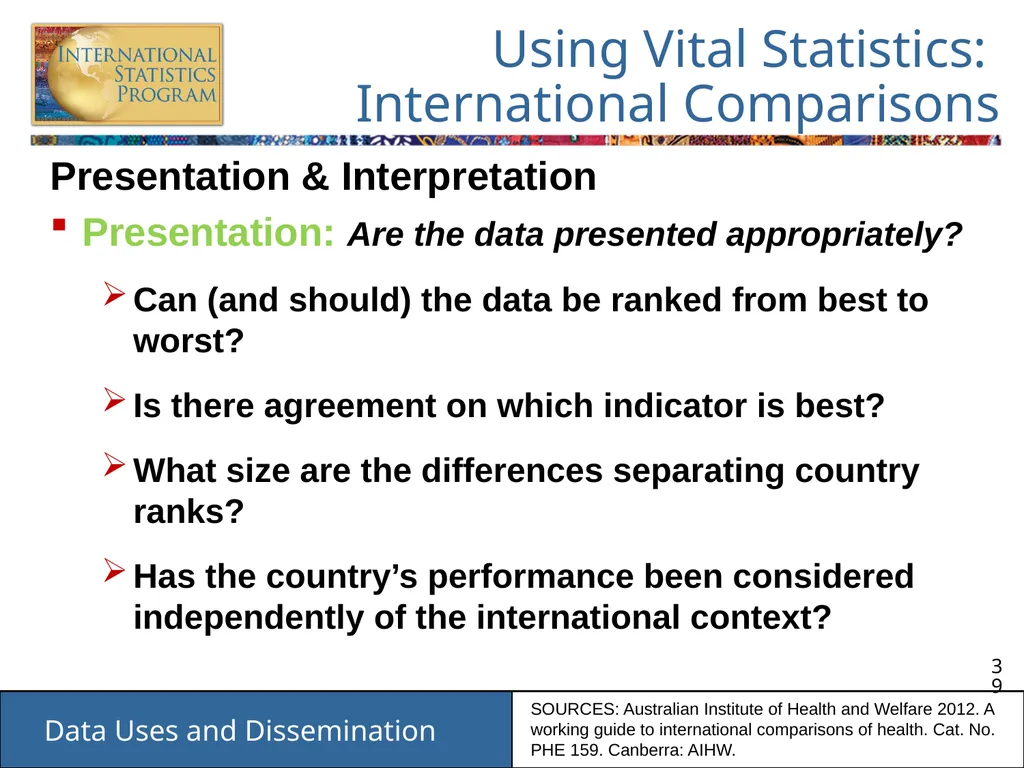
slide39. Using Vital Statistics: International Comparisons Presentation & Interpretation
Presentation: Are the data presented appropriately?
Can (and should) the data be ranked from best to worst?
Is there agreement on which indicator is best?
What size are the differences separating country ranks?
Has the country’s performance been considered independently of the international context? SOURCES: Australian Institute of Health and Welfare 2012. A working guide to international comparisons of health. Cat. No. PHE 159. Canberra: AIHW.<br>
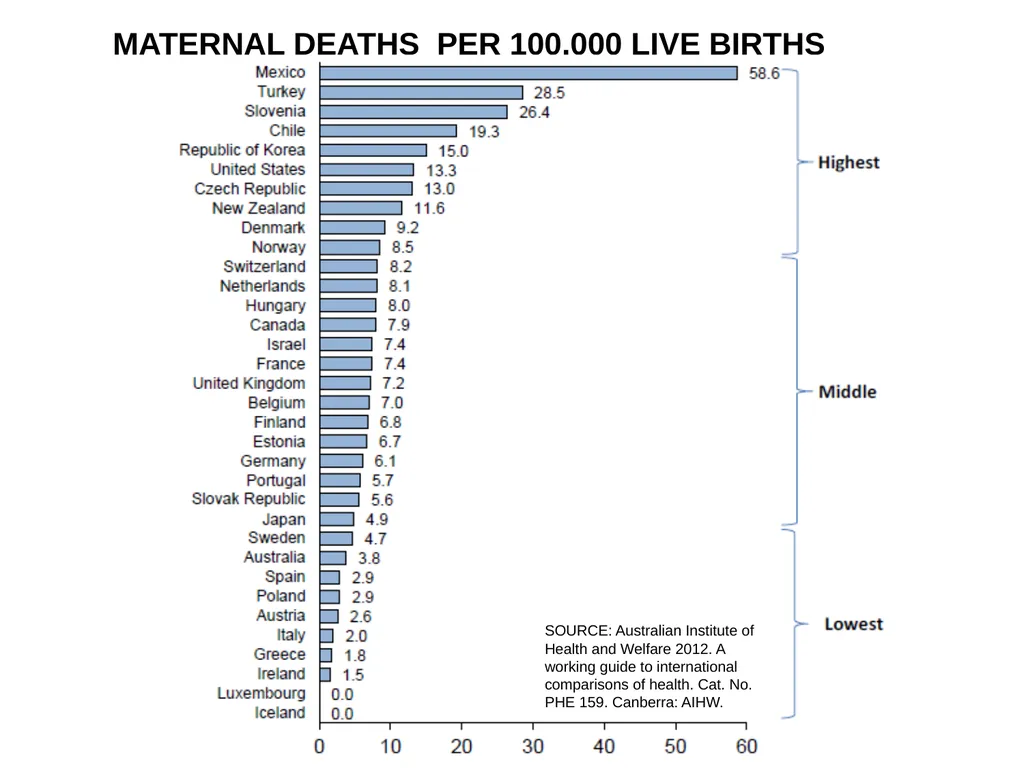
slide40. MATERNAL DEATHS PER 100,000 LIVE BIRTHS SOURCE: Australian Institute of Health and Welfare 2012. A working guide to international comparisons of health. Cat. No. PHE 159. Canberra: AIHW.<br>
slide41. Using Vital Statistics: International Comparisons Presentation & Interpretation
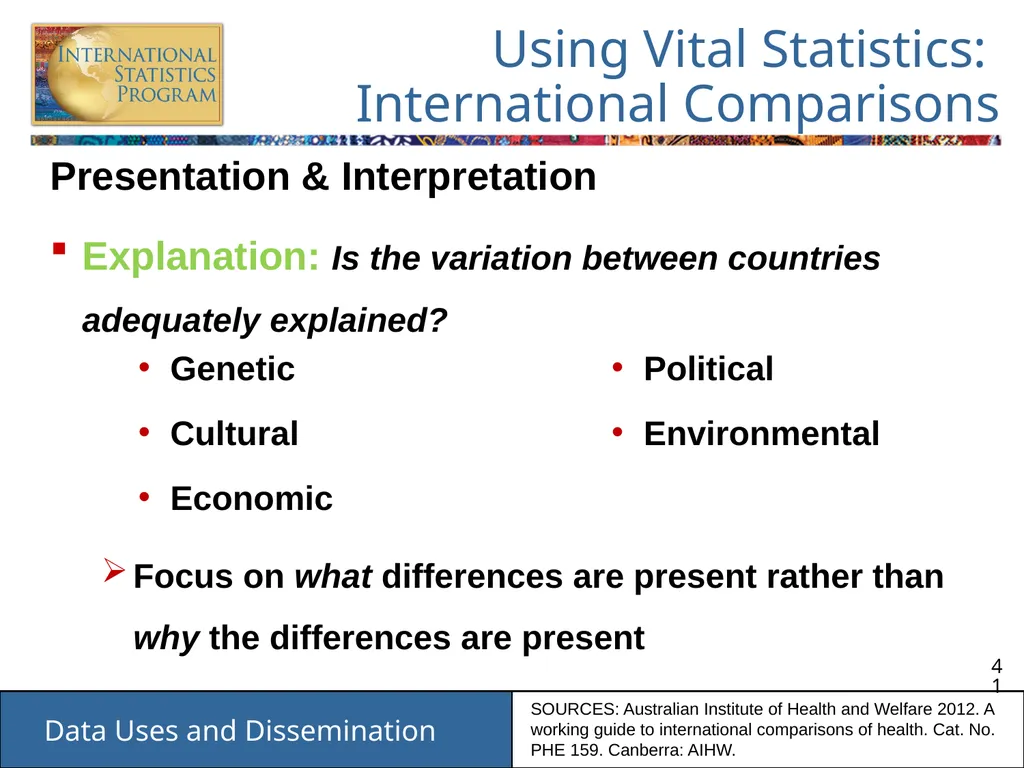
Explanation: Is the variation between countries adequately explained?
Focus on what differences are present rather than why the differences are present Genetic
Cultural
Economic
Political
Environmental SOURCES: Australian Institute of Health and Welfare 2012. A working guide to international comparisons of health. Cat. No. PHE 159. Canberra: AIHW.<br>
slide42. Using Vital Statistics: International Comparisons Presentation & Interpretation
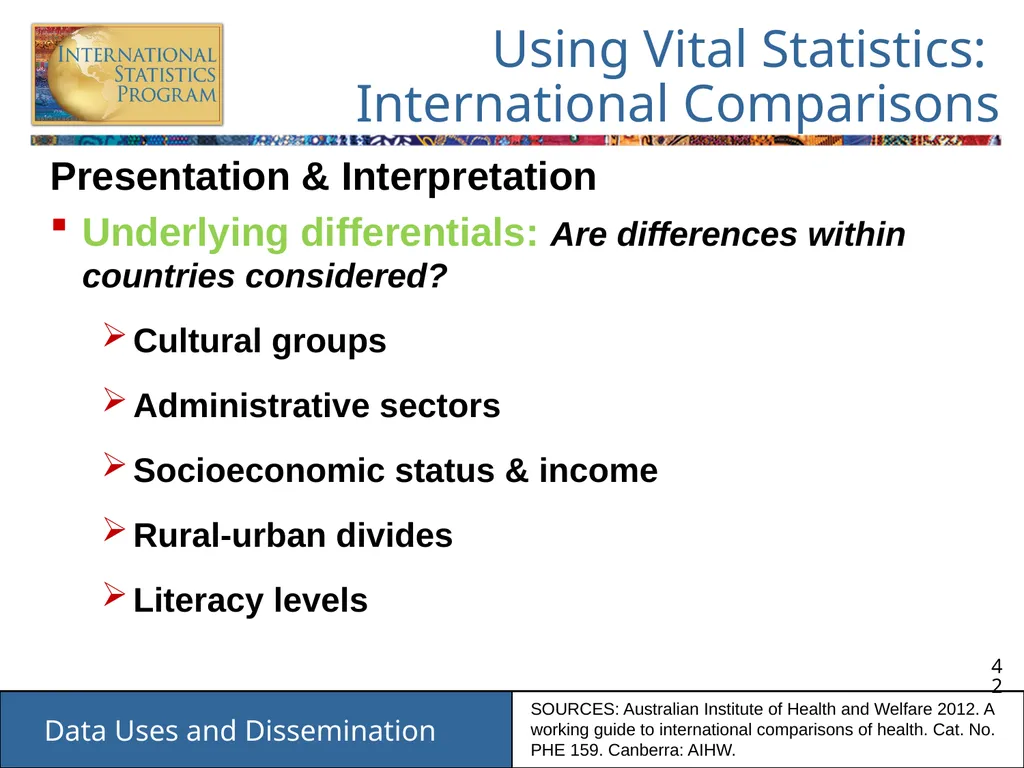
Underlying differentials: Are differences within countries considered?
Cultural groups
Administrative sectors
Socioeconomic status & income
Rural-urban divides
Literacy levels SOURCES: Australian Institute of Health and Welfare 2012. A working guide to international comparisons of health. Cat. No. PHE 159. Canberra: AIHW.<br>
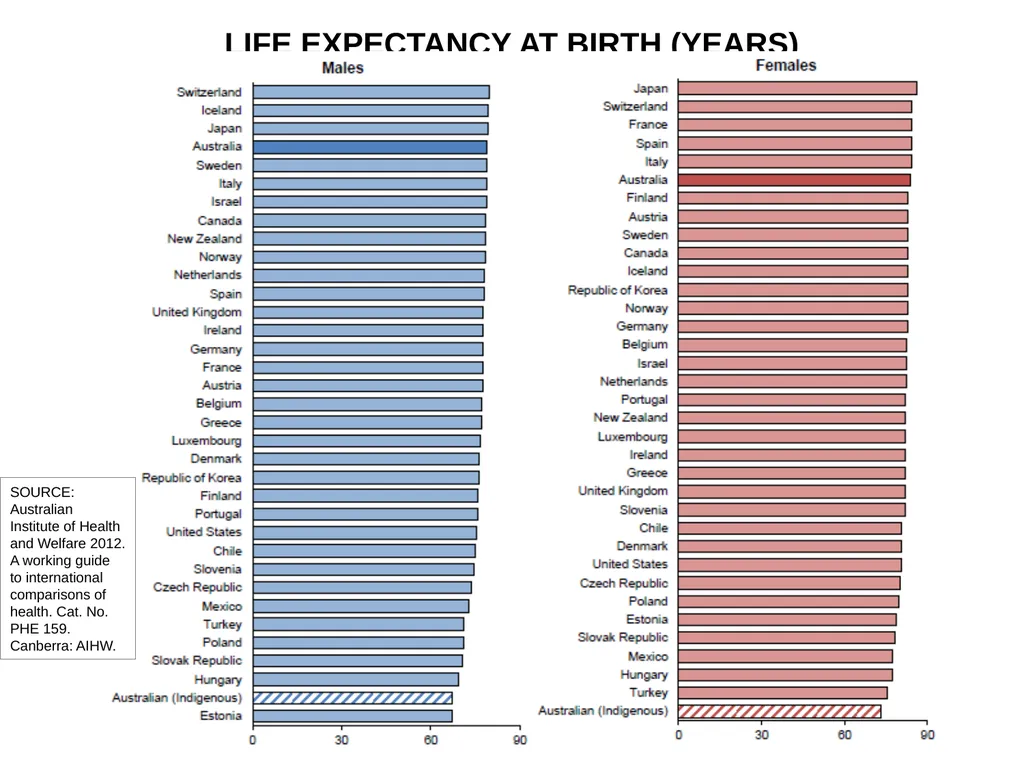
slide43. LIFE EXPECTANCY AT BIRTH (YEARS) SOURCE: Australian Institute of Health and Welfare 2012. A working guide to international comparisons of health. Cat. No. PHE 159. Canberra: AIHW.<br>
slide44. Using Vital Statistics: International Comparisons Presentation & Interpretation
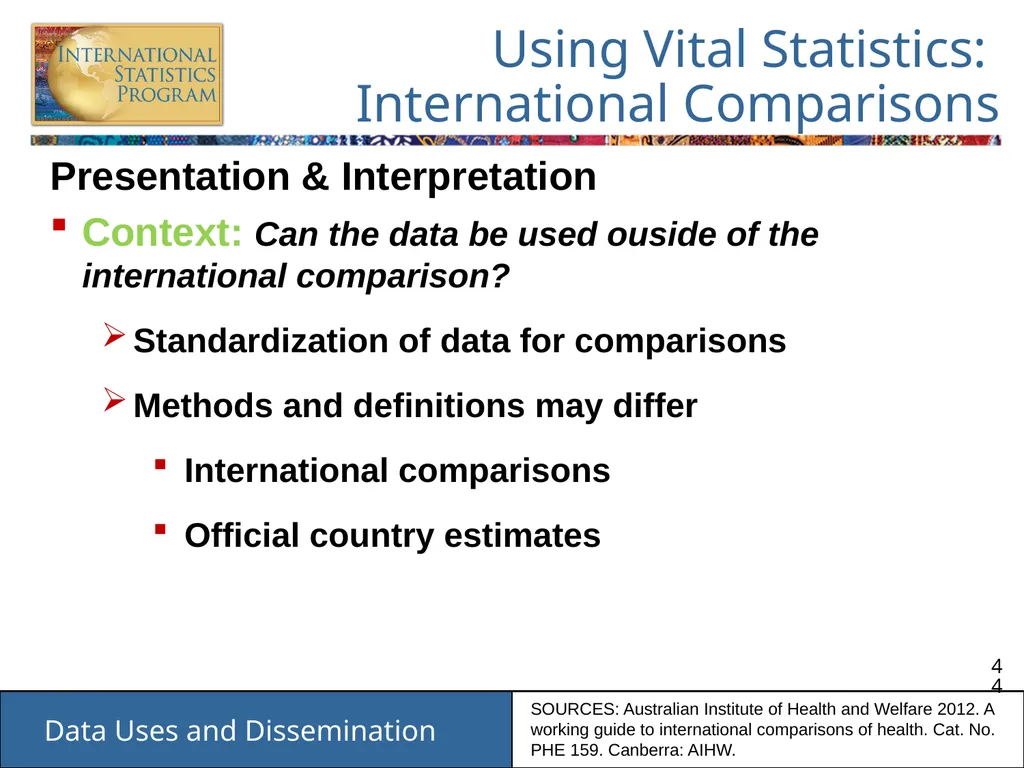
Context: Can the data be used ouside of the international comparison?
Standardization of data for comparisons
Methods and definitions may differ
International comparisons
Official country estimates SOURCES: Australian Institute of Health and Welfare 2012. A working guide to international comparisons of health. Cat. No. PHE 159. Canberra: AIHW.<br>
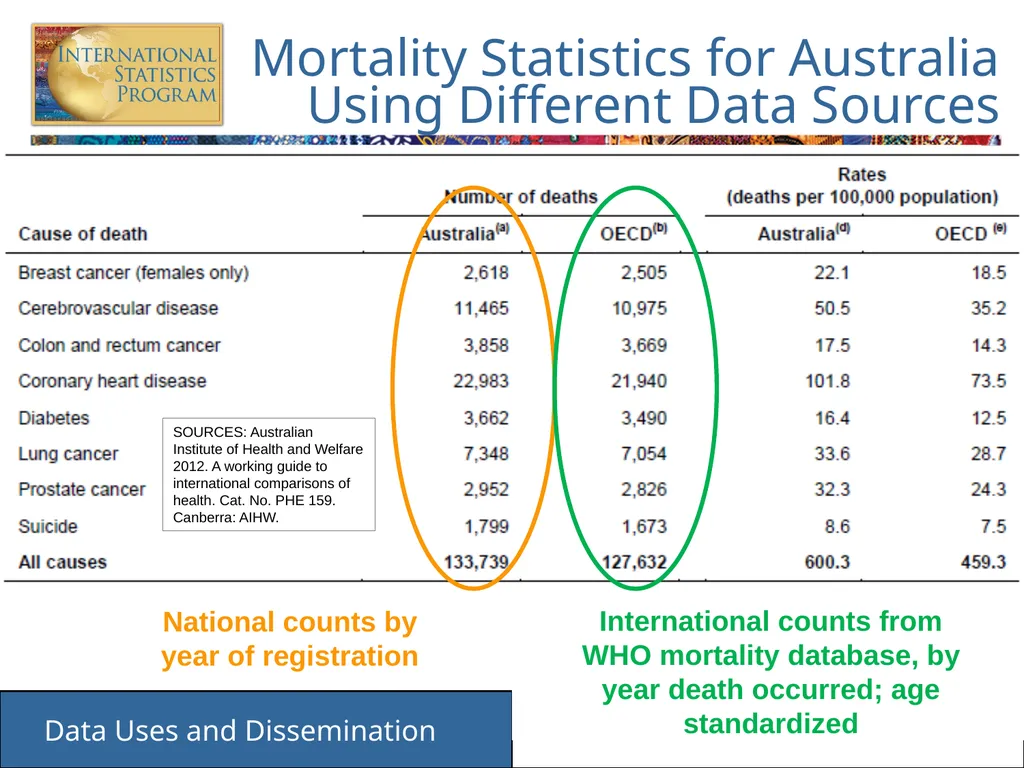
slide45. Mortality Statistics for Australia Using Different Data Sources SOURCES: Australian Institute of Health and Welfare 2012. A working guide to international comparisons of health. Cat. No. PHE 159. Canberra: AIHW.<br>
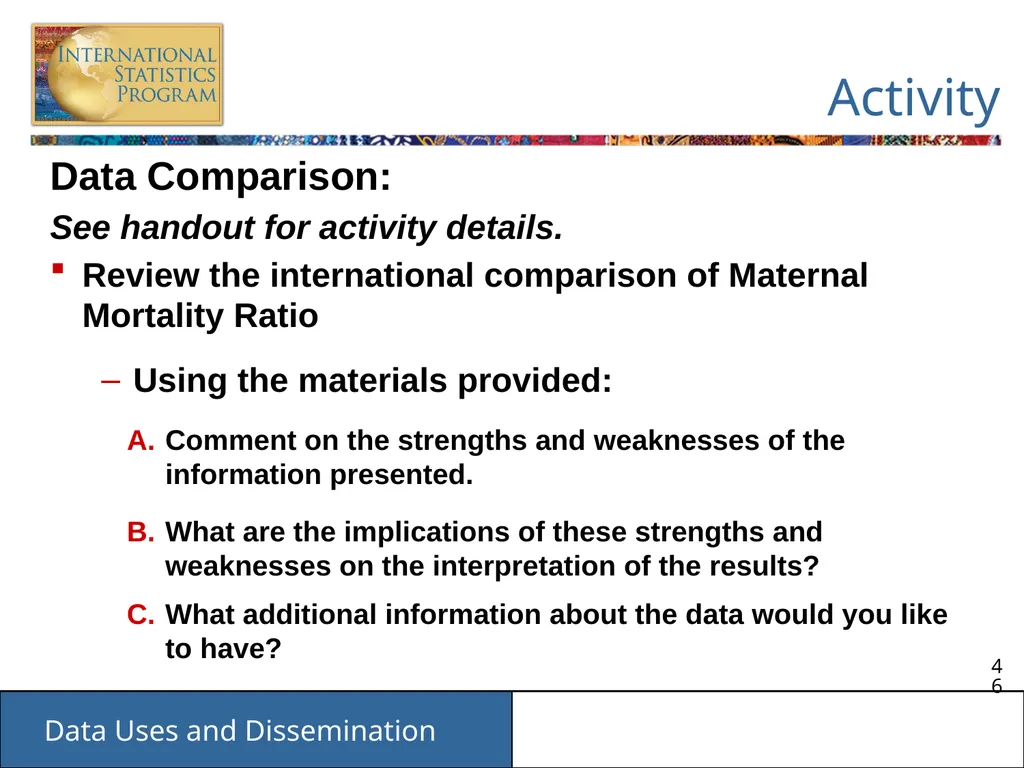
slide46. Activity Data Comparison:
See handout for activity details.
Review the international comparison of Maternal Mortality Ratio
Using the materials provided:
Comment on the strengths and weaknesses of the information presented.
What are the implications of these strengths and weaknesses on the interpretation of the results?
What additional information about the data would you like to have?<br>
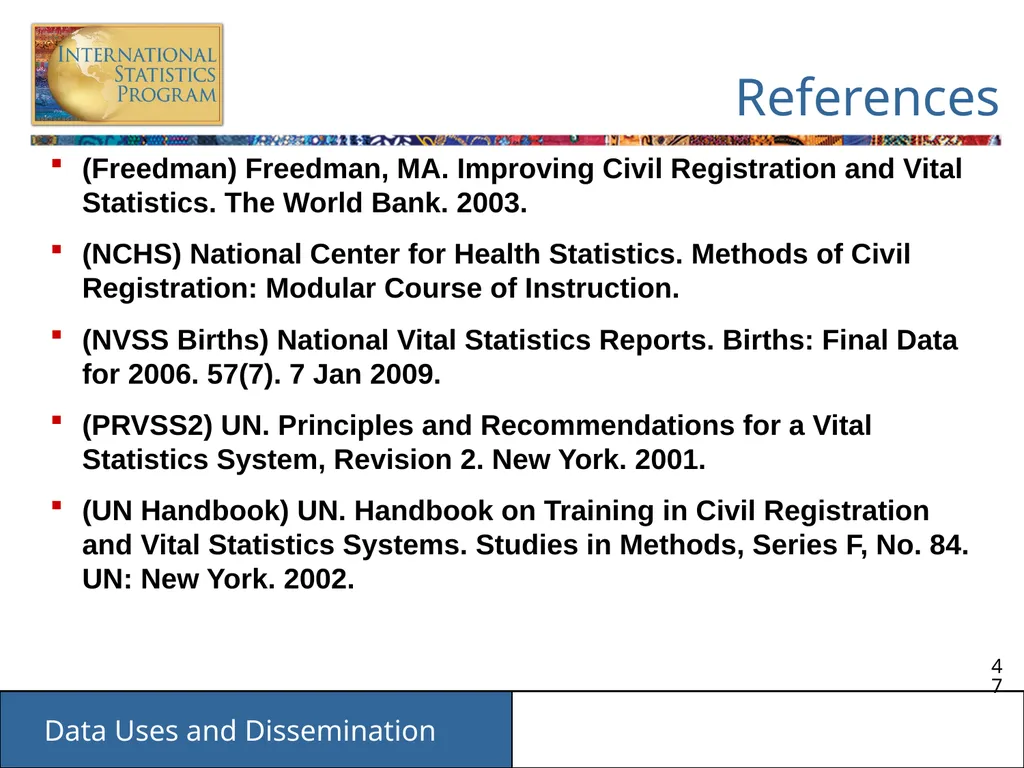
slide47. References (Freedman) Freedman, MA. Improving Civil Registration and Vital Statistics. The World Bank. 2003.
(NCHS) National Center for Health Statistics. Methods of Civil Registration: Modular Course of Instruction.
(NVSS Births) National Vital Statistics Reports. Births: Final Data for 2006. 57(7). 7 Jan 2009.
(PRVSS2) UN. Principles and Recommendations for a Vital Statistics System, Revision 2. New York. 2001.
(UN Handbook) UN. Handbook on Training in Civil Registration and Vital Statistics Systems. Studies in Methods, Series F, No. 84. UN: New York. 2002.<br>
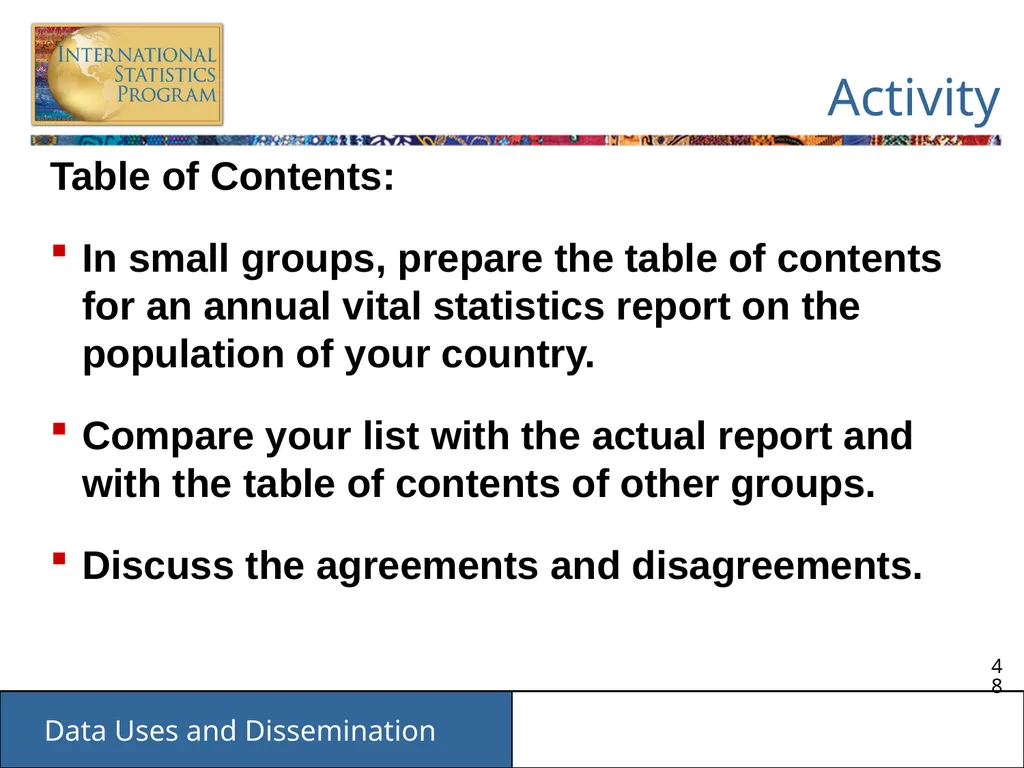
slide48. Activity Table of Contents:
In small groups, prepare the table of contents for an annual vital statistics report on the population of your country.
Compare your list with the actual report and with the table of contents of other groups.
Discuss the agreements and disagreements.<br>
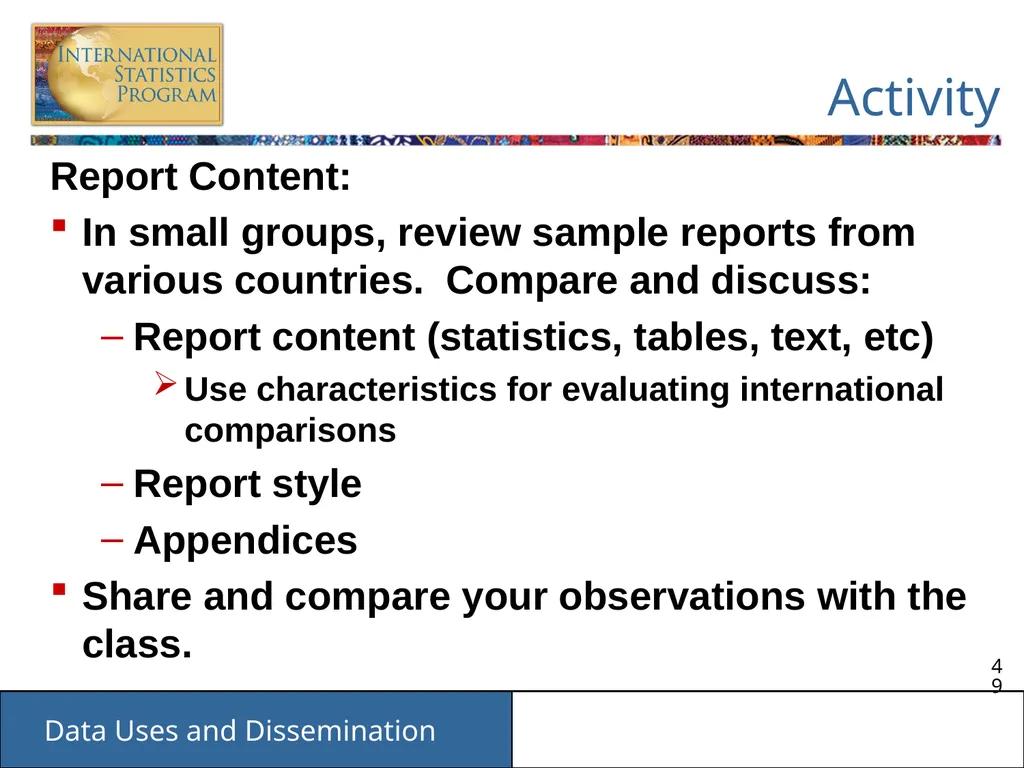
slide49. Activity Report Content:
In small groups, review sample reports from various countries. Compare and discuss:
Report content (statistics, tables, text, etc)
Use characteristics for evaluating international comparisons
Report style
Appendices
Share and compare your observations with the class.<br>
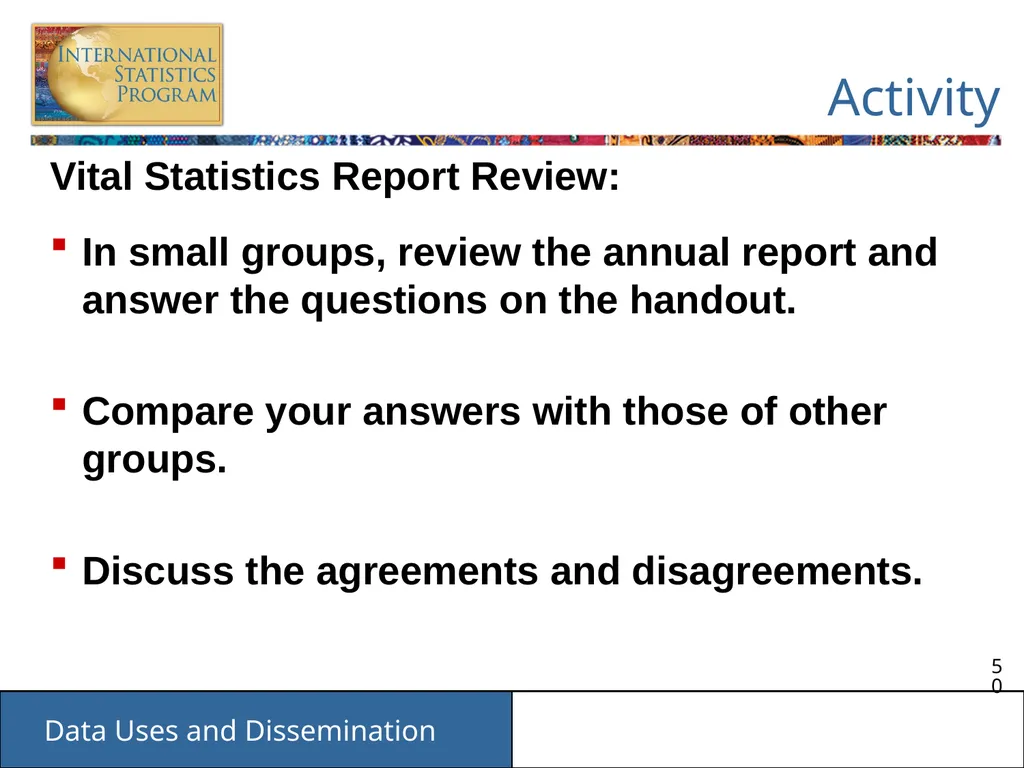
slide50. Activity Vital Statistics Report Review:
In small groups, review the annual report and answer the questions on the handout.
Compare your answers with those of other groups.
Discuss the agreements and disagreements.<br>
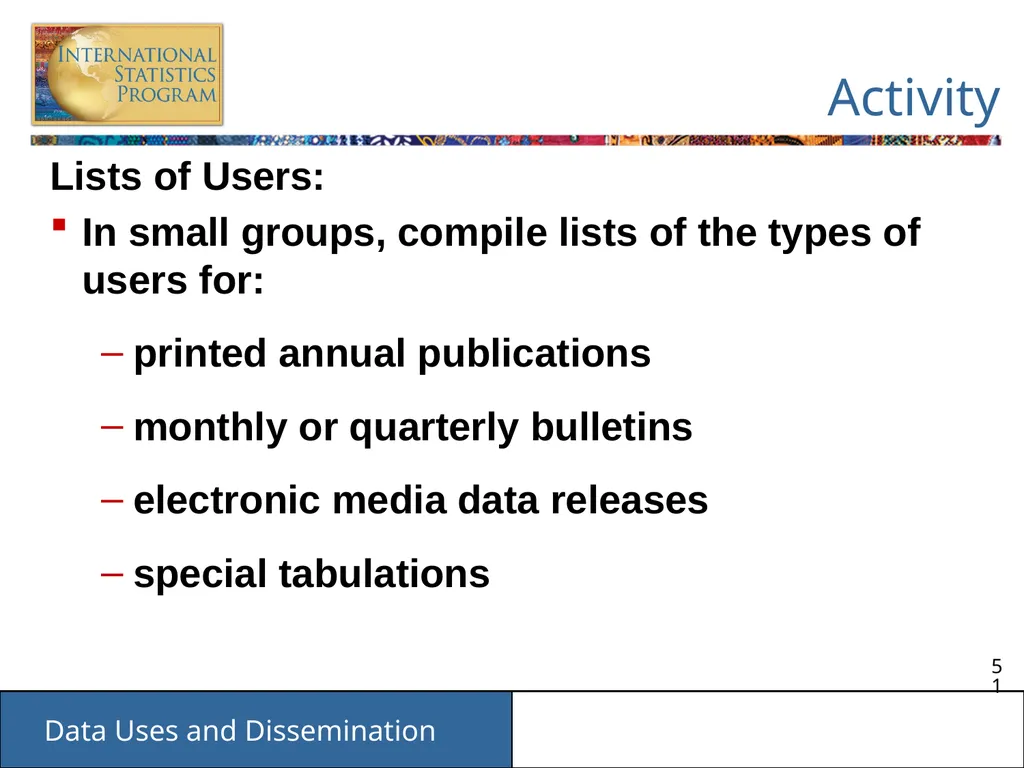
slide51. Activity Lists of Users:
In small groups, compile lists of the types of users for:
printed annual publications
monthly or quarterly bulletins
electronic media data releases
special tabulations<br>
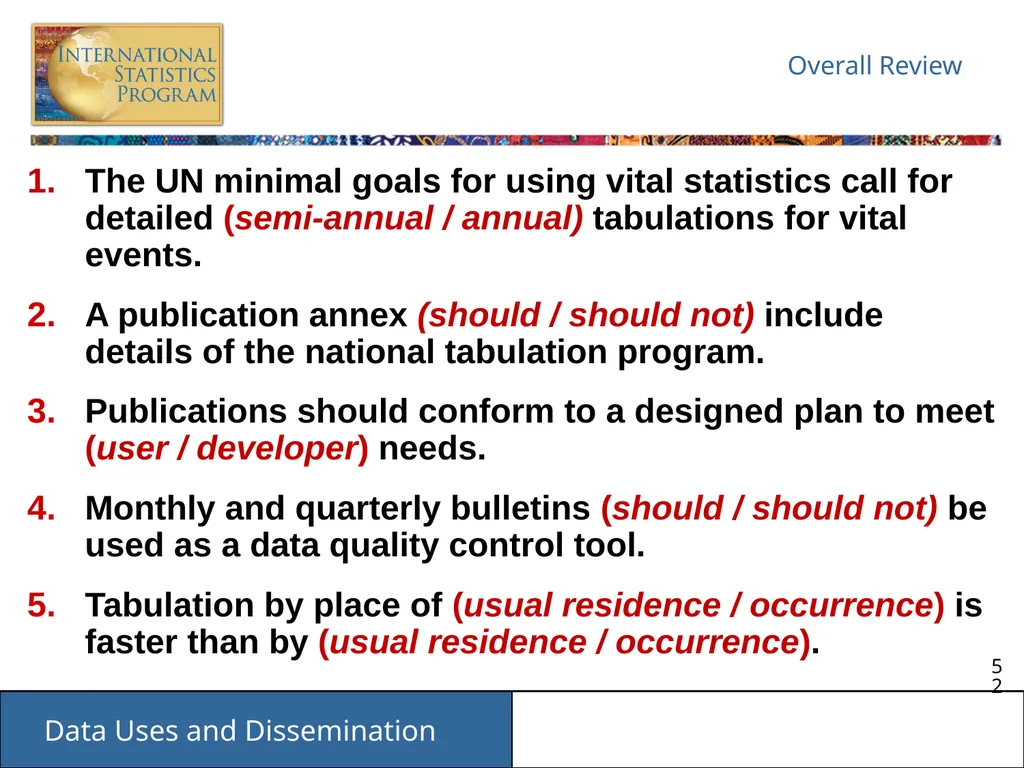
slide52. Overall Review The UN minimal goals for using vital statistics call for detailed (semi-annual / annual) tabulations for vital events.
A publication annex (should / should not) include details of the national tabulation program.
Publications should conform to a designed plan to meet (user / developer) needs.
Monthly and quarterly bulletins (should / should not) be used as a data quality control tool.
Tabulation by place of (usual residence / occurrence) is faster than by (usual residence / occurrence).<br>
slide53. Overall Review Tabulation by date of (registration / occurrence) is faster than by (registration / occurrence).
Having a directory of users provides for (wide / targeted) dissemination of reports.
Data sets with identifiable data used for special research (do not require / require) approval.
Vital statistics information (can / cannot) be used for non-health purposes.
Good communication with data users is (ideal / essential).<br>
slide2. Outline Using vital statistics
Publications
Electronic media/internet
Special uses of data
Professional/technical meetings
International comparisons<br>
slide3. NOTE Goal of presentation: to explain how vital statistics processes should work
Information may not be directly relevant to your work, but you can:
Use the information to evaluate available CRVS data
Advocate for improvements to CRVS system
Apply the information in own work setting (i.e. local area or hospital)<br>
slide4. Using Vital Statistics United Nations minimal goals:
1) Total monthly or quarterly summary counts prompt enough to provide info for administrative or other needs
2) Detailed annual tabulations for vital events cross classified by demographic and socioeconomic characteristics SOURCES: PRVSS2, Chapter II.D.4; NCHS, 15:6.<br>
slide5. Using Vital Statistics Central agency needs to:
Identify and assess needs of users
Understand problems of VS suppliers & users
Make sure VS suppliers & users understand their obligations and constraints
Disseminate VS information widely
Alternative: make micro-level data available to outside users/researchers SOURCES: PRVSS2, Chapter II.D.4; NCHS, 15:6.<br>
slide6. Publications Annual data
Time trends
Geographical differentials
Frequency distributions of vital events, including:
Causes of death tabulations
Leading cause of death lists
Include delayed & late registration by year of occurrence SOURCE: PRVSS2, Chapter II.I.1-2; UN Handbook, Module 19, A; NCHS, Unit 17.<br>
slide7. Publications Major sections
Preface & letter of transmittal
Table of contents & lists of tables and figures
Introductory & explanatory notes
Summary highlights
Mid-year population estimates (data used in computations)
Statistics: natality & mortality (marriage & divorce)
Annex / appendix SOURCE: PRVSS2, Chapter II.I.1-2; UN Handbook, Module 19, A; NCHS, Unit 17. Background table of contents from Statistics South Africa Mortality Report, 2008<br>
slide8. Publications Include in annex / appendix:
Details of national tabulation program
Outlines of essential tables
Technical notes & definitions
Confidence interval calculation / table Statistics South Africa, Mortality Report, 2008 SOURCE: PRVSS2, Chapter II.I.1-2; UN Handbook, Module 19, A; NCHS, Unit 17; NVSS Births, p 96-100.<br>
slide9. Publications Available on a regular & timely basis
Printed report
Ad hoc tabulations
CDs, diskettes, online, other media
Conform to a designed plan to meet user needs
Part of a series
Easily identifiable for filing and reference in libraries SOURCE: PRVSS2, Chapter II.I.1-2; UN Handbook, Module 19, A; NCHS, Unit 17.<br>
slide10. Publications Printed reports
Clear formatting
Tables with supporting text
Annotations on data limitations
Analysis of meaning of data
Calculation of vital rates
Figures, maps, graphs for
important points
Confidence intervals SOURCE: PRVSS2, Chapter II.I.1; NCHS, Unit 17.<br>
slide11. Discuss What items might go into the technical appendices of a printed annual report?<br>
slide12. Publications Electronic report
Follow guidelines for printed reports
Prominently display instructions for use of electronic material
Brochure with summary highlights
Sufficient for many users
Can cut down on printing & distribution costs SOURCES: UN, PRVSS2, 2010, Chapter II.I.1; UN, Handbook on Training in CRVSS, Module 19, A<br>
slide13. Publications: Monthly/Quarterly Bulletins Extensive cross-classification not necessary
Alerts of unusual changes in vital events (epi surveillance)
Quality control tool to identify missing/ miscoded data
Targeted distribution to those with need for provisional information SOURCE: PRVSS2, Chapter II.I.3, 7, Chapter II.I.2; UN Handbook, Module 19, B; NCHS, Unit 17.<br>
slide14. Publications: Monthly/Quarterly Bulletins May use a systematic sample of records for preliminary tabulations (final tabulations should include all records)
By place of occurrence faster than usual residence
By date of registration faster than date of occurrence
Allows calculation of 12-month moving average
Drop oldest month’s frequency
Replace with value of most recent month SOURCE: PRVSS2, Chapter II.I.3, 7, Chapter II.I.2; UN Handbook, Module 19, B; NCHS, Unit 17.<br>
slide15. Publications in [Country] Slide to describe the types of vital statistics publications that are produced in the country.<br>
slide16. Discuss What are some advantages and disadvantages of utilizing sampling rather than all records in preparing vital statistics reports?<br>
slide17. Publications: Directory of Users Efficient & targeted dissemination of reports
Track publication users and dissemination activities
Record names, addresses, fax numbers, email addresses, & products of interest (i.e. monthly report)
Update regularly SOURCE: PRVSS2, Chapter II.I.3, 7, Chapter II.I.2; UN Handbook, Module 19, B, F.<br>
slide18. Publications: Directory of Users For announcing release of products & meetings
Separate by publication type
General distribution list can include:
Demographic & other research centers
Major libraries
Health, education, planning ministries
Commercial users
Vital statistics offices of selected countries
International agencies SOURCE: NCHS, Unit 17.<br>
slide19. Review: Publications Annual data
Major sections
Availability
Design plan
Printed & electronic reports
Monthly/quarterly bulletins
Directory of users<br>
slide20. Discuss What factors would you consider in determining the contents of vital statistics reports?<br>
slide21. Electronic Media/Internet Public use data
Data tapes, disks, downloadable internet files
For purchase or free
Contain de-identified data to protect privacy
Publicize availability of data SOURCES: PRVSS2, Chapter II.I.4-5; UN Handbook, Module 19, A-B. Used to update local population databases
Planning
Evaluating
Monitoring<br>
slide22. Special Uses of Data: Special Files for Research “Public use” data
Availability of original datasets
Without corrections (editing and imputations)
Need documentation of changes made
With/without identifiers (need approval for identifiable data)
Administrative procedures for requests, guarantees of confidentiality SOURCE: PRVSS2, Chapter II.I.4-5; UN Handbook, Module 19, A,B; NCHS, Unit 17; Freedman, p 8.<br>
slide23. Special tabulations on request
Examples:
Small area data analysis
Sample data analysis
Analysis of VS data matched to another source
Helpful to offer analytic consulting
Recommendations on use & interpretation of data, including confidence intervals SOURCE: PRVSS2, Chapter II.I.4-5; UN Handbook, Module 19, D. Special Uses of Data: Special Files for Research<br>
slide24. Special Uses of Data: Information for Non-health Uses Potential Users
Police
Social security
Worker’s insurance
School planning
Economic planning
Population projections
Sampling frame for various projects Considerations for data use
Terms of use
Limitations of data SOURCE: NCHS, Unit 17.<br>
slide25. Review: Special Uses of Data Research
Public use data
Original data sets
Special tabulations
Non-health data users<br>
slide26. Special Uses of Vital Statistics Data in [COUNTRY] If applicable, list special uses of vital statistics data in [country].<br>
slide27. Discuss How would you disseminate vital statistics to the general public? How and to whom would you distribute the vital statistics reports?<br>
slide28. Professional/Technical Meetings Good communication with data users is essential, especially for:
Data released in electronic format
Special tabulations
Periodic meetings to discuss data with users
Content of data files
Limitations of data
Best uses of data SOURCE: PRVSS2, Chapter II.I.6; UN Handbook, Module 19, E, F; NCHS, 15:7.<br>
slide29. Professional/Technical Meetings Reduce questions for office
Help frequent users of vital statistics info
Forum to solicit direct user input to stay attuned to needed changes
Announce widely
Address media needs SOURCE: PRVSS2, Chapter II.I.6; UN Handbook, Module 19, E, F; NCHS, 15:7.<br>
slide30. Professional/Technical Meetings in [COUNTRY] List professional or technical meetings that are hosted in [COUNTRY] to help users better understand the country’s vital statistics data.<br>
slide31. Using Vital Statistics: International Comparisons SOURCES: Australian Institute of Health and Welfare 2012. A working guide to international comparisons of health. Cat. No. PHE 159. Canberra: AIHW.<br>
slide32. Data Quality
Consistency: Are the data defined consistently across countries?
EXAMPLE: Enumeration of live births in OECD countries SOURCES: Australian Institute of Health and Welfare 2012. A working guide to international comparisons of health. Cat. No. PHE 159. Canberra: AIHW. Using Vital Statistics: International Comparisons<br>
slide33. Data Quality
Methodology: Do all countries use the same method to collect the data?
Birth and death certificates/registries
Mortality data
National disease registries
Hospital utilisation data
Household surveys SOURCES: Australian Institute of Health and Welfare 2012. A working guide to international comparisons of health. Cat. No. PHE 159. Canberra: AIHW. Using Vital Statistics: International Comparisons<br>
slide34. Data Quality
Coverage: Do the data cover similar parts of the population?
Legislation
Geography
Information systems
Population surveys of “broader” population SOURCES: Australian Institute of Health and Welfare 2012. A working guide to international comparisons of health. Cat. No. PHE 159. Canberra: AIHW. Using Vital Statistics: International Comparisons<br>
slide35. Data Quality
Time period: Do the data refer to the same time period?
Should cover approximate same year/range of years
If comparable years not available:
Clearly label years covered by each country
May use latest available data
May only use countries whose data meet a particular range (e.g. the last 5 years) SOURCES: Australian Institute of Health and Welfare 2012. A working guide to international comparisons of health. Cat. No. PHE 159. Canberra: AIHW. Using Vital Statistics: International Comparisons<br>
slide36. Discuss Review the table comparing maternal mortality ratio across European countries. What issues with data quality are noted? Source: EURO-PERISTAT Project, with SCPE, EUROCAT, EURONEOSTAT. European Perinatal Health Report. Data from 204. 2008. Available: www.europeristat.com (Table 6.1)<br>
slide37. Choice of Countries
Comparability: Are countries sufficiently similar to support comparison?
Economic status / income per capita
Population size
Geographical land mass
Geographic proximity SOURCES: Australian Institute of Health and Welfare 2012. A working guide to international comparisons of health. Cat. No. PHE 159. Canberra: AIHW. Using Vital Statistics: International Comparisons<br>
slide38. INTERNATIONAL COMPARISON OF COUNTRIES SOURCE: The World Bank. Databank. Infant mortality rate. Estimates developed by the UN Inter-agency Group for Child Mortality Estimation (UNICEF, WHO, World Bank, UN DESA, UNPD). 2011 figures. (http://data.worldbank.org/indicator/SP.DYN.IMRT.IN)<br>
slide39. Using Vital Statistics: International Comparisons Presentation & Interpretation
Presentation: Are the data presented appropriately?
Can (and should) the data be ranked from best to worst?
Is there agreement on which indicator is best?
What size are the differences separating country ranks?
Has the country’s performance been considered independently of the international context? SOURCES: Australian Institute of Health and Welfare 2012. A working guide to international comparisons of health. Cat. No. PHE 159. Canberra: AIHW.<br>
slide40. MATERNAL DEATHS PER 100,000 LIVE BIRTHS SOURCE: Australian Institute of Health and Welfare 2012. A working guide to international comparisons of health. Cat. No. PHE 159. Canberra: AIHW.<br>
slide41. Using Vital Statistics: International Comparisons Presentation & Interpretation
Explanation: Is the variation between countries adequately explained?
Focus on what differences are present rather than why the differences are present Genetic
Cultural
Economic
Political
Environmental SOURCES: Australian Institute of Health and Welfare 2012. A working guide to international comparisons of health. Cat. No. PHE 159. Canberra: AIHW.<br>
slide42. Using Vital Statistics: International Comparisons Presentation & Interpretation
Underlying differentials: Are differences within countries considered?
Cultural groups
Administrative sectors
Socioeconomic status & income
Rural-urban divides
Literacy levels SOURCES: Australian Institute of Health and Welfare 2012. A working guide to international comparisons of health. Cat. No. PHE 159. Canberra: AIHW.<br>
slide43. LIFE EXPECTANCY AT BIRTH (YEARS) SOURCE: Australian Institute of Health and Welfare 2012. A working guide to international comparisons of health. Cat. No. PHE 159. Canberra: AIHW.<br>
slide44. Using Vital Statistics: International Comparisons Presentation & Interpretation
Context: Can the data be used ouside of the international comparison?
Standardization of data for comparisons
Methods and definitions may differ
International comparisons
Official country estimates SOURCES: Australian Institute of Health and Welfare 2012. A working guide to international comparisons of health. Cat. No. PHE 159. Canberra: AIHW.<br>
slide45. Mortality Statistics for Australia Using Different Data Sources SOURCES: Australian Institute of Health and Welfare 2012. A working guide to international comparisons of health. Cat. No. PHE 159. Canberra: AIHW.<br>
slide46. Activity Data Comparison:
See handout for activity details.
Review the international comparison of Maternal Mortality Ratio
Using the materials provided:
Comment on the strengths and weaknesses of the information presented.
What are the implications of these strengths and weaknesses on the interpretation of the results?
What additional information about the data would you like to have?<br>
slide47. References (Freedman) Freedman, MA. Improving Civil Registration and Vital Statistics. The World Bank. 2003.
(NCHS) National Center for Health Statistics. Methods of Civil Registration: Modular Course of Instruction.
(NVSS Births) National Vital Statistics Reports. Births: Final Data for 2006. 57(7). 7 Jan 2009.
(PRVSS2) UN. Principles and Recommendations for a Vital Statistics System, Revision 2. New York. 2001.
(UN Handbook) UN. Handbook on Training in Civil Registration and Vital Statistics Systems. Studies in Methods, Series F, No. 84. UN: New York. 2002.<br>
slide48. Activity Table of Contents:
In small groups, prepare the table of contents for an annual vital statistics report on the population of your country.
Compare your list with the actual report and with the table of contents of other groups.
Discuss the agreements and disagreements.<br>
slide49. Activity Report Content:
In small groups, review sample reports from various countries. Compare and discuss:
Report content (statistics, tables, text, etc)
Use characteristics for evaluating international comparisons
Report style
Appendices
Share and compare your observations with the class.<br>
slide50. Activity Vital Statistics Report Review:
In small groups, review the annual report and answer the questions on the handout.
Compare your answers with those of other groups.
Discuss the agreements and disagreements.<br>
slide51. Activity Lists of Users:
In small groups, compile lists of the types of users for:
printed annual publications
monthly or quarterly bulletins
electronic media data releases
special tabulations<br>
slide52. Overall Review The UN minimal goals for using vital statistics call for detailed (semi-annual / annual) tabulations for vital events.
A publication annex (should / should not) include details of the national tabulation program.
Publications should conform to a designed plan to meet (user / developer) needs.
Monthly and quarterly bulletins (should / should not) be used as a data quality control tool.
Tabulation by place of (usual residence / occurrence) is faster than by (usual residence / occurrence).<br>
slide53. Overall Review Tabulation by date of (registration / occurrence) is faster than by (registration / occurrence).
Having a directory of users provides for (wide / targeted) dissemination of reports.
Data sets with identifiable data used for special research (do not require / require) approval.
Vital statistics information (can / cannot) be used for non-health purposes.
Good communication with data users is (ideal / essential).<br>