
Debt Investor Presentation Third Quarter 2023

Description: Debt Investor Presentation Third Quarter 2023 Forward-Looking Statements In addition to historical information, this presentation includes forward-looking statements that reflect managements current expectations for Farmer Macs future
Related Topics
Download Presentation
"Debt Investor Presentation Third Quarter 2023" is the property of its rightful owner. Permission is granted to download and print the materials on this website for personal, non-commercial use only, and to display it on your personal computer provided you do not modify the materials and that you retain all copyright notices contained in the materials. By downloading content from our website, you accept the terms of this agreement.
Presentation Transcript
slide1. Debt Investor
Presentation Third Quarter 2023<br>
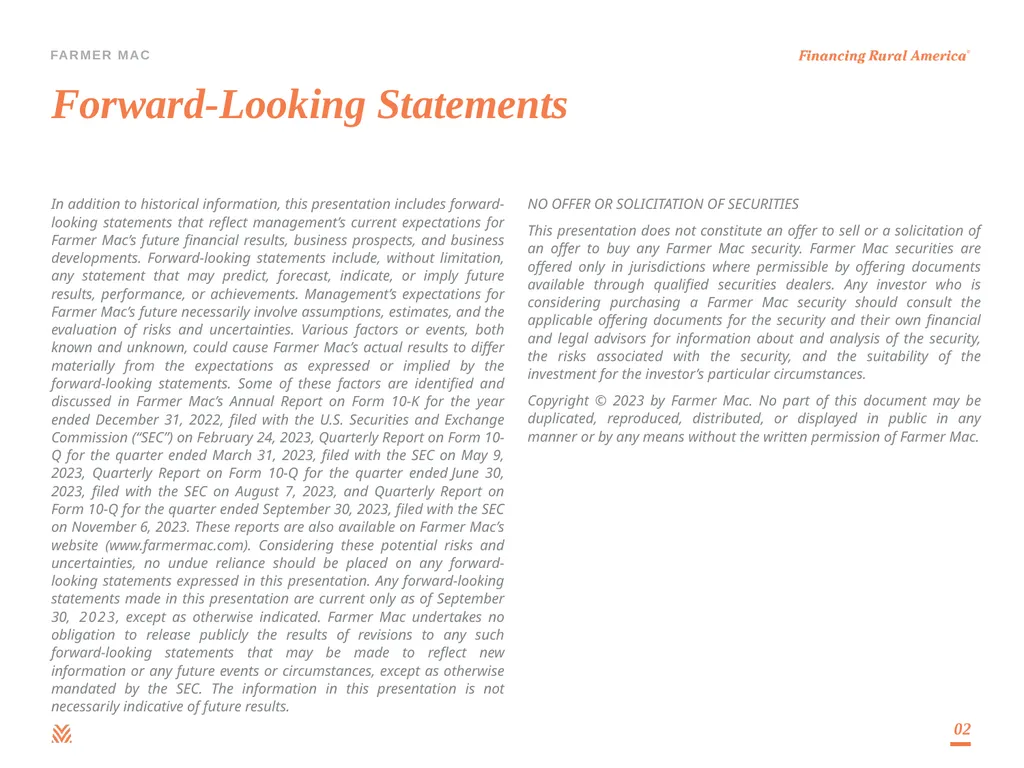
slide2. Forward-Looking Statements In addition to historical information, this presentation includes forward-looking statements that reflect management’s current expectations for Farmer Mac’s future financial results, business prospects, and business developments. Forward-looking statements include, without limitation, any statement that may predict, forecast, indicate, or imply future results, performance, or achievements. Management’s expectations for Farmer Mac’s future necessarily involve assumptions, estimates, and the evaluation of risks and uncertainties. Various factors or events, both known and unknown, could cause Farmer Mac’s actual results to differ materially from the expectations as expressed or implied by the forward-looking statements. Some of these factors are identified and discussed in Farmer Mac’s Annual Report on Form 10-K for the year ended December 31, 2022, filed with the U.S. Securities and Exchange Commission (“SEC”) on February 24, 2023, Quarterly Report on Form 10-Q for the quarter ended March 31, 2023, filed with the SEC on May 9, 2023, Quarterly Report on Form 10-Q for the quarter ended June 30, 2023, filed with the SEC on August 7, 2023, and Quarterly Report on Form 10-Q for the quarter ended September 30, 2023, filed with the SEC on November 6, 2023. These reports are also available on Farmer Mac’s website (www.farmermac.com). Considering these potential risks and uncertainties, no undue reliance should be placed on any forward-looking statements expressed in this presentation. Any forward-looking statements made in this presentation are current only as of September 30, 2023, except as otherwise indicated. Farmer Mac undertakes no obligation to release publicly the results of revisions to any such forward-looking statements that may be made to reflect new information or any future events or circumstances, except as otherwise mandated by the SEC. The information in this presentation is not necessarily indicative of future results. NO OFFER OR SOLICITATION OF SECURITIES
This presentation does not constitute an offer to sell or a solicitation of an offer to buy any Farmer Mac security. Farmer Mac securities are offered only in jurisdictions where permissible by offering documents available through qualified securities dealers. Any investor who is considering purchasing a Farmer Mac security should consult the applicable offering documents for the security and their own financial and legal advisors for information about and analysis of the security, the risks associated with the security, and the suitability of the investment for the investor’s particular circumstances.
Copyright © 2023 by Farmer Mac. No part of this document may be duplicated, reproduced, distributed, or displayed in public in any manner or by any means without the written permission of Farmer Mac. 02<br>
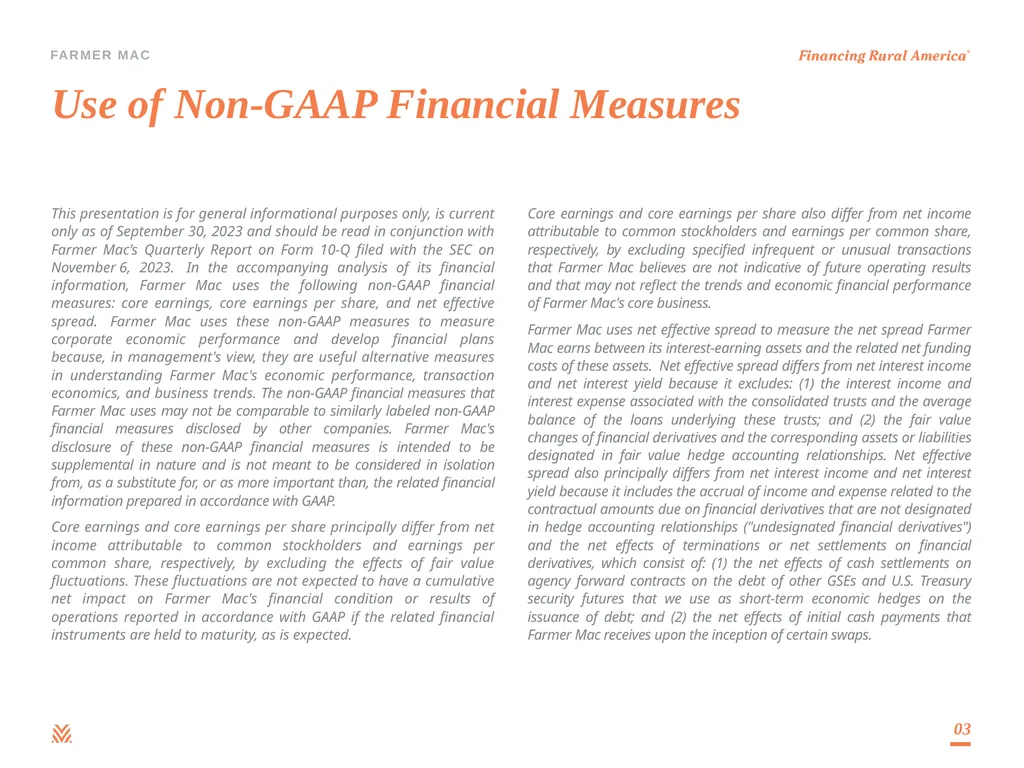
slide3. Use of Non-GAAP Financial Measures This presentation is for general informational purposes only, is current only as of September 30, 2023 and should be read in conjunction with Farmer Mac’s Quarterly Report on Form 10-Q filed with the SEC on November 6, 2023. In the accompanying analysis of its financial information, Farmer Mac uses the following non-GAAP financial measures: core earnings, core earnings per share, and net effective spread. Farmer Mac uses these non-GAAP measures to measure corporate economic performance and develop financial plans because, in management's view, they are useful alternative measures in understanding Farmer Mac's economic performance, transaction economics, and business trends. The non-GAAP financial measures that Farmer Mac uses may not be comparable to similarly labeled non-GAAP financial measures disclosed by other companies. Farmer Mac's disclosure of these non-GAAP financial measures is intended to be supplemental in nature and is not meant to be considered in isolation from, as a substitute for, or as more important than, the related financial information prepared in accordance with GAAP.
Core earnings and core earnings per share principally differ from net income attributable to common stockholders and earnings per common share, respectively, by excluding the effects of fair value fluctuations. These fluctuations are not expected to have a cumulative net impact on Farmer Mac's financial condition or results of operations reported in accordance with GAAP if the related financial instruments are held to maturity, as is expected. Core earnings and core earnings per share also differ from net income attributable to common stockholders and earnings per common share, respectively, by excluding specified infrequent or unusual transactions that Farmer Mac believes are not indicative of future operating results and that may not reflect the trends and economic financial performance of Farmer Mac's core business.
Farmer Mac uses net effective spread to measure the net spread Farmer Mac earns between its interest-earning assets and the related net funding costs of these assets. Net effective spread differs from net interest income and net interest yield because it excludes: (1) the interest income and interest expense associated with the consolidated trusts and the average balance of the loans underlying these trusts; and (2) the fair value changes of financial derivatives and the corresponding assets or liabilities designated in fair value hedge accounting relationships. Net effective spread also principally differs from net interest income and net interest yield because it includes the accrual of income and expense related to the contractual amounts due on financial derivatives that are not designated in hedge accounting relationships ("undesignated financial derivatives") and the net effects of terminations or net settlements on financial derivatives, which consist of: (1) the net effects of cash settlements on agency forward contracts on the debt of other GSEs and U.S. Treasury security futures that we use as short-term economic hedges on the issuance of debt; and (2) the net effects of initial cash payments that Farmer Mac receives upon the inception of certain swaps. 03<br>
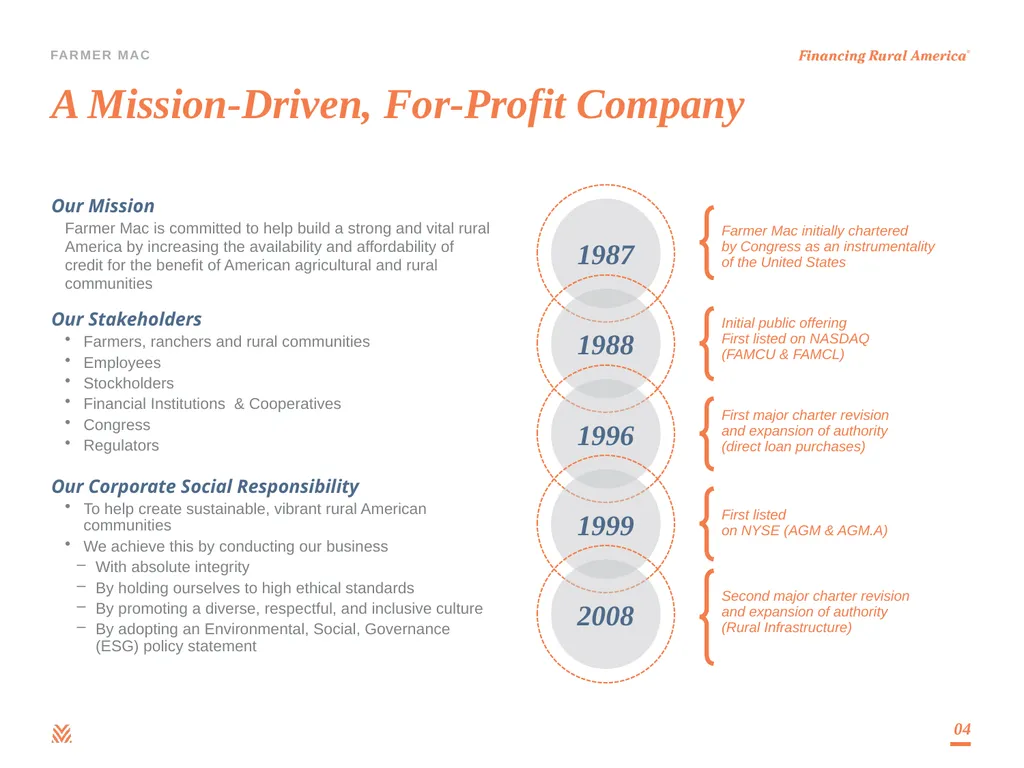
slide4. A Mission-Driven, For-Profit Company Our Mission
Farmer Mac is committed to help build a strong and vital rural America by increasing the availability and affordability of credit for the benefit of American agricultural and rural communities
Our Stakeholders
Farmers, ranchers and rural communities
Employees
Stockholders
Financial Institutions & Cooperatives
Congress
Regulators
Our Corporate Social Responsibility
To help create sustainable, vibrant rural American communities
We achieve this by conducting our business
With absolute integrity
By holding ourselves to high ethical standards
By promoting a diverse, respectful, and inclusive culture
By adopting an Environmental, Social, Governance (ESG) policy statement 04<br>
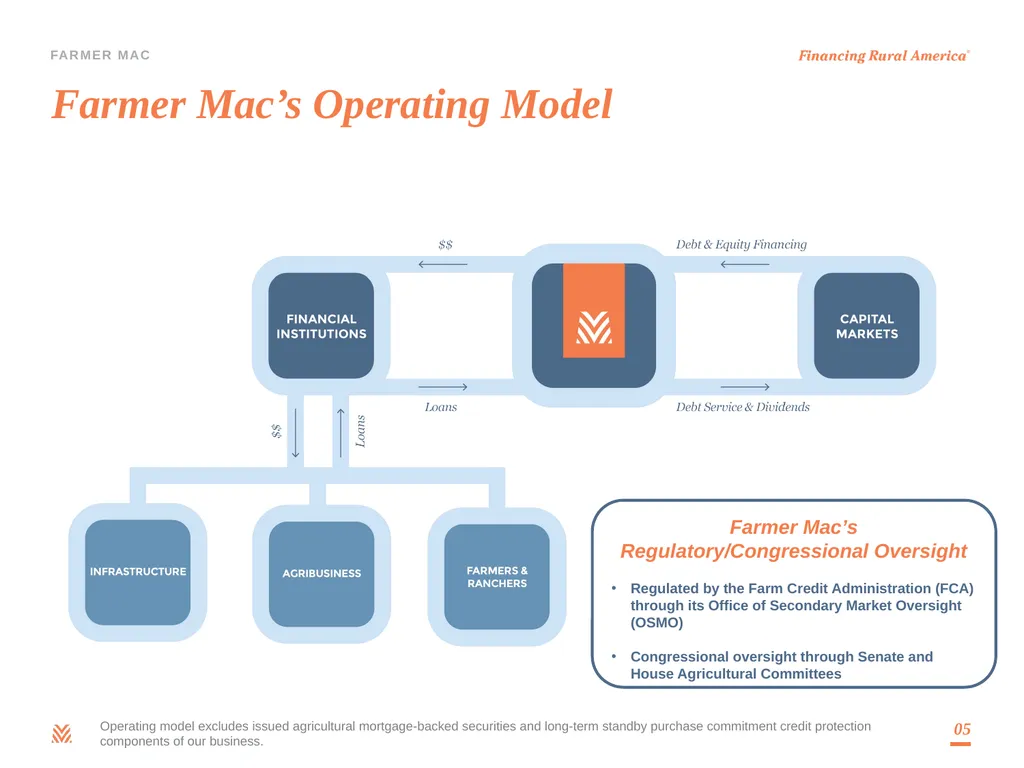
slide5. Farmer Mac’s Operating Model 05 Farmer Mac’s Regulatory/Congressional Oversight
Regulated by the Farm Credit Administration (FCA) through its Office of Secondary Market Oversight (OSMO)
Congressional oversight through Senate and House Agricultural Committees Operating model excludes issued agricultural mortgage-backed securities and long-term standby purchase commitment credit protection components of our business.<br>
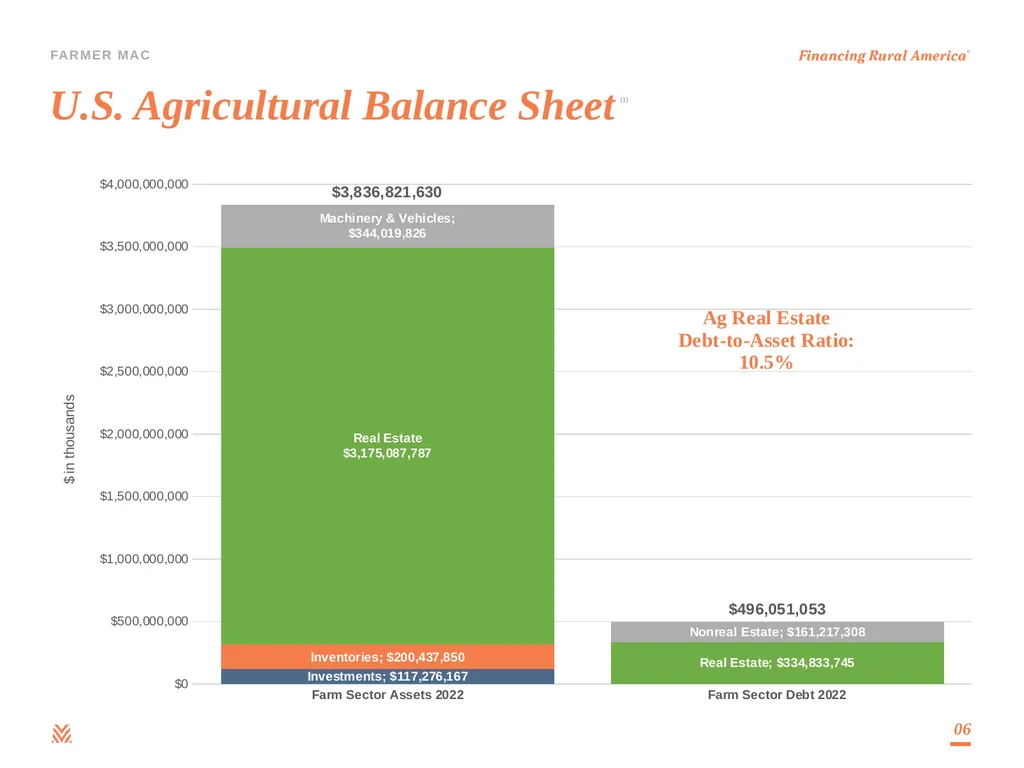
slide6. U.S. Agricultural Balance Sheet 06 (1)<br>
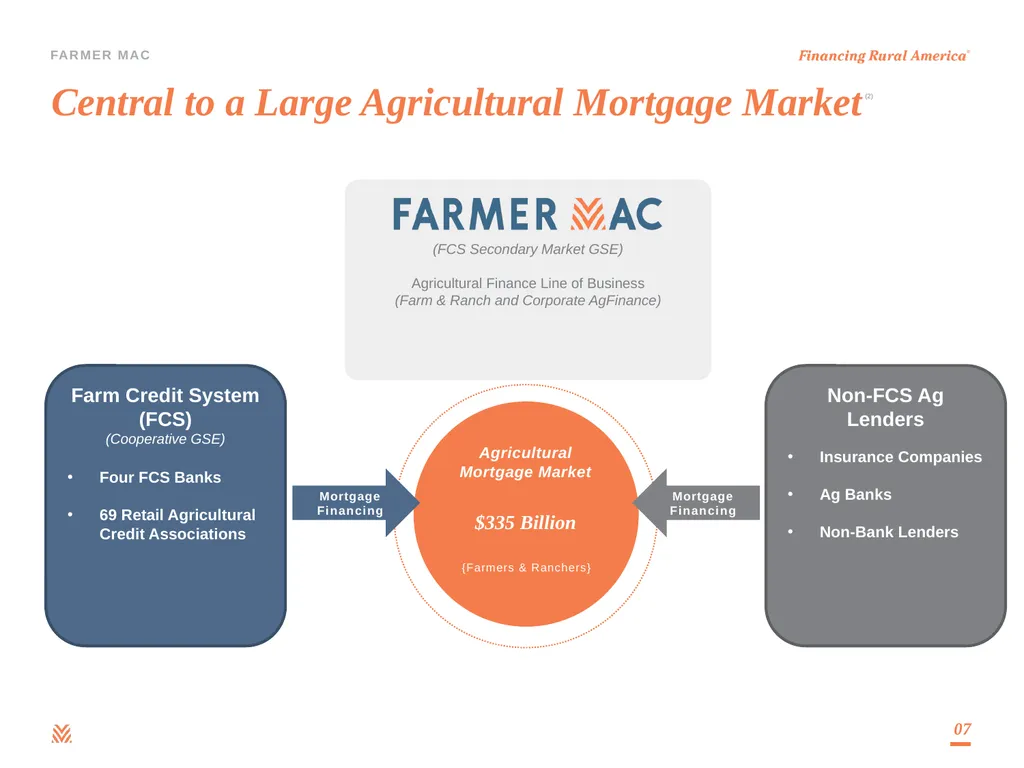
slide7. (FCS Secondary Market GSE)
Agricultural Finance Line of Business
(Farm & Ranch and Corporate AgFinance) Farm Credit System (FCS)
(Cooperative GSE)
Four FCS Banks
69 Retail Agricultural Credit Associations Central to a Large Agricultural Mortgage Market 07 Agricultural
Mortgage Market {Farmers & Ranchers} Mortgage Financing Mortgage Financing $335 Billion AG BANKS
$61B NON-BANK LENDERS
$13B (2) Non-FCS Ag Lenders
Insurance Companies
Ag Banks
Non-Bank Lenders<br>
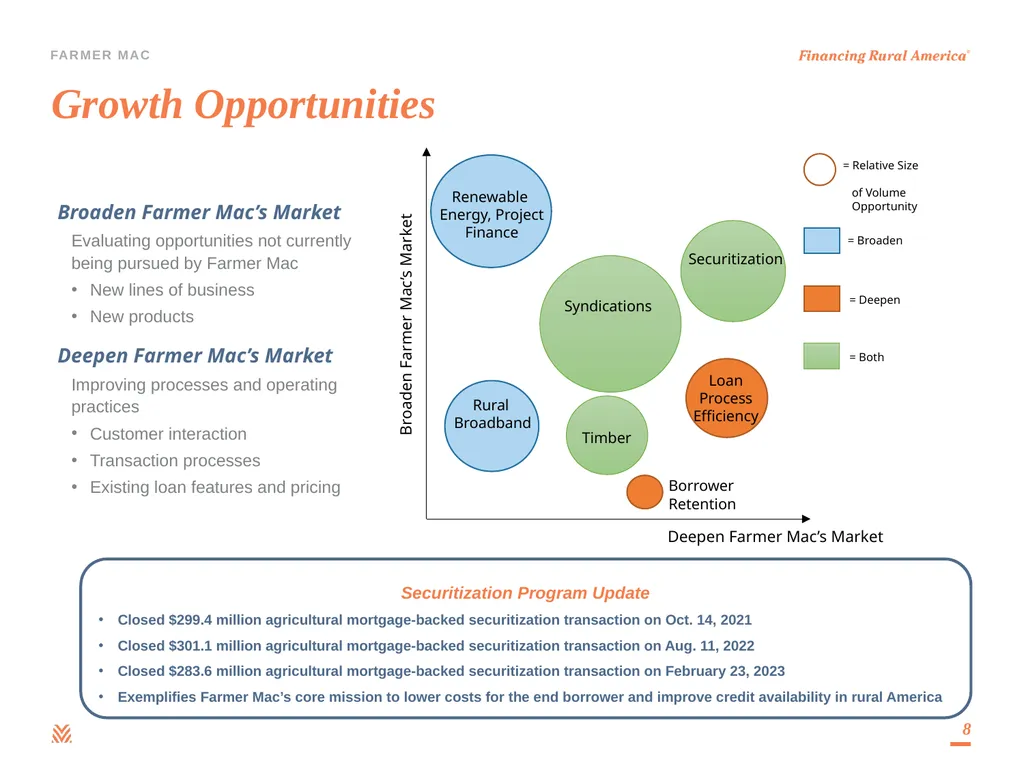
slide8. Securitization Program Update
Closed $299.4 million agricultural mortgage-backed securitization transaction on Oct. 14, 2021
Closed $301.1 million agricultural mortgage-backed securitization transaction on Aug. 11, 2022
Closed $283.6 million agricultural mortgage-backed securitization transaction on February 23, 2023
Exemplifies Farmer Mac’s core mission to lower costs for the end borrower and improve credit availability in rural America Growth Opportunities 8 Broaden Farmer Mac’s Market
Evaluating opportunities not currently being pursued by Farmer Mac
New lines of business
New products
Deepen Farmer Mac’s Market
Improving processes and operating practices
Customer interaction
Transaction processes
Existing loan features and pricing<br>
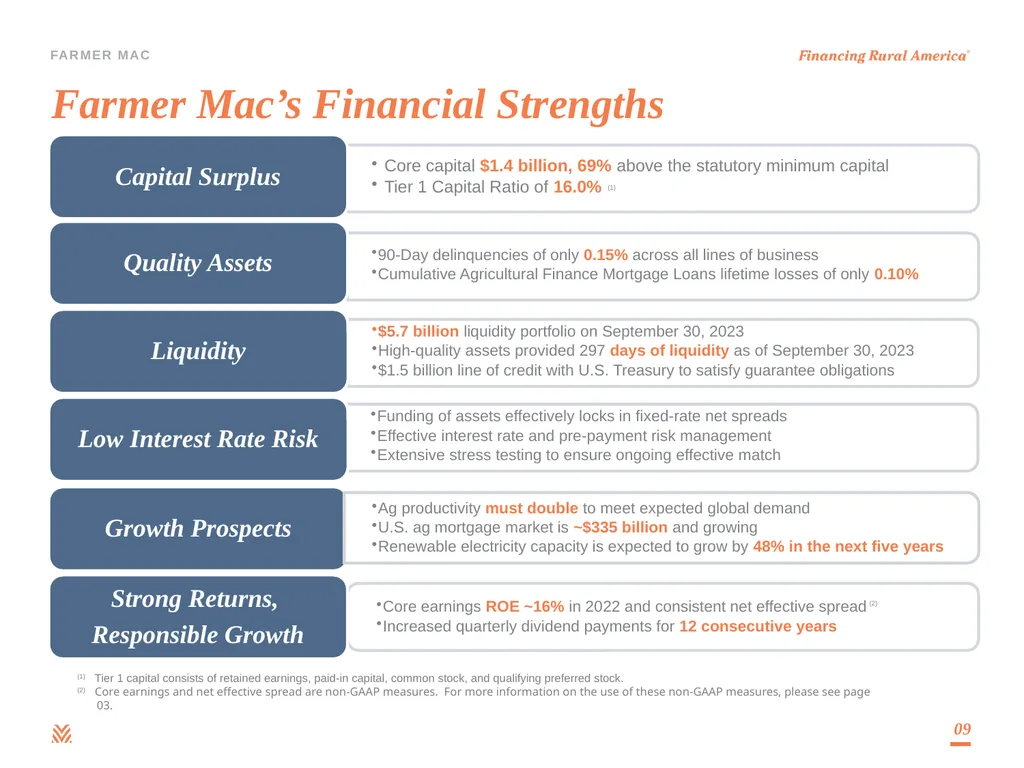
slide9. Farmer Mac’s Financial Strengths 09 (1) Tier 1 capital consists of retained earnings, paid-in capital, common stock, and qualifying preferred stock.
(2) Core earnings and net effective spread are non-GAAP measures. For more information on the use of these non-GAAP measures, please see page 03. (2) (1)<br>
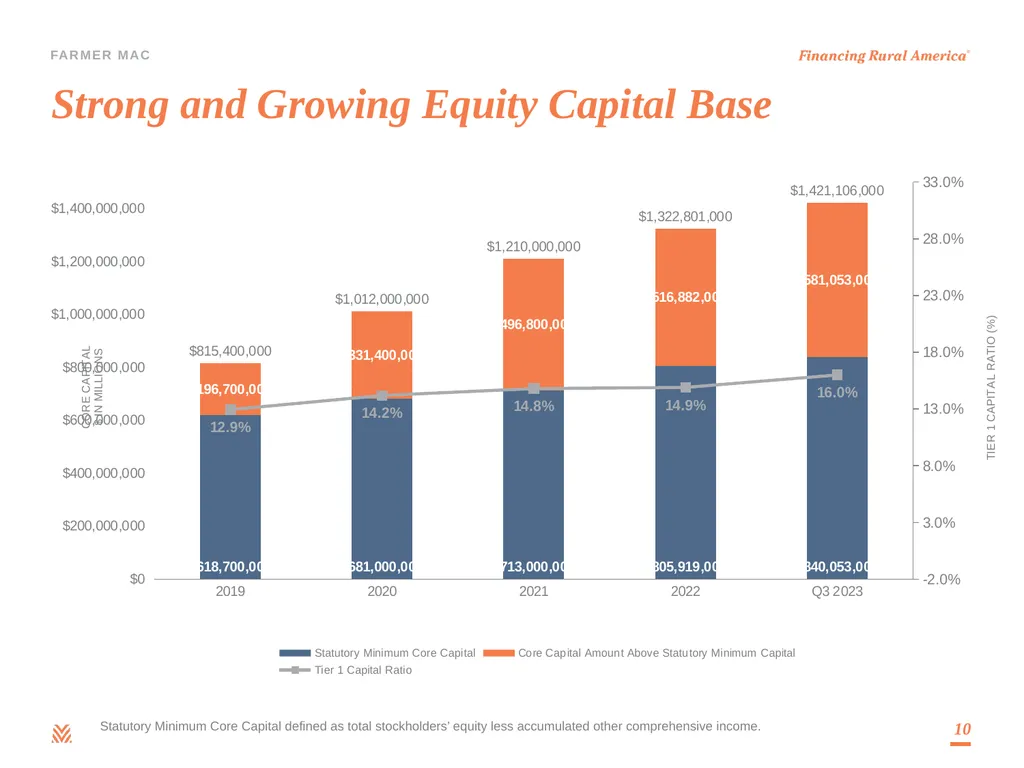
slide10. Strong and Growing Equity Capital Base 10 Statutory Minimum Core Capital defined as total stockholders’ equity less accumulated other comprehensive income.<br>
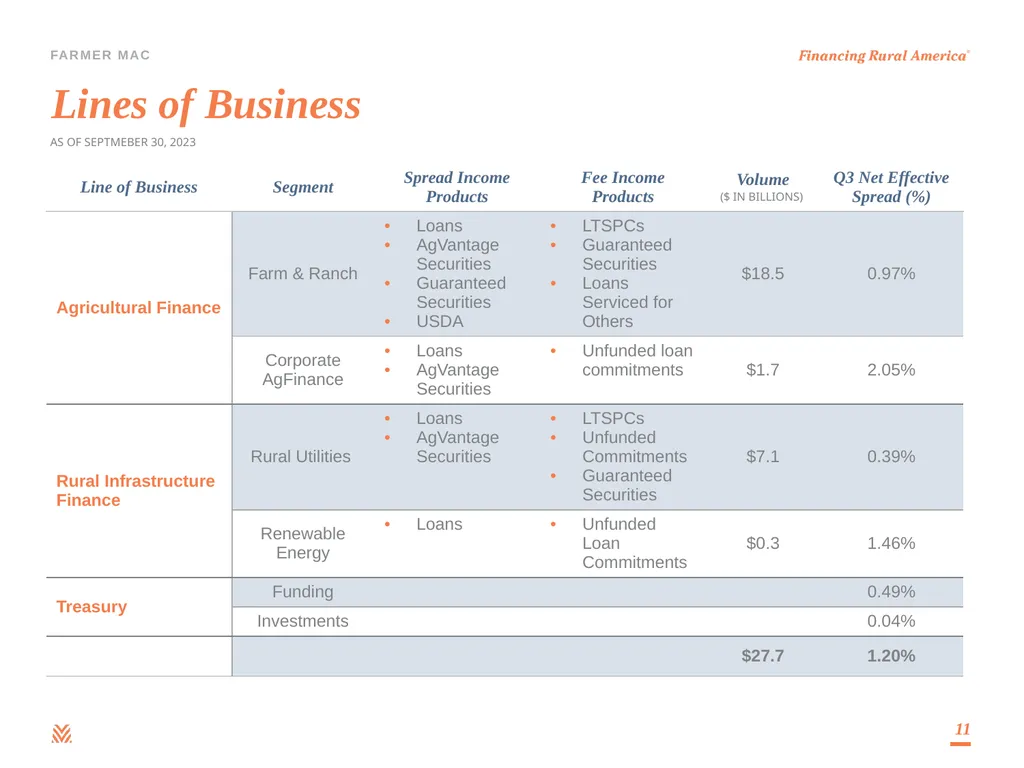
slide11. Lines of Business 11 AS OF SEPTMEBER 30, 2023<br>
slide12. Agricultural Finance Loan Portfolio Diversification 12 AS OF SEPTEMBER 30, 2023 Agricultural Update
USDA’s Economic Research Service estimates $189.9 billion in net cash incomes in 2022, a significant increase from 2021 and 2020 incomes and a new record in both real and nominal terms.
Net cash income in 2023 is forecast to fall by 21% due to elevated input costs and moderating commodity prices. However, forecast 2023 levels are still well above the 10-year average for farm profitability. (3)<br>
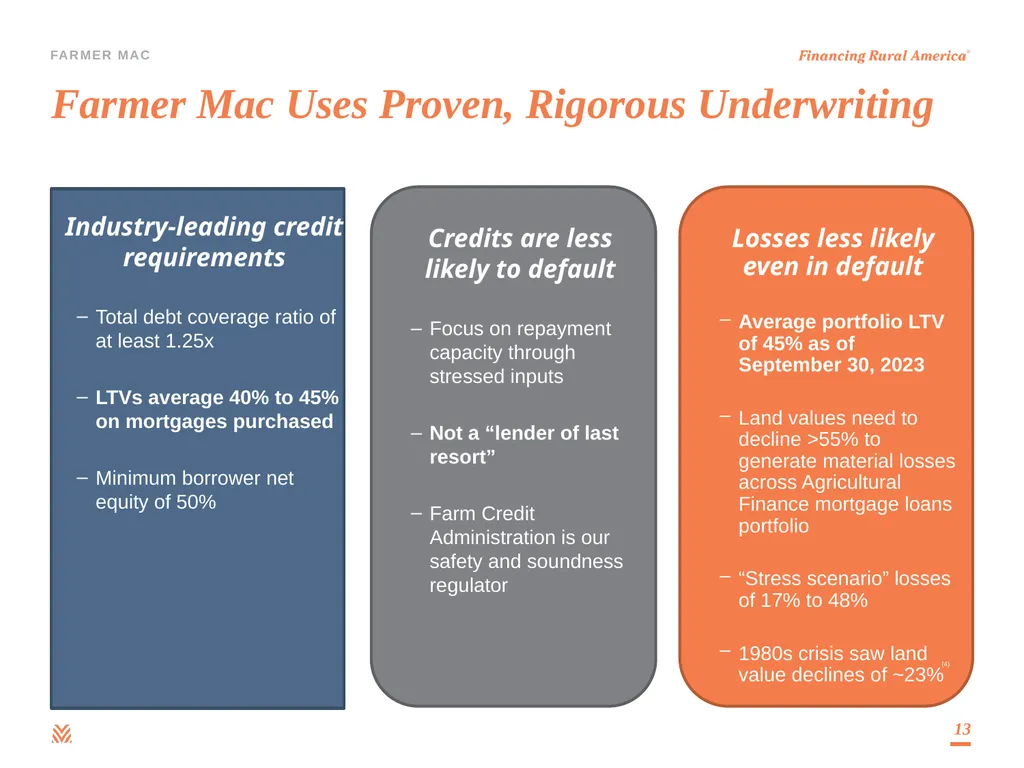
slide13. Losses less likely even in default
Average portfolio LTV of 45% as of September 30, 2023
Land values need to decline >55% to generate material losses across Agricultural Finance mortgage loans portfolio
“Stress scenario” losses of 17% to 48%
1980s crisis saw land value declines of ~23% Farmer Mac Uses Proven, Rigorous Underwriting Industry-leading credit requirements
Total debt coverage ratio of at least 1.25x
LTVs average 40% to 45% on mortgages purchased
Minimum borrower net equity of 50% 13 Credits are less likely to default
Focus on repayment capacity through stressed inputs
Not a “lender of last resort”
Farm Credit Administration is our safety and soundness regulator (4)<br>
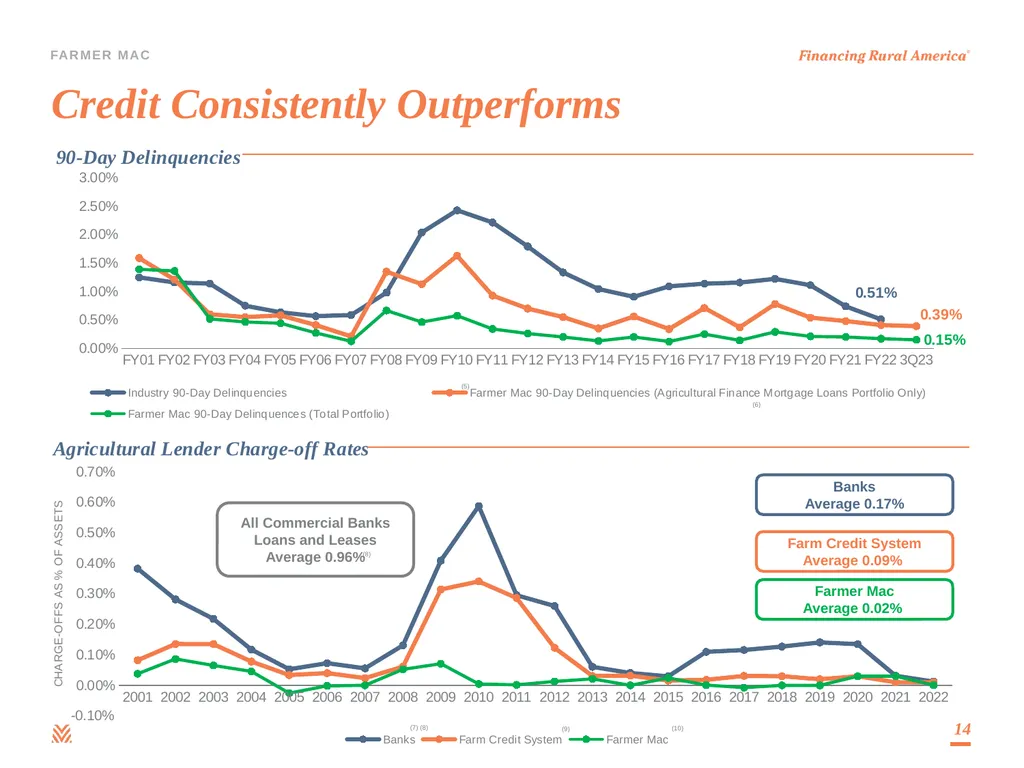
slide14. Credit Consistently Outperforms 14 Farmer Mac
Average 0.02% Farm Credit System
Average 0.09% Banks
Average 0.17% All Commercial Banks
Loans and Leases
Average 0.96% (8) (5) (6) (7) (8) (9) (10)<br>
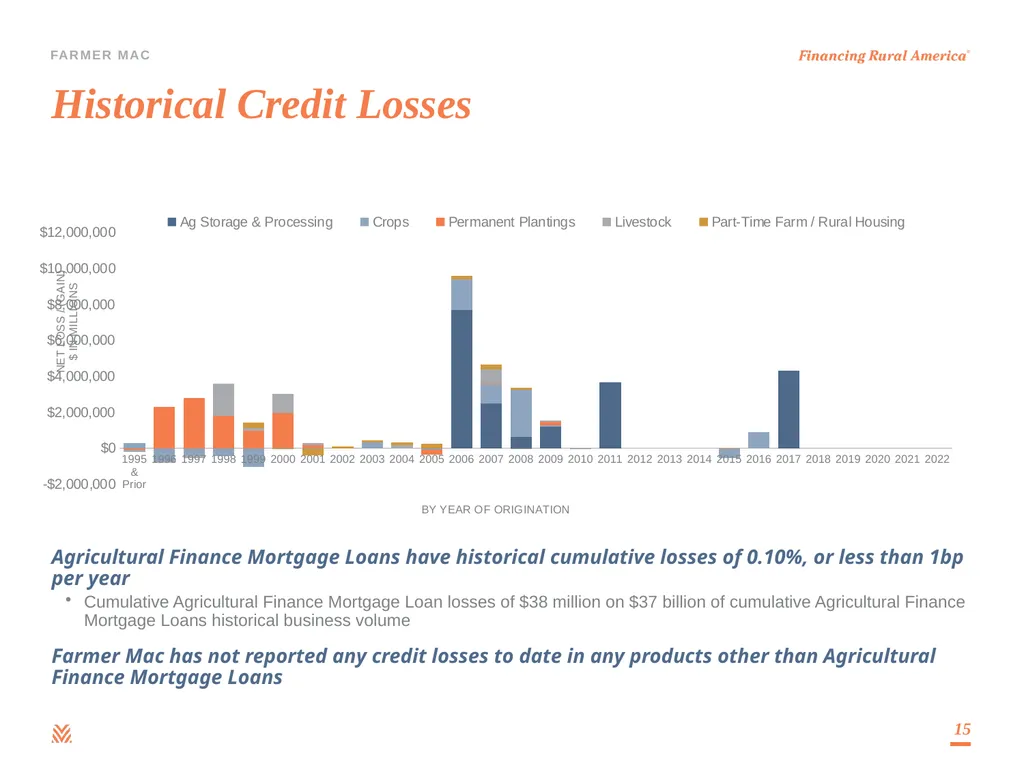
slide15. Historical Credit Losses Agricultural Finance Mortgage Loans have historical cumulative losses of 0.10%, or less than 1bp per year
Cumulative Agricultural Finance Mortgage Loan losses of $38 million on $37 billion of cumulative Agricultural Finance Mortgage Loans historical business volume
Farmer Mac has not reported any credit losses to date in any products other than Agricultural Finance Mortgage Loans 15<br>
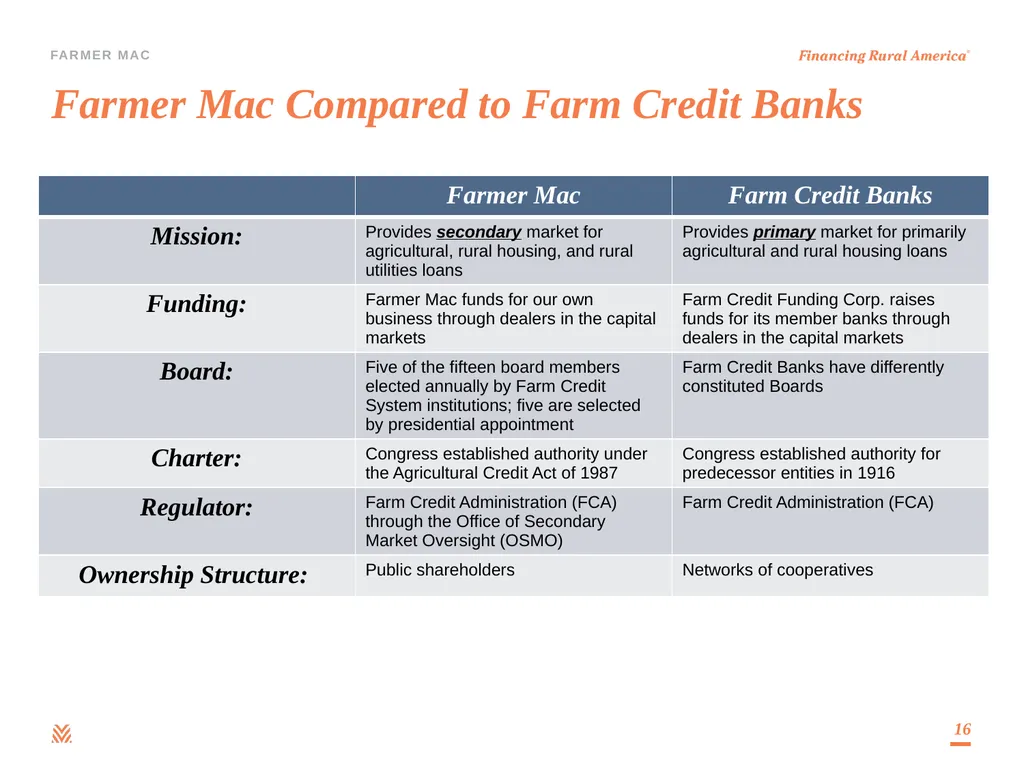
slide16. Farmer Mac Compared to Farm Credit Banks 16<br>
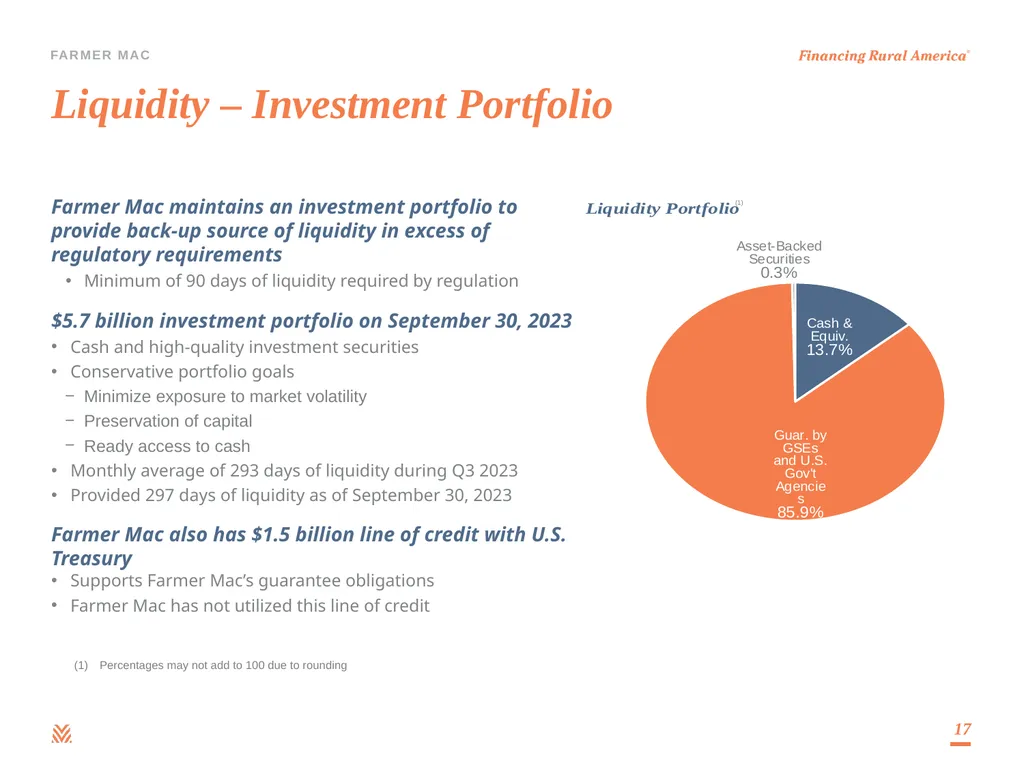
slide17. Liquidity – Investment Portfolio Farmer Mac maintains an investment portfolio to provide back-up source of liquidity in excess of regulatory requirements
Minimum of 90 days of liquidity required by regulation
$5.7 billion investment portfolio on September 30, 2023
Cash and high-quality investment securities
Conservative portfolio goals
Minimize exposure to market volatility
Preservation of capital
Ready access to cash
Monthly average of 293 days of liquidity during Q3 2023
Provided 297 days of liquidity as of September 30, 2023
Farmer Mac also has $1.5 billion line of credit with U.S. Treasury
Supports Farmer Mac’s guarantee obligations
Farmer Mac has not utilized this line of credit 17 Percentages may not add to 100 due to rounding (1)<br>
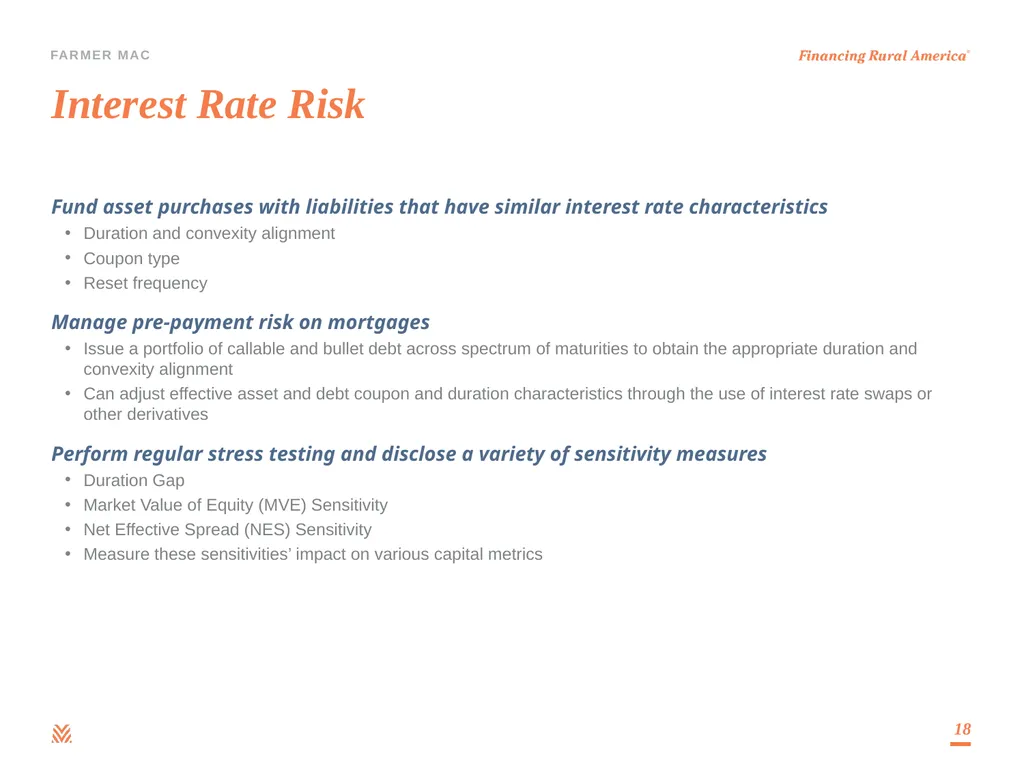
slide18. Interest Rate Risk Fund asset purchases with liabilities that have similar interest rate characteristics
Duration and convexity alignment
Coupon type
Reset frequency
Manage pre-payment risk on mortgages
Issue a portfolio of callable and bullet debt across spectrum of maturities to obtain the appropriate duration and convexity alignment
Can adjust effective asset and debt coupon and duration characteristics through the use of interest rate swaps or other derivatives
Perform regular stress testing and disclose a variety of sensitivity measures
Duration Gap
Market Value of Equity (MVE) Sensitivity
Net Effective Spread (NES) Sensitivity
Measure these sensitivities’ impact on various capital metrics 18<br>
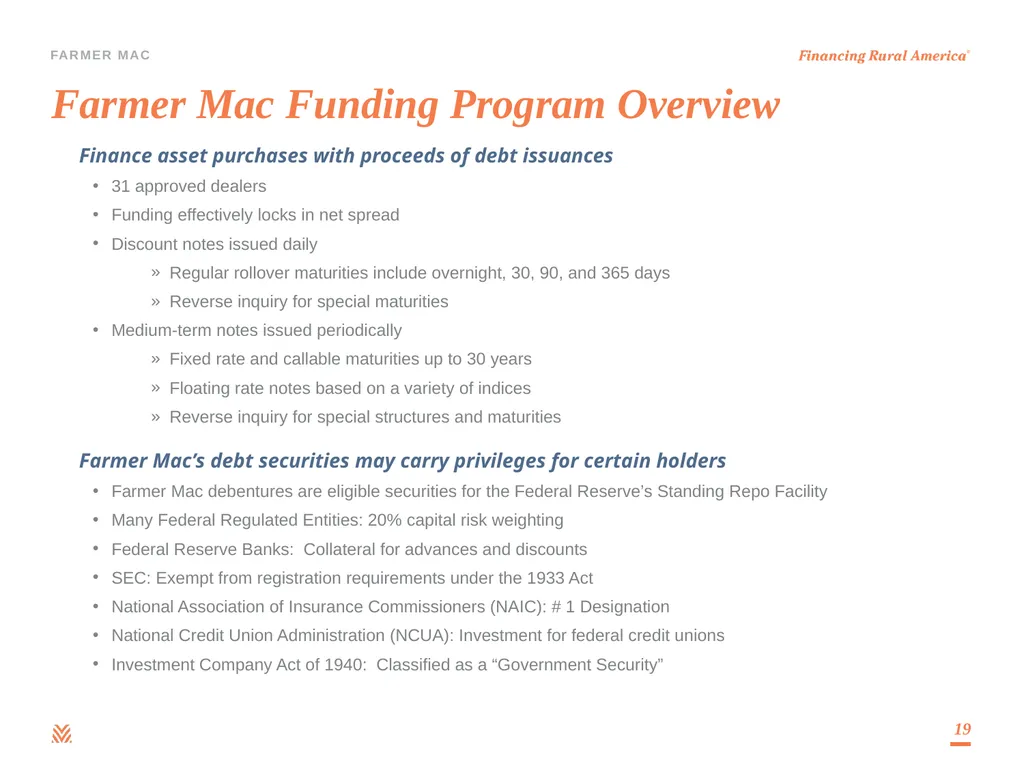
slide19. Farmer Mac Funding Program Overview 19 Finance asset purchases with proceeds of debt issuances
31 approved dealers
Funding effectively locks in net spread
Discount notes issued daily
Regular rollover maturities include overnight, 30, 90, and 365 days
Reverse inquiry for special maturities
Medium-term notes issued periodically
Fixed rate and callable maturities up to 30 years
Floating rate notes based on a variety of indices
Reverse inquiry for special structures and maturities
Farmer Mac’s debt securities may carry privileges for certain holders
Farmer Mac debentures are eligible securities for the Federal Reserve’s Standing Repo Facility
Many Federal Regulated Entities: 20% capital risk weighting
Federal Reserve Banks: Collateral for advances and discounts
SEC: Exempt from registration requirements under the 1933 Act
National Association of Insurance Commissioners (NAIC): # 1 Designation
National Credit Union Administration (NCUA): Investment for federal credit unions
Investment Company Act of 1940: Classified as a “Government Security”<br>
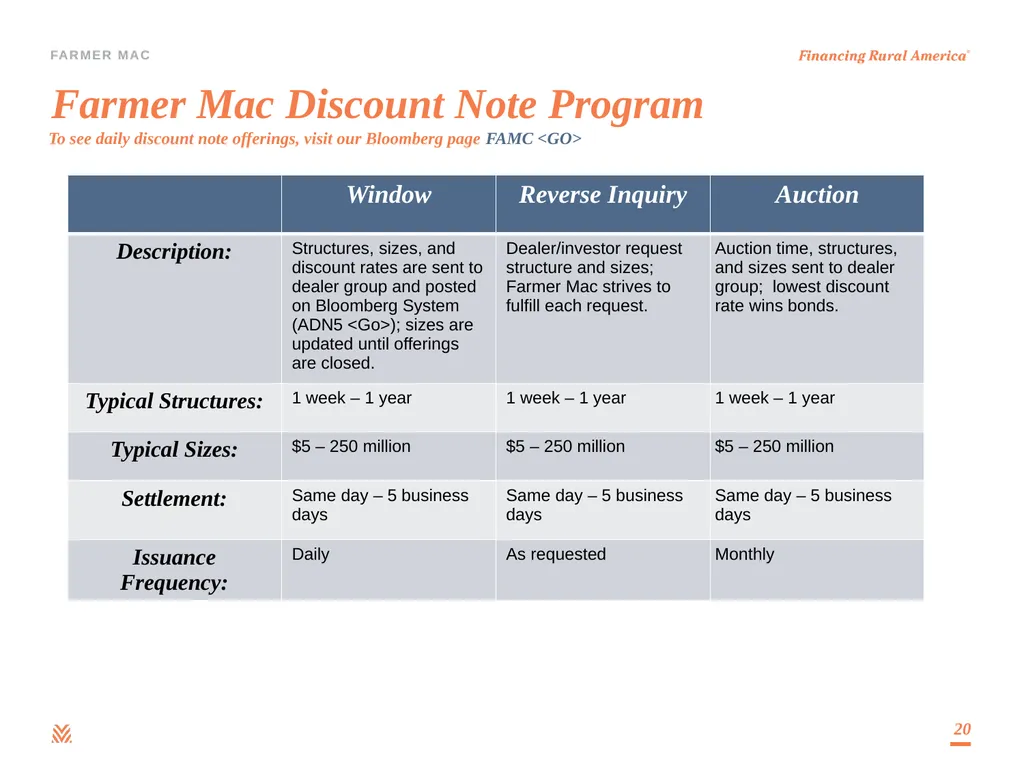
slide20. Farmer Mac Discount Note Program 20 To see daily discount note offerings, visit our Bloomberg page FAMC <GO><br>
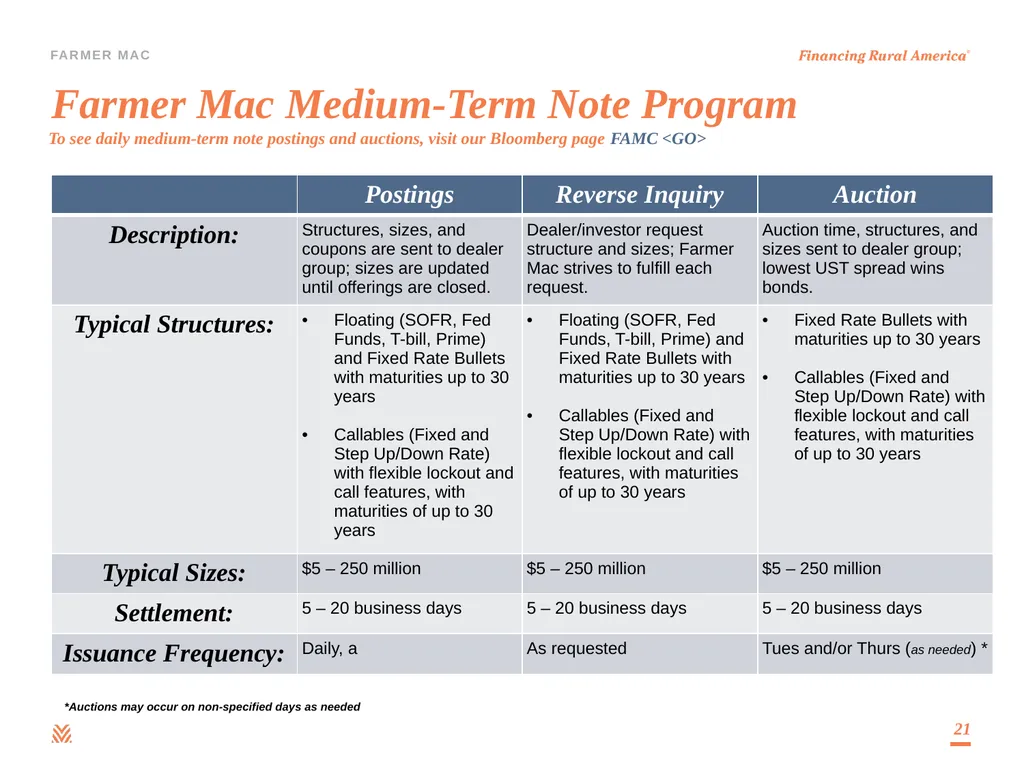
slide21. Farmer Mac Medium-Term Note Program 21 To see daily medium-term note postings and auctions, visit our Bloomberg page FAMC <GO> *Auctions may occur on non-specified days as needed<br>
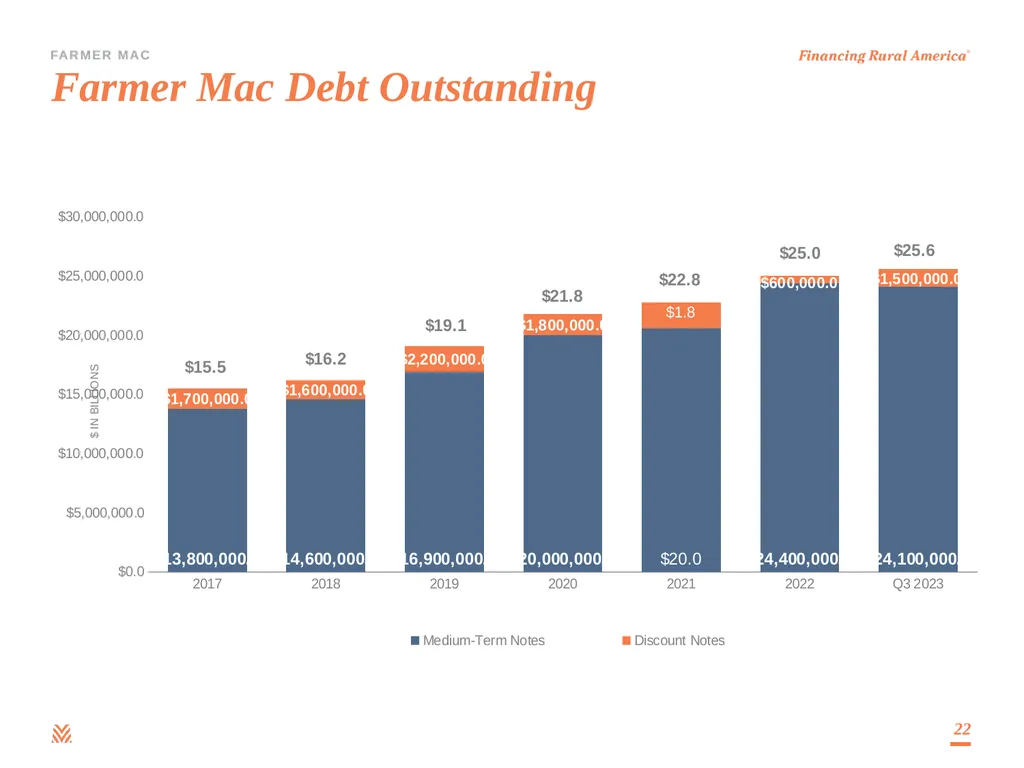
slide22. Farmer Mac Debt Outstanding 22<br>
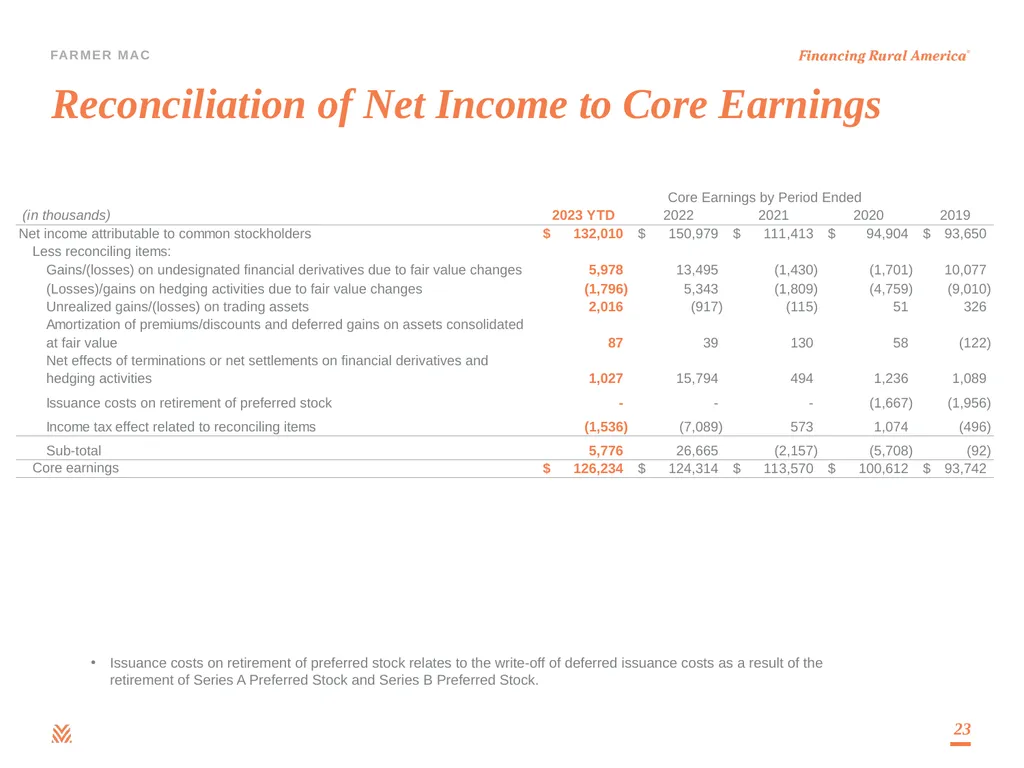
slide23. Reconciliation of Net Income to Core Earnings 23 Issuance costs on retirement of preferred stock relates to the write-off of deferred issuance costs as a result of the retirement of Series A Preferred Stock and Series B Preferred Stock.<br>
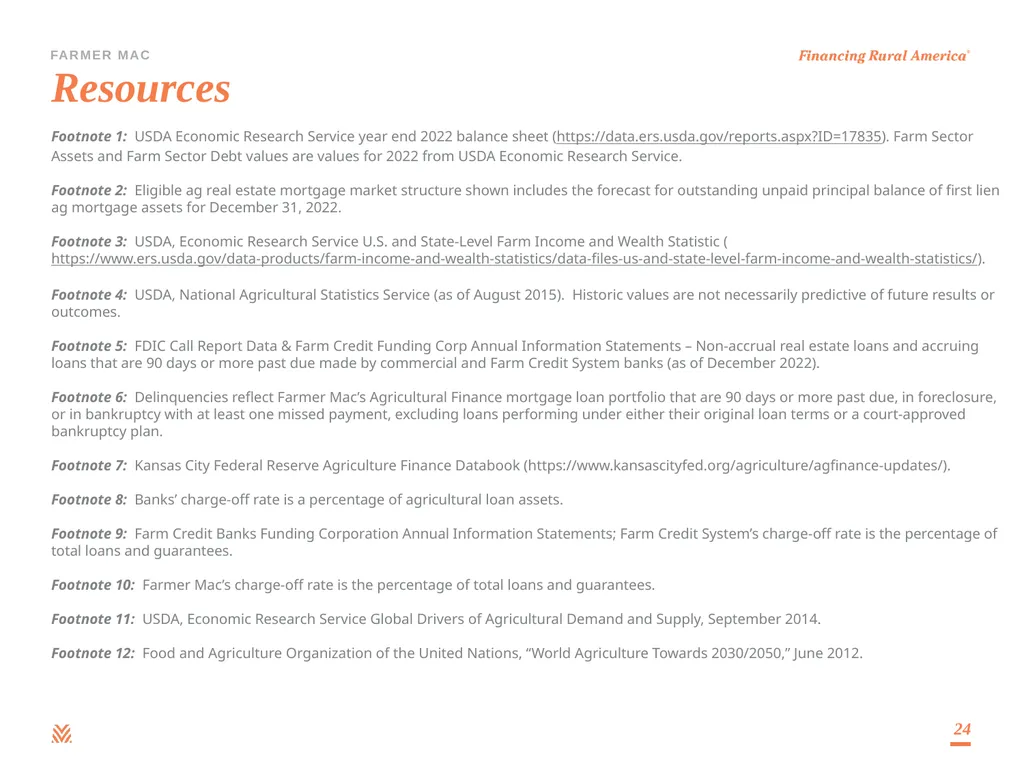
slide24. Resources Footnote 1: USDA Economic Research Service year end 2022 balance sheet (https://data.ers.usda.gov/reports.aspx?ID=17835). Farm Sector Assets and Farm Sector Debt values are values for 2022 from USDA Economic Research Service.
Footnote 2: Eligible ag real estate mortgage market structure shown includes the forecast for outstanding unpaid principal balance of first lien ag mortgage assets for December 31, 2022.
Footnote 3: USDA, Economic Research Service U.S. and State-Level Farm Income and Wealth Statistic (https://www.ers.usda.gov/data-products/farm-income-and-wealth-statistics/data-files-us-and-state-level-farm-income-and-wealth-statistics/).
Footnote 4: USDA, National Agricultural Statistics Service (as of August 2015). Historic values are not necessarily predictive of future results or outcomes.
Footnote 5: FDIC Call Report Data & Farm Credit Funding Corp Annual Information Statements – Non-accrual real estate loans and accruing loans that are 90 days or more past due made by commercial and Farm Credit System banks (as of December 2022).
Footnote 6: Delinquencies reflect Farmer Mac’s Agricultural Finance mortgage loan portfolio that are 90 days or more past due, in foreclosure, or in bankruptcy with at least one missed payment, excluding loans performing under either their original loan terms or a court-approved bankruptcy plan.
Footnote 7: Kansas City Federal Reserve Agriculture Finance Databook (https://www.kansascityfed.org/agriculture/agfinance-updates/).
Footnote 8: Banks’ charge-off rate is a percentage of agricultural loan assets.
Footnote 9: Farm Credit Banks Funding Corporation Annual Information Statements; Farm Credit System’s charge-off rate is the percentage of total loans and guarantees.
Footnote 10: Farmer Mac’s charge-off rate is the percentage of total loans and guarantees.
Footnote 11: USDA, Economic Research Service Global Drivers of Agricultural Demand and Supply, September 2014.
Footnote 12: Food and Agriculture Organization of the United Nations, “World Agriculture Towards 2030/2050,” June 2012. 24<br>
slide25. Debt Investor Relations Contacts 25 Robert Owens Senior Director - Fixed Income Strategy rowens@farmermac.com Office: 202.872.5561 Cell: 202.557.6842
Diane Asuncion Manager - Fixed Income Strategy dasuncion@farmermac.com Office: 202.559.6532 Cell: 202.868.7437
Visit our Bloomberg page FAMC <GO>
https://www.farmermac.com/investors/debt-securities/<br>
slide2. Forward-Looking Statements In addition to historical information, this presentation includes forward-looking statements that reflect management’s current expectations for Farmer Mac’s future financial results, business prospects, and business developments. Forward-looking statements include, without limitation, any statement that may predict, forecast, indicate, or imply future results, performance, or achievements. Management’s expectations for Farmer Mac’s future necessarily involve assumptions, estimates, and the evaluation of risks and uncertainties. Various factors or events, both known and unknown, could cause Farmer Mac’s actual results to differ materially from the expectations as expressed or implied by the forward-looking statements. Some of these factors are identified and discussed in Farmer Mac’s Annual Report on Form 10-K for the year ended December 31, 2022, filed with the U.S. Securities and Exchange Commission (“SEC”) on February 24, 2023, Quarterly Report on Form 10-Q for the quarter ended March 31, 2023, filed with the SEC on May 9, 2023, Quarterly Report on Form 10-Q for the quarter ended June 30, 2023, filed with the SEC on August 7, 2023, and Quarterly Report on Form 10-Q for the quarter ended September 30, 2023, filed with the SEC on November 6, 2023. These reports are also available on Farmer Mac’s website (www.farmermac.com). Considering these potential risks and uncertainties, no undue reliance should be placed on any forward-looking statements expressed in this presentation. Any forward-looking statements made in this presentation are current only as of September 30, 2023, except as otherwise indicated. Farmer Mac undertakes no obligation to release publicly the results of revisions to any such forward-looking statements that may be made to reflect new information or any future events or circumstances, except as otherwise mandated by the SEC. The information in this presentation is not necessarily indicative of future results. NO OFFER OR SOLICITATION OF SECURITIES
This presentation does not constitute an offer to sell or a solicitation of an offer to buy any Farmer Mac security. Farmer Mac securities are offered only in jurisdictions where permissible by offering documents available through qualified securities dealers. Any investor who is considering purchasing a Farmer Mac security should consult the applicable offering documents for the security and their own financial and legal advisors for information about and analysis of the security, the risks associated with the security, and the suitability of the investment for the investor’s particular circumstances.
Copyright © 2023 by Farmer Mac. No part of this document may be duplicated, reproduced, distributed, or displayed in public in any manner or by any means without the written permission of Farmer Mac. 02<br>
slide3. Use of Non-GAAP Financial Measures This presentation is for general informational purposes only, is current only as of September 30, 2023 and should be read in conjunction with Farmer Mac’s Quarterly Report on Form 10-Q filed with the SEC on November 6, 2023. In the accompanying analysis of its financial information, Farmer Mac uses the following non-GAAP financial measures: core earnings, core earnings per share, and net effective spread. Farmer Mac uses these non-GAAP measures to measure corporate economic performance and develop financial plans because, in management's view, they are useful alternative measures in understanding Farmer Mac's economic performance, transaction economics, and business trends. The non-GAAP financial measures that Farmer Mac uses may not be comparable to similarly labeled non-GAAP financial measures disclosed by other companies. Farmer Mac's disclosure of these non-GAAP financial measures is intended to be supplemental in nature and is not meant to be considered in isolation from, as a substitute for, or as more important than, the related financial information prepared in accordance with GAAP.
Core earnings and core earnings per share principally differ from net income attributable to common stockholders and earnings per common share, respectively, by excluding the effects of fair value fluctuations. These fluctuations are not expected to have a cumulative net impact on Farmer Mac's financial condition or results of operations reported in accordance with GAAP if the related financial instruments are held to maturity, as is expected. Core earnings and core earnings per share also differ from net income attributable to common stockholders and earnings per common share, respectively, by excluding specified infrequent or unusual transactions that Farmer Mac believes are not indicative of future operating results and that may not reflect the trends and economic financial performance of Farmer Mac's core business.
Farmer Mac uses net effective spread to measure the net spread Farmer Mac earns between its interest-earning assets and the related net funding costs of these assets. Net effective spread differs from net interest income and net interest yield because it excludes: (1) the interest income and interest expense associated with the consolidated trusts and the average balance of the loans underlying these trusts; and (2) the fair value changes of financial derivatives and the corresponding assets or liabilities designated in fair value hedge accounting relationships. Net effective spread also principally differs from net interest income and net interest yield because it includes the accrual of income and expense related to the contractual amounts due on financial derivatives that are not designated in hedge accounting relationships ("undesignated financial derivatives") and the net effects of terminations or net settlements on financial derivatives, which consist of: (1) the net effects of cash settlements on agency forward contracts on the debt of other GSEs and U.S. Treasury security futures that we use as short-term economic hedges on the issuance of debt; and (2) the net effects of initial cash payments that Farmer Mac receives upon the inception of certain swaps. 03<br>
slide4. A Mission-Driven, For-Profit Company Our Mission
Farmer Mac is committed to help build a strong and vital rural America by increasing the availability and affordability of credit for the benefit of American agricultural and rural communities
Our Stakeholders
Farmers, ranchers and rural communities
Employees
Stockholders
Financial Institutions & Cooperatives
Congress
Regulators
Our Corporate Social Responsibility
To help create sustainable, vibrant rural American communities
We achieve this by conducting our business
With absolute integrity
By holding ourselves to high ethical standards
By promoting a diverse, respectful, and inclusive culture
By adopting an Environmental, Social, Governance (ESG) policy statement 04<br>
slide5. Farmer Mac’s Operating Model 05 Farmer Mac’s Regulatory/Congressional Oversight
Regulated by the Farm Credit Administration (FCA) through its Office of Secondary Market Oversight (OSMO)
Congressional oversight through Senate and House Agricultural Committees Operating model excludes issued agricultural mortgage-backed securities and long-term standby purchase commitment credit protection components of our business.<br>
slide6. U.S. Agricultural Balance Sheet 06 (1)<br>
slide7. (FCS Secondary Market GSE)
Agricultural Finance Line of Business
(Farm & Ranch and Corporate AgFinance) Farm Credit System (FCS)
(Cooperative GSE)
Four FCS Banks
69 Retail Agricultural Credit Associations Central to a Large Agricultural Mortgage Market 07 Agricultural
Mortgage Market {Farmers & Ranchers} Mortgage Financing Mortgage Financing $335 Billion AG BANKS
$61B NON-BANK LENDERS
$13B (2) Non-FCS Ag Lenders
Insurance Companies
Ag Banks
Non-Bank Lenders<br>
slide8. Securitization Program Update
Closed $299.4 million agricultural mortgage-backed securitization transaction on Oct. 14, 2021
Closed $301.1 million agricultural mortgage-backed securitization transaction on Aug. 11, 2022
Closed $283.6 million agricultural mortgage-backed securitization transaction on February 23, 2023
Exemplifies Farmer Mac’s core mission to lower costs for the end borrower and improve credit availability in rural America Growth Opportunities 8 Broaden Farmer Mac’s Market
Evaluating opportunities not currently being pursued by Farmer Mac
New lines of business
New products
Deepen Farmer Mac’s Market
Improving processes and operating practices
Customer interaction
Transaction processes
Existing loan features and pricing<br>
slide9. Farmer Mac’s Financial Strengths 09 (1) Tier 1 capital consists of retained earnings, paid-in capital, common stock, and qualifying preferred stock.
(2) Core earnings and net effective spread are non-GAAP measures. For more information on the use of these non-GAAP measures, please see page 03. (2) (1)<br>
slide10. Strong and Growing Equity Capital Base 10 Statutory Minimum Core Capital defined as total stockholders’ equity less accumulated other comprehensive income.<br>
slide11. Lines of Business 11 AS OF SEPTMEBER 30, 2023<br>
slide12. Agricultural Finance Loan Portfolio Diversification 12 AS OF SEPTEMBER 30, 2023 Agricultural Update
USDA’s Economic Research Service estimates $189.9 billion in net cash incomes in 2022, a significant increase from 2021 and 2020 incomes and a new record in both real and nominal terms.
Net cash income in 2023 is forecast to fall by 21% due to elevated input costs and moderating commodity prices. However, forecast 2023 levels are still well above the 10-year average for farm profitability. (3)<br>
slide13. Losses less likely even in default
Average portfolio LTV of 45% as of September 30, 2023
Land values need to decline >55% to generate material losses across Agricultural Finance mortgage loans portfolio
“Stress scenario” losses of 17% to 48%
1980s crisis saw land value declines of ~23% Farmer Mac Uses Proven, Rigorous Underwriting Industry-leading credit requirements
Total debt coverage ratio of at least 1.25x
LTVs average 40% to 45% on mortgages purchased
Minimum borrower net equity of 50% 13 Credits are less likely to default
Focus on repayment capacity through stressed inputs
Not a “lender of last resort”
Farm Credit Administration is our safety and soundness regulator (4)<br>
slide14. Credit Consistently Outperforms 14 Farmer Mac
Average 0.02% Farm Credit System
Average 0.09% Banks
Average 0.17% All Commercial Banks
Loans and Leases
Average 0.96% (8) (5) (6) (7) (8) (9) (10)<br>
slide15. Historical Credit Losses Agricultural Finance Mortgage Loans have historical cumulative losses of 0.10%, or less than 1bp per year
Cumulative Agricultural Finance Mortgage Loan losses of $38 million on $37 billion of cumulative Agricultural Finance Mortgage Loans historical business volume
Farmer Mac has not reported any credit losses to date in any products other than Agricultural Finance Mortgage Loans 15<br>
slide16. Farmer Mac Compared to Farm Credit Banks 16<br>
slide17. Liquidity – Investment Portfolio Farmer Mac maintains an investment portfolio to provide back-up source of liquidity in excess of regulatory requirements
Minimum of 90 days of liquidity required by regulation
$5.7 billion investment portfolio on September 30, 2023
Cash and high-quality investment securities
Conservative portfolio goals
Minimize exposure to market volatility
Preservation of capital
Ready access to cash
Monthly average of 293 days of liquidity during Q3 2023
Provided 297 days of liquidity as of September 30, 2023
Farmer Mac also has $1.5 billion line of credit with U.S. Treasury
Supports Farmer Mac’s guarantee obligations
Farmer Mac has not utilized this line of credit 17 Percentages may not add to 100 due to rounding (1)<br>
slide18. Interest Rate Risk Fund asset purchases with liabilities that have similar interest rate characteristics
Duration and convexity alignment
Coupon type
Reset frequency
Manage pre-payment risk on mortgages
Issue a portfolio of callable and bullet debt across spectrum of maturities to obtain the appropriate duration and convexity alignment
Can adjust effective asset and debt coupon and duration characteristics through the use of interest rate swaps or other derivatives
Perform regular stress testing and disclose a variety of sensitivity measures
Duration Gap
Market Value of Equity (MVE) Sensitivity
Net Effective Spread (NES) Sensitivity
Measure these sensitivities’ impact on various capital metrics 18<br>
slide19. Farmer Mac Funding Program Overview 19 Finance asset purchases with proceeds of debt issuances
31 approved dealers
Funding effectively locks in net spread
Discount notes issued daily
Regular rollover maturities include overnight, 30, 90, and 365 days
Reverse inquiry for special maturities
Medium-term notes issued periodically
Fixed rate and callable maturities up to 30 years
Floating rate notes based on a variety of indices
Reverse inquiry for special structures and maturities
Farmer Mac’s debt securities may carry privileges for certain holders
Farmer Mac debentures are eligible securities for the Federal Reserve’s Standing Repo Facility
Many Federal Regulated Entities: 20% capital risk weighting
Federal Reserve Banks: Collateral for advances and discounts
SEC: Exempt from registration requirements under the 1933 Act
National Association of Insurance Commissioners (NAIC): # 1 Designation
National Credit Union Administration (NCUA): Investment for federal credit unions
Investment Company Act of 1940: Classified as a “Government Security”<br>
slide20. Farmer Mac Discount Note Program 20 To see daily discount note offerings, visit our Bloomberg page FAMC <GO><br>
slide21. Farmer Mac Medium-Term Note Program 21 To see daily medium-term note postings and auctions, visit our Bloomberg page FAMC <GO> *Auctions may occur on non-specified days as needed<br>
slide22. Farmer Mac Debt Outstanding 22<br>
slide23. Reconciliation of Net Income to Core Earnings 23 Issuance costs on retirement of preferred stock relates to the write-off of deferred issuance costs as a result of the retirement of Series A Preferred Stock and Series B Preferred Stock.<br>
slide24. Resources Footnote 1: USDA Economic Research Service year end 2022 balance sheet (https://data.ers.usda.gov/reports.aspx?ID=17835). Farm Sector Assets and Farm Sector Debt values are values for 2022 from USDA Economic Research Service.
Footnote 2: Eligible ag real estate mortgage market structure shown includes the forecast for outstanding unpaid principal balance of first lien ag mortgage assets for December 31, 2022.
Footnote 3: USDA, Economic Research Service U.S. and State-Level Farm Income and Wealth Statistic (https://www.ers.usda.gov/data-products/farm-income-and-wealth-statistics/data-files-us-and-state-level-farm-income-and-wealth-statistics/).
Footnote 4: USDA, National Agricultural Statistics Service (as of August 2015). Historic values are not necessarily predictive of future results or outcomes.
Footnote 5: FDIC Call Report Data & Farm Credit Funding Corp Annual Information Statements – Non-accrual real estate loans and accruing loans that are 90 days or more past due made by commercial and Farm Credit System banks (as of December 2022).
Footnote 6: Delinquencies reflect Farmer Mac’s Agricultural Finance mortgage loan portfolio that are 90 days or more past due, in foreclosure, or in bankruptcy with at least one missed payment, excluding loans performing under either their original loan terms or a court-approved bankruptcy plan.
Footnote 7: Kansas City Federal Reserve Agriculture Finance Databook (https://www.kansascityfed.org/agriculture/agfinance-updates/).
Footnote 8: Banks’ charge-off rate is a percentage of agricultural loan assets.
Footnote 9: Farm Credit Banks Funding Corporation Annual Information Statements; Farm Credit System’s charge-off rate is the percentage of total loans and guarantees.
Footnote 10: Farmer Mac’s charge-off rate is the percentage of total loans and guarantees.
Footnote 11: USDA, Economic Research Service Global Drivers of Agricultural Demand and Supply, September 2014.
Footnote 12: Food and Agriculture Organization of the United Nations, “World Agriculture Towards 2030/2050,” June 2012. 24<br>
slide25. Debt Investor Relations Contacts 25 Robert Owens Senior Director - Fixed Income Strategy rowens@farmermac.com Office: 202.872.5561 Cell: 202.557.6842
Diane Asuncion Manager - Fixed Income Strategy dasuncion@farmermac.com Office: 202.559.6532 Cell: 202.868.7437
Visit our Bloomberg page FAMC <GO>
https://www.farmermac.com/investors/debt-securities/<br>