04
Which dashboard would have the biggest impact at your firm? The Slido app must be installed on every computer you’re presenting from Do not edit
How to change the design<br>
05
Why Dashboards Matter in 2026<br>
06
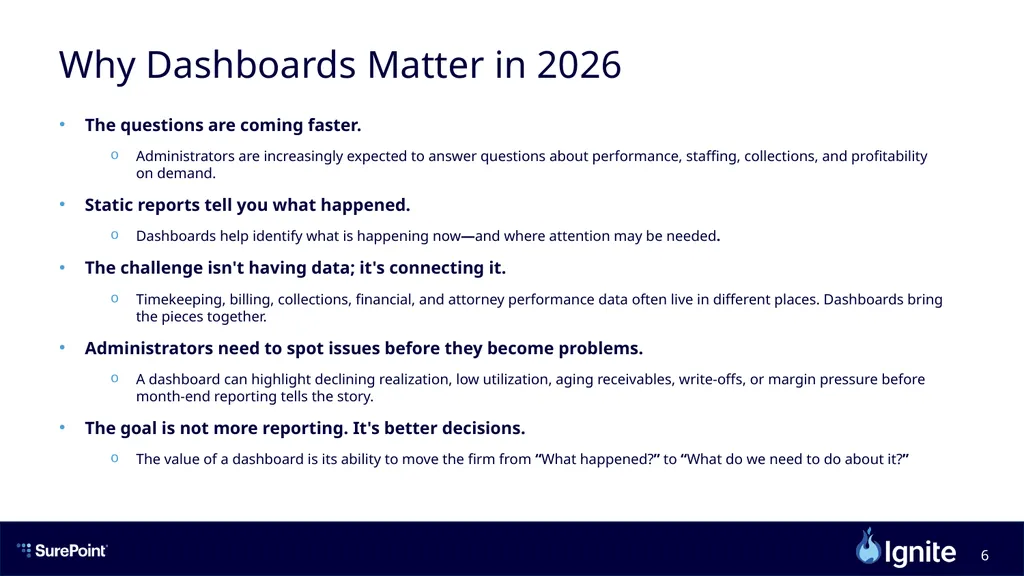
Why Dashboards Matter in 2026 The questions are coming faster.
Administrators are increasingly expected to answer questions about performance, staffing, collections, and profitability on demand.
Static reports tell you what happened.
Dashboards help identify what is happening now—and where attention may be needed.
The challenge isn't having data; it's connecting it.
Timekeeping, billing, collections, financial, and attorney performance data often live in different places. Dashboards bring the pieces together.
Administrators need to spot issues before they become problems.
A dashboard can highlight declining realization, low utilization, aging receivables, write-offs, or margin pressure before month-end reporting tells the story.
The goal is not more reporting. It's better decisions.
The value of a dashboard is its ability to move the firm from “What happened?” to “What do we need to do about it?”<br>
08
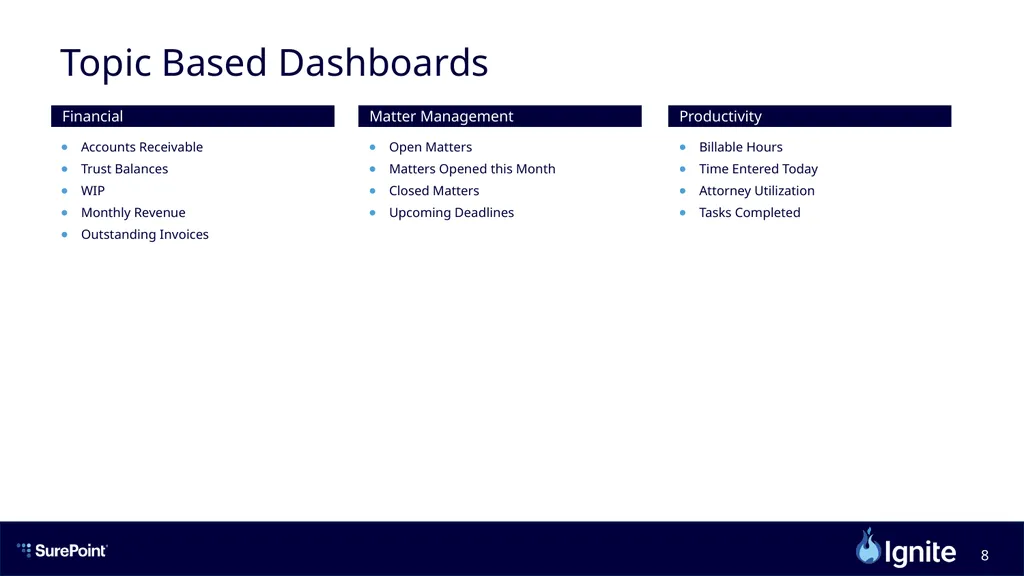
Topic Based Dashboards Accounts Receivable
Trust Balances
WIP
Monthly Revenue
Outstanding Invoices Open Matters
Matters Opened this Month
Closed Matters
Upcoming Deadlines Billable Hours
Time Entered Today
Attorney Utilization
Tasks Completed Financial Matter Management Productivity<br>
09
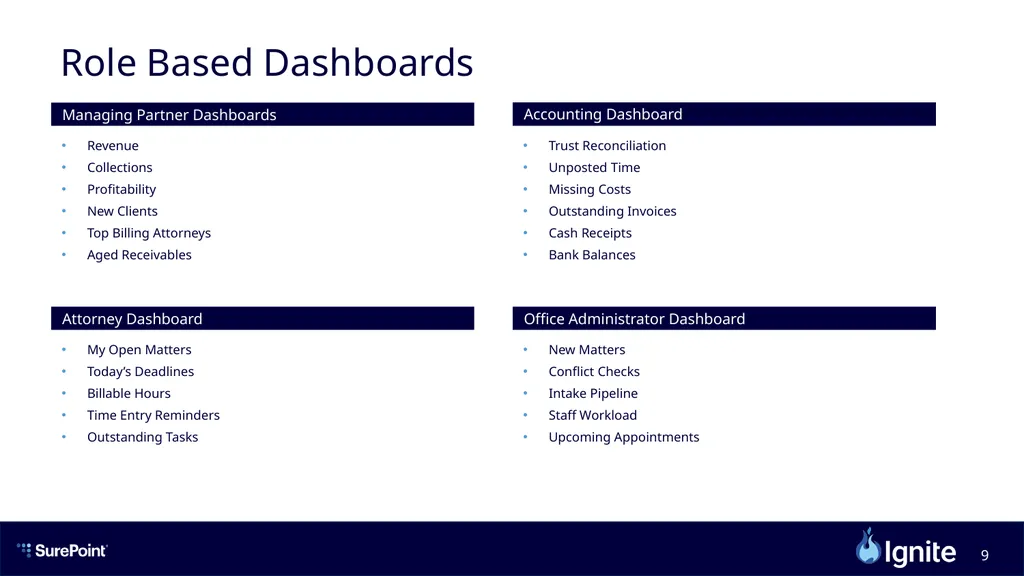
Managing Partner Dashboards Revenue
Collections
Profitability
New Clients
Top Billing Attorneys
Aged Receivables Accounting Dashboard Trust Reconciliation
Unposted Time
Missing Costs
Outstanding Invoices
Cash Receipts
Bank Balances Attorney Dashboard My Open Matters
Today’s Deadlines
Billable Hours
Time Entry Reminders
Outstanding Tasks Office Administrator Dashboard New Matters
Conflict Checks
Intake Pipeline
Staff Workload
Upcoming Appointments Role Based Dashboards<br>
10
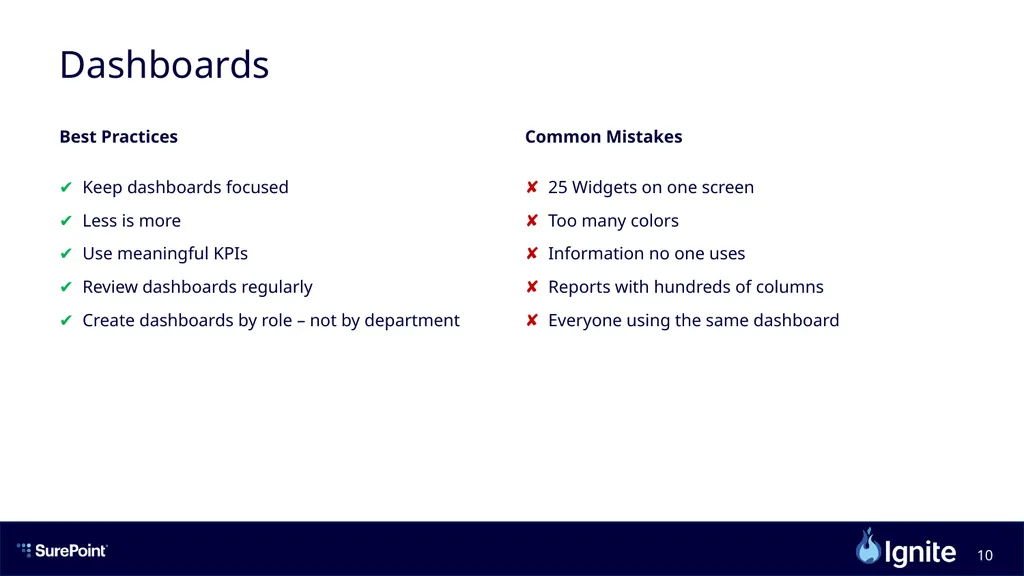
Dashboards Best Practices
✔ Keep dashboards focused
✔ Less is more
✔ Use meaningful KPIs
✔ Review dashboards regularly
✔ Create dashboards by role – not by department Common Mistakes
✘ 25 Widgets on one screen
✘ Too many colors
✘ Information no one uses
✘ Reports with hundreds of columns
✘ Everyone using the same dashboard<br>
12
Reporting Beyond the Standard<br>
13
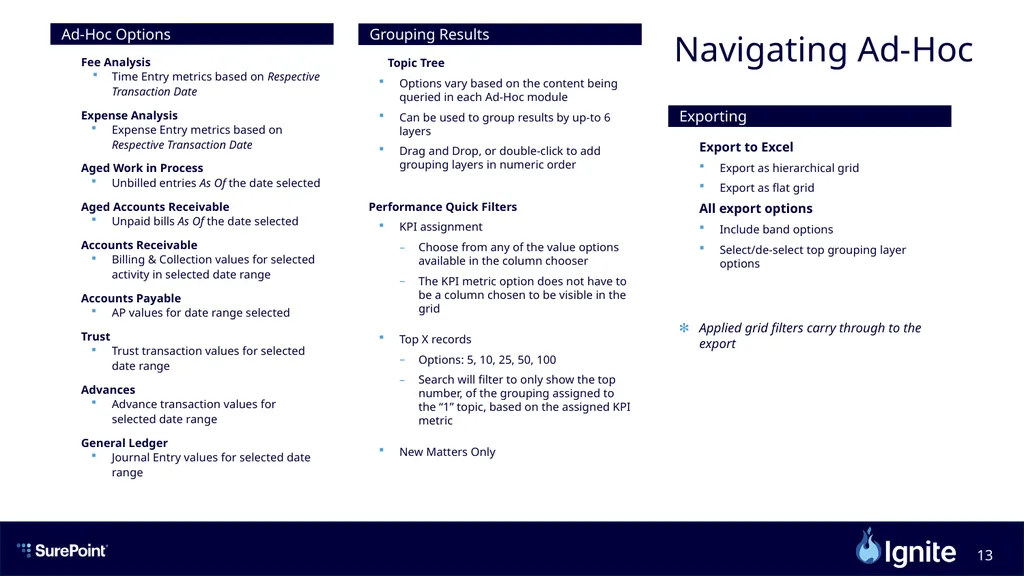
Navigating Ad-Hoc Fee Analysis
Time Entry metrics based on Respective Transaction Date
Expense Analysis
Expense Entry metrics based on Respective Transaction Date
Aged Work in Process
Unbilled entries As Of the date selected
Aged Accounts Receivable
Unpaid bills As Of the date selected
Accounts Receivable
Billing & Collection values for selected activity in selected date range
Accounts Payable
AP values for date range selected
Trust
Trust transaction values for selected date range
Advances
Advance transaction values for selected date range
General Ledger
Journal Entry values for selected date range Topic Tree
Options vary based on the content being queried in each Ad-Hoc module
Can be used to group results by up-to 6 layers
Drag and Drop, or double-click to add grouping layers in numeric order
Performance Quick Filters
KPI assignment
Choose from any of the value options available in the column chooser
The KPI metric option does not have to be a column chosen to be visible in the grid
Top X records
Options: 5, 10, 25, 50, 100
Search will filter to only show the top number, of the grouping assigned to the “1” topic, based on the assigned KPI metric
New Matters Only Export to Excel
Export as hierarchical grid
Export as flat grid
All export options
Include band options
Select/de-select top grouping layer options
Applied grid filters carry through to the export Ad-Hoc Options Grouping Results Exporting<br>
14
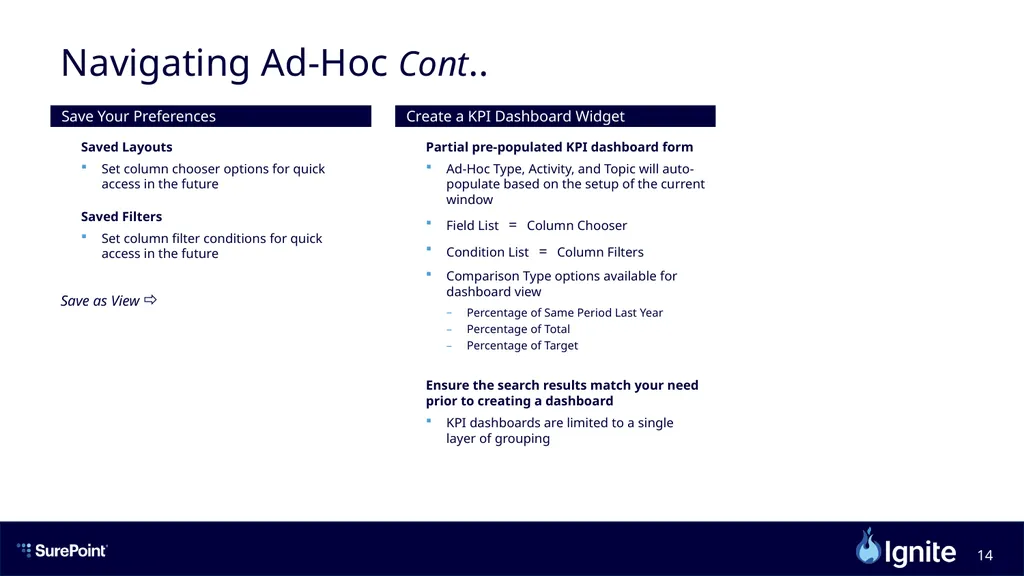
Navigating Ad-Hoc Cont.. Saved Layouts
Set column chooser options for quick access in the future
Saved Filters
Set column filter conditions for quick access in the future
Save as View Partial pre-populated KPI dashboard form
Ad-Hoc Type, Activity, and Topic will auto-populate based on the setup of the current window
Field List = Column Chooser
Condition List = Column Filters
Comparison Type options available for dashboard view
Percentage of Same Period Last Year
Percentage of Total
Percentage of Target
Ensure the search results match your need prior to creating a dashboard
KPI dashboards are limited to a single layer of grouping Save Your Preferences Create a KPI Dashboard Widget<br>
16
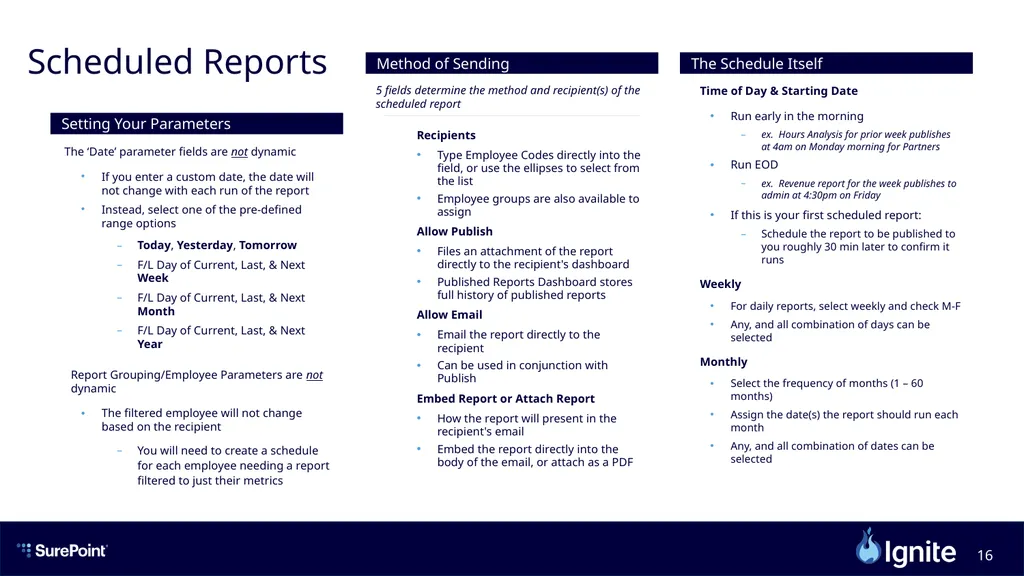
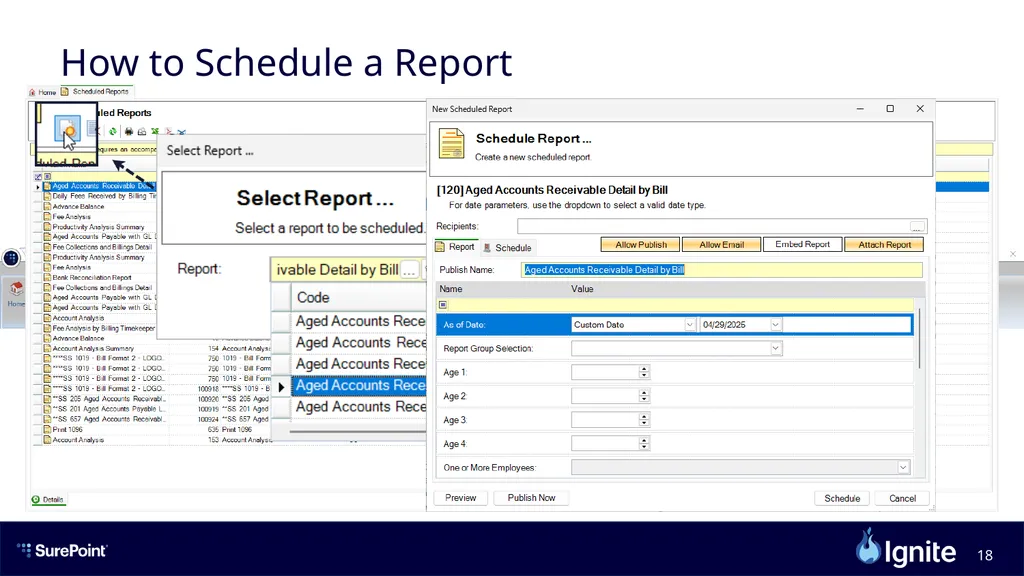
Scheduled Reports The ‘Date’ parameter fields are not dynamic
If you enter a custom date, the date will not change with each run of the report
Instead, select one of the pre-defined range options
Today, Yesterday, Tomorrow
F/L Day of Current, Last, & Next Week
F/L Day of Current, Last, & Next Month
F/L Day of Current, Last, & Next Year
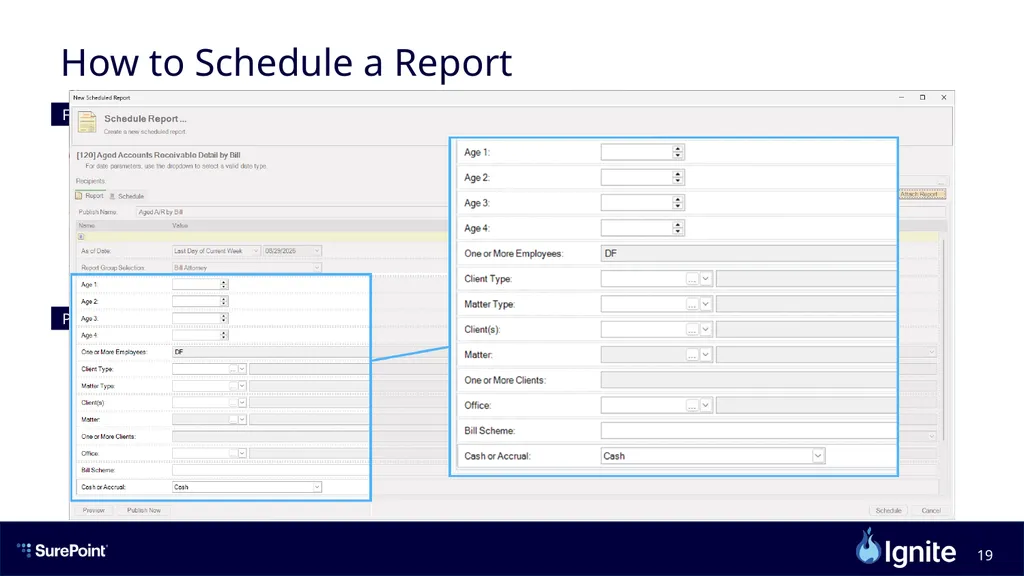
Report Grouping/Employee Parameters are not dynamic
The filtered employee will not change based on the recipient
You will need to create a schedule for each employee needing a report filtered to just their metrics 5 fields determine the method and recipient(s) of the scheduled report
Recipients
Type Employee Codes directly into the field, or use the ellipses to select from the list
Employee groups are also available to assign
Allow Publish
Files an attachment of the report directly to the recipient's dashboard
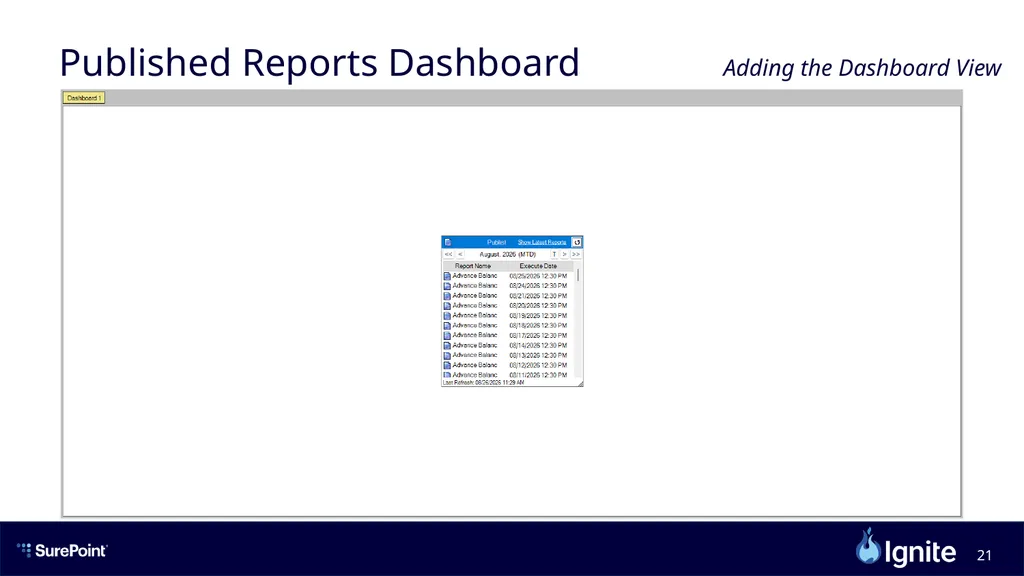
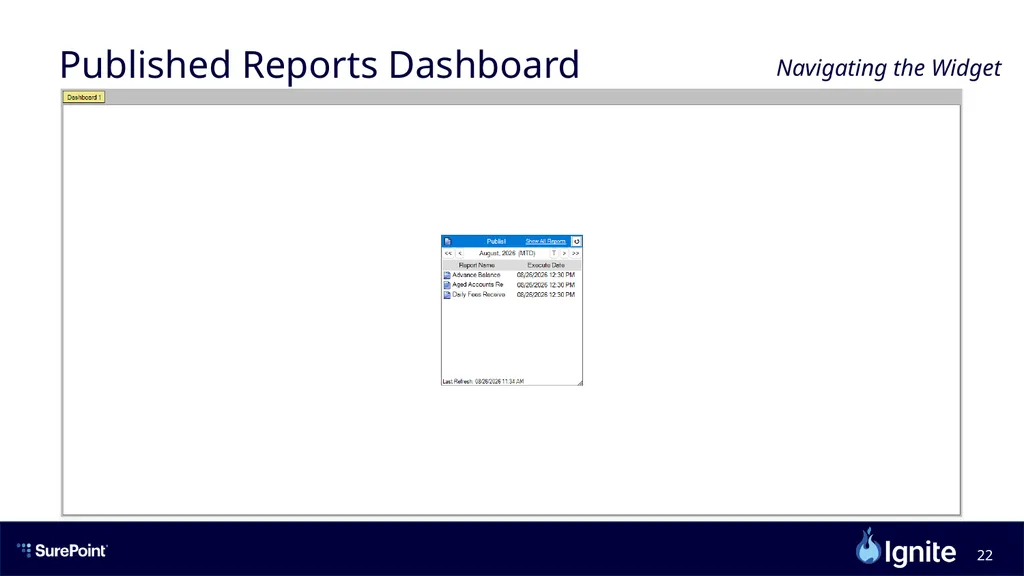
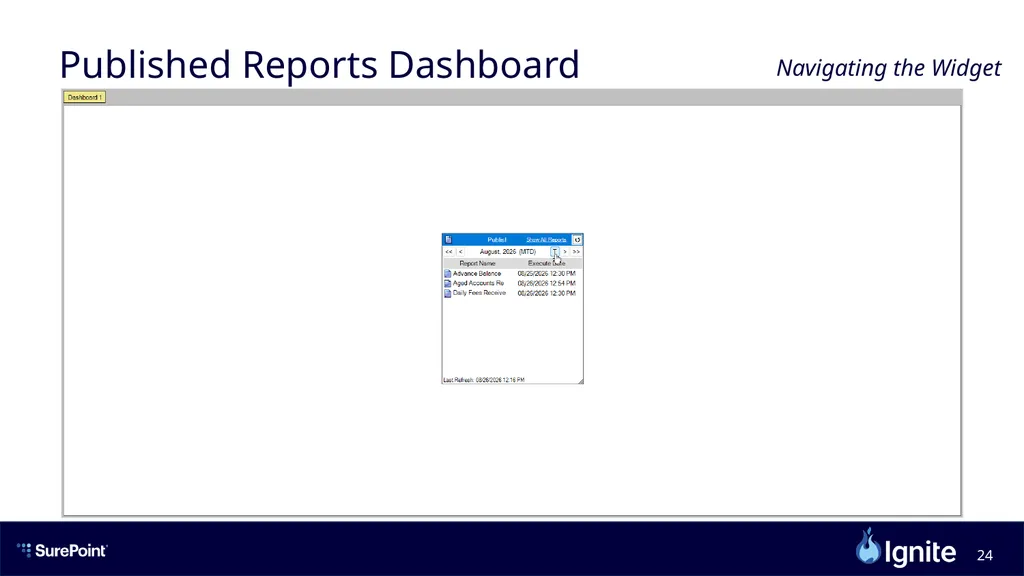
Published Reports Dashboard stores full history of published reports
Allow Email
Email the report directly to the recipient
Can be used in conjunction with Publish
Embed Report or Attach Report
How the report will present in the recipient's email
Embed the report directly into the body of the email, or attach as a PDF Time of Day & Starting Date
Run early in the morning
ex. Hours Analysis for prior week publishes at 4am on Monday morning for Partners
Run EOD
ex. Revenue report for the week publishes to admin at 4:30pm on Friday
If this is your first scheduled report:
Schedule the report to be published to you roughly 30 min later to confirm it runs
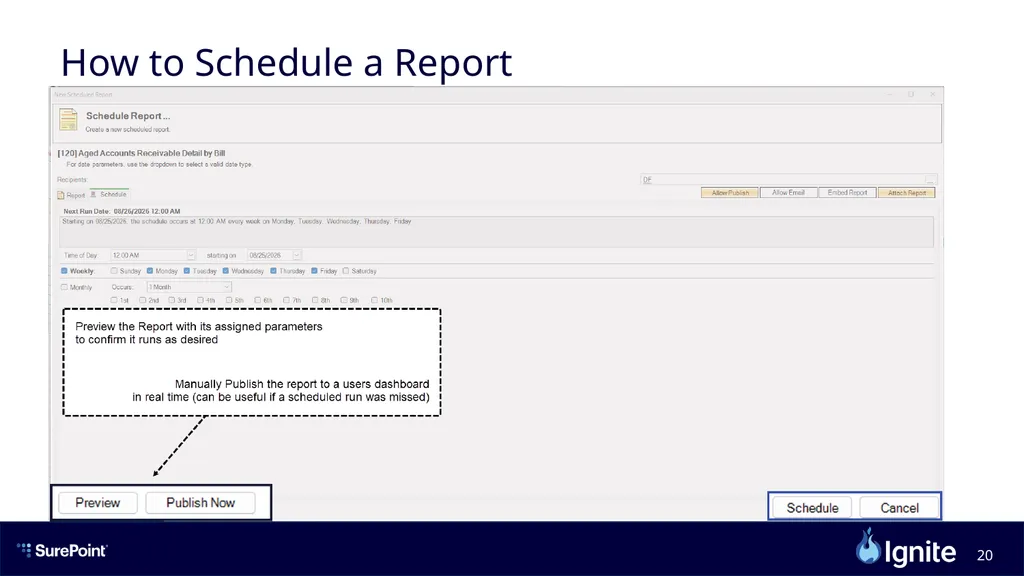
Weekly
For daily reports, select weekly and check M-F
Any, and all combination of days can be selected
Monthly
Select the frequency of months (1 – 60 months)
Assign the date(s) the report should run each month
Any, and all combination of dates can be selected Setting Your Parameters Method of Sending The Schedule Itself<br>
17
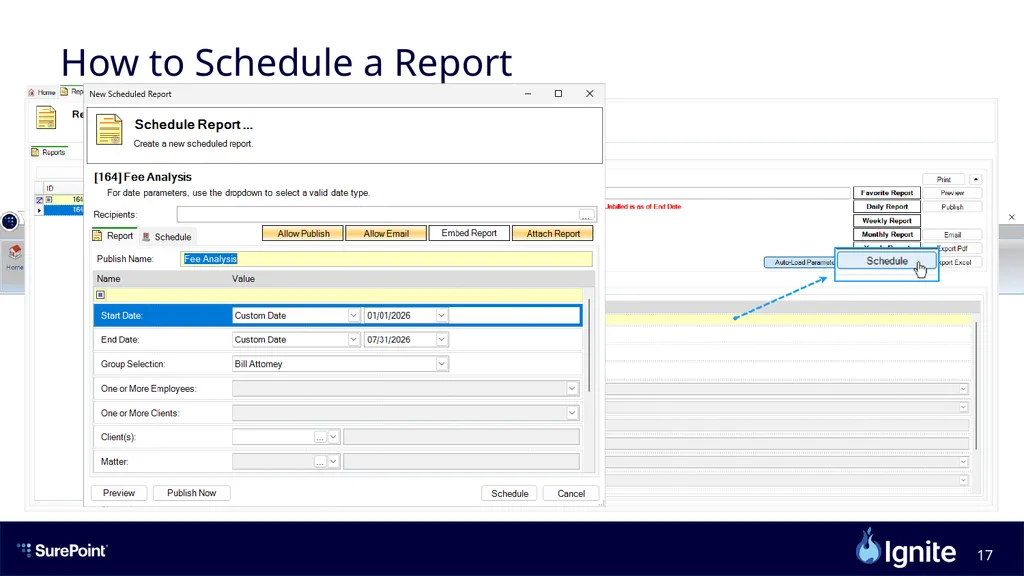
From the ‘Reports’ Module How to Schedule a Report<br>
18
From the ‘Reports’ Module From Administration How to Schedule a Report<br>
19
From the ‘Reports’ Module From Administration Parameters How to Schedule a Report<br>
20
From the ‘Reports’ Module From Administration Parameters Schedule How to Schedule a Report<br>
21
Published Reports Dashboard Adding the Dashboard View 1 2 3<br>
22
Published Reports Dashboard Navigating the Widget<br>
23
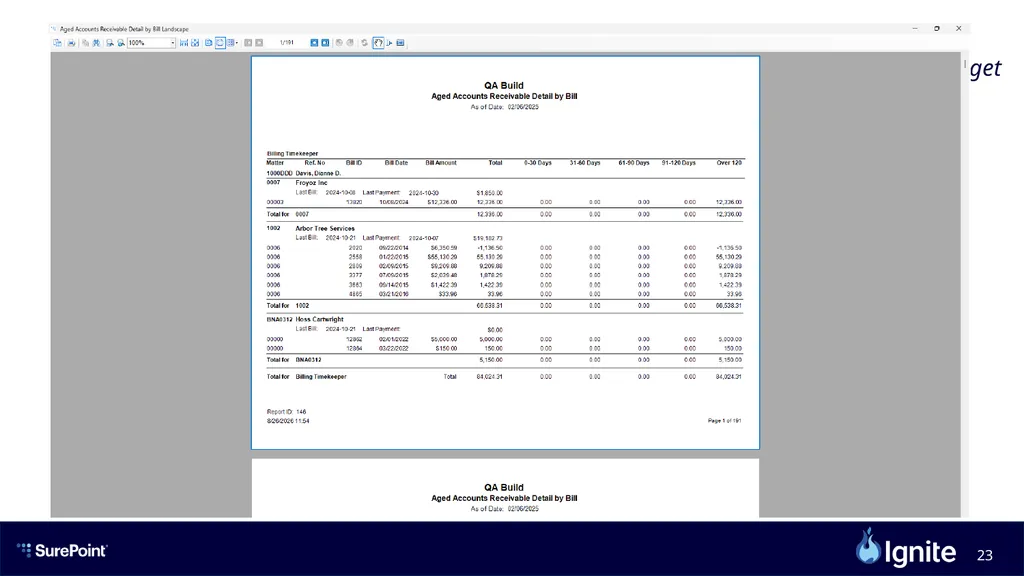
Published Reports Dashboard Navigating the Widget<br>
24
Published Reports Dashboard Navigating the Widget<br>
26
Headline Like This Bullets Two Column Bullets Two Column<br>
27
Headline Like This Subhead Subhead Subhead<br>
28
Subhead Subhead Subhead Subhead Headline Like This<br>
29
Headline Like This Bullets Full Page<br>
30
Divider Slide Headline Like This<br>