
Disappearing demographic dividend: Growth















Description: Disappearing demographic dividend: Growth sustainability in China 16 Xiaomin Gai UCSB Shandong University In the period 19782015, China realized a real growth rate of gross national income (GNI) of 9.6 per cent the fastest speed
Related Topics
Download Presentation
"Disappearing demographic dividend: Growth" is the property of its rightful owner. Permission is granted to download and print the materials on this website for personal, non-commercial use only, and to display it on your personal computer provided you do not modify the materials and that you retain all copyright notices contained in the materials. By downloading content from our website, you accept the terms of this agreement.
Presentation Transcript
slide1. Disappearing demographic dividend: Growth sustainability in China 16 Xiaomin Gai
UCSB & Shandong University<br>
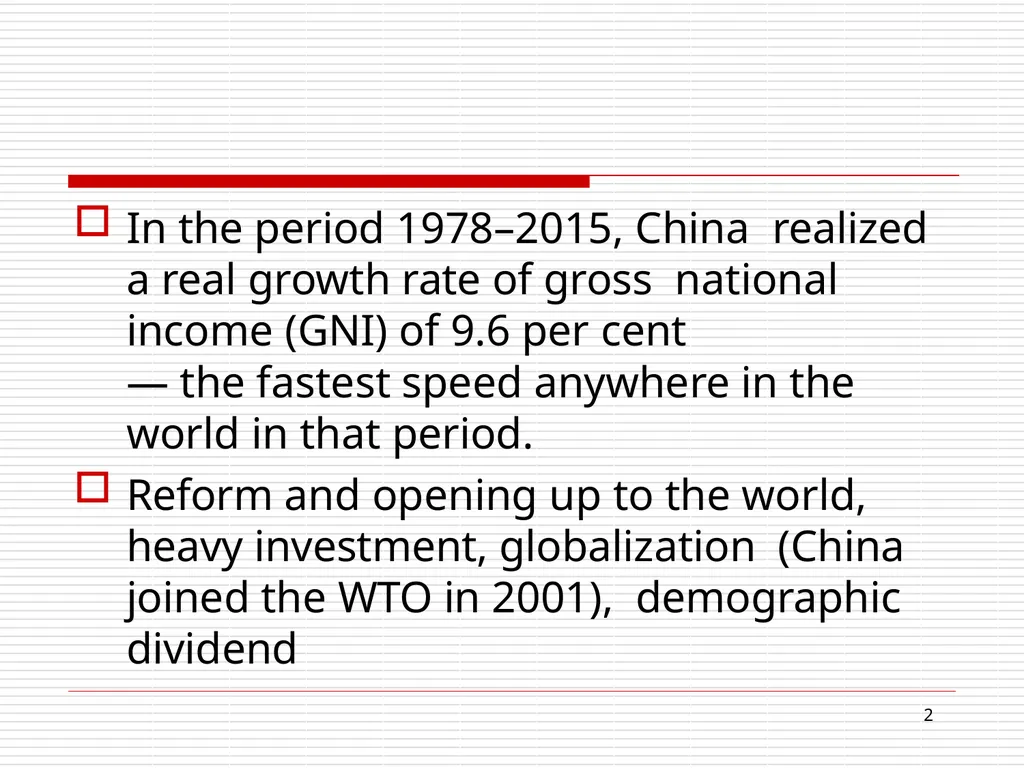
slide2. In the period 1978–2015, China realized a real growth rate of gross national income (GNI) of 9.6 per cent
— the fastest speed anywhere in the
world in that period.
Reform and opening up to the world, heavy investment, globalization (China joined the WTO in 2001), demographic dividend 16<br>
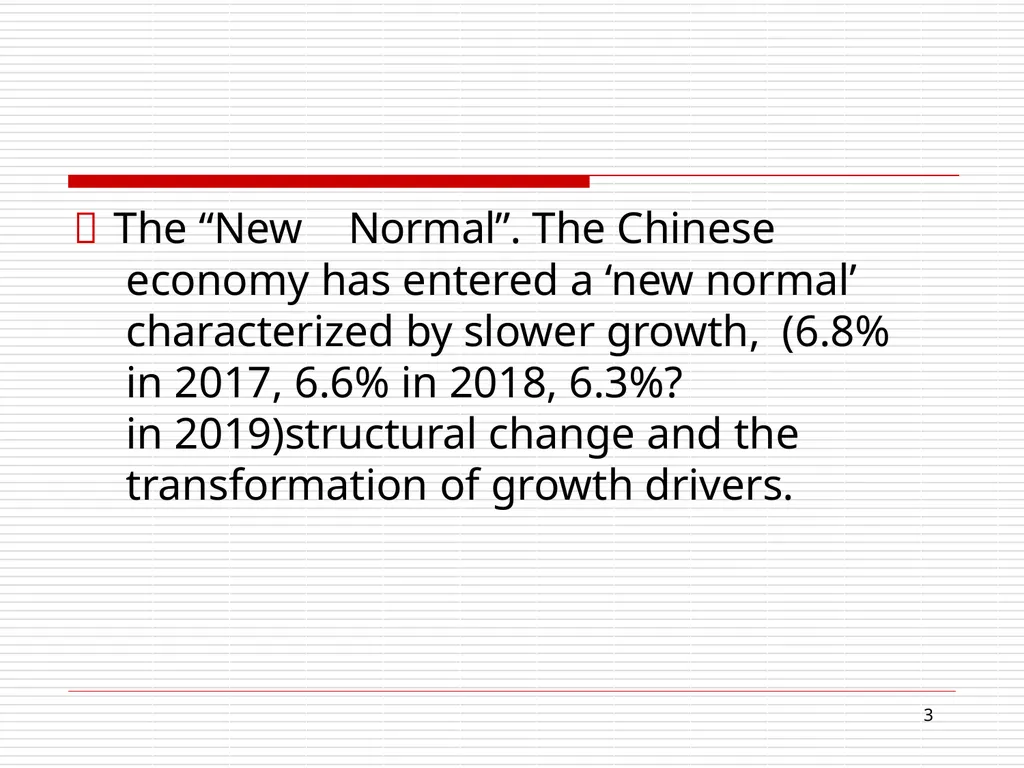
slide3. The “New Normal”. The Chinese
economy has entered a ‘new normal’ characterized by slower growth, (6.8% in 2017, 6.6% in 2018, 6.3%?
in 2019)structural change and the transformation of growth drivers. 16<br>
slide4. Population aging, Labor costs have
been increasing
US-China trade war
Made in China? 16<br>
slide5. Can China avoid
the middle income trap? 16<br>
slide6. A significant portion of the unprecedented economic growth in China in the last few decades can be attributed to the demographic dividend. 16<br>
slide7. Two mechanisms
First is the decline of dependency ratio (the ratio of the dependent population to the working age population). It helps to maintain a high savings rate, which is the condition for capital formation. 16<br>
slide8. Secondly, the fast growth in the working-age population leads to a higher labor supply, and an adequate supply of labor prevents return on capital from diminishing, which allows heavy investment to be the main source of GDP growth. (low and constant wages) 16<br>
slide9. To better understand this demographic dividend, we need to look at China’s demographic transition. 16<br>
slide10. The process -from low through high to low population growth-is called the the demographic transition.
While the demographic transition took about a century in Europe, it has proceeded more rapidly in other countries since World War II. 16<br>
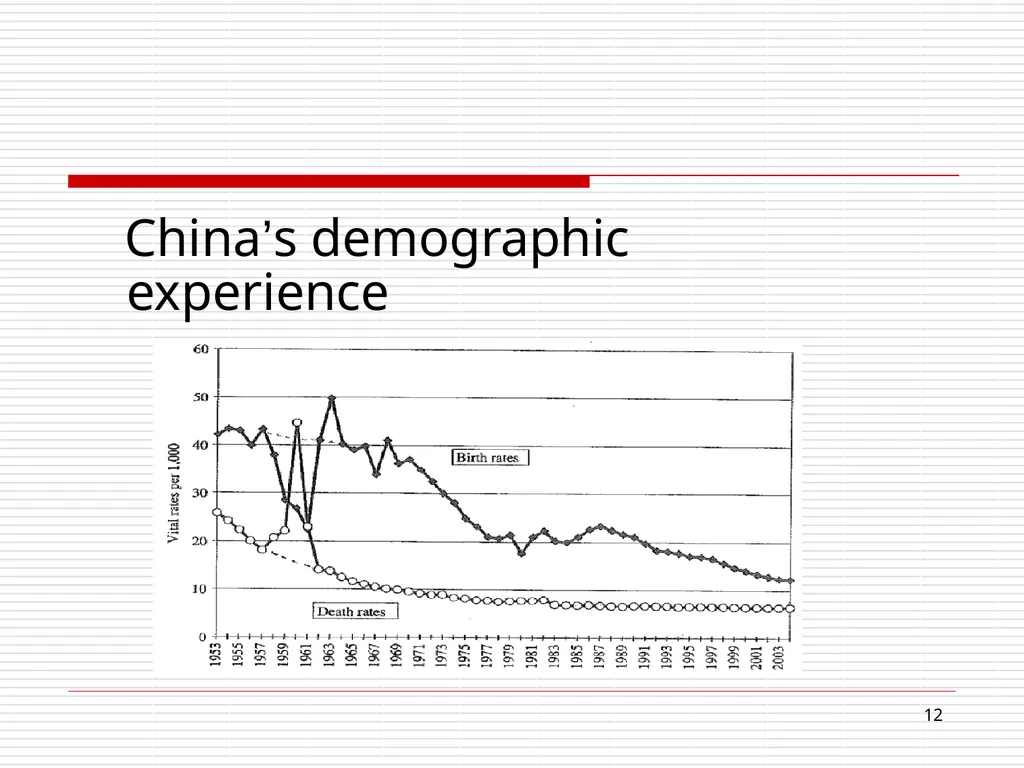
slide11. China has made its demographic transition under unusual circumstances and in less than 20 years. 16<br>
slide12. China’s demographic experience 16<br>
slide13. Annual population growth rate: 0.53% in 2017, dropped to 0.38%in 2018, world average is 1.16% 16<br>
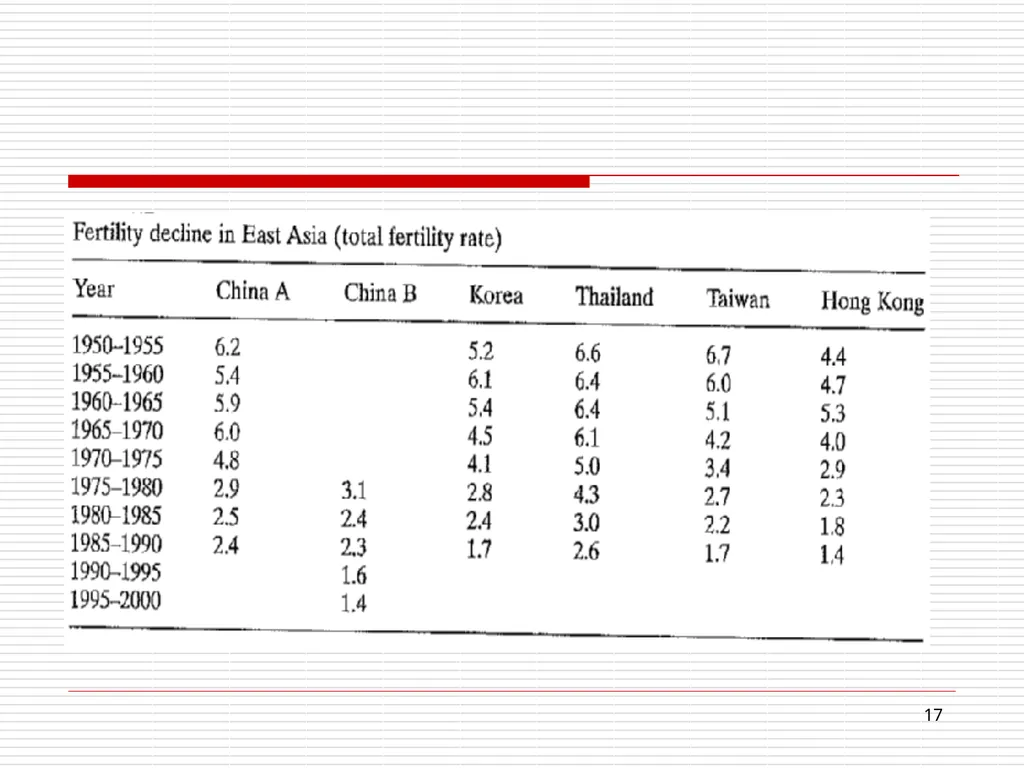
slide14. Fertility rate 16 Total fertility rates (TFR): a measure of the total number of children a typical woman bears during her lifetime.
China’s economic growth during the period of reform has been accompanied by a rapid decline in the fertility rate.<br>
slide15. According to the United Nations, China’s total fertility rate dropped from 2.5–3 in the late 1970s and early 1980s to a replacement level of 2 in the first half of the 1990s and has remained constant at about 1.5 since the second half of the 1990s. 16<br>
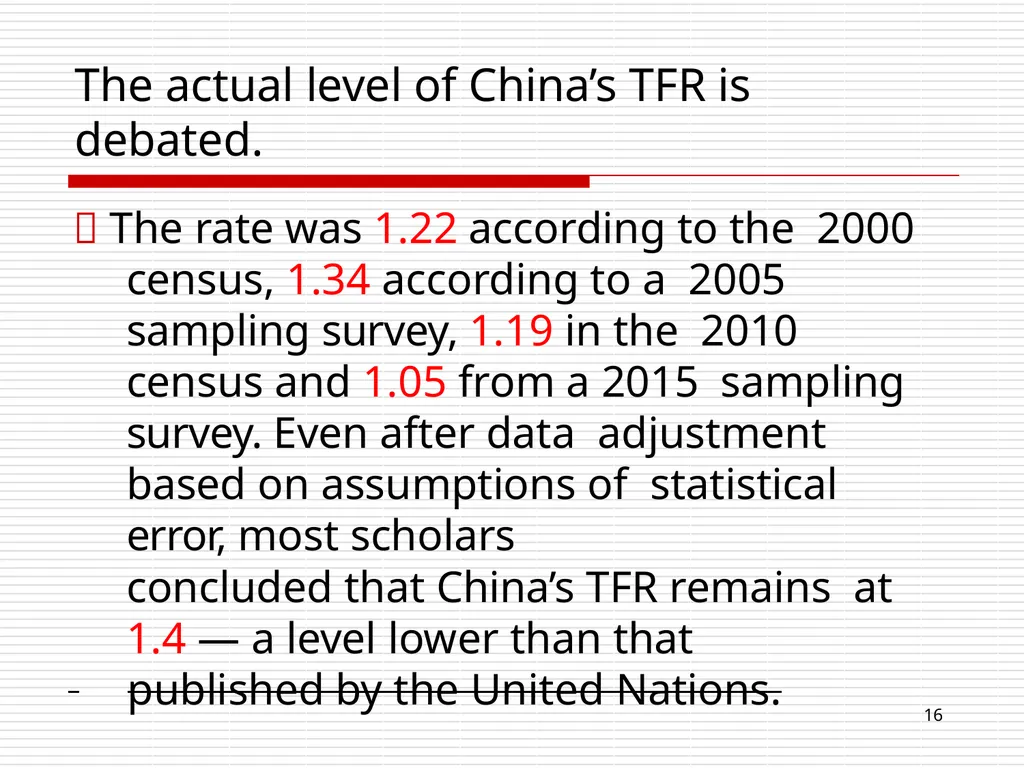
slide16. The actual level of China’s TFR is debated. 16 The rate was 1.22 according to the 2000 census, 1.34 according to a 2005 sampling survey, 1.19 in the 2010 census and 1.05 from a 2015 sampling survey. Even after data adjustment based on assumptions of statistical error, most scholars
concluded that China’s TFR remains at 1.4 — a level lower than that
published by the United Nations.<br>
slide17. 16<br>
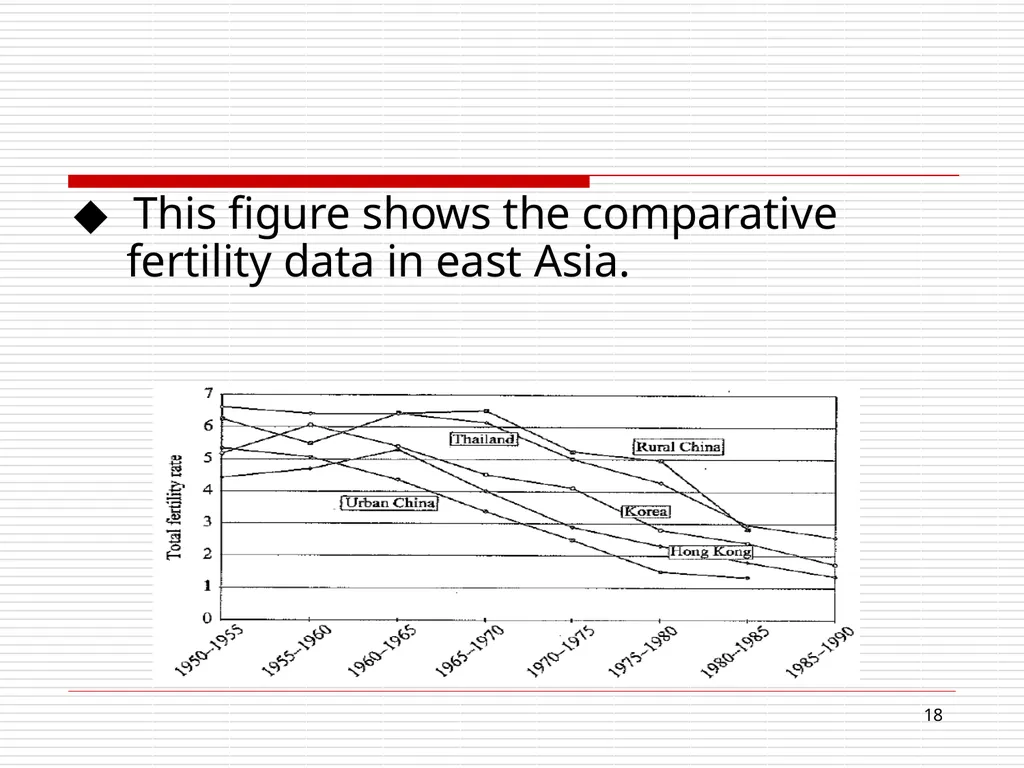
slide18. This figure shows the comparative
fertility data in east Asia. 16<br>
slide19. —Actually these data showed that the Chinese experience is less extraordinary than one might suppose when placed in the East Asian context.
—The big gap between urban and rural society is particularly salient in China 16<br>
slide20. Before it eventually brought about population ageing , the rapid demographic transition had helped form a population that was characterized by a rapid increase in the working-age population and a decrease in the dependency. This is what economists call the ‘demographic dividend’. 16<br>
slide21. Why TFR dropped so rapidly? 16 Economic and social development
reasons
In China, government policy plays an important role in this process, esp. the One-Child Policy.<br>
slide22. One-child policy 16 Shortly after China’s first modern census in 1953 (594 million), the government initiated family planning
Abandoned in the late1950s<br>
slide23. Chinese government launched its first all-out family planning initiative in 1971.The policy lasted through 1978. 晚、稀、少Wan-xi-shao, later marriages, longer spacing between children, and fewer children in total.
—Total fertility rates were cut in half, from 5.8 in 1970 to 2.7 in 1978.
Through 1979 the probability of a couple having a second child, given that they had already given birth to a first child, was 95%. “ two child, but wait” policy. 16<br>
slide24. “Baby boomers” reached marriage age, Policy tightened. In September 1980, the government formally adopted the “one-child policy” and a target population of 1.2billion in the year 2000
“One-and -a-Half-Child Policy” after 1984. 16<br>
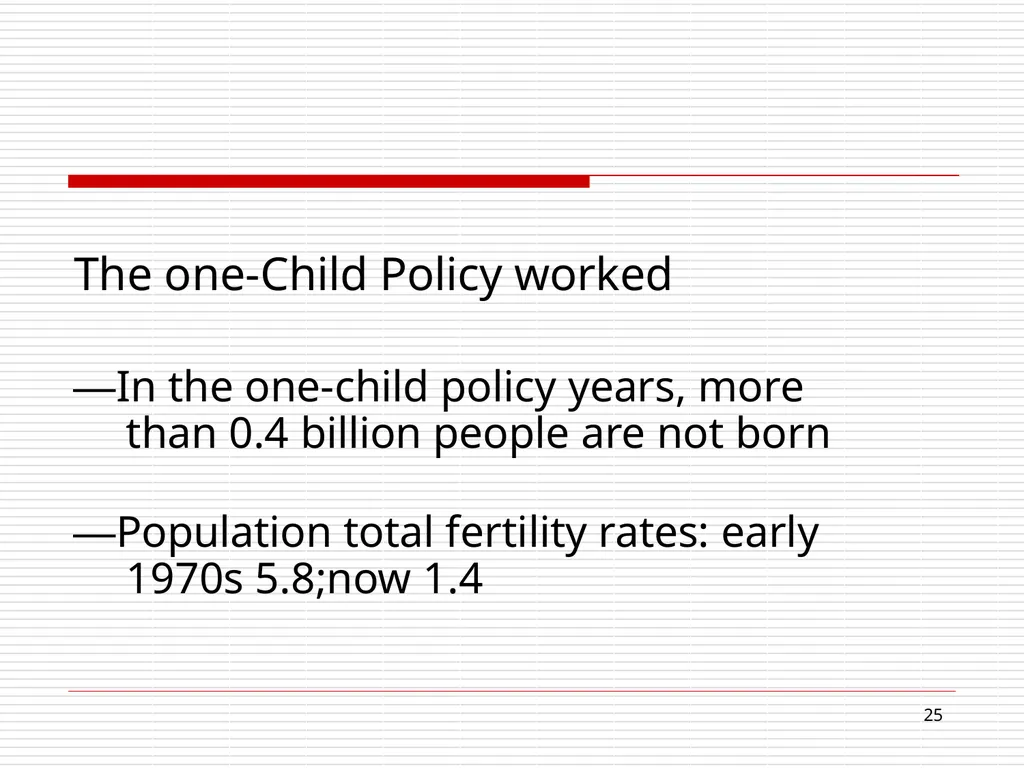
slide25. The one-Child Policy worked 16 —In the one-child policy years, more
than 0.4 billion people are not born
—Population total fertility rates: early
1970s 5.8;now 1.4<br>
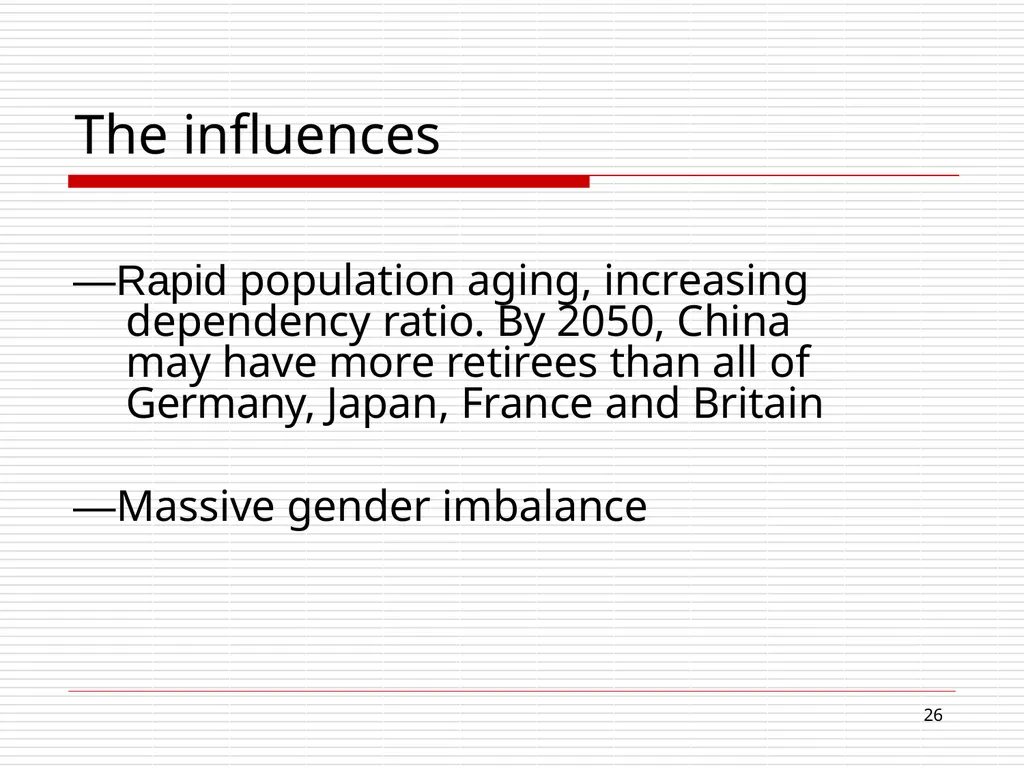
slide26. The influences 16 —Rapid population aging, increasing dependency ratio. By 2050, China may have more retirees than all of Germany, Japan, France and Britain
—Massive gender imbalance<br>
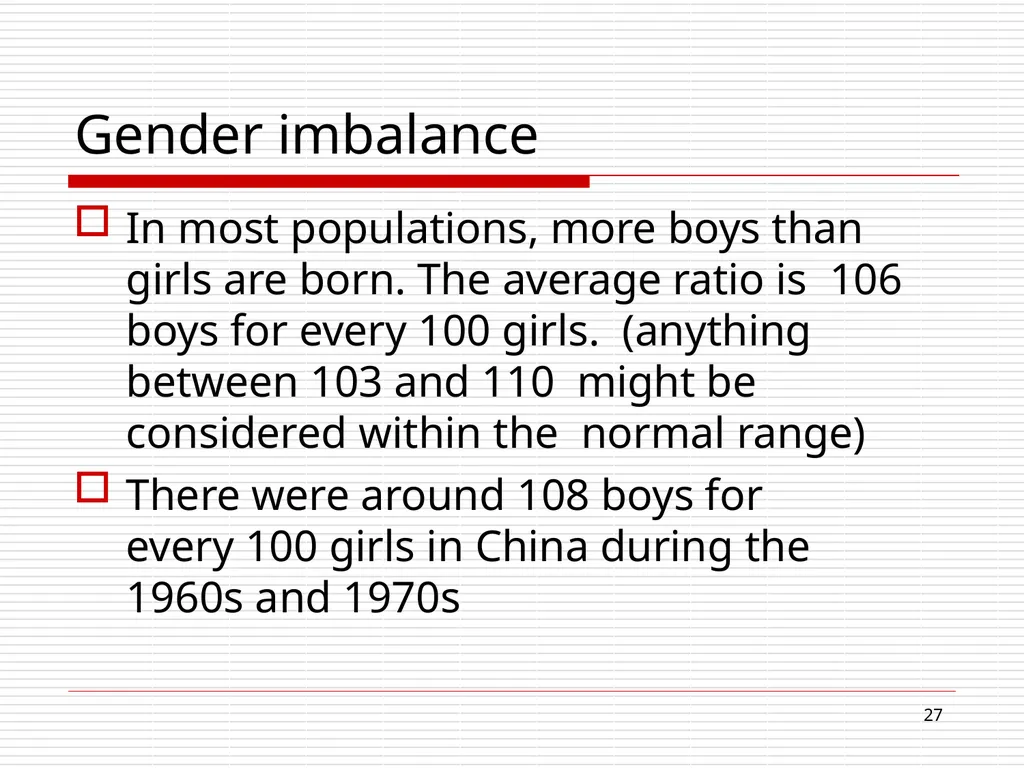
slide27. Gender imbalance 16 In most populations, more boys than girls are born. The average ratio is 106 boys for every 100 girls. (anything between 103 and 110 might be considered within the normal range)
There were around 108 boys for every 100 girls in China during the 1960s and 1970s<br>
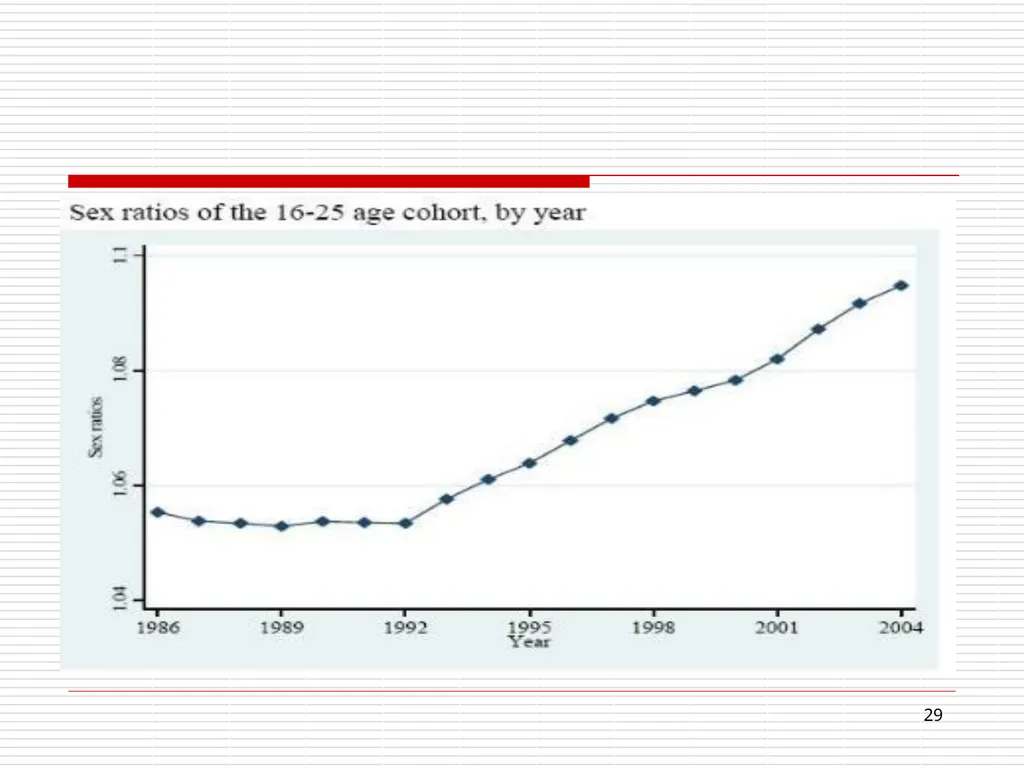
slide28. Since the early 1980s, the sex ratio has arisen steadily and significantly. In the 2000 census, the relative boys per girls in the 0-4 age group was 120.8 16<br>
slide29. 16<br>
slide30. Missing girls?
Many baby girls are simply unregistered with the authorities, and not reported to census takers either.
Sex-selective abortion 16<br>
slide31. It has been changing in the past 10 years, but there are still 30million more men than women in China.(40 million in 2006)
Social anxiety or even conflict
Housing market? 16<br>
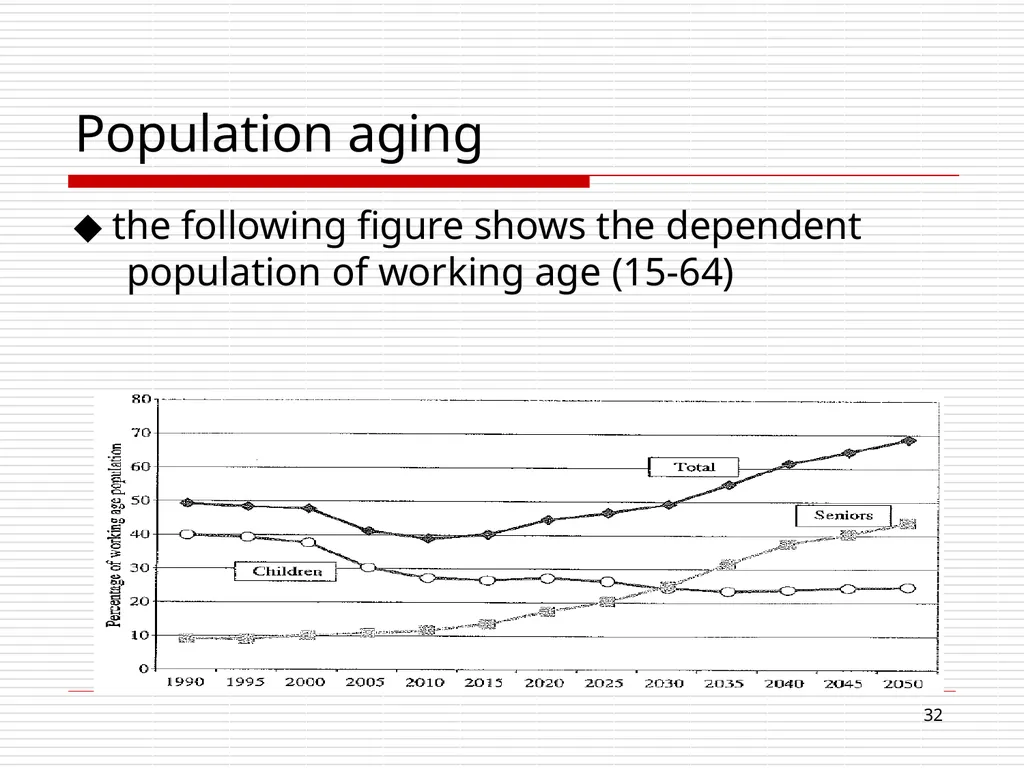
slide32. Population aging the following figure shows the dependent
population of working age (15-64) 16<br>
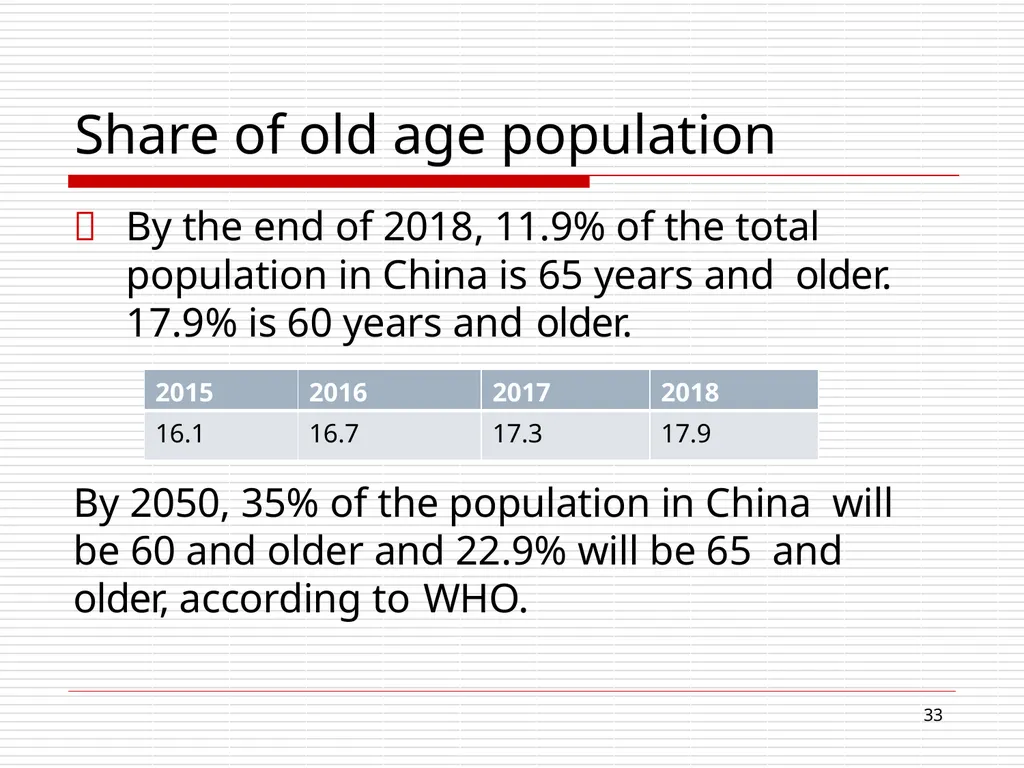
slide33. Share of old age population 16 By the end of 2018, 11.9% of the total population in China is 65 years and older. 17.9% is 60 years and older. By 2050, 35% of the population in China will be 60 and older and 22.9% will be 65 and older, according to WHO.<br>
slide34. Actually China’s problem is not unique. (low fertility rate, population aging)
But it is also unique because the timing is bad. China is becoming old rapidly before it’s becoming rich. 16<br>
slide35. The impact of rapid decline in fertility is also amplified by the mandatory retirement of the oldest baby boomers. 16 Financial problem: how to support the old?<br>
slide36. 16<br>
slide37. 16<br>
slide38. The arguments of one child policy: is it necessary to carry out one child policy?
—the fertility rate is already declining
before one-child policy
— If there is no one child policy, per capita GDP growth rate would decrease from 7.7 to 7(during 1980 to 1992) 16<br>
slide39. The one Child policy forced China through the demographic transition at an accelerated pace and created an exceptional demographic window of opportunity for growth. 16<br>
slide40. A favorable population structure helped China create the necessary conditions for high potential growth.(high savings rate, sufficient supply of labor, rapid improvement of human capital and radical resource reallocation through labor mobility) 16<br>
slide41. But the reversal of demographic
trends means that China’s traditional growth model will become unsustainable. Traditional sources of growth may be exhausted. 16<br>
slide42. At current fertility rates, the contribution of the demographic dividend to growth will be close to zero soon. Demography will eventually impose a burden, rather than a boost, to growth. 16<br>
slide43. The negative growth in the working- age population will lead to China’s labor shortage, and weaken the
comparative advantage of China’s
industry. 16<br>
slide44. The rapid increase in the capital– labor ratio has resulted in diminishing returns to capital. lower profit rate
The ageing of the rural population will
retard the urbanization 16<br>
slide45. Disappearing demographic dividend 16 Labor costs increasing, comparative advantages in labor-intensive industries is diminishing gradually.<br>
slide46. China is aware of the problems. But what can be done?
Automation? Immigrant? 16<br>
slide47. Possible measures
The first would aim at prolonging the demographic dividend. The second would seek to improve China’s productivity performance. 16<br>
slide48. First, prolong the demographic dividend. The decline in the working age population will reduce the labor force. In response, further efforts should be made to improve the labor force participation rate. 16<br>
slide49. Reform of
the hukou system.(280million
migrant workers)
Guest workers, not residents. 16<br>
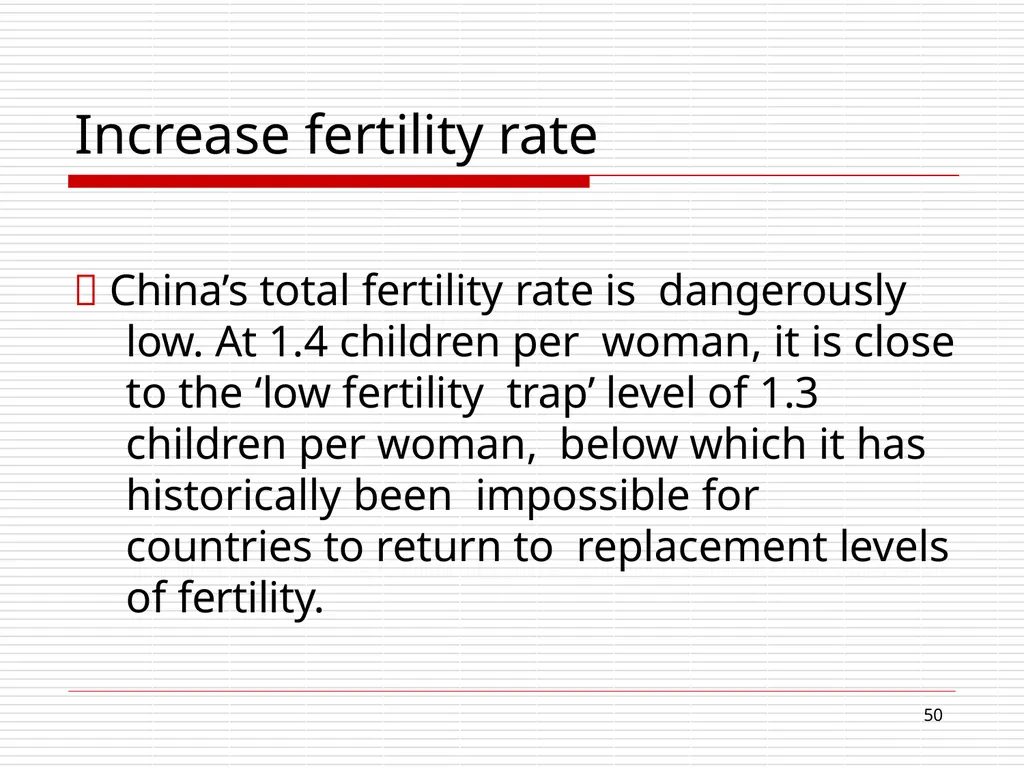
slide50. Increase fertility rate 16 China’s total fertility rate is dangerously low. At 1.4 children per woman, it is close to the ‘low fertility trap’ level of 1.3 children per woman, below which it has historically been impossible for countries to return to replacement levels of fertility.<br>
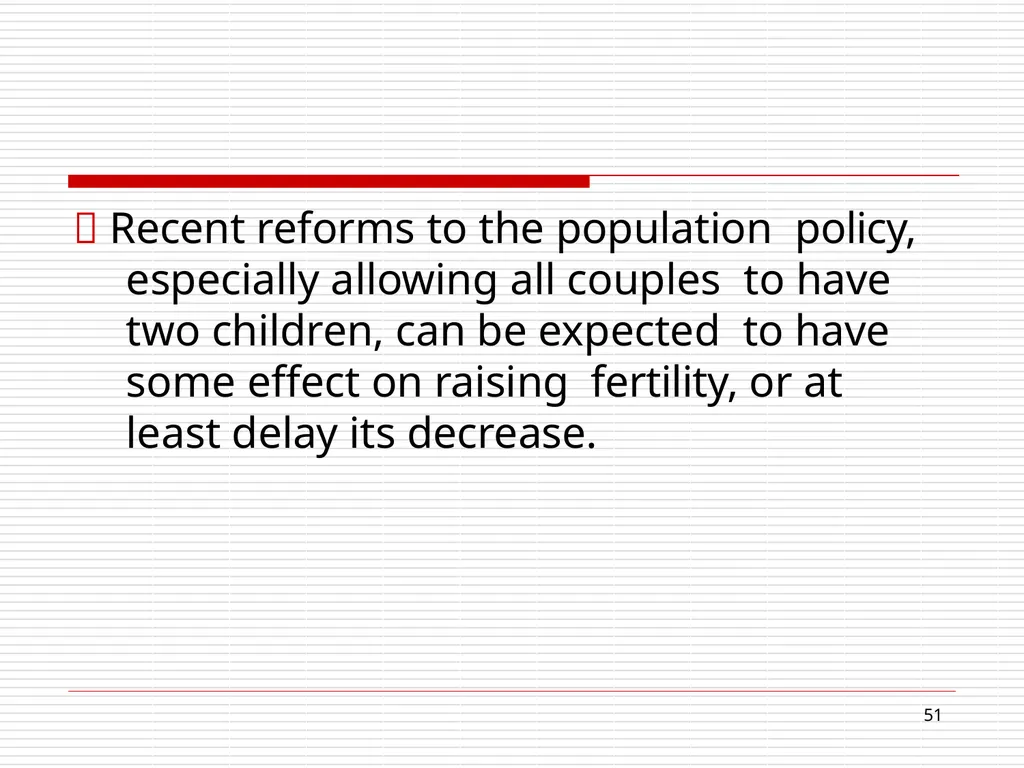
slide51. Recent reforms to the population policy, especially allowing all couples to have two children, can be expected to have some effect on raising fertility, or at least delay its decrease. 16<br>
slide52. 16<br>
slide53. 16<br>
slide54. Allowing families to have more children alone is not adequate. Complementary policies in the provision of public services are also needed to mitigate the burdens of families in raising children. 16<br>
slide55. Raising the retirement age could also put off China’s demographic headwinds. 16<br>
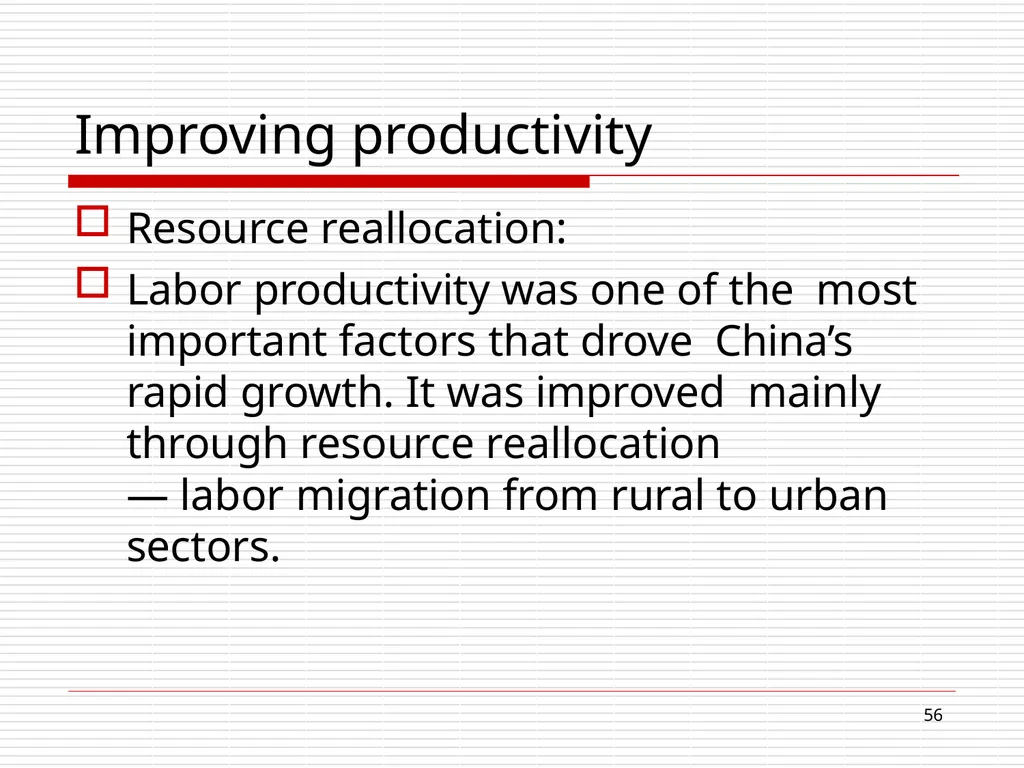
slide56. Improving productivity 16 Resource reallocation:
Labor productivity was one of the most important factors that drove China’s rapid growth. It was improved mainly through resource reallocation
— labor migration from rural to urban
sectors.<br>
slide57. There is still big potential for China to narrow the gap with developed countries in its share of agricultural labor. 16<br>
slide58. Reallocation of resources among non- agricultural industries and enterprises within narrowly defined industries can also provide a new source of allocative efficiency
Free entry and exit
Strengthening market mechanisms 16<br>
slide59. Innovation and Technology 16 In many sectors, technology has yet to catch up to the level of the advanced economies.
What the government can do? What
market can do? Industrial policy?<br>
slide60. Challenges and opportunities
Huawei phenomenon
Some firms will be gone. Those who can stay will have to improve their productivity. 16<br>
slide61. Summary 16 Critical developing time for China.
China still needs to dig for the potential of its traditional growth sources.
Reforms that aim to create a level playing field and an environment for innovation could create sustained sources of long term growth.<br>
slide62. Beijing aims to achieve the ‘great
rejuvenation’ of the Chinese nation and become a modernized country by 2050. Judging from past experiences, reform and opening up will still be the sources of Chinese economic growth. 16<br>
slide63. Thank you! 16<br>
UCSB & Shandong University<br>
slide2. In the period 1978–2015, China realized a real growth rate of gross national income (GNI) of 9.6 per cent
— the fastest speed anywhere in the
world in that period.
Reform and opening up to the world, heavy investment, globalization (China joined the WTO in 2001), demographic dividend 16<br>
slide3. The “New Normal”. The Chinese
economy has entered a ‘new normal’ characterized by slower growth, (6.8% in 2017, 6.6% in 2018, 6.3%?
in 2019)structural change and the transformation of growth drivers. 16<br>
slide4. Population aging, Labor costs have
been increasing
US-China trade war
Made in China? 16<br>
slide5. Can China avoid
the middle income trap? 16<br>
slide6. A significant portion of the unprecedented economic growth in China in the last few decades can be attributed to the demographic dividend. 16<br>
slide7. Two mechanisms
First is the decline of dependency ratio (the ratio of the dependent population to the working age population). It helps to maintain a high savings rate, which is the condition for capital formation. 16<br>
slide8. Secondly, the fast growth in the working-age population leads to a higher labor supply, and an adequate supply of labor prevents return on capital from diminishing, which allows heavy investment to be the main source of GDP growth. (low and constant wages) 16<br>
slide9. To better understand this demographic dividend, we need to look at China’s demographic transition. 16<br>
slide10. The process -from low through high to low population growth-is called the the demographic transition.
While the demographic transition took about a century in Europe, it has proceeded more rapidly in other countries since World War II. 16<br>
slide11. China has made its demographic transition under unusual circumstances and in less than 20 years. 16<br>
slide12. China’s demographic experience 16<br>
slide13. Annual population growth rate: 0.53% in 2017, dropped to 0.38%in 2018, world average is 1.16% 16<br>
slide14. Fertility rate 16 Total fertility rates (TFR): a measure of the total number of children a typical woman bears during her lifetime.
China’s economic growth during the period of reform has been accompanied by a rapid decline in the fertility rate.<br>
slide15. According to the United Nations, China’s total fertility rate dropped from 2.5–3 in the late 1970s and early 1980s to a replacement level of 2 in the first half of the 1990s and has remained constant at about 1.5 since the second half of the 1990s. 16<br>
slide16. The actual level of China’s TFR is debated. 16 The rate was 1.22 according to the 2000 census, 1.34 according to a 2005 sampling survey, 1.19 in the 2010 census and 1.05 from a 2015 sampling survey. Even after data adjustment based on assumptions of statistical error, most scholars
concluded that China’s TFR remains at 1.4 — a level lower than that
published by the United Nations.<br>
slide17. 16<br>
slide18. This figure shows the comparative
fertility data in east Asia. 16<br>
slide19. —Actually these data showed that the Chinese experience is less extraordinary than one might suppose when placed in the East Asian context.
—The big gap between urban and rural society is particularly salient in China 16<br>
slide20. Before it eventually brought about population ageing , the rapid demographic transition had helped form a population that was characterized by a rapid increase in the working-age population and a decrease in the dependency. This is what economists call the ‘demographic dividend’. 16<br>
slide21. Why TFR dropped so rapidly? 16 Economic and social development
reasons
In China, government policy plays an important role in this process, esp. the One-Child Policy.<br>
slide22. One-child policy 16 Shortly after China’s first modern census in 1953 (594 million), the government initiated family planning
Abandoned in the late1950s<br>
slide23. Chinese government launched its first all-out family planning initiative in 1971.The policy lasted through 1978. 晚、稀、少Wan-xi-shao, later marriages, longer spacing between children, and fewer children in total.
—Total fertility rates were cut in half, from 5.8 in 1970 to 2.7 in 1978.
Through 1979 the probability of a couple having a second child, given that they had already given birth to a first child, was 95%. “ two child, but wait” policy. 16<br>
slide24. “Baby boomers” reached marriage age, Policy tightened. In September 1980, the government formally adopted the “one-child policy” and a target population of 1.2billion in the year 2000
“One-and -a-Half-Child Policy” after 1984. 16<br>
slide25. The one-Child Policy worked 16 —In the one-child policy years, more
than 0.4 billion people are not born
—Population total fertility rates: early
1970s 5.8;now 1.4<br>
slide26. The influences 16 —Rapid population aging, increasing dependency ratio. By 2050, China may have more retirees than all of Germany, Japan, France and Britain
—Massive gender imbalance<br>
slide27. Gender imbalance 16 In most populations, more boys than girls are born. The average ratio is 106 boys for every 100 girls. (anything between 103 and 110 might be considered within the normal range)
There were around 108 boys for every 100 girls in China during the 1960s and 1970s<br>
slide28. Since the early 1980s, the sex ratio has arisen steadily and significantly. In the 2000 census, the relative boys per girls in the 0-4 age group was 120.8 16<br>
slide29. 16<br>
slide30. Missing girls?
Many baby girls are simply unregistered with the authorities, and not reported to census takers either.
Sex-selective abortion 16<br>
slide31. It has been changing in the past 10 years, but there are still 30million more men than women in China.(40 million in 2006)
Social anxiety or even conflict
Housing market? 16<br>
slide32. Population aging the following figure shows the dependent
population of working age (15-64) 16<br>
slide33. Share of old age population 16 By the end of 2018, 11.9% of the total population in China is 65 years and older. 17.9% is 60 years and older. By 2050, 35% of the population in China will be 60 and older and 22.9% will be 65 and older, according to WHO.<br>
slide34. Actually China’s problem is not unique. (low fertility rate, population aging)
But it is also unique because the timing is bad. China is becoming old rapidly before it’s becoming rich. 16<br>
slide35. The impact of rapid decline in fertility is also amplified by the mandatory retirement of the oldest baby boomers. 16 Financial problem: how to support the old?<br>
slide36. 16<br>
slide37. 16<br>
slide38. The arguments of one child policy: is it necessary to carry out one child policy?
—the fertility rate is already declining
before one-child policy
— If there is no one child policy, per capita GDP growth rate would decrease from 7.7 to 7(during 1980 to 1992) 16<br>
slide39. The one Child policy forced China through the demographic transition at an accelerated pace and created an exceptional demographic window of opportunity for growth. 16<br>
slide40. A favorable population structure helped China create the necessary conditions for high potential growth.(high savings rate, sufficient supply of labor, rapid improvement of human capital and radical resource reallocation through labor mobility) 16<br>
slide41. But the reversal of demographic
trends means that China’s traditional growth model will become unsustainable. Traditional sources of growth may be exhausted. 16<br>
slide42. At current fertility rates, the contribution of the demographic dividend to growth will be close to zero soon. Demography will eventually impose a burden, rather than a boost, to growth. 16<br>
slide43. The negative growth in the working- age population will lead to China’s labor shortage, and weaken the
comparative advantage of China’s
industry. 16<br>
slide44. The rapid increase in the capital– labor ratio has resulted in diminishing returns to capital. lower profit rate
The ageing of the rural population will
retard the urbanization 16<br>
slide45. Disappearing demographic dividend 16 Labor costs increasing, comparative advantages in labor-intensive industries is diminishing gradually.<br>
slide46. China is aware of the problems. But what can be done?
Automation? Immigrant? 16<br>
slide47. Possible measures
The first would aim at prolonging the demographic dividend. The second would seek to improve China’s productivity performance. 16<br>
slide48. First, prolong the demographic dividend. The decline in the working age population will reduce the labor force. In response, further efforts should be made to improve the labor force participation rate. 16<br>
slide49. Reform of
the hukou system.(280million
migrant workers)
Guest workers, not residents. 16<br>
slide50. Increase fertility rate 16 China’s total fertility rate is dangerously low. At 1.4 children per woman, it is close to the ‘low fertility trap’ level of 1.3 children per woman, below which it has historically been impossible for countries to return to replacement levels of fertility.<br>
slide51. Recent reforms to the population policy, especially allowing all couples to have two children, can be expected to have some effect on raising fertility, or at least delay its decrease. 16<br>
slide52. 16<br>
slide53. 16<br>
slide54. Allowing families to have more children alone is not adequate. Complementary policies in the provision of public services are also needed to mitigate the burdens of families in raising children. 16<br>
slide55. Raising the retirement age could also put off China’s demographic headwinds. 16<br>
slide56. Improving productivity 16 Resource reallocation:
Labor productivity was one of the most important factors that drove China’s rapid growth. It was improved mainly through resource reallocation
— labor migration from rural to urban
sectors.<br>
slide57. There is still big potential for China to narrow the gap with developed countries in its share of agricultural labor. 16<br>
slide58. Reallocation of resources among non- agricultural industries and enterprises within narrowly defined industries can also provide a new source of allocative efficiency
Free entry and exit
Strengthening market mechanisms 16<br>
slide59. Innovation and Technology 16 In many sectors, technology has yet to catch up to the level of the advanced economies.
What the government can do? What
market can do? Industrial policy?<br>
slide60. Challenges and opportunities
Huawei phenomenon
Some firms will be gone. Those who can stay will have to improve their productivity. 16<br>
slide61. Summary 16 Critical developing time for China.
China still needs to dig for the potential of its traditional growth sources.
Reforms that aim to create a level playing field and an environment for innovation could create sustained sources of long term growth.<br>
slide62. Beijing aims to achieve the ‘great
rejuvenation’ of the Chinese nation and become a modernized country by 2050. Judging from past experiences, reform and opening up will still be the sources of Chinese economic growth. 16<br>
slide63. Thank you! 16<br>