Distribution and Density of Population The concepts of distribution and density of population, though not identical, are so intimately related to each other that there is a genuine reason to discuss them together. First of all, a
"Distribution and Density of Population The" is the property of its rightful owner. Permission is granted to
download and print the materials on this website for personal, non-commercial use only, and to display it
on your personal computer provided you do not modify the materials and that you retain all copyright
notices contained in the materials. By downloading content from our website, you accept the terms of this
agreement.
Presentation Transcript
01
Distribution and Density of Population<br>
02
The concepts of distribution and density of population, though not identical, are so intimately related to each other that there is a genuine reason to discuss them together.
First of all, a distinction must be made between population distribution and population density.
The distribution of population is more locational, while the density is more proportional.
The former refers to the spatial pattern in which the population finds its location such as linear, dispersed, nucleated, agglomerated, etc. and the latter is concerned with the ratio between the size of population and the area.
Thus, when one is dealing with distribution, the concern is more for the pattern of spread of population and when one is dealing with density, the concern more for man-land ratio.<br>
03
Factors Affecting Population Distribution and Density The spread of population in the world is not ubiquitous.
There are wide regional contrasts in the degree of concentration of population giving highly variable densities to different parts of the world.
Many approximations have been made by scholars like Trewartha, Clarke and others about the proportions of area and proportions of population to highlight the fact of regional contrasts in the degree of population concentration at macro level.
It has been estimated that about 80 percent of the world’s population was concentrated in only about 20 percent of the world’s total land area.
At micro level, these contrasts in population distribution and concentration are perhaps sharper.<br>
04
These regional contrasts in the population distribution and density are governed by a variety of factors.
All the factors affecting the population distribution and density may broadly be classified into three major categories of physical, socio-cultural and demographic factors.
Physical Factors
Landforms
Soils
Energy Resources and Minerals
Accessibility
Socio-cultural Factors
Demographic Factor<br>
05
World Population Distribution<br>
06
The most conspicuous feature of the world’s population distribution was its unevenness and highly irregular spatial distribution.
Such an unevenness has been established through various kinds of estimates and approximations.
It has been pointed that more than 90 percent of the world’s population is confined to the northern hemisphere, while the continents of the southern hemisphere account for only one-tenth of the total population in the world.
Within the northern hemisphere the latitudinal distribution of population offers sharp differences in concentration.
For instance, 0-20°N latitudes account for about 10 percent of population of the world mainly in Asia,
20-40°N zone claims more than 50 per cent of the world’s population of the world again mainly in Asia,
40-60°N latitudes have about 30 percent of the world’s population again mainly in Europe
and only less than 1 percent population lives in region north of 60°N latitude.
Trewartha (1969) estimated that about half of the word’s population occupied less than 5 percent of the total area and the remaining half was spread over 50-60 percent area.<br>
07
Another salient feature of the distributional pattern of population in the world was that the rimlands of all the continents accounted for the major population concentrations, while the interiors were comparatively empty.
Clarke (1965) pointed out three-fourths of the world’s population lived within 1000 kms of sea, and two-thirds within 500 kms.
Factors of climate and accessibility may have accounted for such an insularity of population concentration.
Similarly, inequalities have been observed in vertical distribution of population also.
Trewartha found that mean level of vertical distribution of population was highest in South America (644 metres) and lowest in Australia (95 metres).
Broadly speaking, about four-fifths of the world’s population lived within 500 metres from the sea level.<br>
08
At the regional level too, the distribution of population is intriguing.
The population of the world reached 7.06 billion in 2012.
Of these only 17.6 per cent was confined to more developed regions including North America, Europe, Japan, Australia, New Zealand and CIS countries.
The less developed regions comprising Africa, Latin America, Asia, Melanesia and Micronesia-Polynesia, thus, accounted for over three-fourths (82.4 per cent) of the world’s total population in 2012.
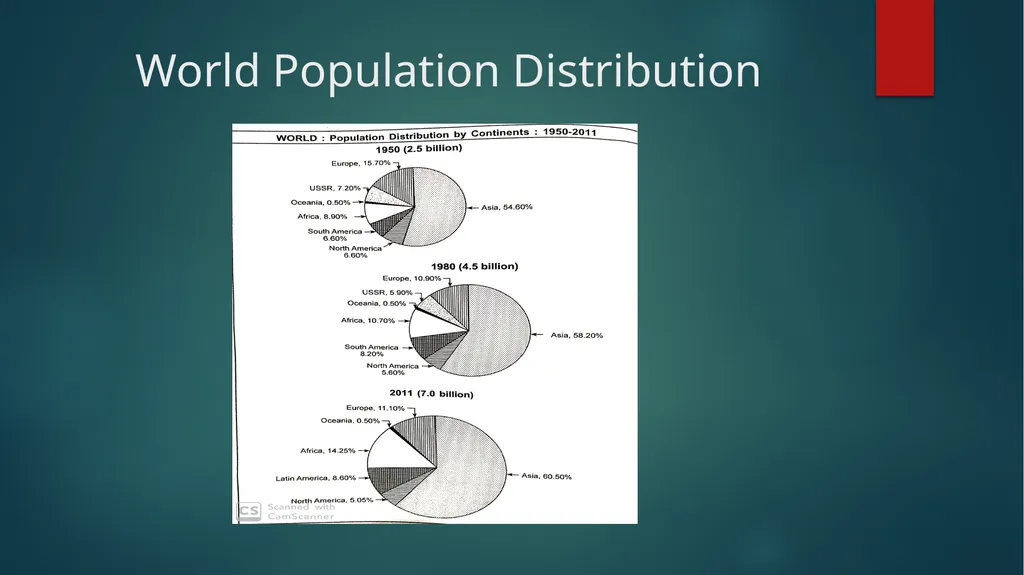
Of all the continents, Asia alone contributed more than half the world’s total population (4.26 billion) and had the distinction of being the most crowded continent of the world.
Africa with 944 million inhabitants was the second largest contributor to the world’s population.
It was followed by Europe (740 million), Latin America (599 million), North America (349 million) and Oceania (37 million).<br>
09
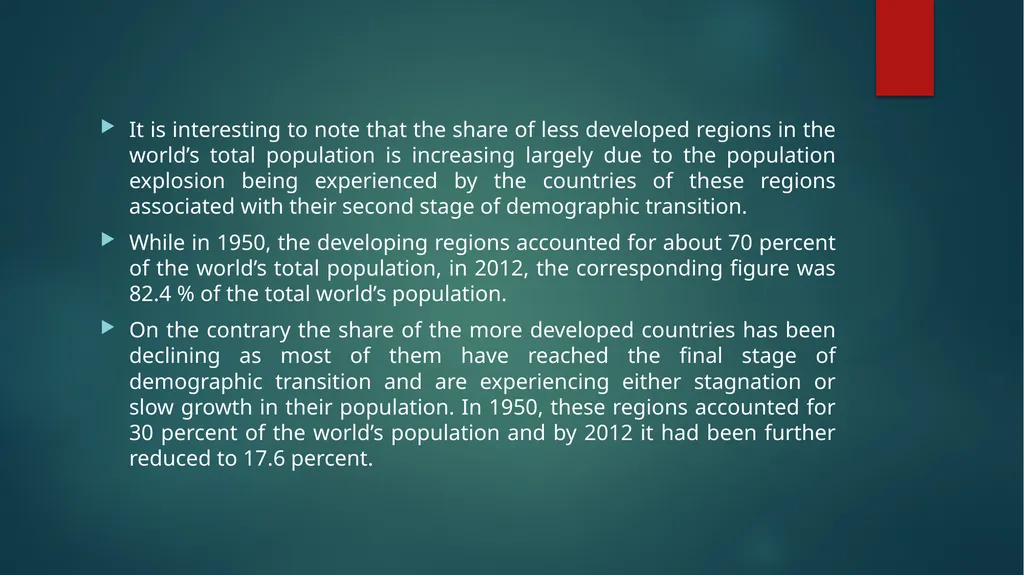
It is interesting to note that the share of less developed regions in the world’s total population is increasing largely due to the population explosion being experienced by the countries of these regions associated with their second stage of demographic transition.
While in 1950, the developing regions accounted for about 70 percent of the world’s total population, in 2012, the corresponding figure was 82.4 % of the total world’s population.
On the contrary the share of the more developed countries has been declining as most of them have reached the final stage of demographic transition and are experiencing either stagnation or slow growth in their population. In 1950, these regions accounted for 30 percent of the world’s population and by 2012 it had been further reduced to 17.6 percent.<br>