
Dr. Srinibash Dash Associate Professor & Head




Description: Dr. Srinibash Dash Associate Professor Head School of Management Gangadhar Meher University CONTENTS-- Z TEST:- The Z-test was developed by Sir Ronald Aylmer Fisher, a British statistician. He developed the Z-test as part of his
Related Topics
Download Presentation
"Dr. Srinibash Dash Associate Professor & Head" is the property of its rightful owner. Permission is granted to download and print the materials on this website for personal, non-commercial use only, and to display it on your personal computer provided you do not modify the materials and that you retain all copyright notices contained in the materials. By downloading content from our website, you accept the terms of this agreement.
Presentation Transcript
slide1. Dr. Srinibash Dash
Associate Professor & Head
School of Management
Gangadhar Meher University<br>
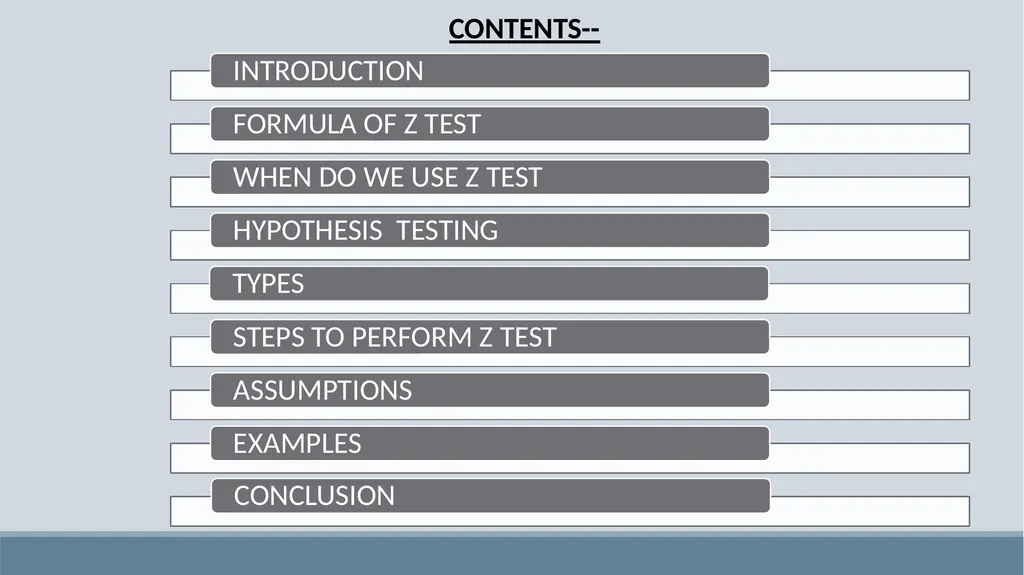
slide2. CONTENTS--<br>
slide3. Z TEST:- The Z-test was developed by Sir Ronald Aylmer Fisher, a British statistician.
He developed the Z-test as part of his pioneering work in hypothesis testing and experimental design during the early 20th century. Fisher's work laid the foundation for modern statistical methods and helped establish statistics as a rigorous scientific discipline.<br>
slide4. INTRODUCTION A Z-test is a statistical method used to determine whether the mean of a sample differs significantly from the mean of a population.
It's particularly useful when dealing with large sample sizes and known population standard deviation.
Z-tests help researchers and analysts make informed decisions based on statistical evidence.<br>
slide5. Importance of Z-Tests Hypothesis Testing: Z-tests are an essential tool in hypothesis testing, helping researchers evaluate the validity of assumptions about a population.
Decision Making: They provide a basis for decision-making in various fields, including medicine, finance, marketing, and quality control.
Statistical Significance: Z-tests help determine whether observed differences are statistically significant or simply due to chance<br>
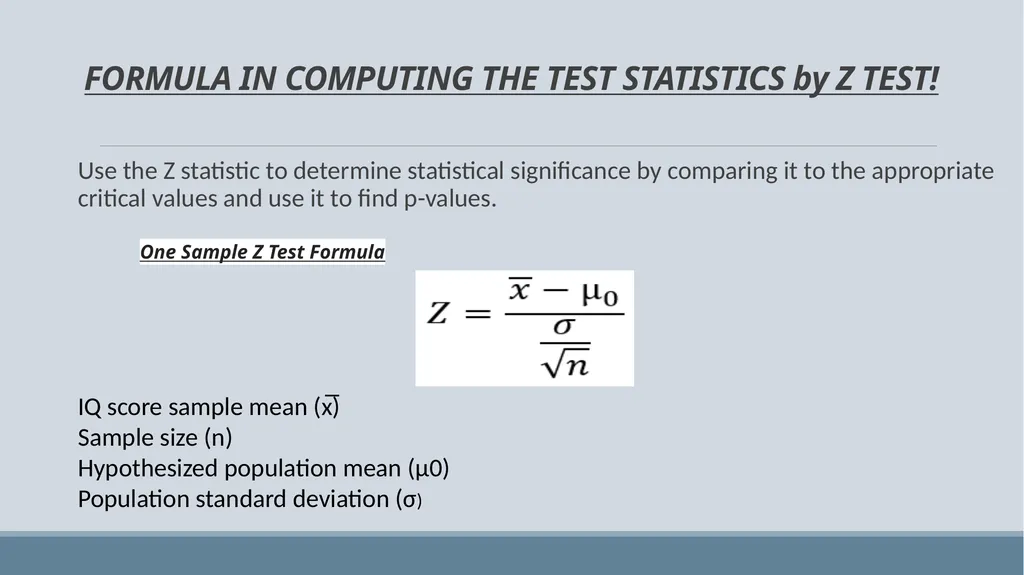
slide6. FORMULA IN COMPUTING THE TEST STATISTICS by Z TEST! Use the Z statistic to determine statistical significance by comparing it to the appropriate critical values and use it to find p-values. One Sample Z Test Formula IQ score sample mean (x̅)
Sample size (n)
Hypothesized population mean (µ0)
Population standard deviation (σ)<br>
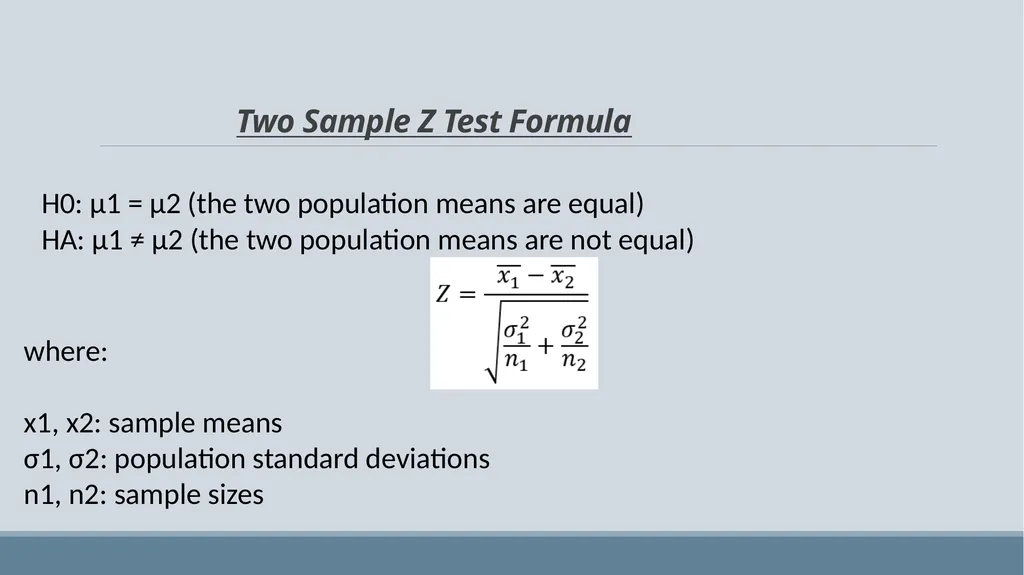
slide7. Two Sample Z Test Formula where:
x1, x2: sample means
σ1, σ2: population standard deviations
n1, n2: sample sizes H0: μ1 = μ2 (the two population means are equal)
HA: μ1 ≠ μ2 (the two population means are not equal)<br>
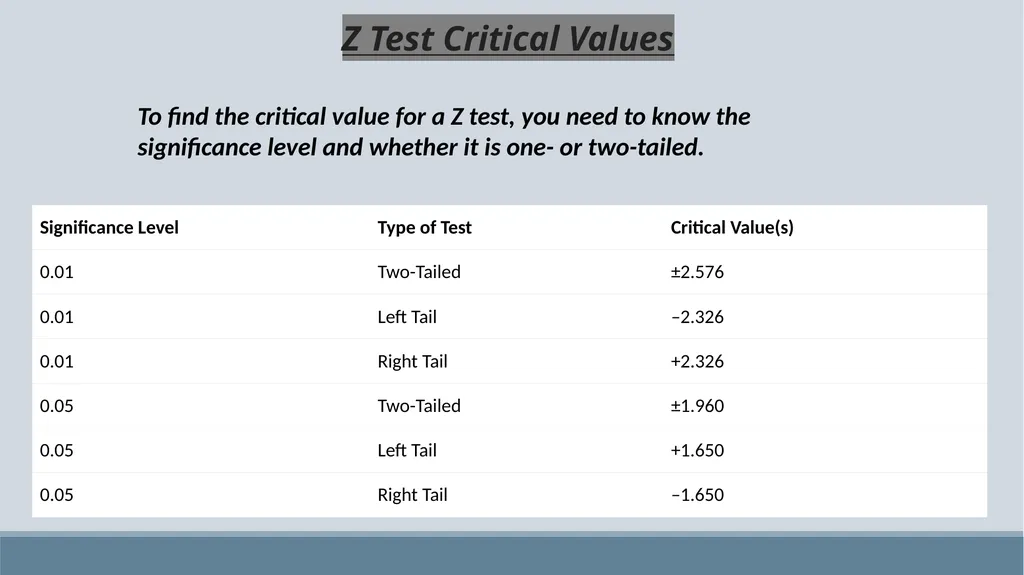
slide8. Z Test Critical Values To find the critical value for a Z test, you need to know the significance level and whether it is one- or two-tailed.<br>
slide9. WHEN DO WE USE Z-TEST ?? The sample size should be greater than 30, otherwise, we should use t test.
Samples should be drawn at random from the population.
The standard deviation of the population should be known.
Samples that are drawn from the population should be independent of each other.
The data should be normally distributed, however for large sample size, it is assumed to have a normal distribution.<br>
slide10. WHY WE USE LARGE SAMPLE...? When we perform a statistical test we are trying to judge the validity of the null hypothesis. We are doing so with an incomplete view of the population. Our sample is our window into the population.
The larger the sample size the bigger our window. However without a full view of the population there is always the chance that our sample will lead us to the wrong conclusion.<br>
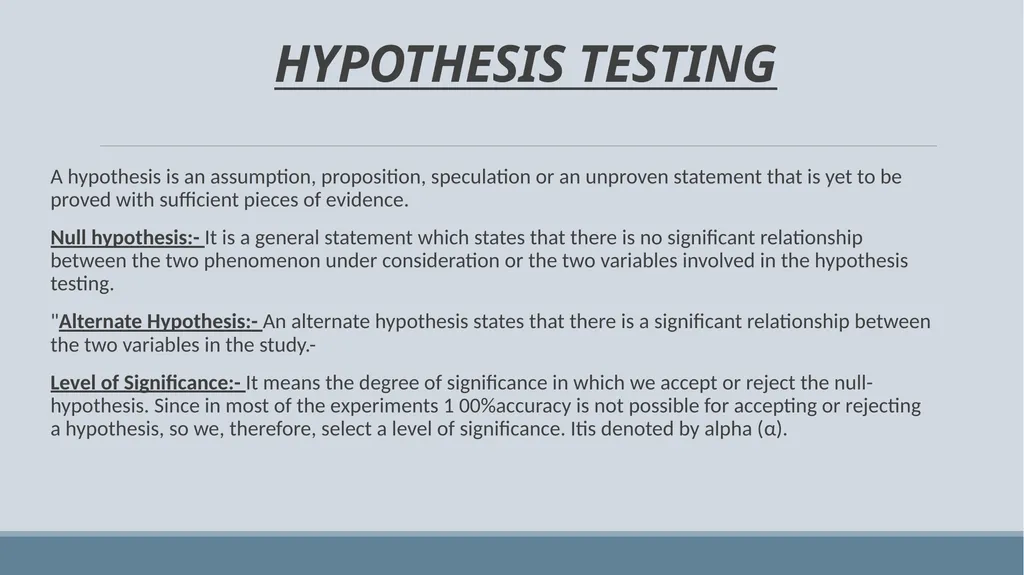
slide11. HYPOTHESIS TESTING A hypothesis is an assumption, proposition, speculation or an unproven statement that is yet to be proved with sufficient pieces of evidence.
Null hypothesis:- It is a general statement which states that there is no significant relationship between the two phenomenon under consideration or the two variables involved in the hypothesis testing.
"Alternate Hypothesis:- An alternate hypothesis states that there is a significant relationship between the two variables in the study.-
Level of Significance:- It means the degree of significance in which we accept or reject the null-hypothesis. Since in most of the experiments 1 00%accuracy is not possible for accepting or rejecting a hypothesis, so we, therefore, select a level of significance. Itis denoted by alpha (α).<br>
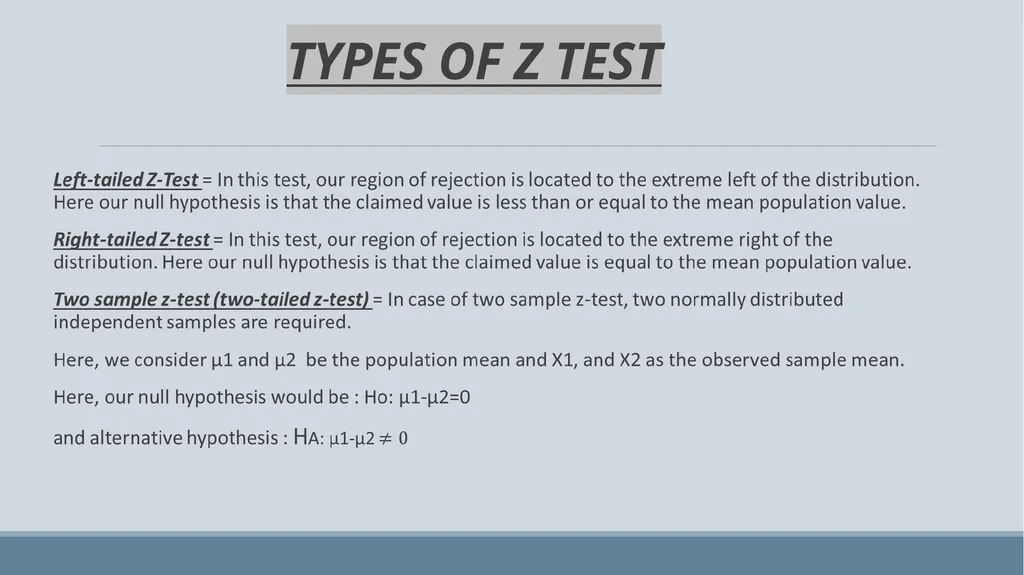
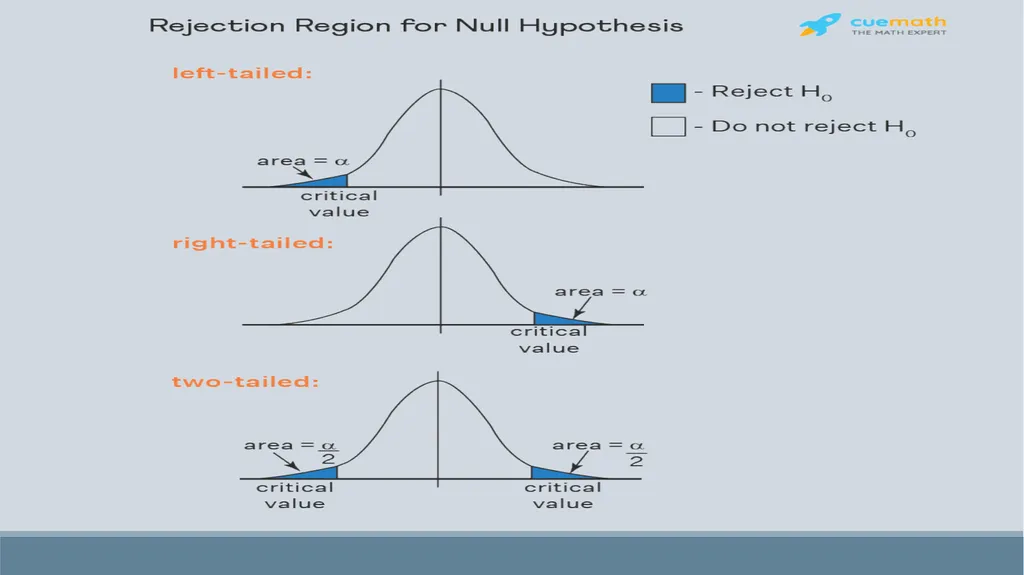
slide12. TYPES OF Z TEST<br>
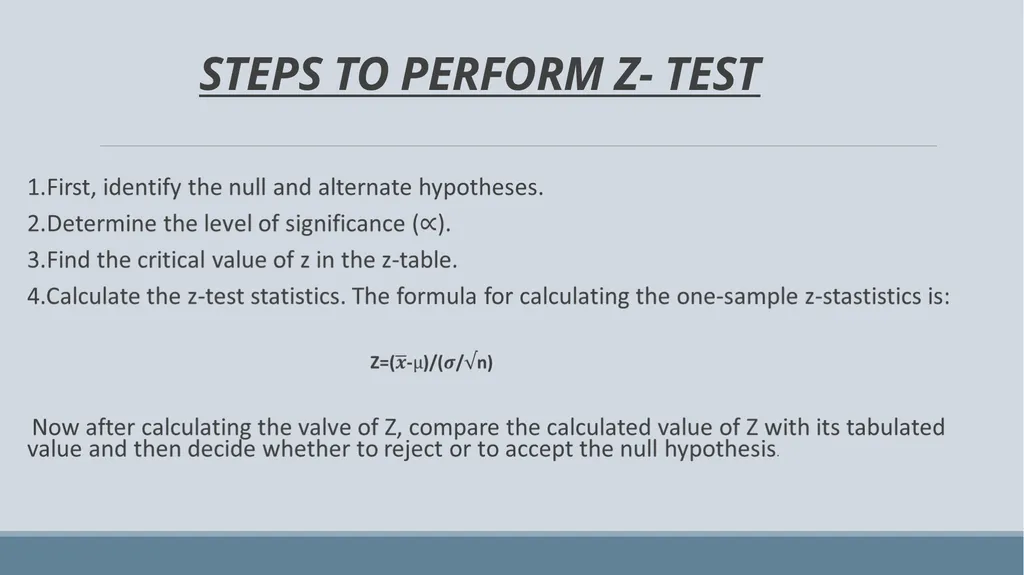
slide14. STEPS TO PERFORM Z- TEST<br>
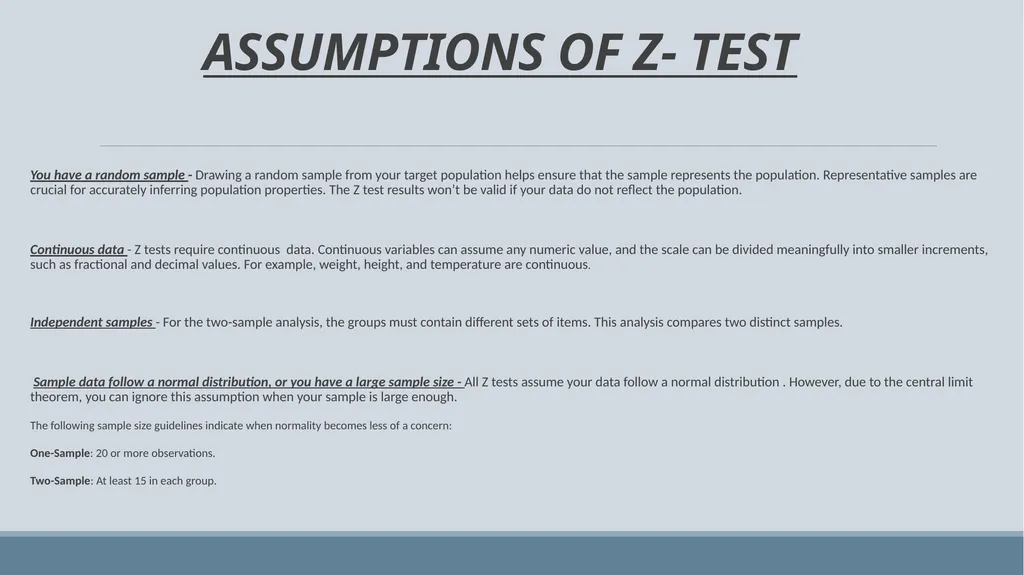
slide15. ASSUMPTIONS OF Z- TEST You have a random sample - Drawing a random sample from your target population helps ensure that the sample represents the population. Representative samples are crucial for accurately inferring population properties. The Z test results won’t be valid if your data do not reflect the population.
Continuous data - Z tests require continuous data. Continuous variables can assume any numeric value, and the scale can be divided meaningfully into smaller increments, such as fractional and decimal values. For example, weight, height, and temperature are continuous.
Independent samples - For the two-sample analysis, the groups must contain different sets of items. This analysis compares two distinct samples.
Sample data follow a normal distribution, or you have a large sample size - All Z tests assume your data follow a normal distribution . However, due to the central limit theorem, you can ignore this assumption when your sample is large enough.
The following sample size guidelines indicate when normality becomes less of a concern:
One-Sample: 20 or more observations.
Two-Sample: At least 15 in each group.<br>
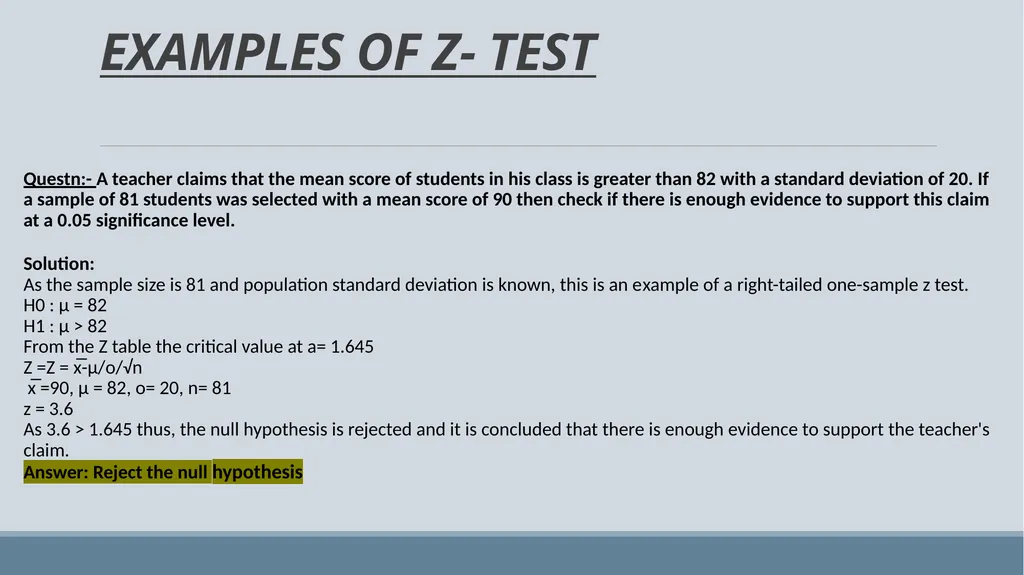
slide16. EXAMPLES OF Z- TEST Questn:- A teacher claims that the mean score of students in his class is greater than 82 with a standard deviation of 20. If a sample of 81 students was selected with a mean score of 90 then check if there is enough evidence to support this claim at a 0.05 significance level.
Solution:
As the sample size is 81 and population standard deviation is known, this is an example of a right-tailed one-sample z test.
H0 : μ = 82
H1 : μ > 82
From the Z table the critical value at a= 1.645
Z =Z = x̅-μ/o/√n
x̅ =90, μ = 82, o= 20, n= 81
z = 3.6
As 3.6 > 1.645 thus, the null hypothesis is rejected and it is concluded that there is enough evidence to support the teacher's claim.
Answer: Reject the null hypothesis<br>
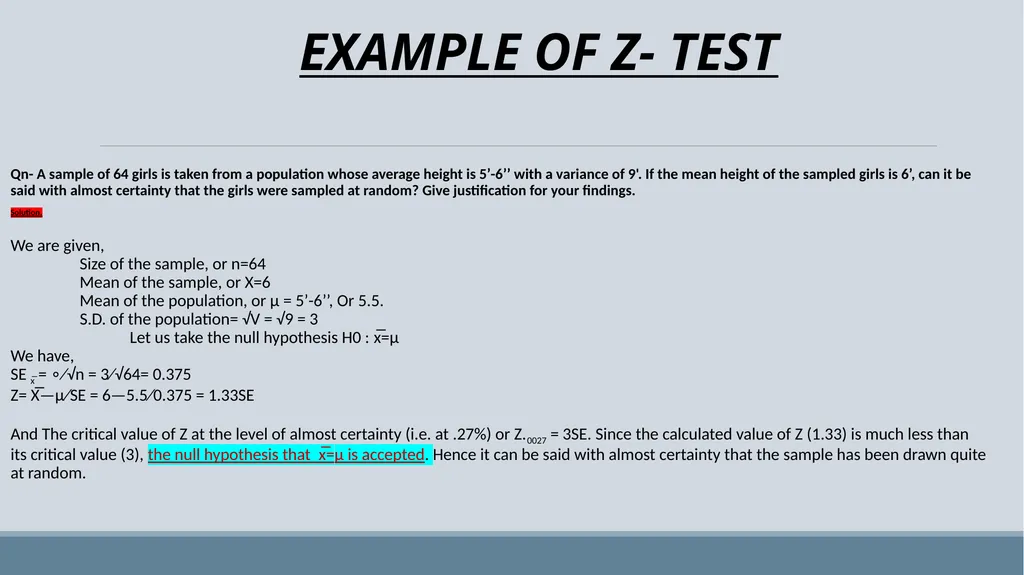
slide17. EXAMPLE OF Z- TEST Qn- A sample of 64 girls is taken from a population whose average height is 5’-6’’ with a variance of 9'. If the mean height of the sampled girls is 6’, can it be said with almost certainty that the girls were sampled at random? Give justification for your findings.
Solution.
We are given, Size of the sample, or n=64 Mean of the sample, or X=6 Mean of the population, or µ = 5’-6’’, Or 5.5.
S.D. of the population= √V = √9 = 3
Let us take the null hypothesis H0 : x̅=μ
We have,
SE x̅ = ∘∕√n = 3∕√64= 0.375
Z= X̅—μ∕SE = 6—5.5∕0.375 = 1.33SE
And The critical value of Z at the level of almost certainty (i.e. at .27%) or Z.0027 = 3SE. Since the calculated value of Z (1.33) is much less than its critical value (3), the null hypothesis that x̅=μ is accepted. Hence it can be said with almost certainty that the sample has been drawn quite at random.<br>
slide18. Z-test is a statistically significant test for the hypothesis testing (null and alternative hypotheses) when the sample size is large, and the population parameter (mean and variance) is known.
TO use large sample size we should use Z test. CONCLUSION<br>
Associate Professor & Head
School of Management
Gangadhar Meher University<br>
slide2. CONTENTS--<br>
slide3. Z TEST:- The Z-test was developed by Sir Ronald Aylmer Fisher, a British statistician.
He developed the Z-test as part of his pioneering work in hypothesis testing and experimental design during the early 20th century. Fisher's work laid the foundation for modern statistical methods and helped establish statistics as a rigorous scientific discipline.<br>
slide4. INTRODUCTION A Z-test is a statistical method used to determine whether the mean of a sample differs significantly from the mean of a population.
It's particularly useful when dealing with large sample sizes and known population standard deviation.
Z-tests help researchers and analysts make informed decisions based on statistical evidence.<br>
slide5. Importance of Z-Tests Hypothesis Testing: Z-tests are an essential tool in hypothesis testing, helping researchers evaluate the validity of assumptions about a population.
Decision Making: They provide a basis for decision-making in various fields, including medicine, finance, marketing, and quality control.
Statistical Significance: Z-tests help determine whether observed differences are statistically significant or simply due to chance<br>
slide6. FORMULA IN COMPUTING THE TEST STATISTICS by Z TEST! Use the Z statistic to determine statistical significance by comparing it to the appropriate critical values and use it to find p-values. One Sample Z Test Formula IQ score sample mean (x̅)
Sample size (n)
Hypothesized population mean (µ0)
Population standard deviation (σ)<br>
slide7. Two Sample Z Test Formula where:
x1, x2: sample means
σ1, σ2: population standard deviations
n1, n2: sample sizes H0: μ1 = μ2 (the two population means are equal)
HA: μ1 ≠ μ2 (the two population means are not equal)<br>
slide8. Z Test Critical Values To find the critical value for a Z test, you need to know the significance level and whether it is one- or two-tailed.<br>
slide9. WHEN DO WE USE Z-TEST ?? The sample size should be greater than 30, otherwise, we should use t test.
Samples should be drawn at random from the population.
The standard deviation of the population should be known.
Samples that are drawn from the population should be independent of each other.
The data should be normally distributed, however for large sample size, it is assumed to have a normal distribution.<br>
slide10. WHY WE USE LARGE SAMPLE...? When we perform a statistical test we are trying to judge the validity of the null hypothesis. We are doing so with an incomplete view of the population. Our sample is our window into the population.
The larger the sample size the bigger our window. However without a full view of the population there is always the chance that our sample will lead us to the wrong conclusion.<br>
slide11. HYPOTHESIS TESTING A hypothesis is an assumption, proposition, speculation or an unproven statement that is yet to be proved with sufficient pieces of evidence.
Null hypothesis:- It is a general statement which states that there is no significant relationship between the two phenomenon under consideration or the two variables involved in the hypothesis testing.
"Alternate Hypothesis:- An alternate hypothesis states that there is a significant relationship between the two variables in the study.-
Level of Significance:- It means the degree of significance in which we accept or reject the null-hypothesis. Since in most of the experiments 1 00%accuracy is not possible for accepting or rejecting a hypothesis, so we, therefore, select a level of significance. Itis denoted by alpha (α).<br>
slide12. TYPES OF Z TEST<br>
slide14. STEPS TO PERFORM Z- TEST<br>
slide15. ASSUMPTIONS OF Z- TEST You have a random sample - Drawing a random sample from your target population helps ensure that the sample represents the population. Representative samples are crucial for accurately inferring population properties. The Z test results won’t be valid if your data do not reflect the population.
Continuous data - Z tests require continuous data. Continuous variables can assume any numeric value, and the scale can be divided meaningfully into smaller increments, such as fractional and decimal values. For example, weight, height, and temperature are continuous.
Independent samples - For the two-sample analysis, the groups must contain different sets of items. This analysis compares two distinct samples.
Sample data follow a normal distribution, or you have a large sample size - All Z tests assume your data follow a normal distribution . However, due to the central limit theorem, you can ignore this assumption when your sample is large enough.
The following sample size guidelines indicate when normality becomes less of a concern:
One-Sample: 20 or more observations.
Two-Sample: At least 15 in each group.<br>
slide16. EXAMPLES OF Z- TEST Questn:- A teacher claims that the mean score of students in his class is greater than 82 with a standard deviation of 20. If a sample of 81 students was selected with a mean score of 90 then check if there is enough evidence to support this claim at a 0.05 significance level.
Solution:
As the sample size is 81 and population standard deviation is known, this is an example of a right-tailed one-sample z test.
H0 : μ = 82
H1 : μ > 82
From the Z table the critical value at a= 1.645
Z =Z = x̅-μ/o/√n
x̅ =90, μ = 82, o= 20, n= 81
z = 3.6
As 3.6 > 1.645 thus, the null hypothesis is rejected and it is concluded that there is enough evidence to support the teacher's claim.
Answer: Reject the null hypothesis<br>
slide17. EXAMPLE OF Z- TEST Qn- A sample of 64 girls is taken from a population whose average height is 5’-6’’ with a variance of 9'. If the mean height of the sampled girls is 6’, can it be said with almost certainty that the girls were sampled at random? Give justification for your findings.
Solution.
We are given, Size of the sample, or n=64 Mean of the sample, or X=6 Mean of the population, or µ = 5’-6’’, Or 5.5.
S.D. of the population= √V = √9 = 3
Let us take the null hypothesis H0 : x̅=μ
We have,
SE x̅ = ∘∕√n = 3∕√64= 0.375
Z= X̅—μ∕SE = 6—5.5∕0.375 = 1.33SE
And The critical value of Z at the level of almost certainty (i.e. at .27%) or Z.0027 = 3SE. Since the calculated value of Z (1.33) is much less than its critical value (3), the null hypothesis that x̅=μ is accepted. Hence it can be said with almost certainty that the sample has been drawn quite at random.<br>
slide18. Z-test is a statistically significant test for the hypothesis testing (null and alternative hypotheses) when the sample size is large, and the population parameter (mean and variance) is known.
TO use large sample size we should use Z test. CONCLUSION<br>