
Economic and Monetary Developments in Slovakia in

Description: Economic and Monetary Developments in Slovakia in the past 20 years Ján Tóth Deputy Governor of the National Bank of Slovakia 2 Outline Slovakia - different phases of transition Slovak vs. Czech Experience Looking back - selected economic
Related Topics
Download Presentation
"Economic and Monetary Developments in Slovakia in" is the property of its rightful owner. Permission is granted to download and print the materials on this website for personal, non-commercial use only, and to display it on your personal computer provided you do not modify the materials and that you retain all copyright notices contained in the materials. By downloading content from our website, you accept the terms of this agreement.
Presentation Transcript
slide1. Economic and Monetary Developments in Slovakia
in the past 20 years Ján Tóth
Deputy Governor of the National Bank of Slovakia<br>
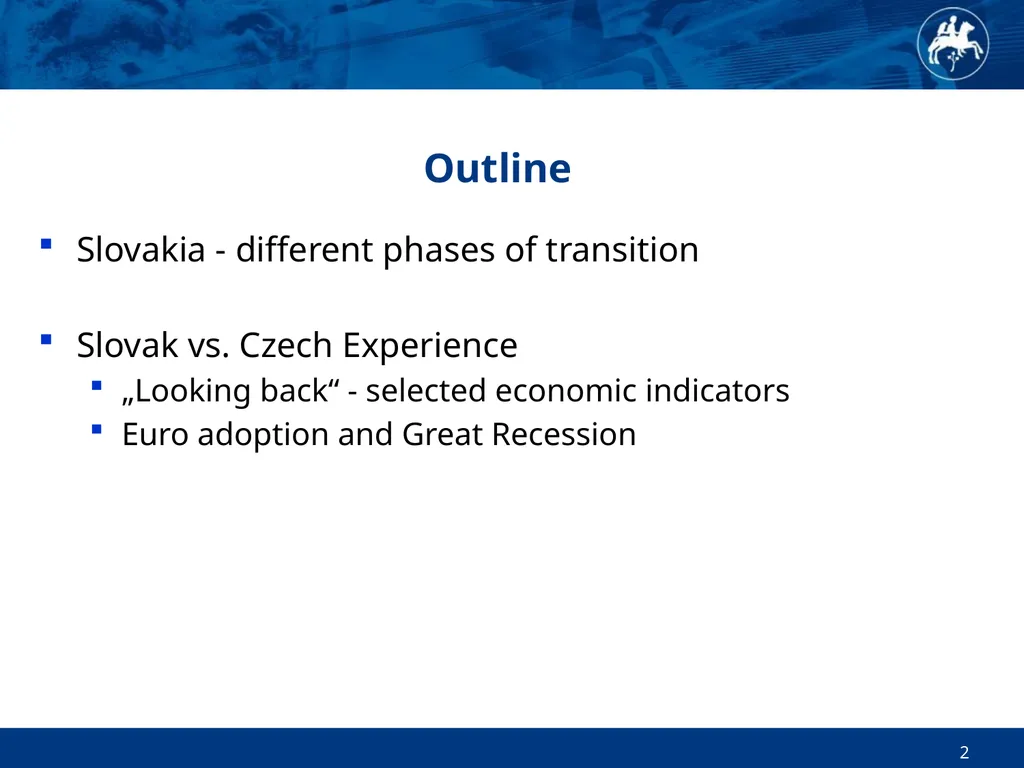
slide2. 2 Outline Slovakia - different phases of transition
Slovak vs. Czech Experience
„Looking back“ - selected economic indicators
Euro adoption and Great Recession<br>
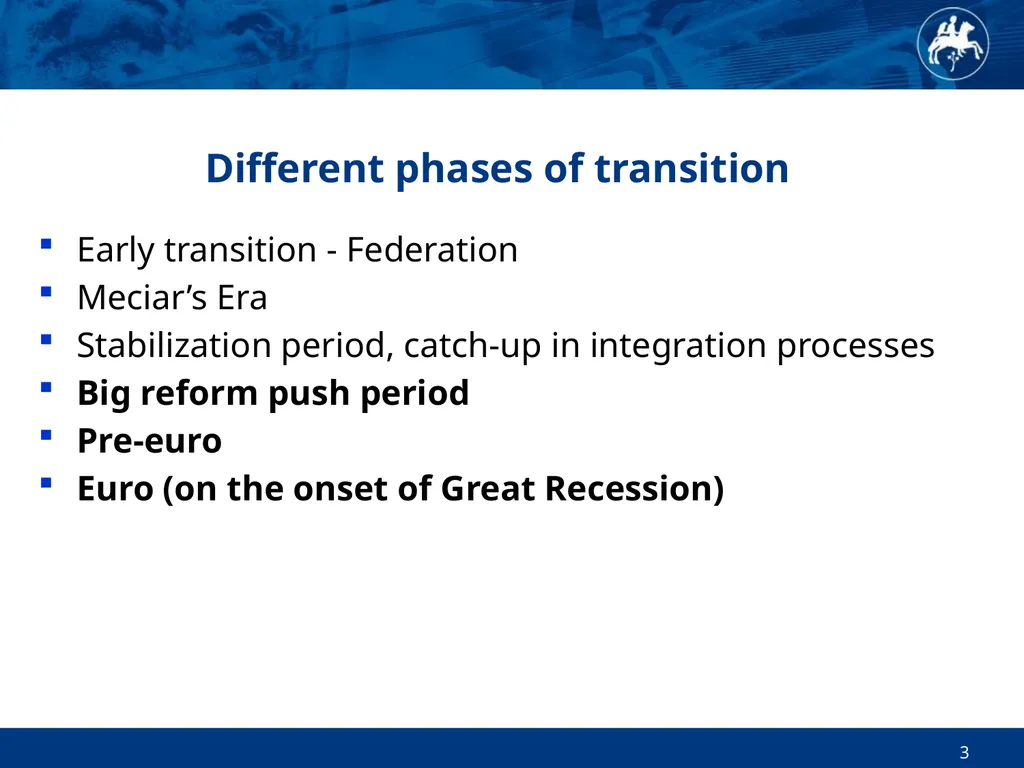
slide3. 3 Different phases of transition Early transition - Federation
Meciar’s Era
Stabilization period, catch-up in integration processes
Big reform push period
Pre-euro
Euro (on the onset of Great Recession)<br>
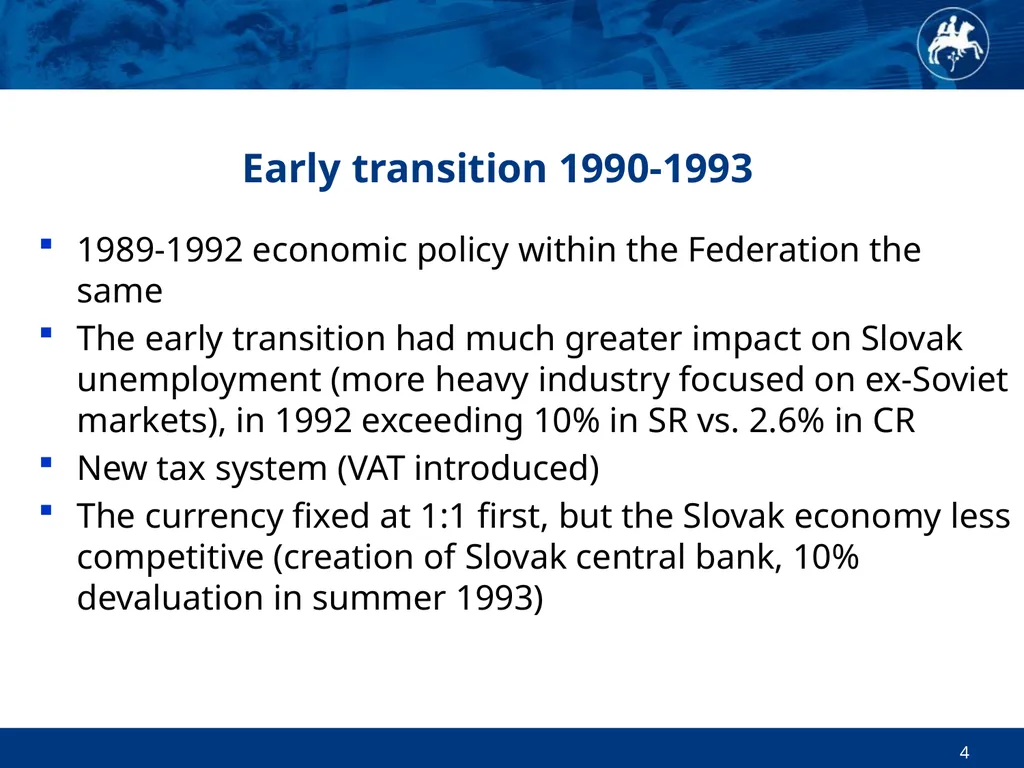
slide4. 4 Early transition 1990-1993 1989-1992 economic policy within the Federation the same
The early transition had much greater impact on Slovak unemployment (more heavy industry focused on ex-Soviet markets), in 1992 exceeding 10% in SR vs. 2.6% in CR
New tax system (VAT introduced)
The currency fixed at 1:1 first, but the Slovak economy less competitive (creation of Slovak central bank, 10% devaluation in summer 1993)<br>
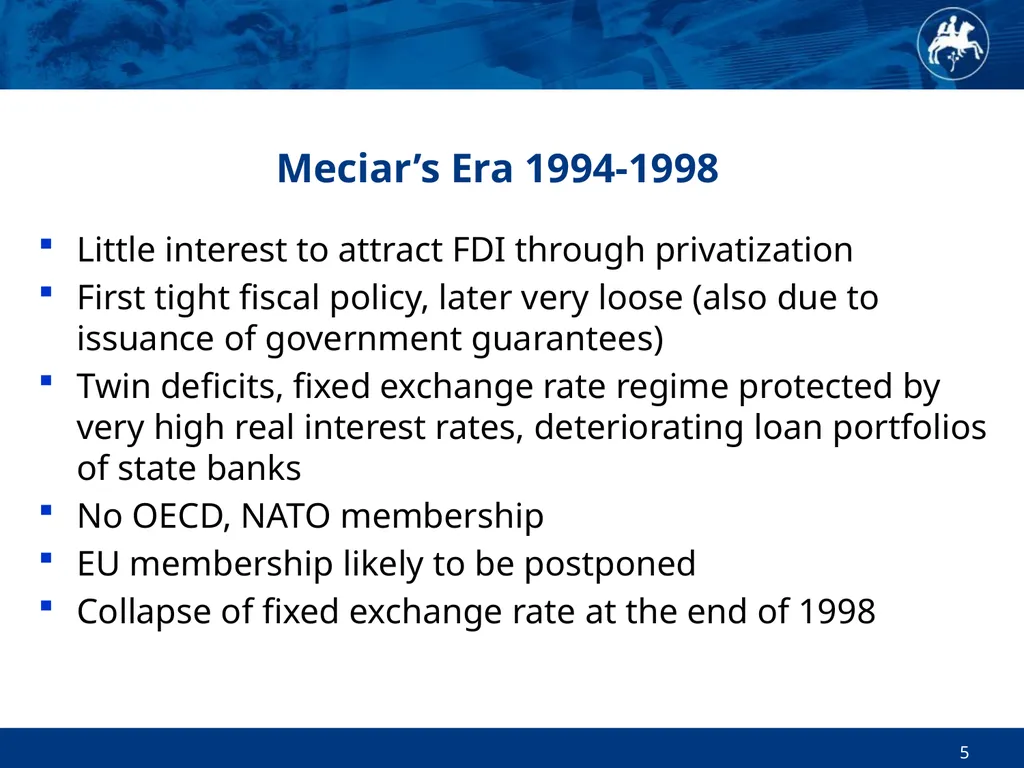
slide5. 5 Meciar’s Era 1994-1998 Little interest to attract FDI through privatization
First tight fiscal policy, later very loose (also due to issuance of government guarantees)
Twin deficits, fixed exchange rate regime protected by very high real interest rates, deteriorating loan portfolios of state banks
No OECD, NATO membership
EU membership likely to be postponed
Collapse of fixed exchange rate at the end of 1998<br>
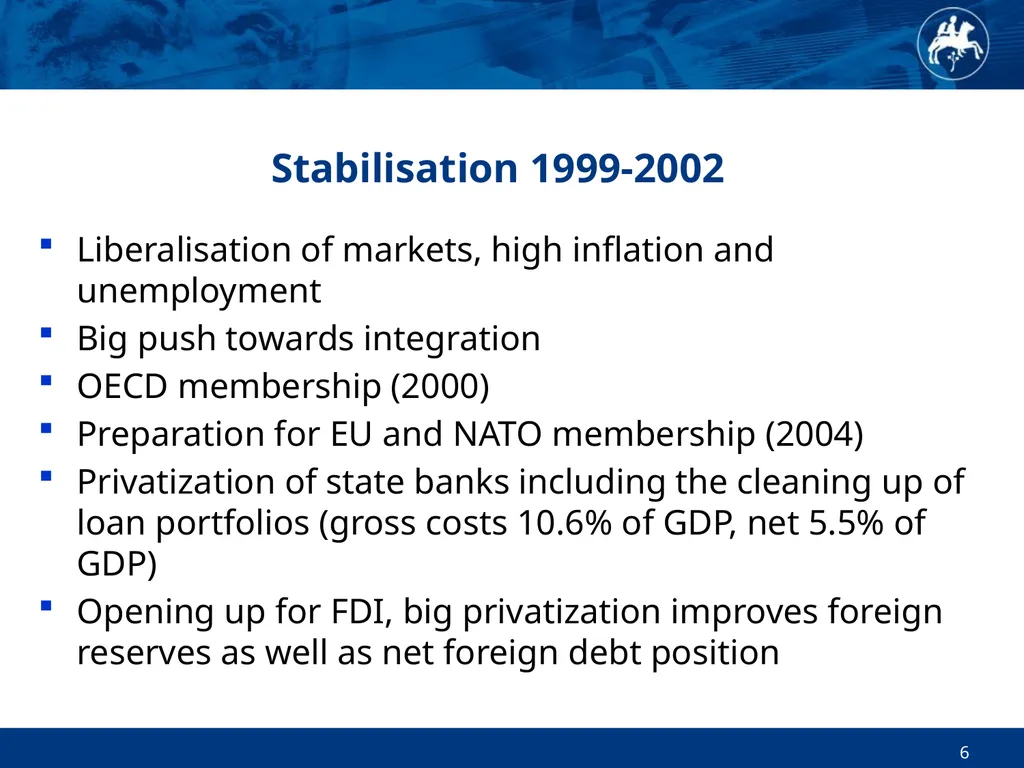
slide6. 6 Stabilisation 1999-2002 Liberalisation of markets, high inflation and unemployment
Big push towards integration
OECD membership (2000)
Preparation for EU and NATO membership (2004)
Privatization of state banks including the cleaning up of loan portfolios (gross costs 10.6% of GDP, net 5.5% of GDP)
Opening up for FDI, big privatization improves foreign reserves as well as net foreign debt position<br>
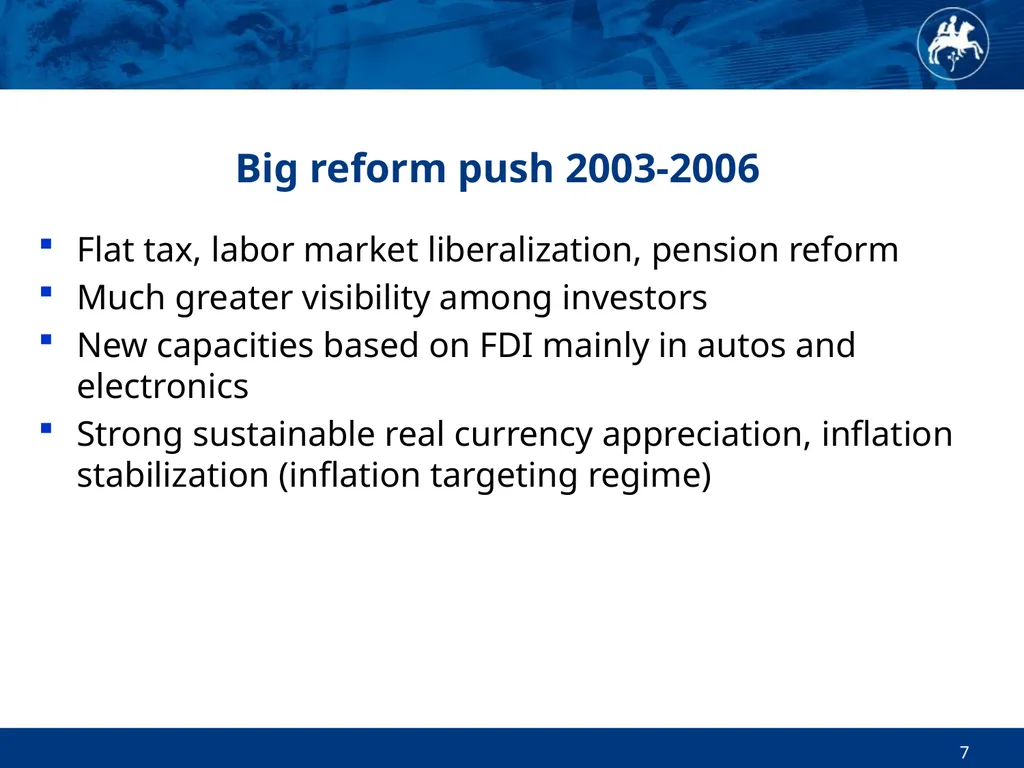
slide7. 7 Big reform push 2003-2006 Flat tax, labor market liberalization, pension reform
Much greater visibility among investors
New capacities based on FDI mainly in autos and electronics
Strong sustainable real currency appreciation, inflation stabilization (inflation targeting regime)<br>
slide8. 8 Pre-euro period 2007-2008 Very high growth rate
Continuing currency appreciation
Flat tax, labor market liberalization, pension reform
Much greater visibility among investors
New FDI capacities expanding<br>
slide9. 9 EURO and Global Recession 2009- Greater slump, faster recovery
Ex-ante expected benefits of EURO adoption: Direct (immediate) benefits
elimination of exchange rate risk against euro
lower costs of capital
elimination of some transaction costs
better resistance to (currency) crises
higher price transparency Indirect (long-term) benefits
trade growth
increase of FDI
Resulting in faster growth/increase of living standards/progress in real convergence<br>
slide10. 10 Slovak vs. Czech experience Growth
Policy (ratings, bond spreads, structural indicators)
Inflation, interest rate
Exchange rate<br>
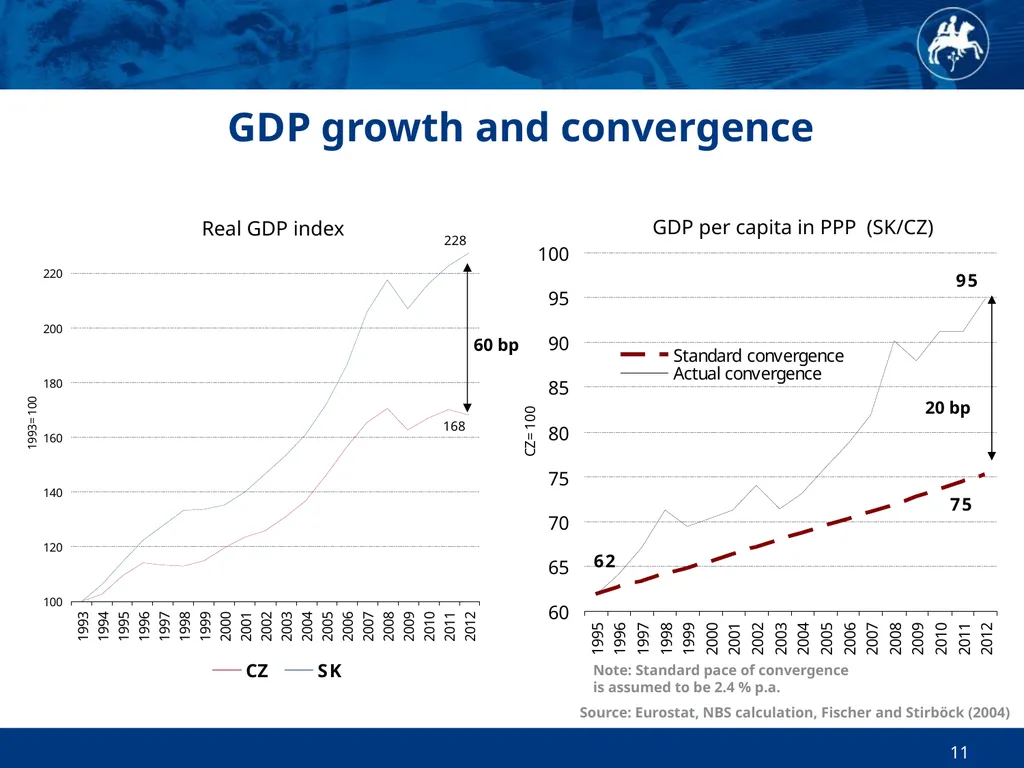
slide11. 11 GDP growth and convergence Real GDP index GDP per capita in PPP (SK/CZ) Source: Eurostat, NBS calculation, Fischer and Stirböck (2004) Note: Standard pace of convergence is assumed to be 2.4 % p.a. 60 bp 20 bp<br>
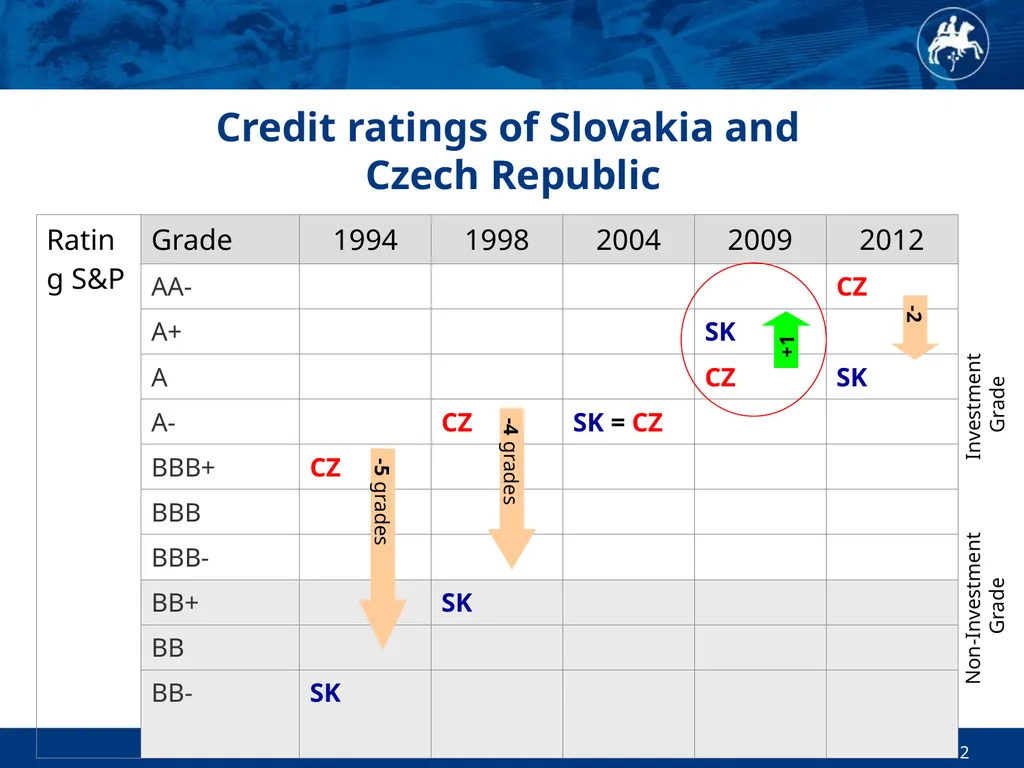
slide12. 12 Credit ratings of Slovakia and Czech Republic -5 grades -4 grades -2 +1 Non-Investment Grade Investment Grade<br>
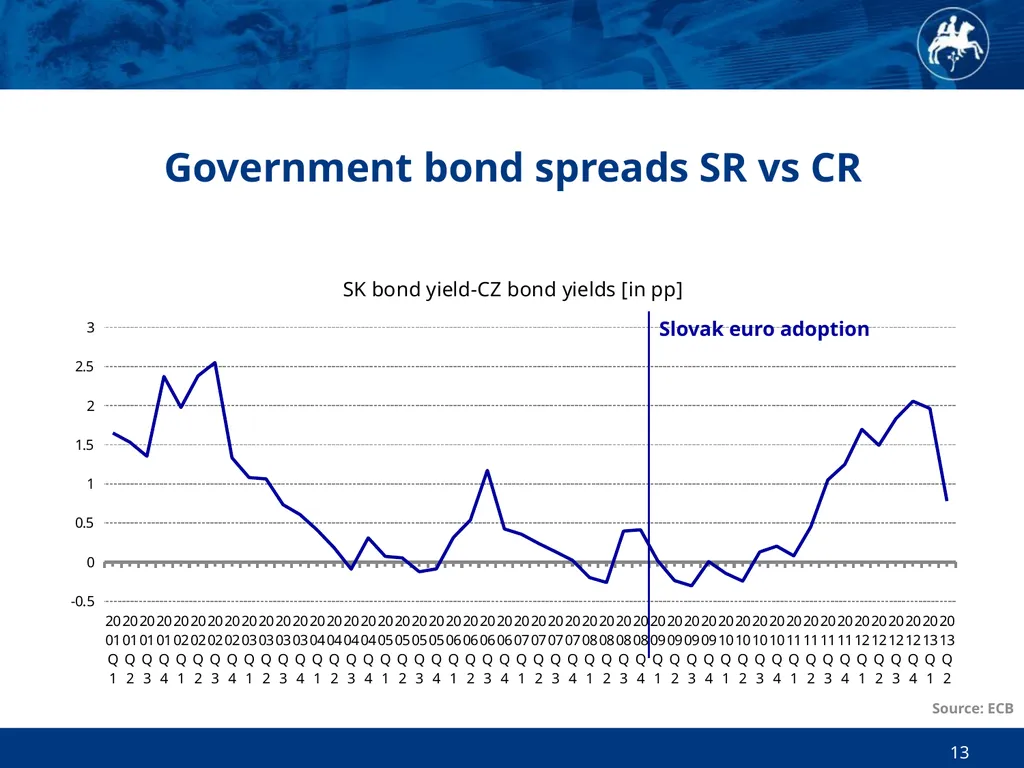
slide13. Government bond spreads SR vs CR 13 Slovak euro adoption Source: ECB<br>
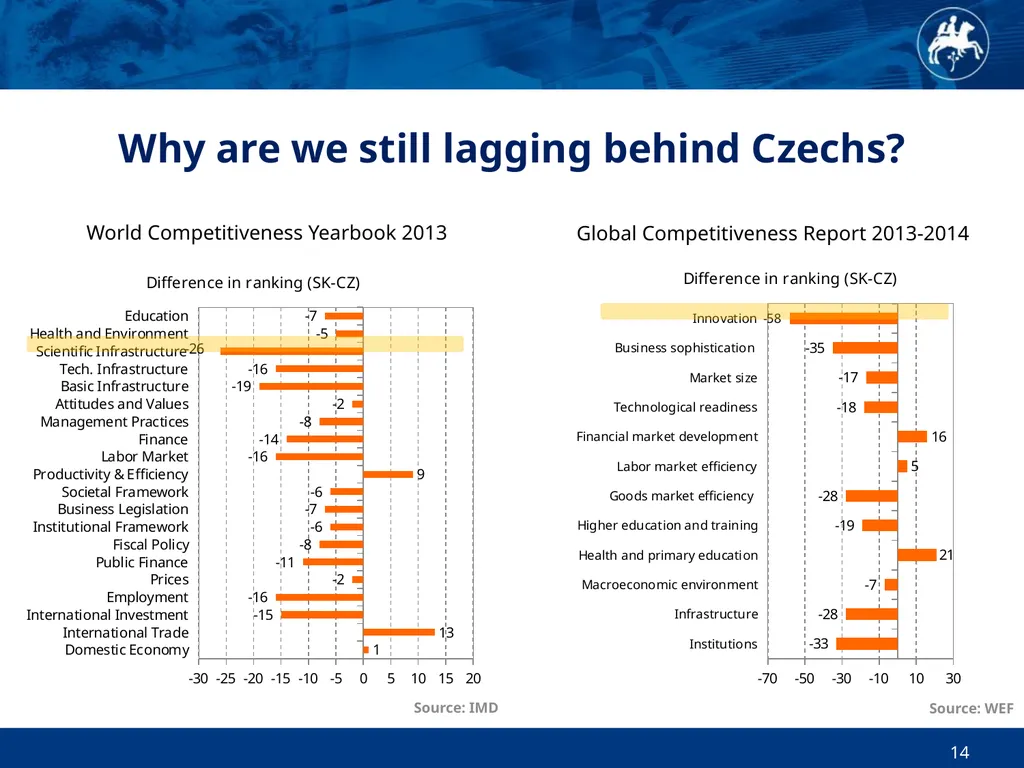
slide14. 14 Why are we still lagging behind Czechs? World Competitiveness Yearbook 2013 Global Competitiveness Report 2013-2014 Source: WEF Source: IMD<br>
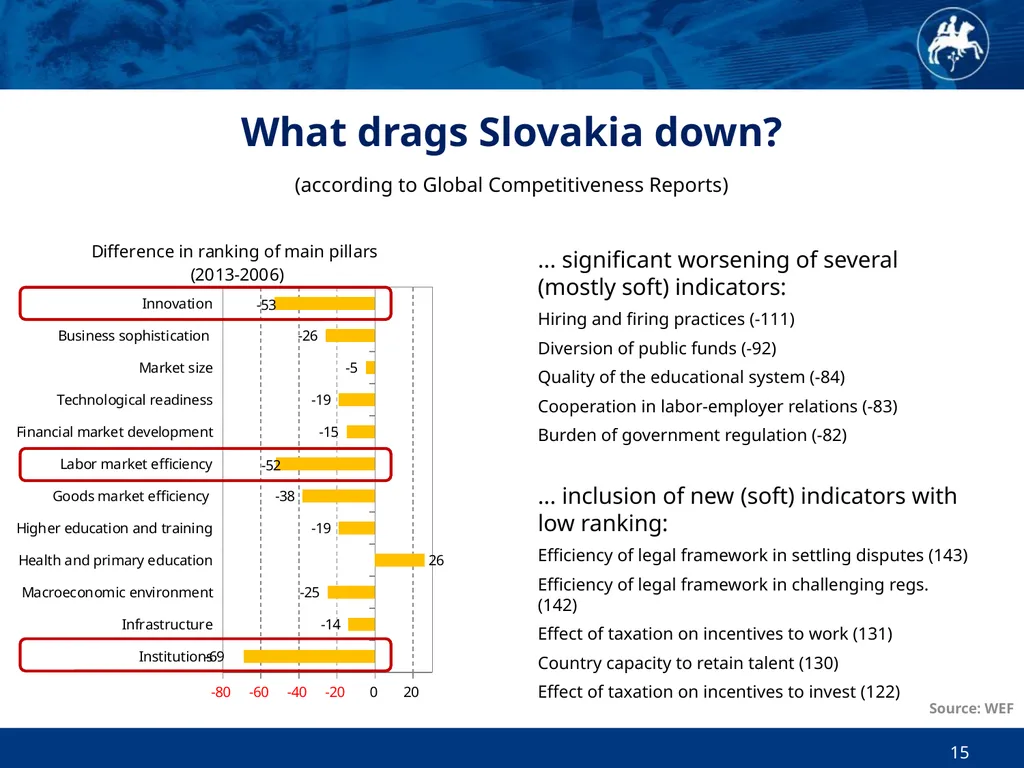
slide15. ... significant worsening of several (mostly soft) indicators:
Hiring and firing practices (-111)
Diversion of public funds (-92)
Quality of the educational system (-84)
Cooperation in labor-employer relations (-83)
Burden of government regulation (-82)
... inclusion of new (soft) indicators with low ranking:
Efficiency of legal framework in settling disputes (143)
Efficiency of legal framework in challenging regs. (142)
Effect of taxation on incentives to work (131)
Country capacity to retain talent (130)
Effect of taxation on incentives to invest (122) 15 What drags Slovakia down? (according to Global Competitiveness Reports) Source: WEF<br>
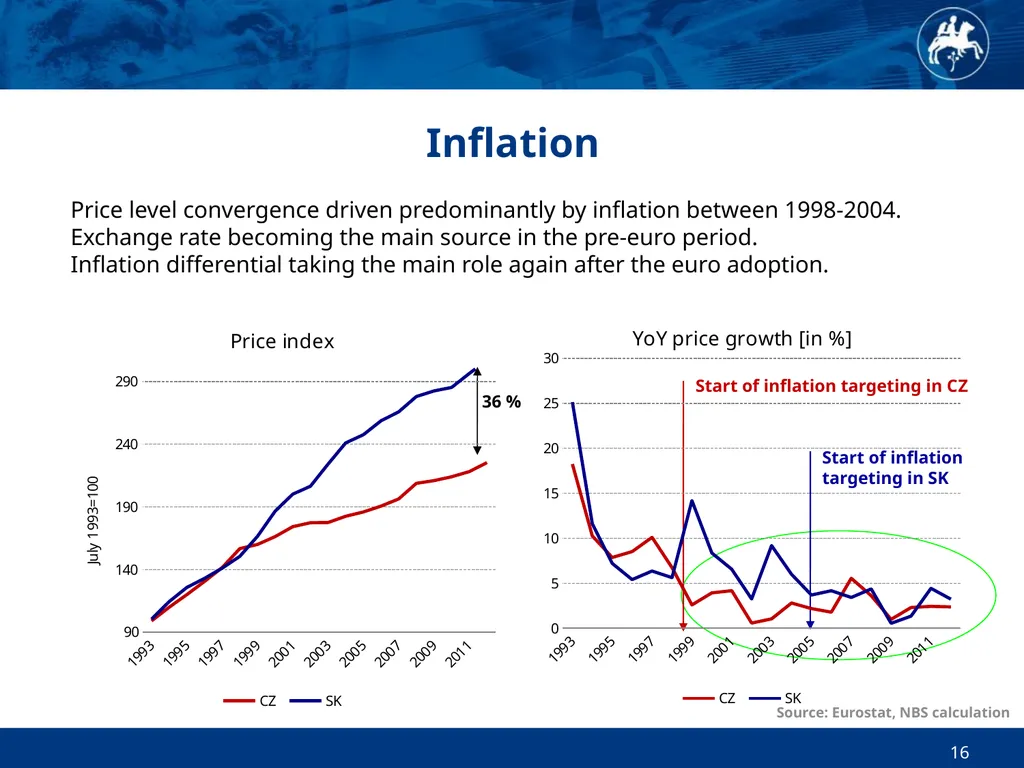
slide16. 16 Inflation Source: Eurostat, NBS calculation 36 % Start of inflation targeting in CZ Start of inflation targeting in SK Price level convergence driven predominantly by inflation between 1998-2004.
Exchange rate becoming the main source in the pre-euro period.
Inflation differential taking the main role again after the euro adoption.<br>
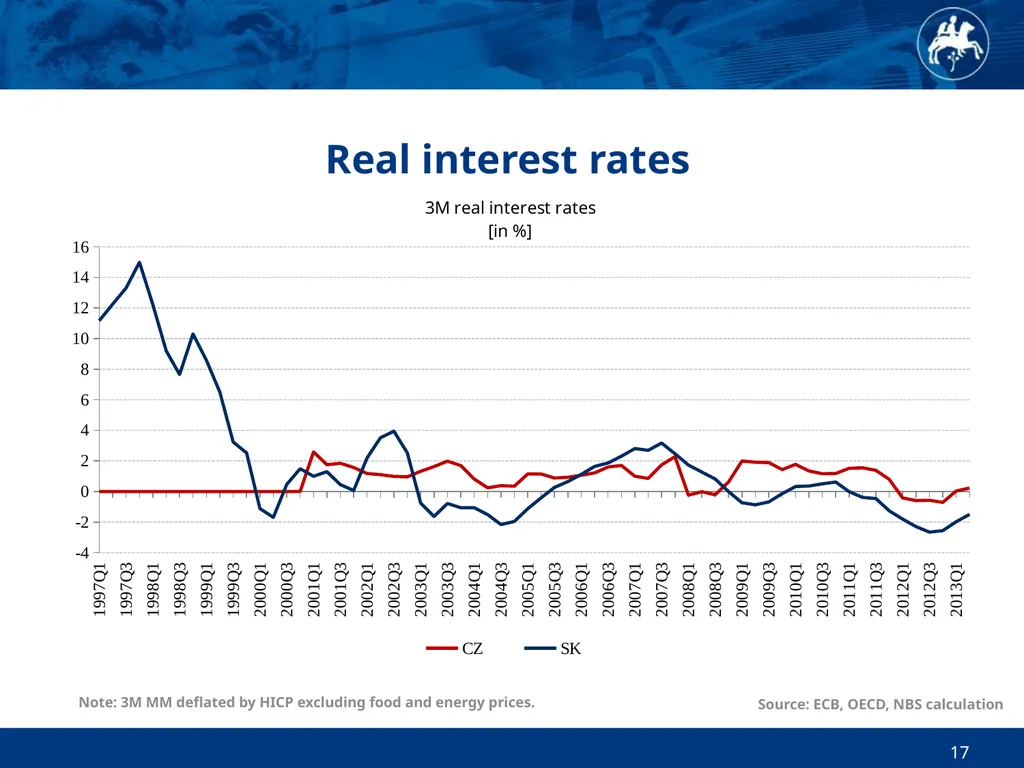
slide17. Real interest rates 17 Note: 3M MM deflated by HICP excluding food and energy prices. Source: ECB, OECD, NBS calculation<br>
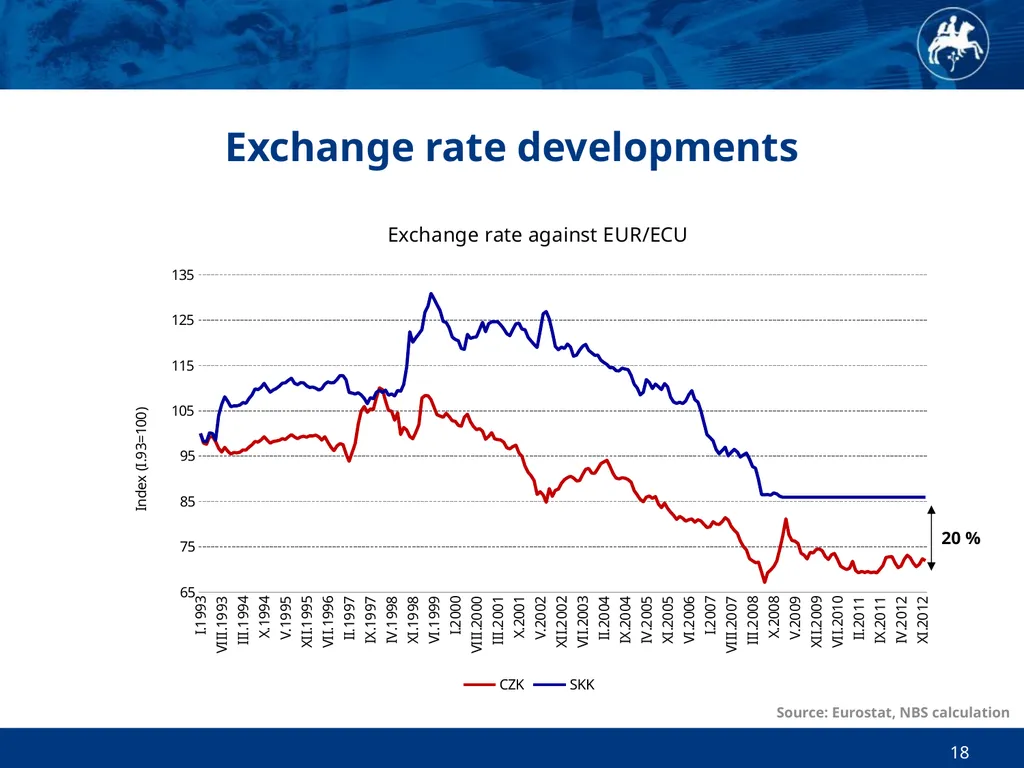
slide18. 18 Exchange rate developments Source: Eurostat, NBS calculation 20 %<br>
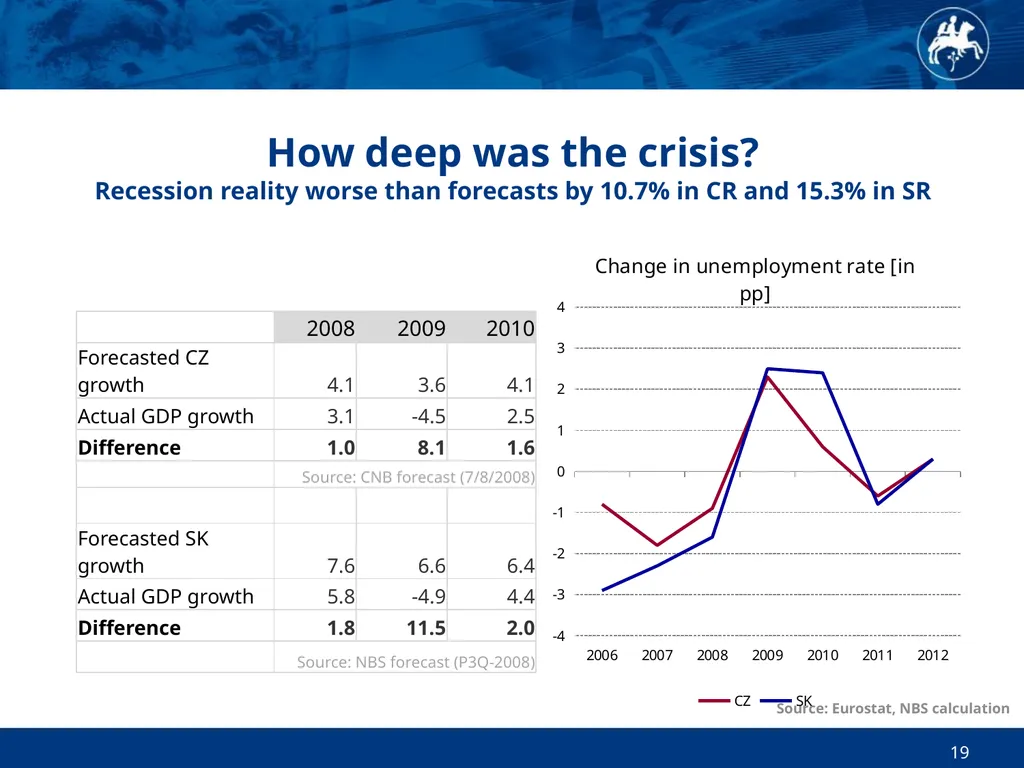
slide19. How deep was the crisis? Recession reality worse than forecasts by 10.7% in CR and 15.3% in SR 19 Source: Eurostat, NBS calculation<br>
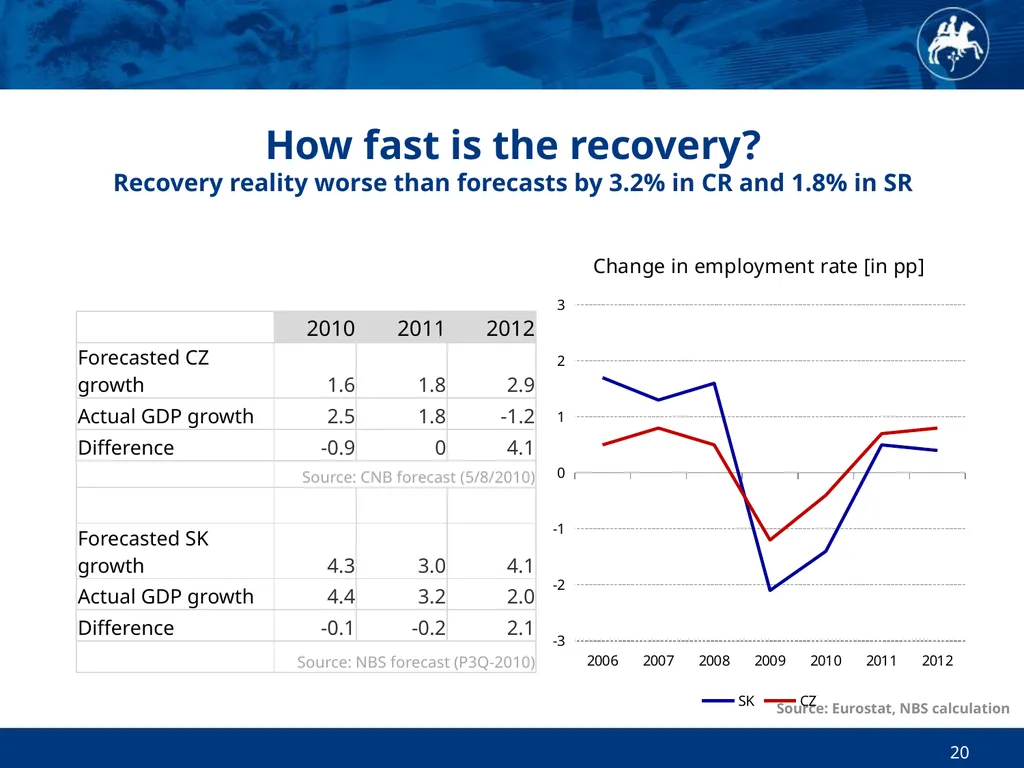
slide20. How fast is the recovery? Recovery reality worse than forecasts by 3.2% in CR and 1.8% in SR 20 Source: Eurostat, NBS calculation<br>
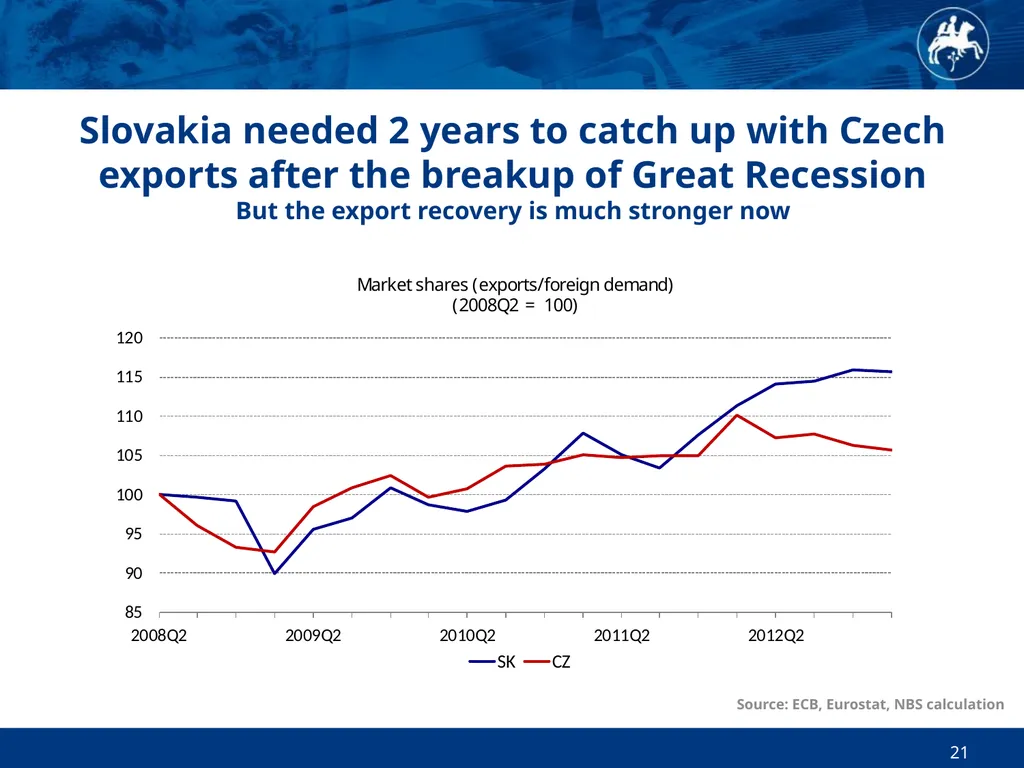
slide21. Slovakia needed 2 years to catch up with Czech exports after the breakup of Great Recession But the export recovery is much stronger now 21 Source: ECB, Eurostat, NBS calculation<br>
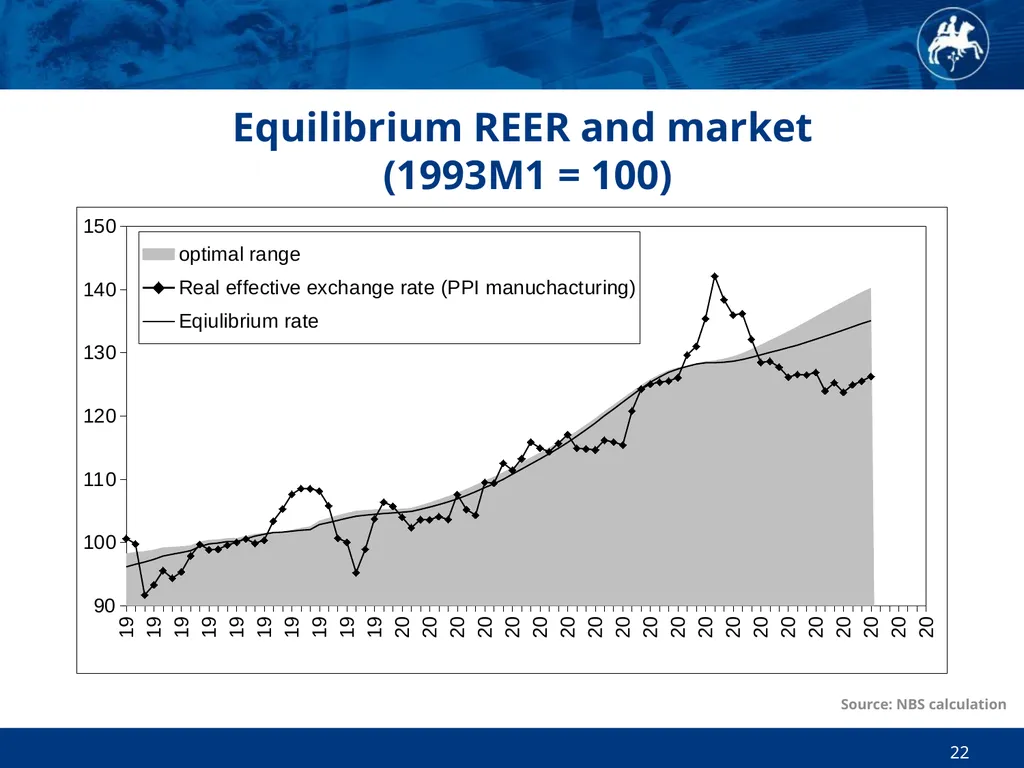
slide22. Equilibrium REER and market (1993M1 = 100) 22 Source: NBS calculation<br>
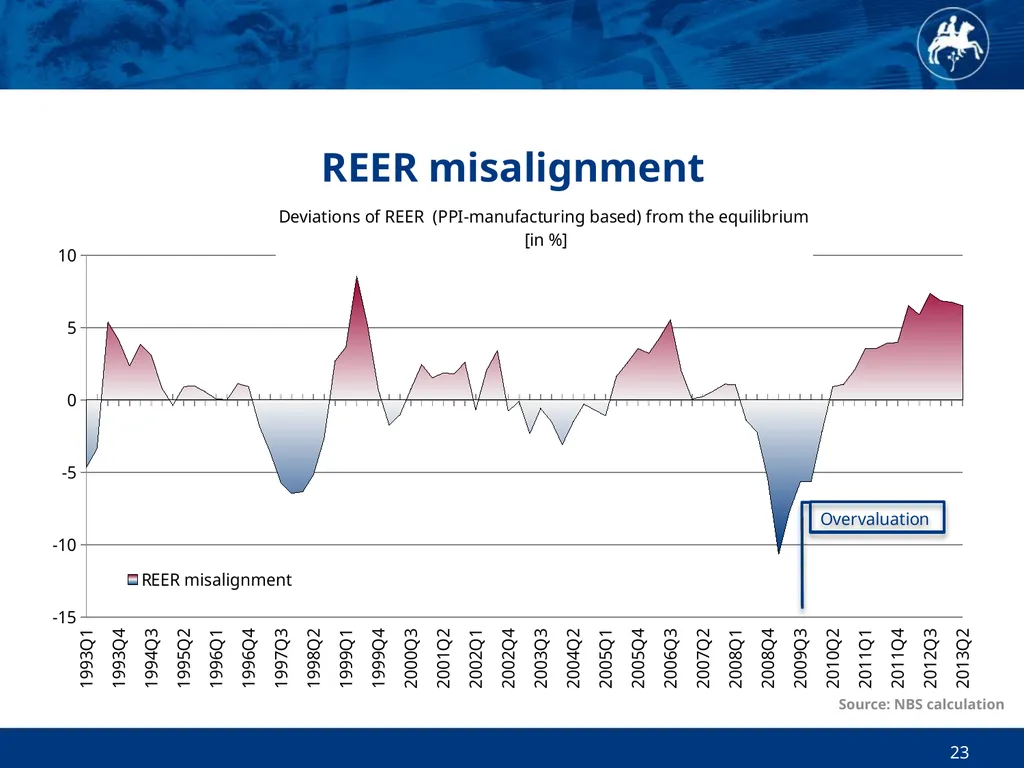
slide23. REER misalignment 23 Source: NBS calculation<br>
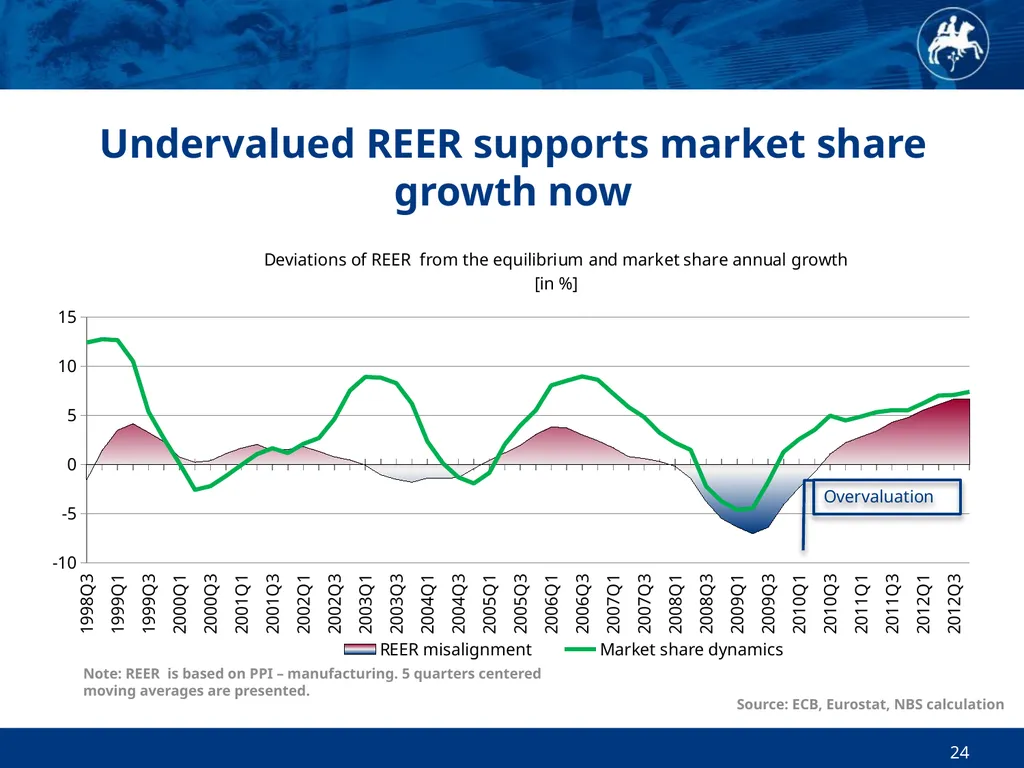
slide24. Undervalued REER supports market share growth now 24 Source: ECB, Eurostat, NBS calculation Note: REER is based on PPI – manufacturing. 5 quarters centered moving averages are presented.<br>
slide25. Slovak economy was supported mainly by the loose interest rate 25 Source: EC, ECB, OECD, NBS calculation Note: deflated with HICP excluding energy and food prices<br>
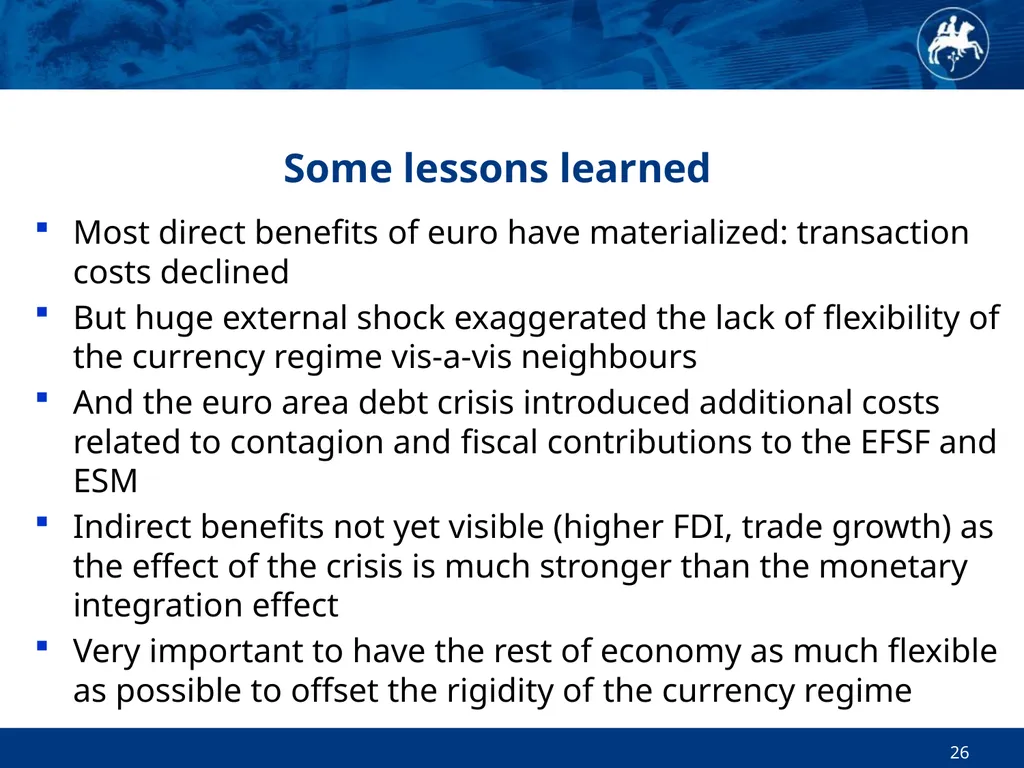
slide26. 26 Some lessons learned Most direct benefits of euro have materialized: transaction costs declined
But huge external shock exaggerated the lack of flexibility of the currency regime vis-a-vis neighbours
And the euro area debt crisis introduced additional costs related to contagion and fiscal contributions to the EFSF and ESM
Indirect benefits not yet visible (higher FDI, trade growth) as the effect of the crisis is much stronger than the monetary integration effect
Very important to have the rest of economy as much flexible as possible to offset the rigidity of the currency regime<br>
slide27. 27 Thank you for your attention<br>
Deputy Governor of the National Bank of Slovakia<br>
slide2. 2 Outline Slovakia - different phases of transition
Slovak vs. Czech Experience
„Looking back“ - selected economic indicators
Euro adoption and Great Recession<br>
slide3. 3 Different phases of transition Early transition - Federation
Meciar’s Era
Stabilization period, catch-up in integration processes
Big reform push period
Pre-euro
Euro (on the onset of Great Recession)<br>
slide4. 4 Early transition 1990-1993 1989-1992 economic policy within the Federation the same
The early transition had much greater impact on Slovak unemployment (more heavy industry focused on ex-Soviet markets), in 1992 exceeding 10% in SR vs. 2.6% in CR
New tax system (VAT introduced)
The currency fixed at 1:1 first, but the Slovak economy less competitive (creation of Slovak central bank, 10% devaluation in summer 1993)<br>
slide5. 5 Meciar’s Era 1994-1998 Little interest to attract FDI through privatization
First tight fiscal policy, later very loose (also due to issuance of government guarantees)
Twin deficits, fixed exchange rate regime protected by very high real interest rates, deteriorating loan portfolios of state banks
No OECD, NATO membership
EU membership likely to be postponed
Collapse of fixed exchange rate at the end of 1998<br>
slide6. 6 Stabilisation 1999-2002 Liberalisation of markets, high inflation and unemployment
Big push towards integration
OECD membership (2000)
Preparation for EU and NATO membership (2004)
Privatization of state banks including the cleaning up of loan portfolios (gross costs 10.6% of GDP, net 5.5% of GDP)
Opening up for FDI, big privatization improves foreign reserves as well as net foreign debt position<br>
slide7. 7 Big reform push 2003-2006 Flat tax, labor market liberalization, pension reform
Much greater visibility among investors
New capacities based on FDI mainly in autos and electronics
Strong sustainable real currency appreciation, inflation stabilization (inflation targeting regime)<br>
slide8. 8 Pre-euro period 2007-2008 Very high growth rate
Continuing currency appreciation
Flat tax, labor market liberalization, pension reform
Much greater visibility among investors
New FDI capacities expanding<br>
slide9. 9 EURO and Global Recession 2009- Greater slump, faster recovery
Ex-ante expected benefits of EURO adoption: Direct (immediate) benefits
elimination of exchange rate risk against euro
lower costs of capital
elimination of some transaction costs
better resistance to (currency) crises
higher price transparency Indirect (long-term) benefits
trade growth
increase of FDI
Resulting in faster growth/increase of living standards/progress in real convergence<br>
slide10. 10 Slovak vs. Czech experience Growth
Policy (ratings, bond spreads, structural indicators)
Inflation, interest rate
Exchange rate<br>
slide11. 11 GDP growth and convergence Real GDP index GDP per capita in PPP (SK/CZ) Source: Eurostat, NBS calculation, Fischer and Stirböck (2004) Note: Standard pace of convergence is assumed to be 2.4 % p.a. 60 bp 20 bp<br>
slide12. 12 Credit ratings of Slovakia and Czech Republic -5 grades -4 grades -2 +1 Non-Investment Grade Investment Grade<br>
slide13. Government bond spreads SR vs CR 13 Slovak euro adoption Source: ECB<br>
slide14. 14 Why are we still lagging behind Czechs? World Competitiveness Yearbook 2013 Global Competitiveness Report 2013-2014 Source: WEF Source: IMD<br>
slide15. ... significant worsening of several (mostly soft) indicators:
Hiring and firing practices (-111)
Diversion of public funds (-92)
Quality of the educational system (-84)
Cooperation in labor-employer relations (-83)
Burden of government regulation (-82)
... inclusion of new (soft) indicators with low ranking:
Efficiency of legal framework in settling disputes (143)
Efficiency of legal framework in challenging regs. (142)
Effect of taxation on incentives to work (131)
Country capacity to retain talent (130)
Effect of taxation on incentives to invest (122) 15 What drags Slovakia down? (according to Global Competitiveness Reports) Source: WEF<br>
slide16. 16 Inflation Source: Eurostat, NBS calculation 36 % Start of inflation targeting in CZ Start of inflation targeting in SK Price level convergence driven predominantly by inflation between 1998-2004.
Exchange rate becoming the main source in the pre-euro period.
Inflation differential taking the main role again after the euro adoption.<br>
slide17. Real interest rates 17 Note: 3M MM deflated by HICP excluding food and energy prices. Source: ECB, OECD, NBS calculation<br>
slide18. 18 Exchange rate developments Source: Eurostat, NBS calculation 20 %<br>
slide19. How deep was the crisis? Recession reality worse than forecasts by 10.7% in CR and 15.3% in SR 19 Source: Eurostat, NBS calculation<br>
slide20. How fast is the recovery? Recovery reality worse than forecasts by 3.2% in CR and 1.8% in SR 20 Source: Eurostat, NBS calculation<br>
slide21. Slovakia needed 2 years to catch up with Czech exports after the breakup of Great Recession But the export recovery is much stronger now 21 Source: ECB, Eurostat, NBS calculation<br>
slide22. Equilibrium REER and market (1993M1 = 100) 22 Source: NBS calculation<br>
slide23. REER misalignment 23 Source: NBS calculation<br>
slide24. Undervalued REER supports market share growth now 24 Source: ECB, Eurostat, NBS calculation Note: REER is based on PPI – manufacturing. 5 quarters centered moving averages are presented.<br>
slide25. Slovak economy was supported mainly by the loose interest rate 25 Source: EC, ECB, OECD, NBS calculation Note: deflated with HICP excluding energy and food prices<br>
slide26. 26 Some lessons learned Most direct benefits of euro have materialized: transaction costs declined
But huge external shock exaggerated the lack of flexibility of the currency regime vis-a-vis neighbours
And the euro area debt crisis introduced additional costs related to contagion and fiscal contributions to the EFSF and ESM
Indirect benefits not yet visible (higher FDI, trade growth) as the effect of the crisis is much stronger than the monetary integration effect
Very important to have the rest of economy as much flexible as possible to offset the rigidity of the currency regime<br>
slide27. 27 Thank you for your attention<br>