"EE529 Fall 2022 Chapter 01: Carbon Cycle Part-03" is the property of its rightful owner. Permission is granted to
download and print the materials on this website for personal, non-commercial use only, and to display it
on your personal computer provided you do not modify the materials and that you retain all copyright
notices contained in the materials. By downloading content from our website, you accept the terms of this
agreement.
Presentation Transcript
01
EE529 Fall 2022
Chapter 01: Carbon Cycle
Part-03 Prof. Ranga B. Myneni
(ranga.myneni@gmail.com) 1<br>
02
Global Carbon Cycle (IPCC, 2013)
Carbon Budgets
Spatial and Temporal Patterns
References Outline 2<br>
03
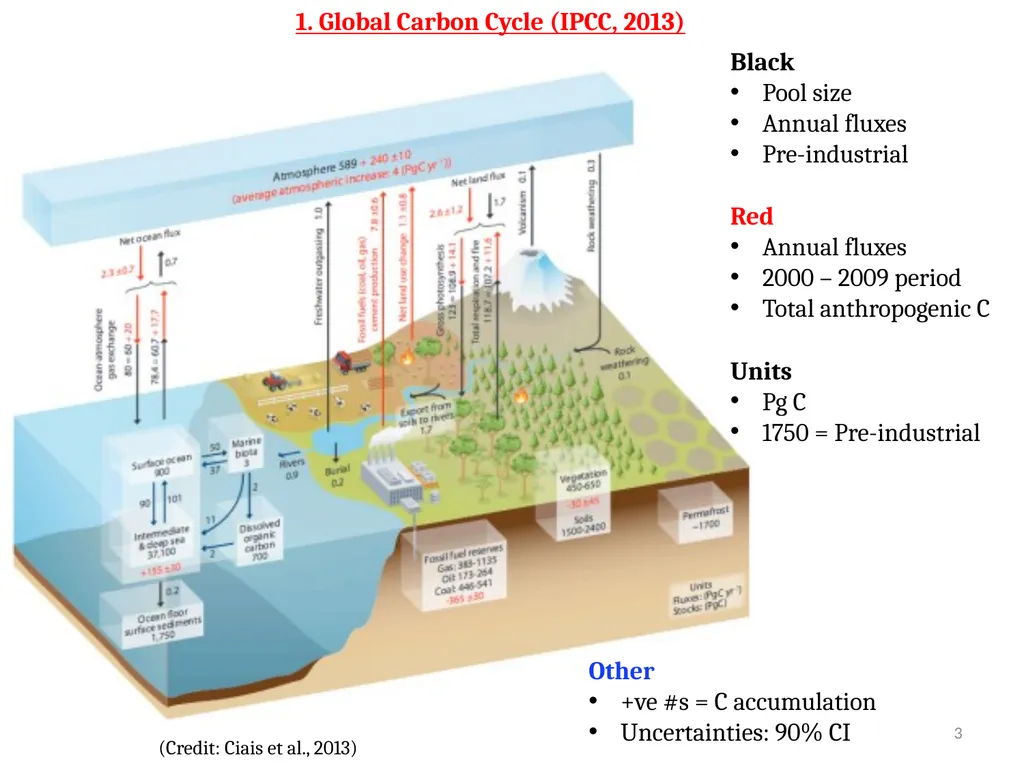
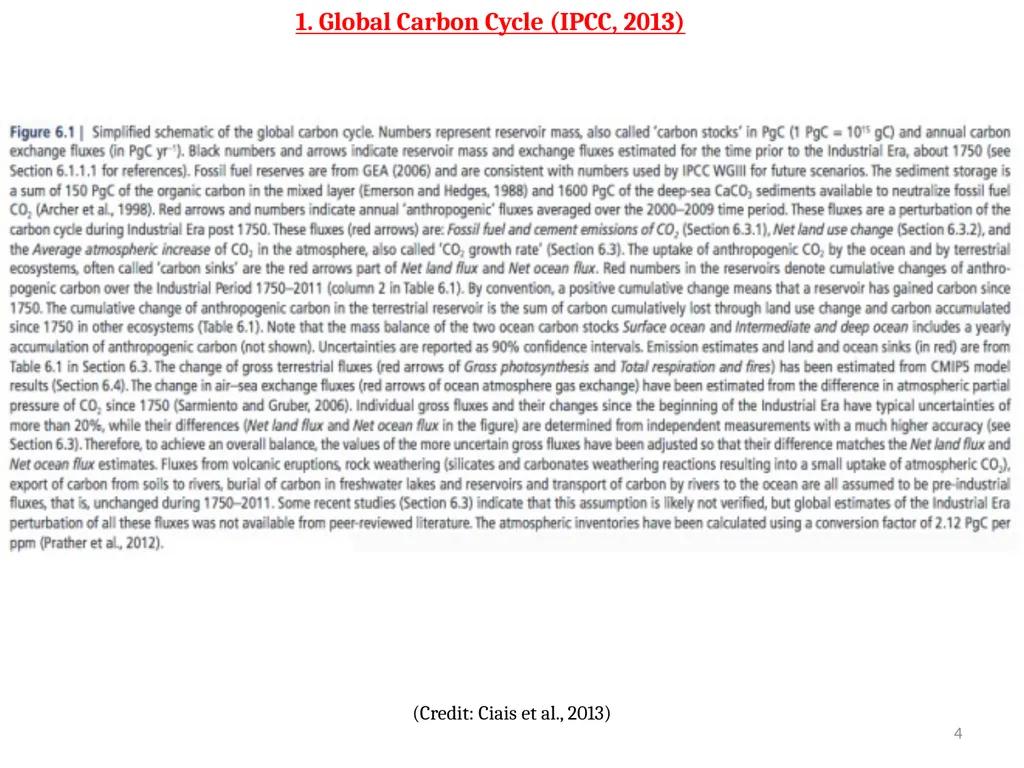
1. Global Carbon Cycle (IPCC, 2013) 3 (Credit: Ciais et al., 2013) Black
Pool size
Annual fluxes
Pre-industrial Red
Annual fluxes
2000 – 2009 period
Total anthropogenic C Other
+ve #s = C accumulation
Uncertainties: 90% CI Units
Pg C
1750 = Pre-industrial<br>
04
4 (Credit: Ciais et al., 2013) 1. Global Carbon Cycle (IPCC, 2013)<br>
05
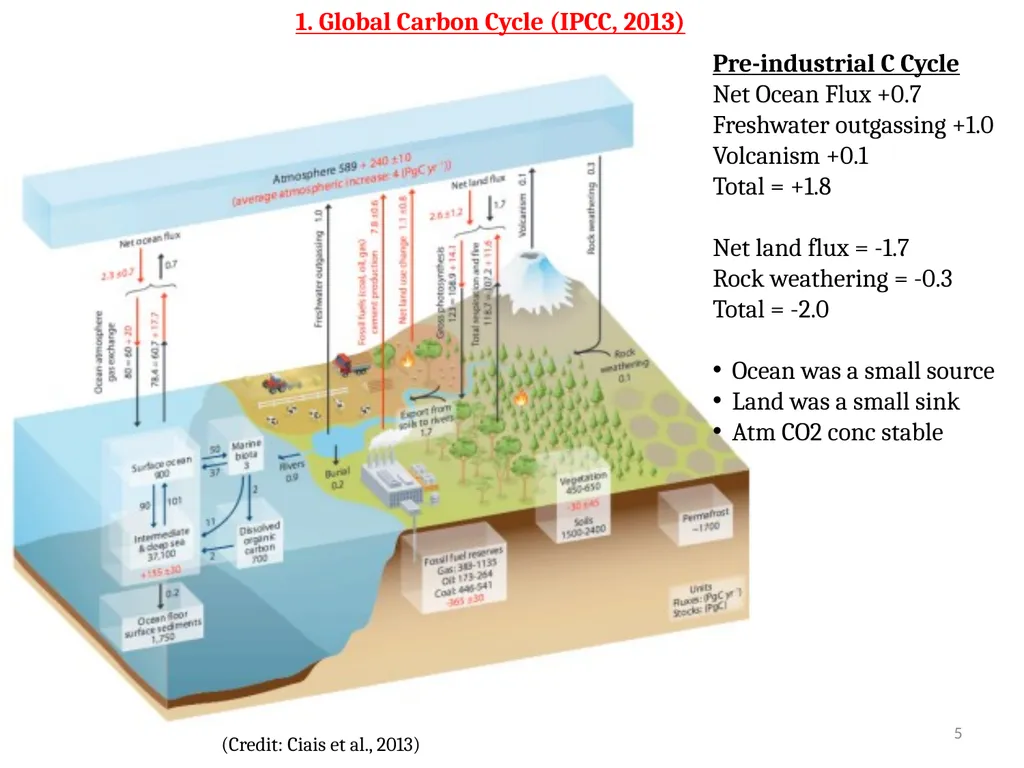
5 (Credit: Ciais et al., 2013) Pre-industrial C Cycle
Net Ocean Flux +0.7
Freshwater outgassing +1.0
Volcanism +0.1
Total = +1.8
Net land flux = -1.7
Rock weathering = -0.3
Total = -2.0
Ocean was a small source
Land was a small sink
Atm CO2 conc stable 1. Global Carbon Cycle (IPCC, 2013)<br>
06
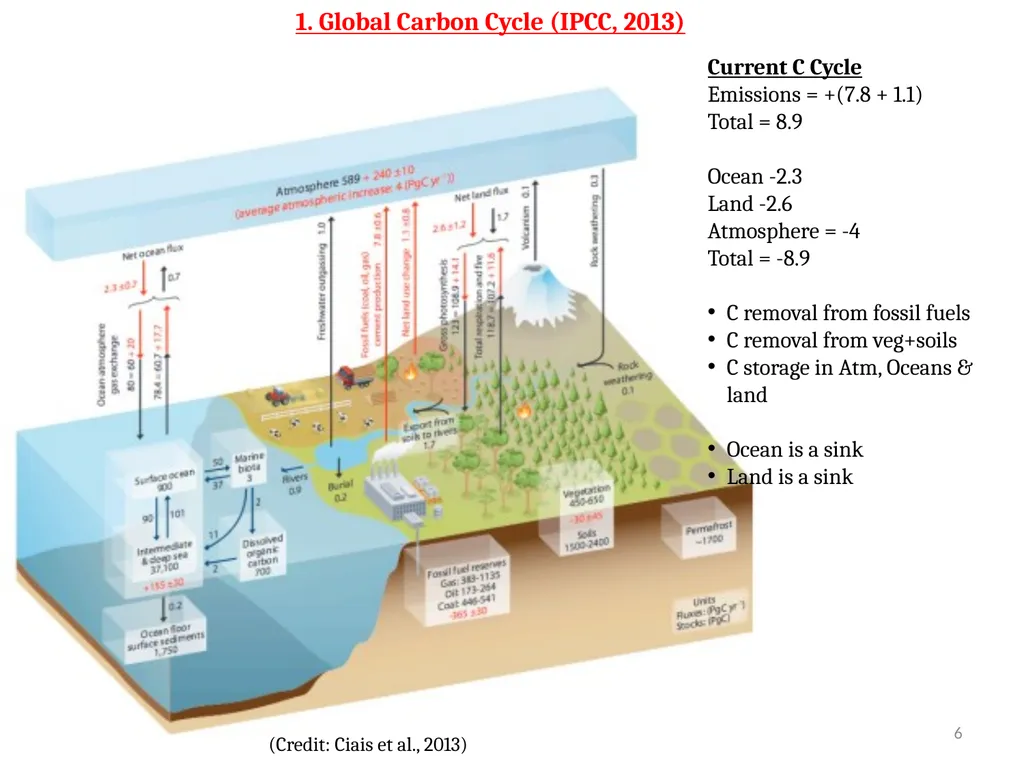
6 (Credit: Ciais et al., 2013) Current C Cycle
Emissions = +(7.8 + 1.1)
Total = 8.9
Ocean -2.3
Land -2.6
Atmosphere = -4
Total = -8.9
C removal from fossil fuels
C removal from veg+soils
C storage in Atm, Oceans & land
Ocean is a sink
Land is a sink 1. Global Carbon Cycle (IPCC, 2013)<br>
07
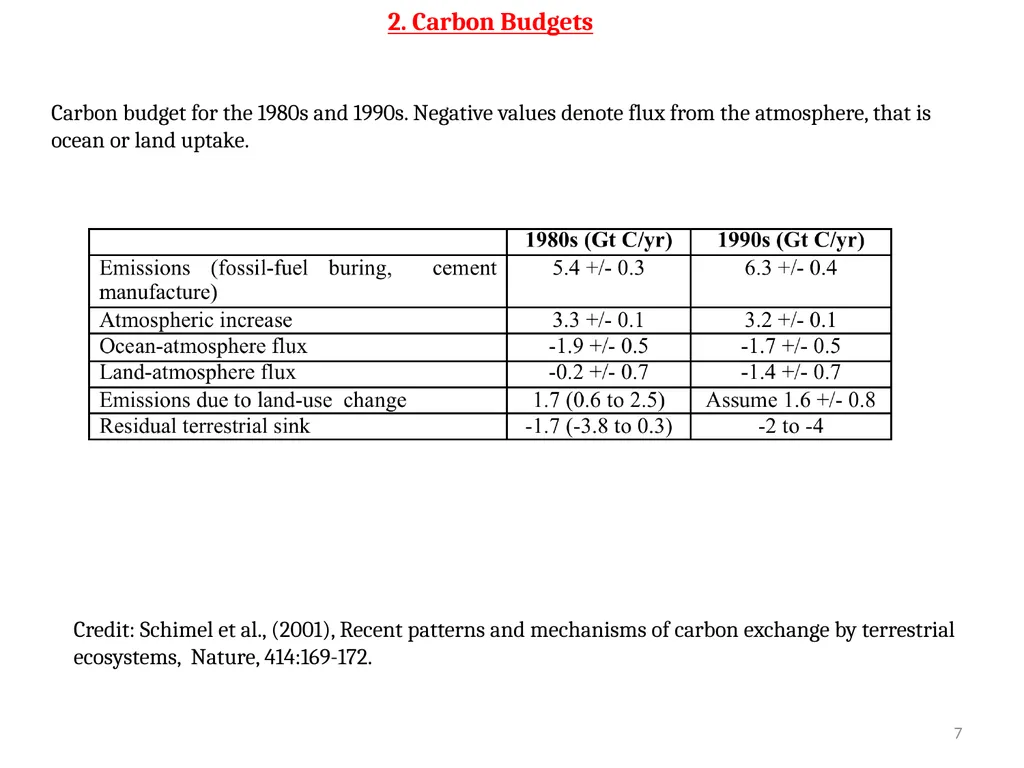
7 Carbon budget for the 1980s and 1990s. Negative values denote flux from the atmosphere, that is ocean or land uptake. 2. Carbon Budgets Credit: Schimel et al., (2001), Recent patterns and mechanisms of carbon exchange by terrestrial ecosystems, Nature, 414:169-172.<br>
08
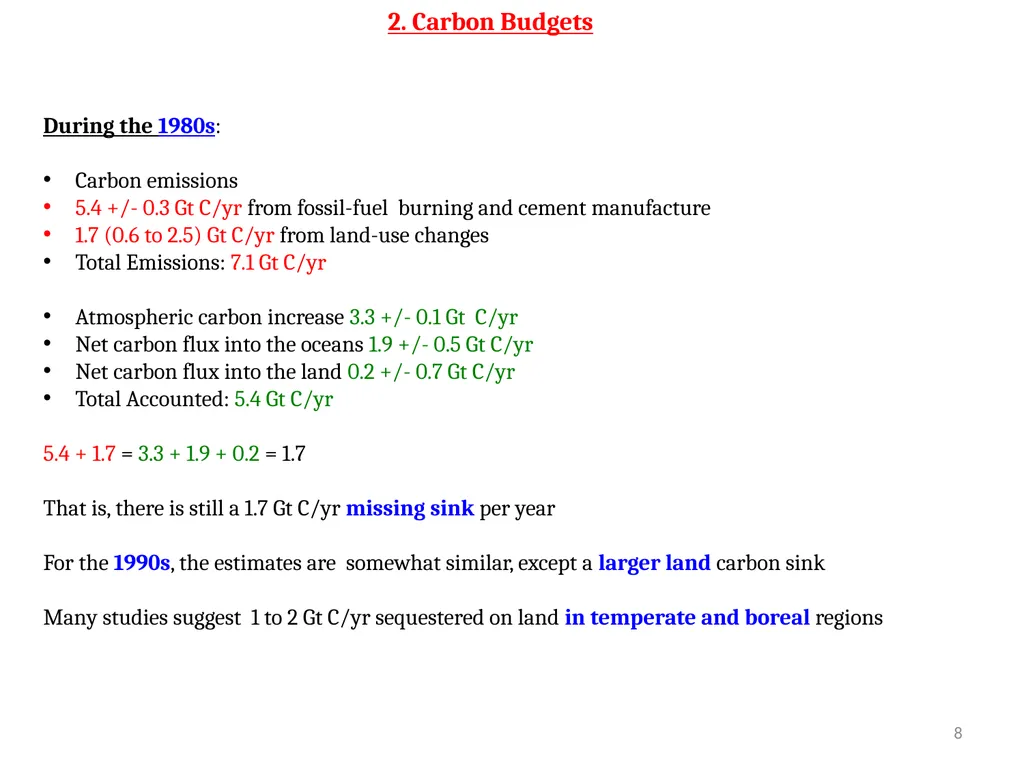
8 During the 1980s:
Carbon emissions
5.4 +/- 0.3 Gt C/yr from fossil-fuel burning and cement manufacture
1.7 (0.6 to 2.5) Gt C/yr from land-use changes
Total Emissions: 7.1 Gt C/yr
Atmospheric carbon increase 3.3 +/- 0.1 Gt C/yr
Net carbon flux into the oceans 1.9 +/- 0.5 Gt C/yr
Net carbon flux into the land 0.2 +/- 0.7 Gt C/yr
Total Accounted: 5.4 Gt C/yr
5.4 + 1.7 = 3.3 + 1.9 + 0.2 = 1.7
That is, there is still a 1.7 Gt C/yr missing sink per year
For the 1990s, the estimates are somewhat similar, except a larger land carbon sink
Many studies suggest 1 to 2 Gt C/yr sequestered on land in temperate and boreal regions 2. Carbon Budgets<br>
09
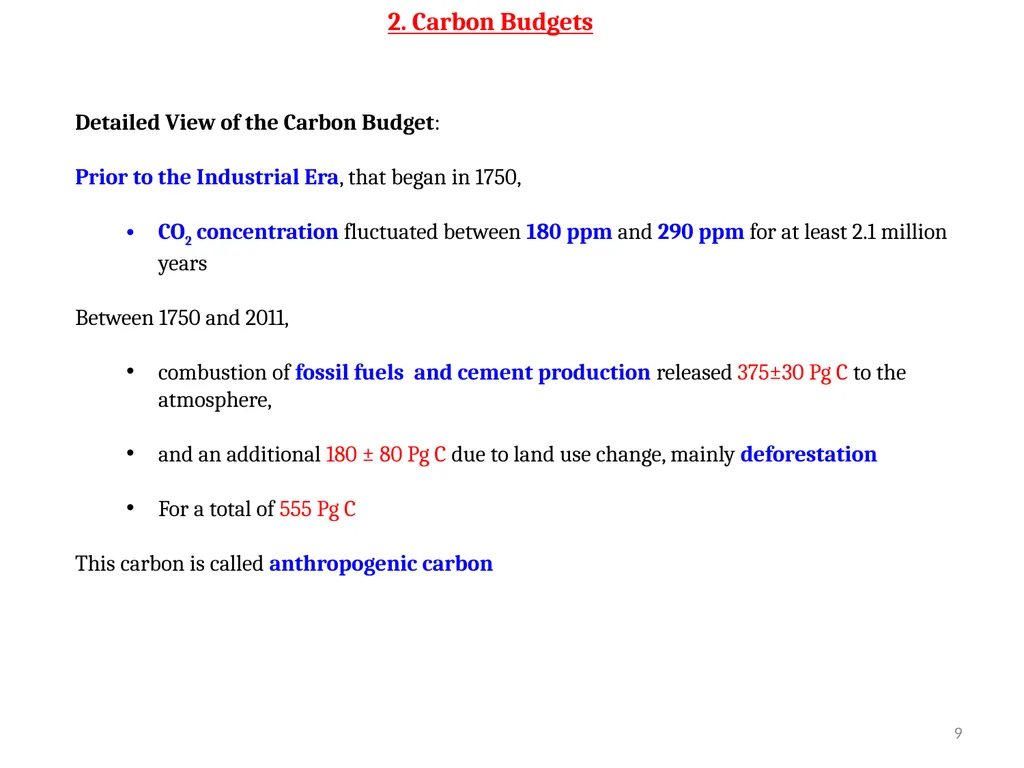
9 Detailed View of the Carbon Budget:
Prior to the Industrial Era, that began in 1750,
CO2 concentration fluctuated between 180 ppm and 290 ppm for at least 2.1 million years
Between 1750 and 2011,
combustion of fossil fuels and cement production released 375±30 Pg C to the atmosphere,
and an additional 180 ± 80 Pg C due to land use change, mainly deforestation
For a total of 555 Pg C
This carbon is called anthropogenic carbon 2. Carbon Budgets<br>
10
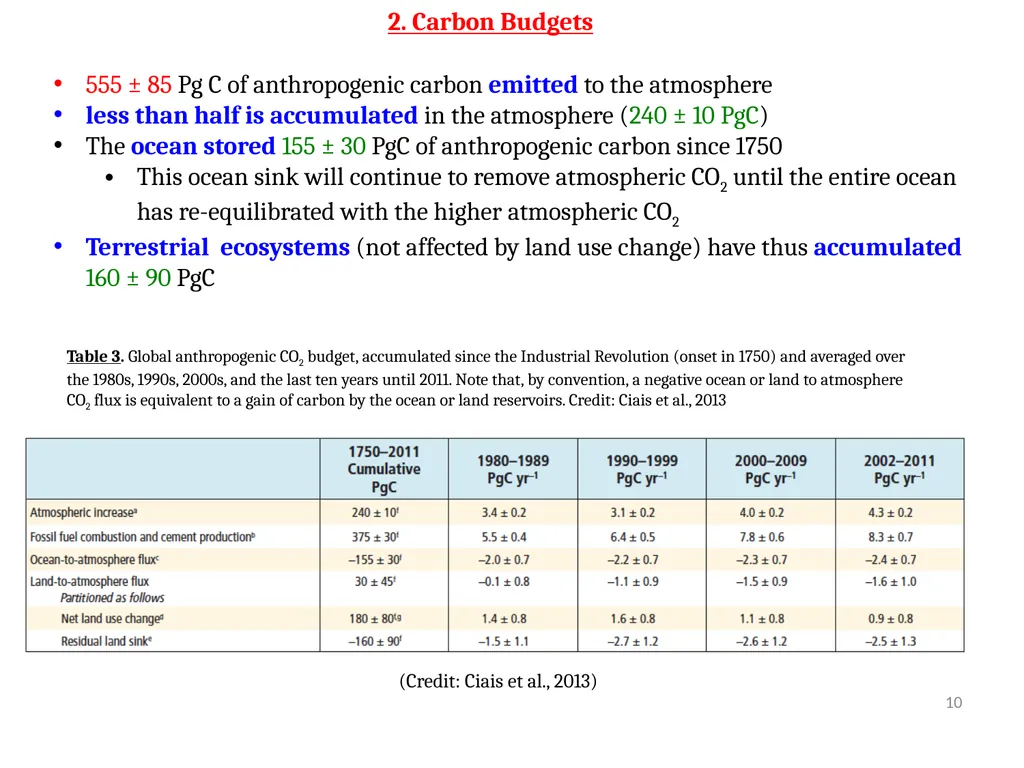
10 Table 3. Global anthropogenic CO2 budget, accumulated since the Industrial Revolution (onset in 1750) and averaged over the 1980s, 1990s, 2000s, and the last ten years until 2011. Note that, by convention, a negative ocean or land to atmosphere CO2 flux is equivalent to a gain of carbon by the ocean or land reservoirs. Credit: Ciais et al., 2013 555 ± 85 Pg C of anthropogenic carbon emitted to the atmosphere
less than half is accumulated in the atmosphere (240 ± 10 PgC)
The ocean stored 155 ± 30 PgC of anthropogenic carbon since 1750
This ocean sink will continue to remove atmospheric CO2 until the entire ocean has re-equilibrated with the higher atmospheric CO2
Terrestrial ecosystems (not affected by land use change) have thus accumulated 160 ± 90 PgC (Credit: Ciais et al., 2013) 2. Carbon Budgets<br>
11
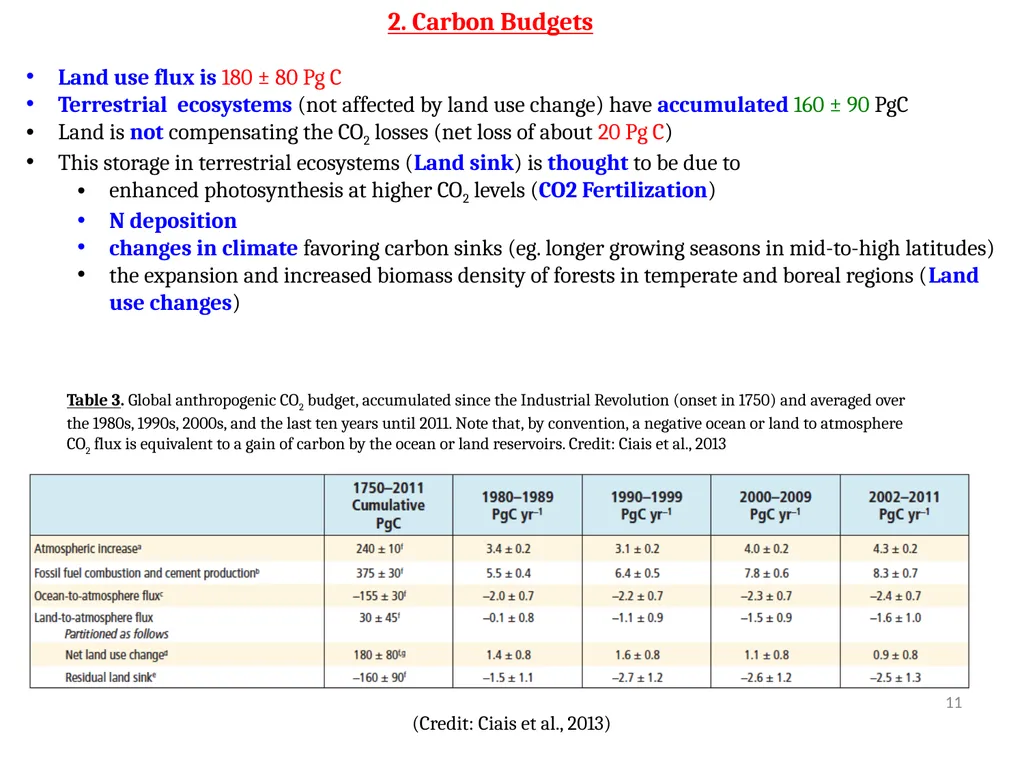
11 Table 3. Global anthropogenic CO2 budget, accumulated since the Industrial Revolution (onset in 1750) and averaged over the 1980s, 1990s, 2000s, and the last ten years until 2011. Note that, by convention, a negative ocean or land to atmosphere CO2 flux is equivalent to a gain of carbon by the ocean or land reservoirs. Credit: Ciais et al., 2013 Land use flux is 180 ± 80 Pg C
Terrestrial ecosystems (not affected by land use change) have accumulated 160 ± 90 PgC
Land is not compensating the CO2 losses (net loss of about 20 Pg C)
This storage in terrestrial ecosystems (Land sink) is thought to be due to
enhanced photosynthesis at higher CO2 levels (CO2 Fertilization)
N deposition
changes in climate favoring carbon sinks (eg. longer growing seasons in mid-to-high latitudes)
the expansion and increased biomass density of forests in temperate and boreal regions (Land use changes) (Credit: Ciais et al., 2013) 2. Carbon Budgets<br>
12
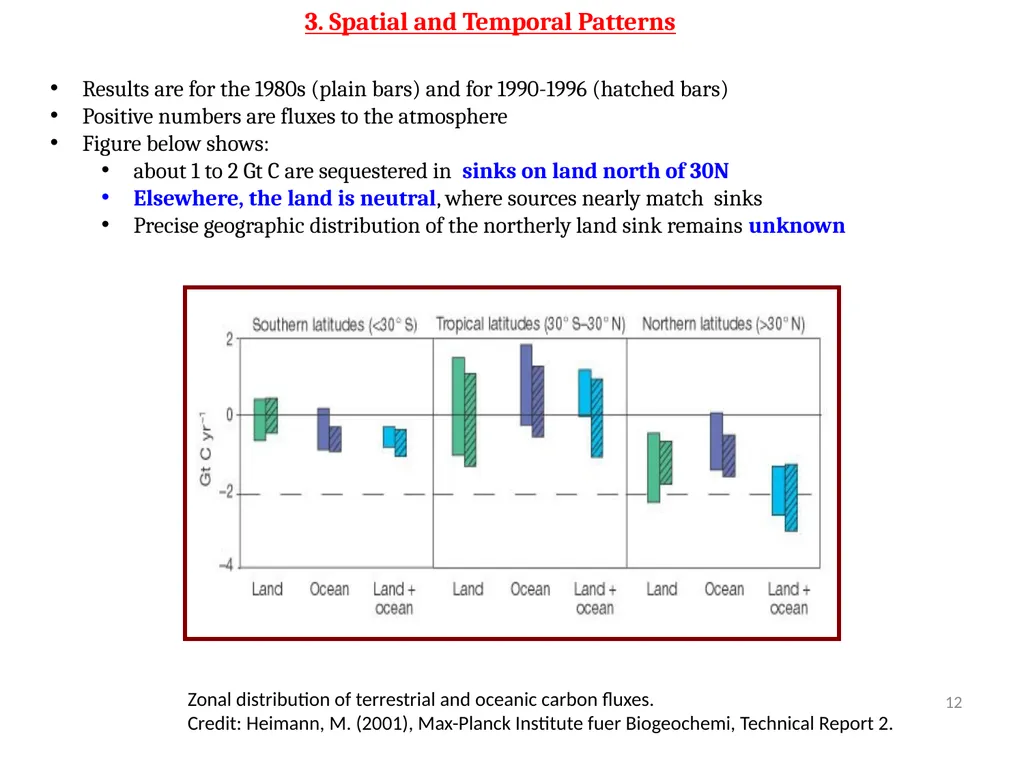
12 Results are for the 1980s (plain bars) and for 1990-1996 (hatched bars)
Positive numbers are fluxes to the atmosphere
Figure below shows:
about 1 to 2 Gt C are sequestered in sinks on land north of 30N
Elsewhere, the land is neutral, where sources nearly match sinks
Precise geographic distribution of the northerly land sink remains unknown Zonal distribution of terrestrial and oceanic carbon fluxes.
Credit: Heimann, M. (2001), Max-Planck Institute fuer Biogeochemi, Technical Report 2. 3. Spatial and Temporal Patterns<br>
13
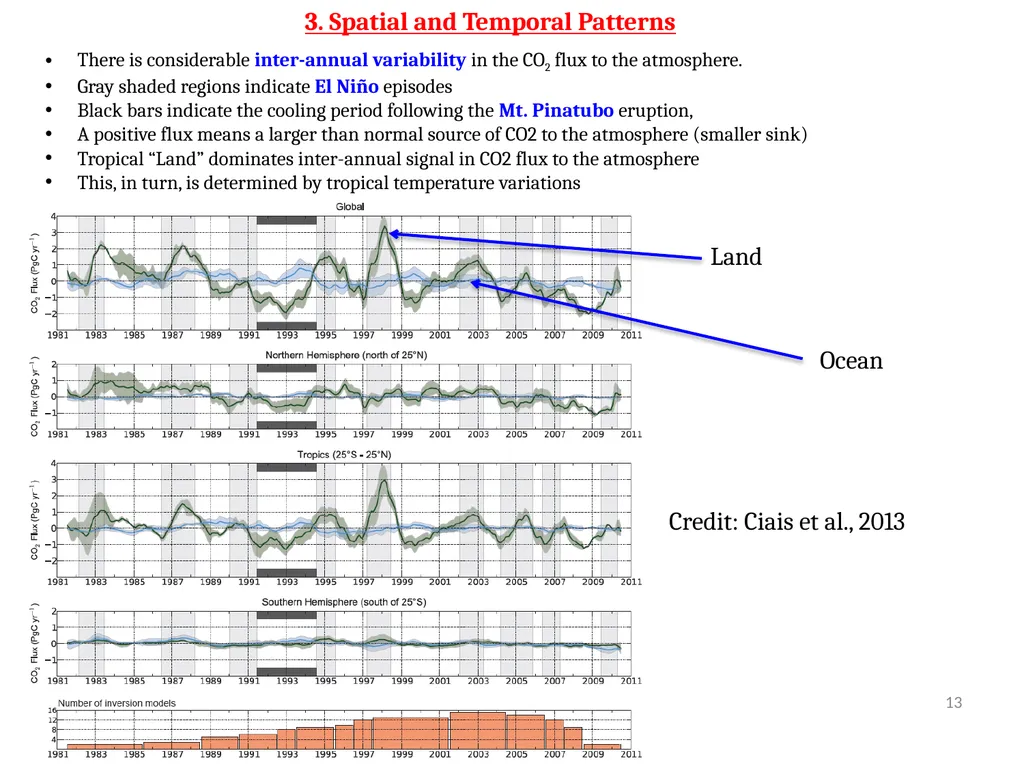
13 There is considerable inter-annual variability in the CO2 flux to the atmosphere.
Gray shaded regions indicate El Niño episodes
Black bars indicate the cooling period following the Mt. Pinatubo eruption,
A positive flux means a larger than normal source of CO2 to the atmosphere (smaller sink)
Tropical “Land” dominates inter-annual signal in CO2 flux to the atmosphere
This, in turn, is determined by tropical temperature variations Credit: Ciais et al., 2013 Land Ocean 3. Spatial and Temporal Patterns<br>
14
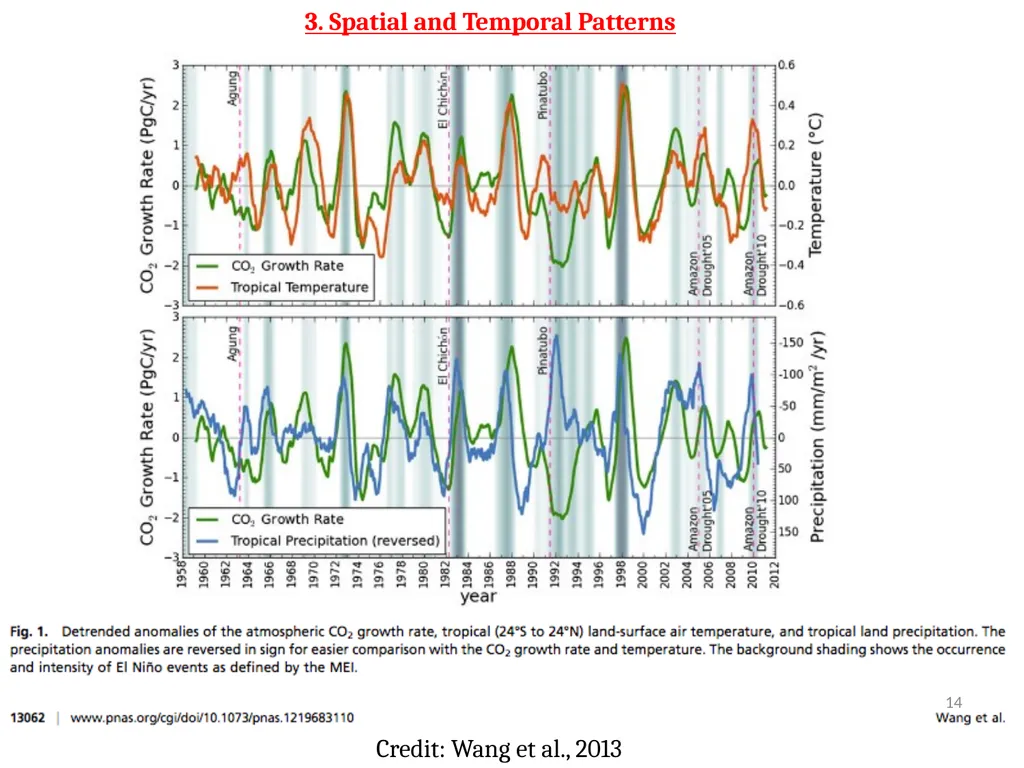
14 Credit: Wang et al., 2013 3. Spatial and Temporal Patterns<br>
15
4. References 15 Recommended Readings:
Ciais et al., 2013. Carbon and Other Biogeochemical Cycles, IPCC AR5 Chapter 6, 2013.<br>