
Elemental Analysis of Geological Samples Using
MS
Published · 34 slides · 0 views
1 / 1


Description
Elemental Analysis of Geological Samples Using X-Ray Fluorescence Spectrometry SPECTRO Analytical Instruments AMETEK Material Analysis Division Where to find SPECTRO 4 Elemental Analysis of Geological Samples Using XRF XRF basics
Related Topics
Share
Embed code
Download this presentation From Below
"Elemental Analysis of Geological Samples Using" is the property of its rightful owner. Permission is granted to download and print the materials on this website for personal, non-commercial use only, and to display it on your personal computer provided you do not modify the materials and that you retain all copyright notices contained in the materials. By downloading content from our website, you accept the terms of this agreement.
Presentation Transcript
01
Elemental Analysis of Geological Samples Using
X-Ray Fluorescence Spectrometry<br>
02
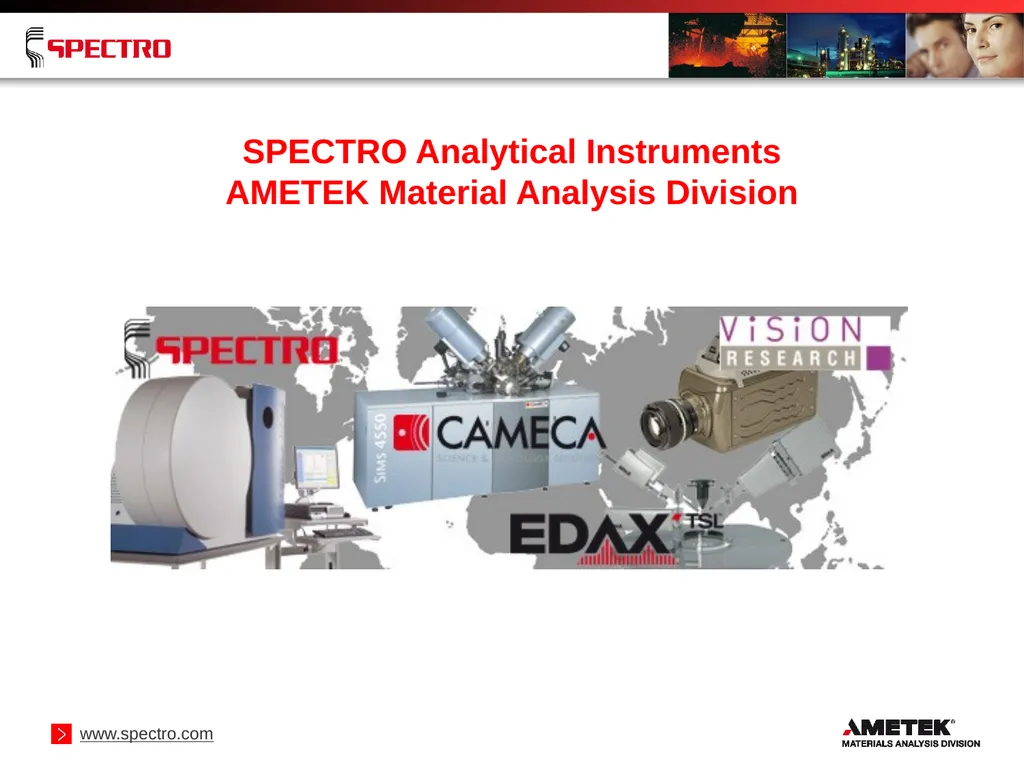
SPECTRO Analytical Instruments
AMETEK Material Analysis Division<br>
03
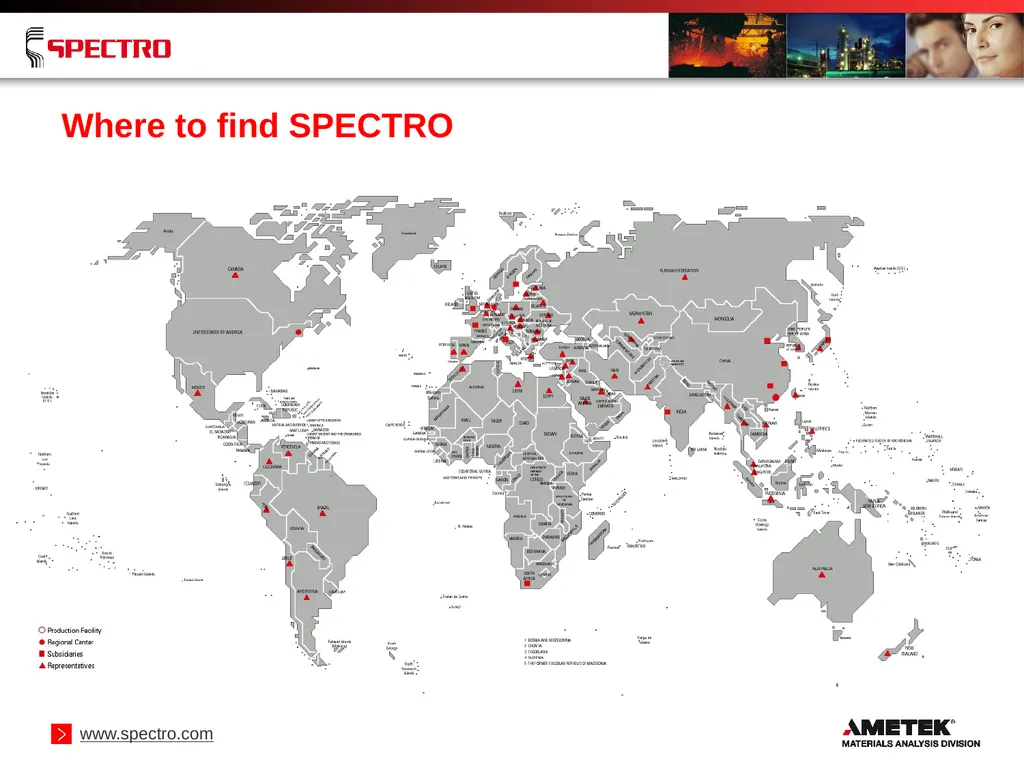
Where to find SPECTRO<br>
04
4 Elemental Analysis of Geological Samples Using XRF XRF basics
Attenuation length of X-rays
Analysis of “light” elements Z < 11
Grain size effects
Mineralogical effects
Sample preparation as fused bead
Analysis of elements 11 ≤ Z ≤ 22
Sample preparation as pressed pellet
Analysis of elements 22 < Z ≤ 92
Onsite analysis<br>
Attenuation length of X-rays
Analysis of “light” elements Z < 11
Grain size effects
Mineralogical effects
Sample preparation as fused bead
Analysis of elements 11 ≤ Z ≤ 22
Sample preparation as pressed pellet
Analysis of elements 22 < Z ≤ 92
Onsite analysis<br>
05
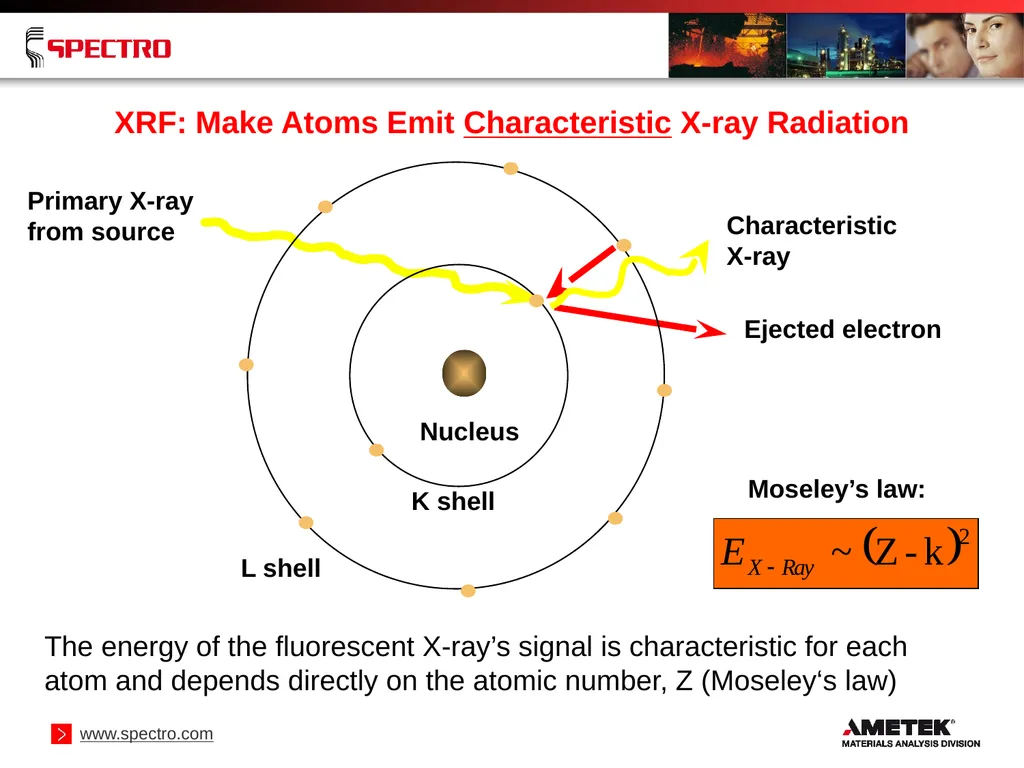
XRF: Make Atoms Emit Characteristic X-ray Radiation The energy of the fluorescent X-ray’s signal is characteristic for each atom and depends directly on the atomic number, Z (Moseley‘s law) Primary X-ray
from source Nucleus K shell L shell Ejected electron Characteristic
X-ray<br>
from source Nucleus K shell L shell Ejected electron Characteristic
X-ray<br>
06
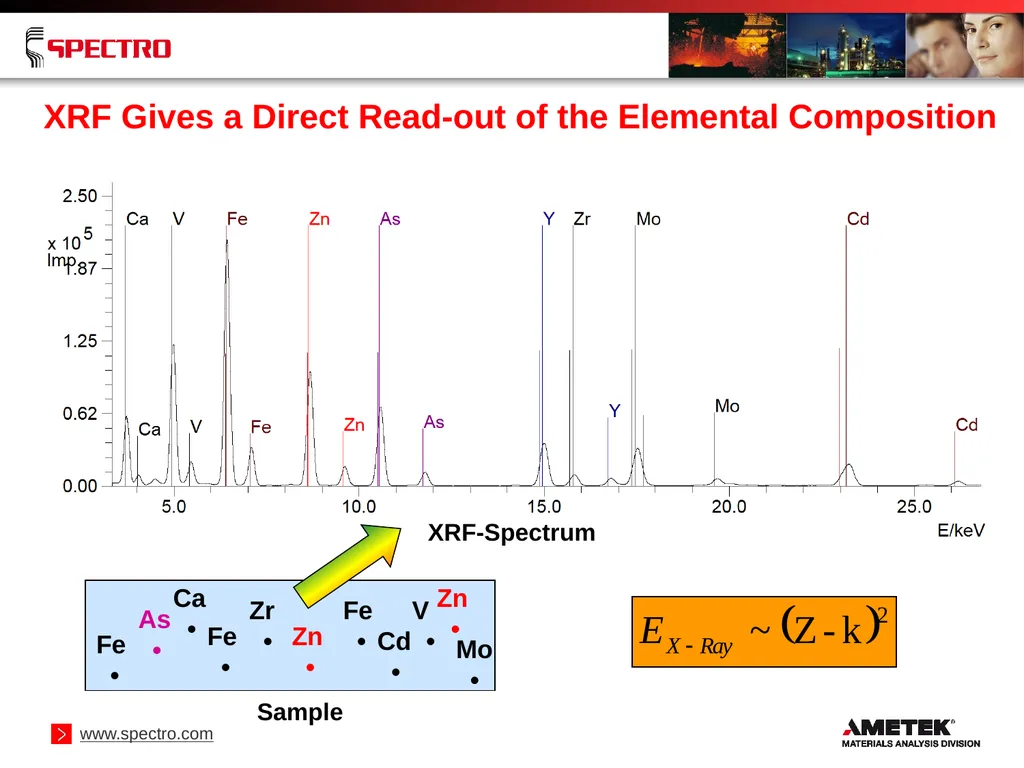
XRF Gives a Direct Read-out of the Elemental Composition As
• Ca
• Fe
• Fe
• Zr
• Zn
• Fe
• Cd
• V
• Mo
• Zn
• Sample<br>
• Ca
• Fe
• Fe
• Zr
• Zn
• Fe
• Cd
• V
• Mo
• Zn
• Sample<br>
07
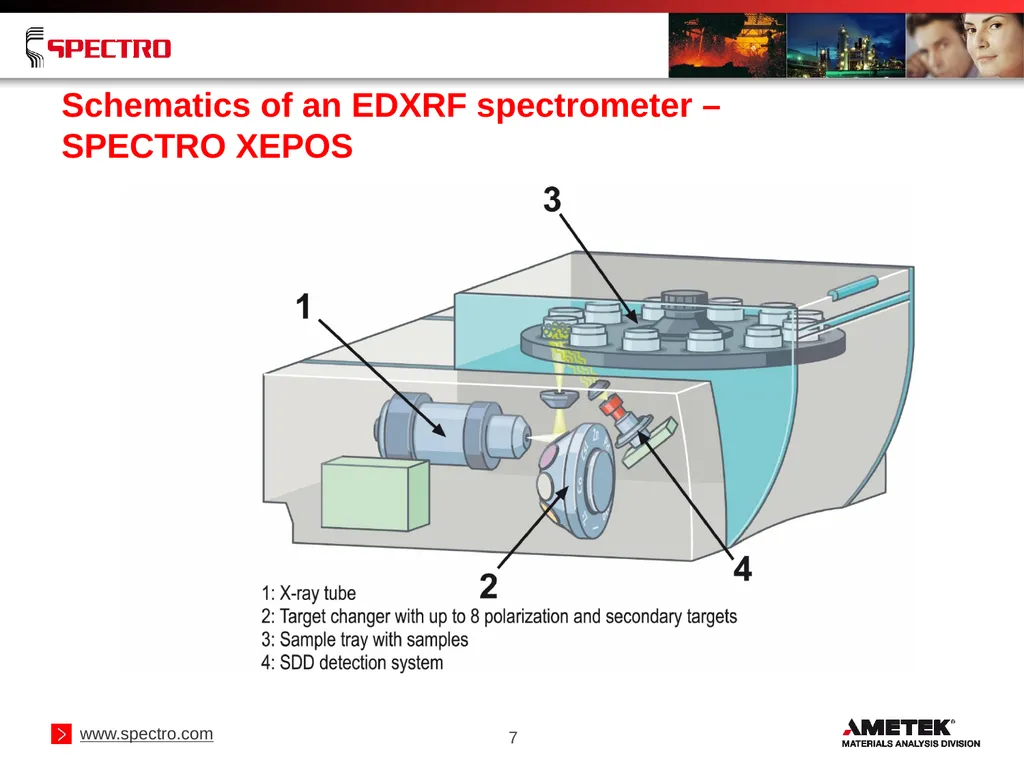
Schematics of an EDXRF spectrometer –
SPECTRO XEPOS 7<br>
08
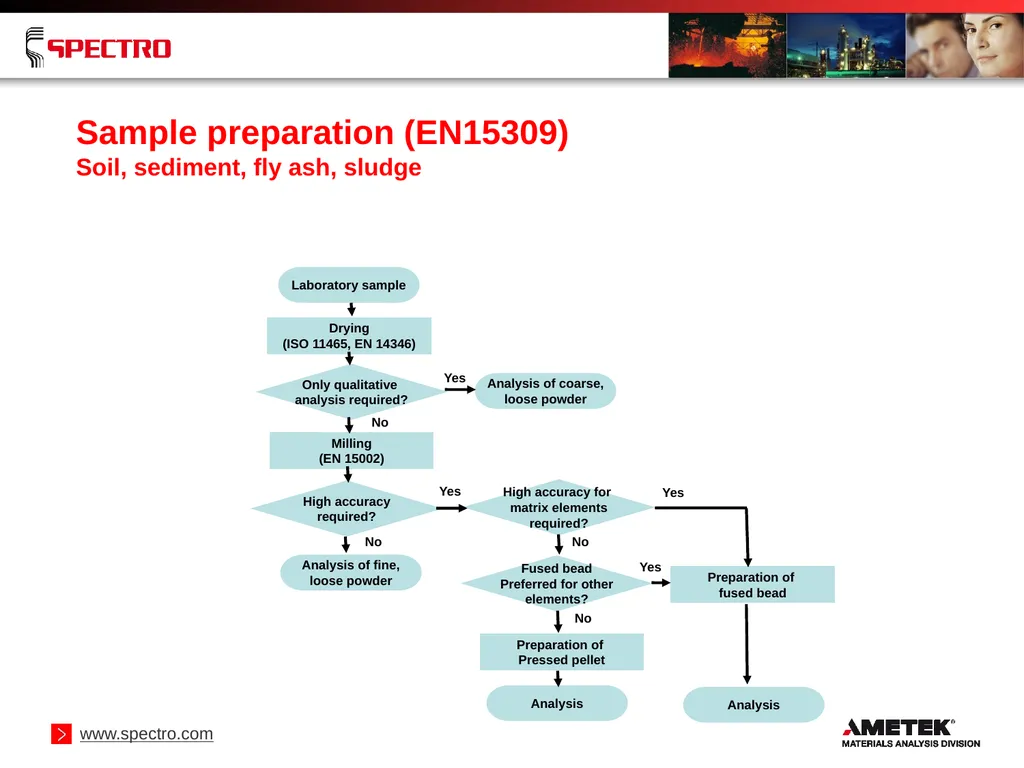
Sample preparation (EN15309)
Soil, sediment, fly ash, sludge Laboratory sample Drying
(ISO 11465, EN 14346) Only qualitative
analysis required? Analysis of coarse,
loose powder Milling
(EN 15002) High accuracy
required? High accuracy for
matrix elements
required? Analysis of fine,
loose powder Fused bead
Preferred for other
elements? Preparation of
fused bead Preparation of
Pressed pellet Analysis Analysis Yes No No Yes Yes Yes No No<br>
(ISO 11465, EN 14346) Only qualitative
analysis required? Analysis of coarse,
loose powder Milling
(EN 15002) High accuracy
required? High accuracy for
matrix elements
required? Analysis of fine,
loose powder Fused bead
Preferred for other
elements? Preparation of
fused bead Preparation of
Pressed pellet Analysis Analysis Yes No No Yes Yes Yes No No<br>
09
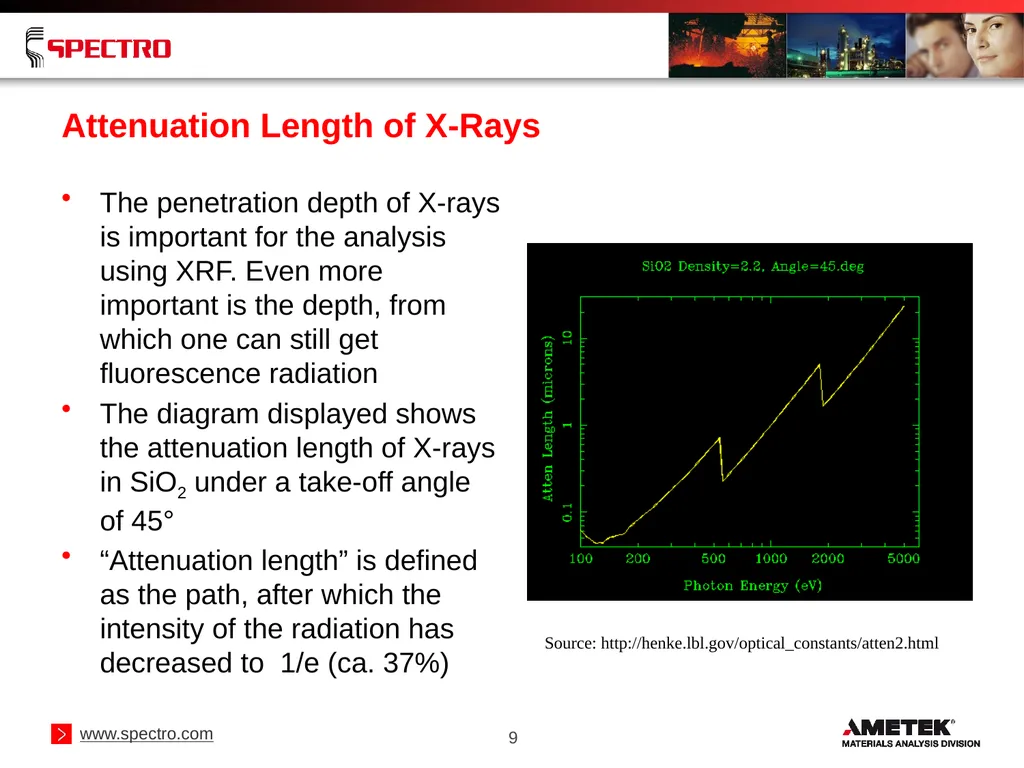
9 Attenuation Length of X-Rays The penetration depth of X-rays is important for the analysis using XRF. Even more important is the depth, from which one can still get fluorescence radiation
The diagram displayed shows the attenuation length of X-rays in SiO2 under a take-off angle of 45°
“Attenuation length” is defined as the path, after which the intensity of the radiation has decreased to 1/e (ca. 37%) Source: http://henke.lbl.gov/optical_constants/atten2.html<br>
The diagram displayed shows the attenuation length of X-rays in SiO2 under a take-off angle of 45°
“Attenuation length” is defined as the path, after which the intensity of the radiation has decreased to 1/e (ca. 37%) Source: http://henke.lbl.gov/optical_constants/atten2.html<br>
10
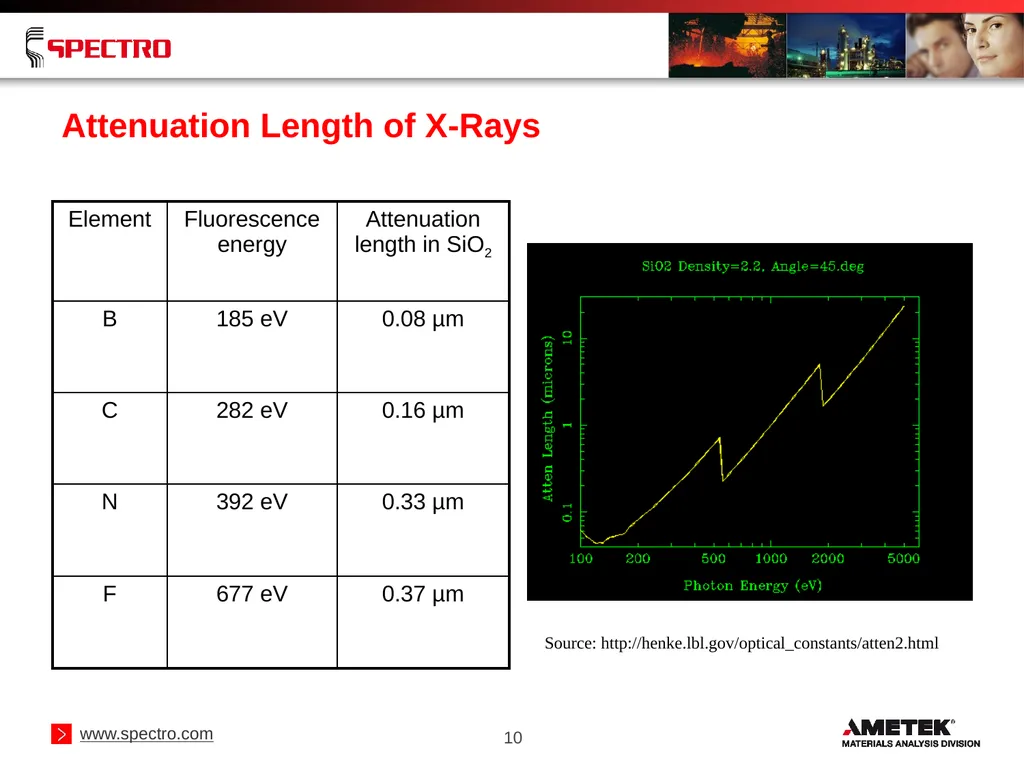
10 Attenuation Length of X-Rays Source: http://henke.lbl.gov/optical_constants/atten2.html<br>
11
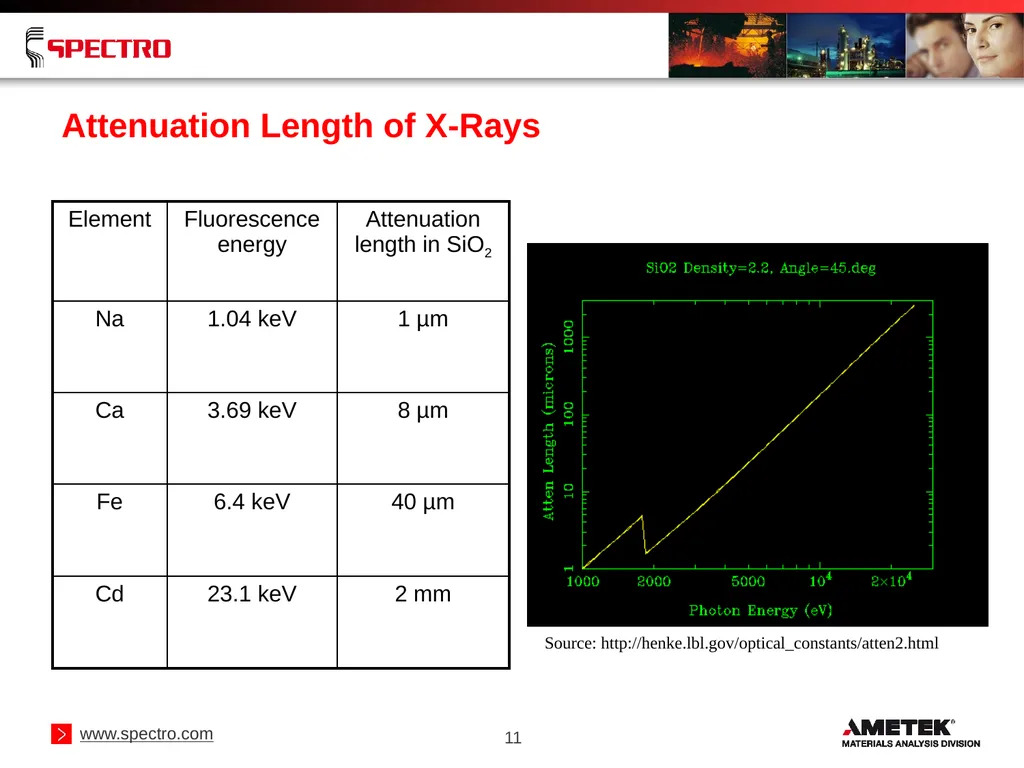
11 Attenuation Length of X-Rays Source: http://henke.lbl.gov/optical_constants/atten2.html<br>
12
12 Attenuation Length of X-Rays The attenuation length of X-rays depends on the sample matrix, the radiation energy and the take-off angle
The attenuation length of X-ray fluorescence radiation for elements with Z < 11 is < 1 µm in a pure SiO2 matrix
A precise and accurate analysis of these elements depends very much on the quality of the sample surface
Powders are often milled to a grain size < 100 µm, for some applications to < 10-20 µm
Grain size and mineralogical effects are dominant when analyzing elements Z < 11<br>
The attenuation length of X-ray fluorescence radiation for elements with Z < 11 is < 1 µm in a pure SiO2 matrix
A precise and accurate analysis of these elements depends very much on the quality of the sample surface
Powders are often milled to a grain size < 100 µm, for some applications to < 10-20 µm
Grain size and mineralogical effects are dominant when analyzing elements Z < 11<br>
13
13 Analysis of Elements Z < 11 in Geological Samples
by XRF To consider a specimen to be representative for the sample, the analyzed quantity of a geological sample should always be more than 0.5 g
When analyzing elements Z < 11 using XRF, a thin layer is analyzed when looking at pressed powder samples. The analyzed sample amount is clearly less than 0.5 g
This means that the specimen is not representative for the sample<br>
When analyzing elements Z < 11 using XRF, a thin layer is analyzed when looking at pressed powder samples. The analyzed sample amount is clearly less than 0.5 g
This means that the specimen is not representative for the sample<br>
14
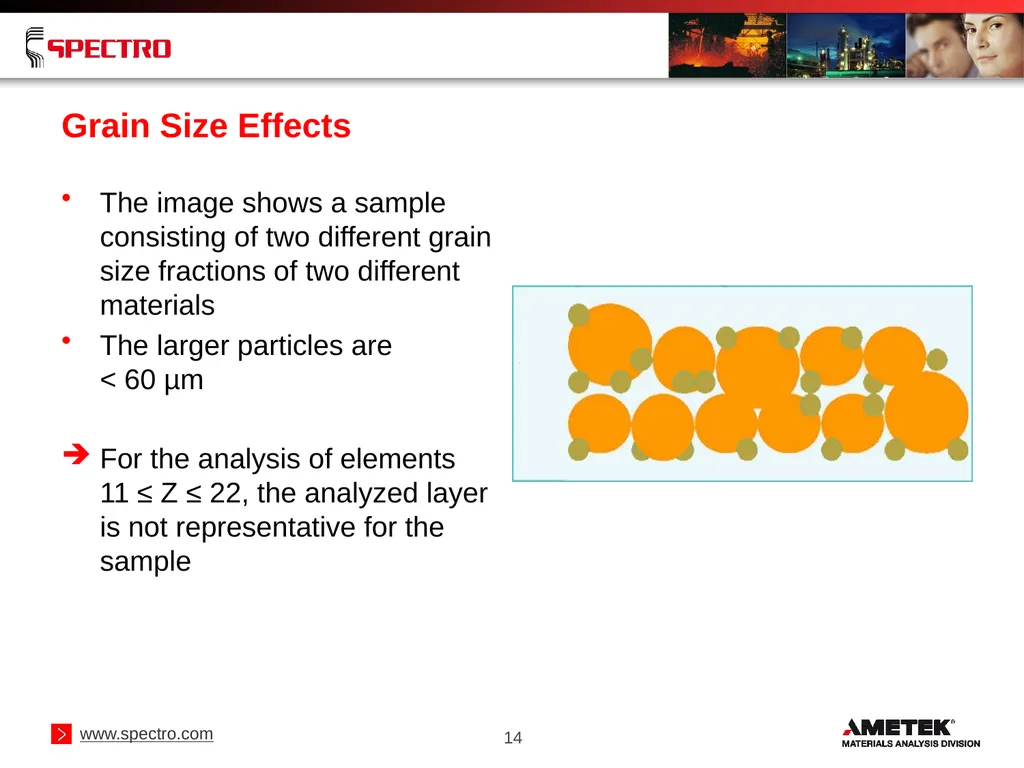
14 Grain Size Effects The image shows a sample consisting of two different grain size fractions of two different materials
The larger particles are < 60 µm
For the analysis of elements 11 ≤ Z ≤ 22, the analyzed layer is not representative for the sample<br>
The larger particles are < 60 µm
For the analysis of elements 11 ≤ Z ≤ 22, the analyzed layer is not representative for the sample<br>
15
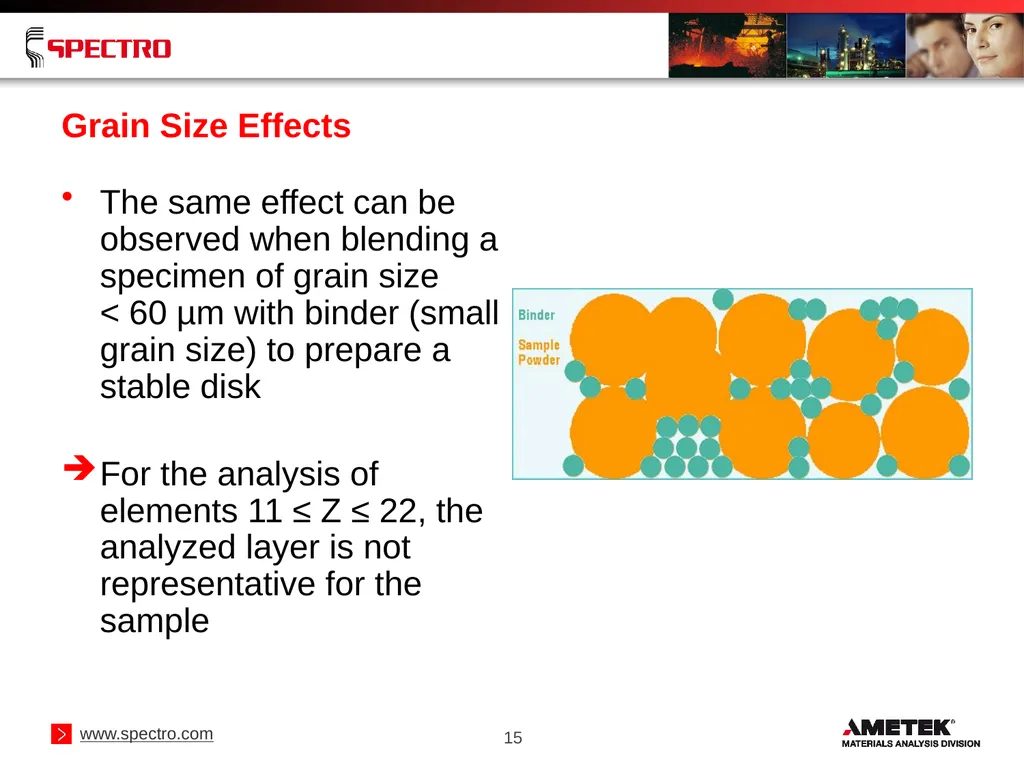
15 Grain Size Effects The same effect can be observed when blending a specimen of grain size
< 60 µm with binder (small grain size) to prepare a stable disk
For the analysis of elements 11 ≤ Z ≤ 22, the analyzed layer is not representative for the sample<br>
For the analysis of elements 11 ≤ Z ≤ 22, the analyzed layer is not representative for the sample<br>
16
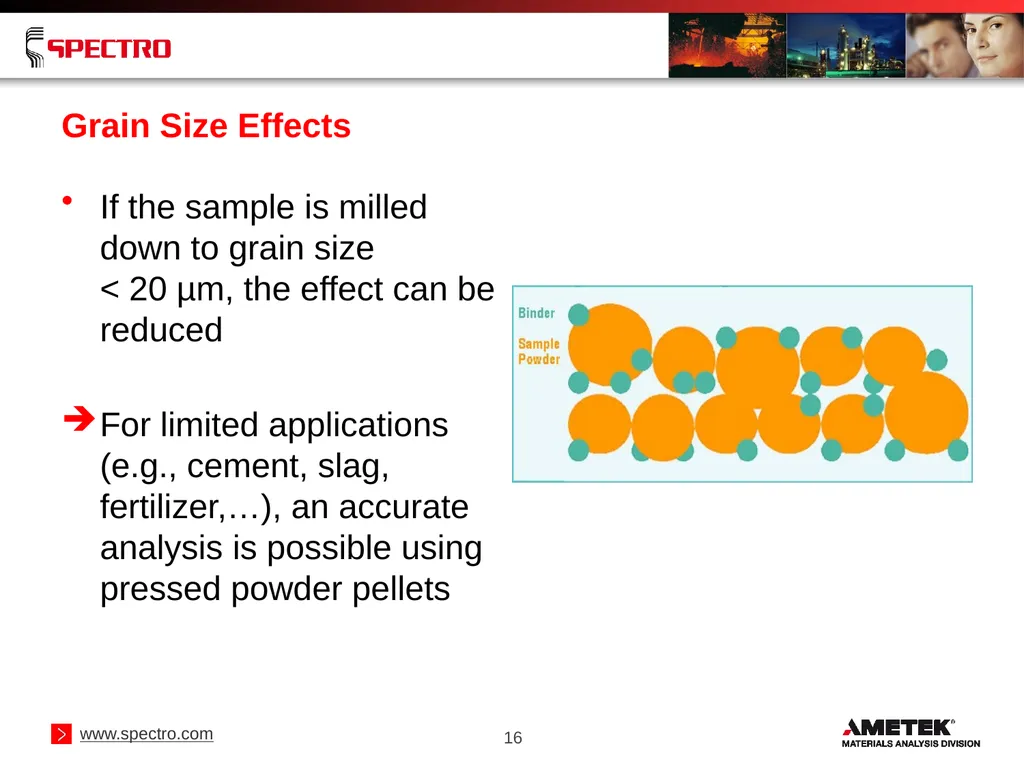
16 Grain Size Effects If the sample is milled down to grain size
< 20 µm, the effect can be reduced
For limited applications (e.g., cement, slag, fertilizer,…), an accurate analysis is possible using pressed powder pellets<br>
For limited applications (e.g., cement, slag, fertilizer,…), an accurate analysis is possible using pressed powder pellets<br>
17
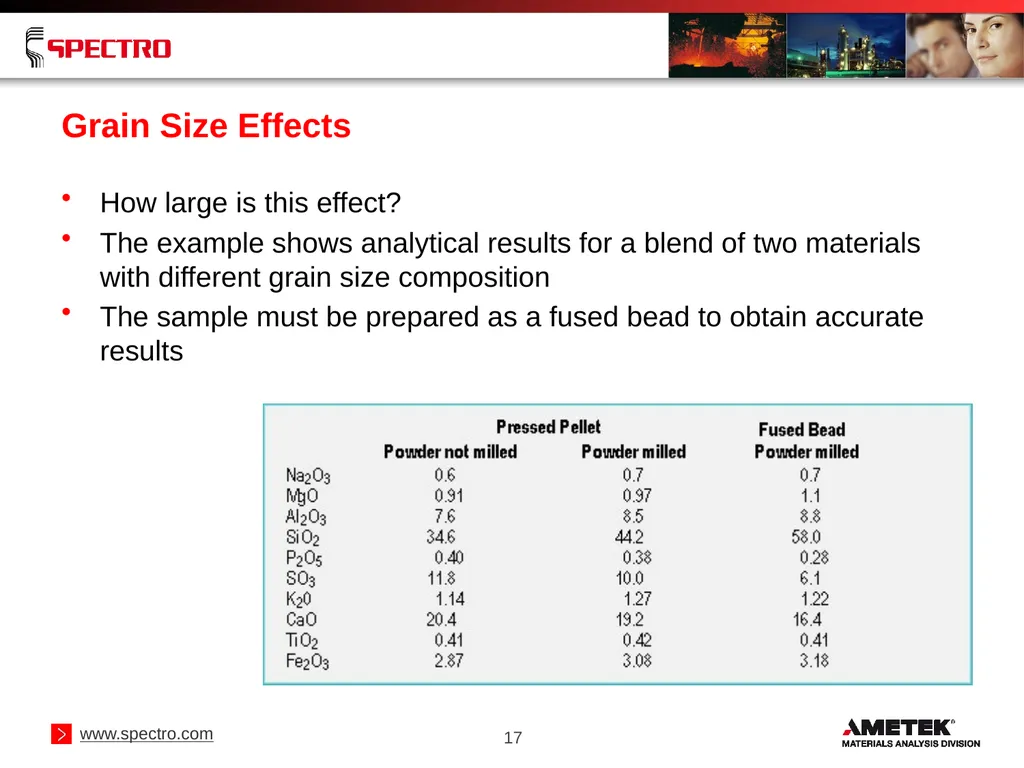
17 Grain Size Effects How large is this effect?
The example shows analytical results for a blend of two materials with different grain size composition
The sample must be prepared as a fused bead to obtain accurate results<br>
The example shows analytical results for a blend of two materials with different grain size composition
The sample must be prepared as a fused bead to obtain accurate results<br>
18
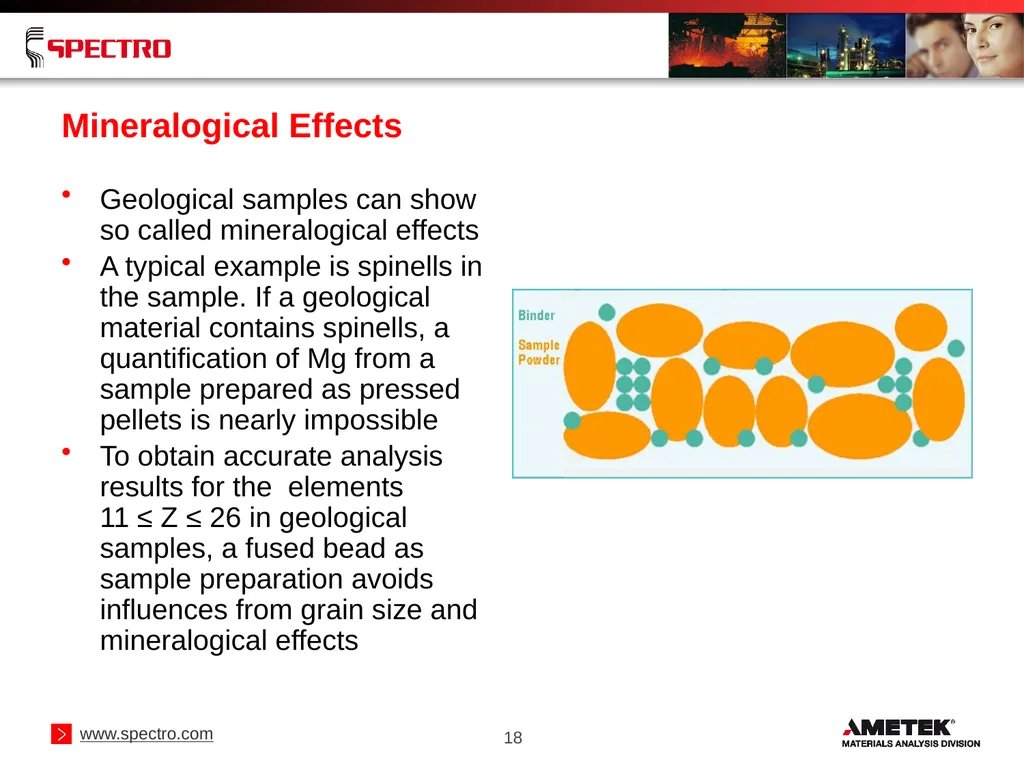
18 Mineralogical Effects Geological samples can show so called mineralogical effects
A typical example is spinells in the sample. If a geological material contains spinells, a quantification of Mg from a sample prepared as pressed pellets is nearly impossible
To obtain accurate analysis results for the elements 11 ≤ Z ≤ 26 in geological samples, a fused bead as sample preparation avoids influences from grain size and mineralogical effects<br>
A typical example is spinells in the sample. If a geological material contains spinells, a quantification of Mg from a sample prepared as pressed pellets is nearly impossible
To obtain accurate analysis results for the elements 11 ≤ Z ≤ 26 in geological samples, a fused bead as sample preparation avoids influences from grain size and mineralogical effects<br>
19
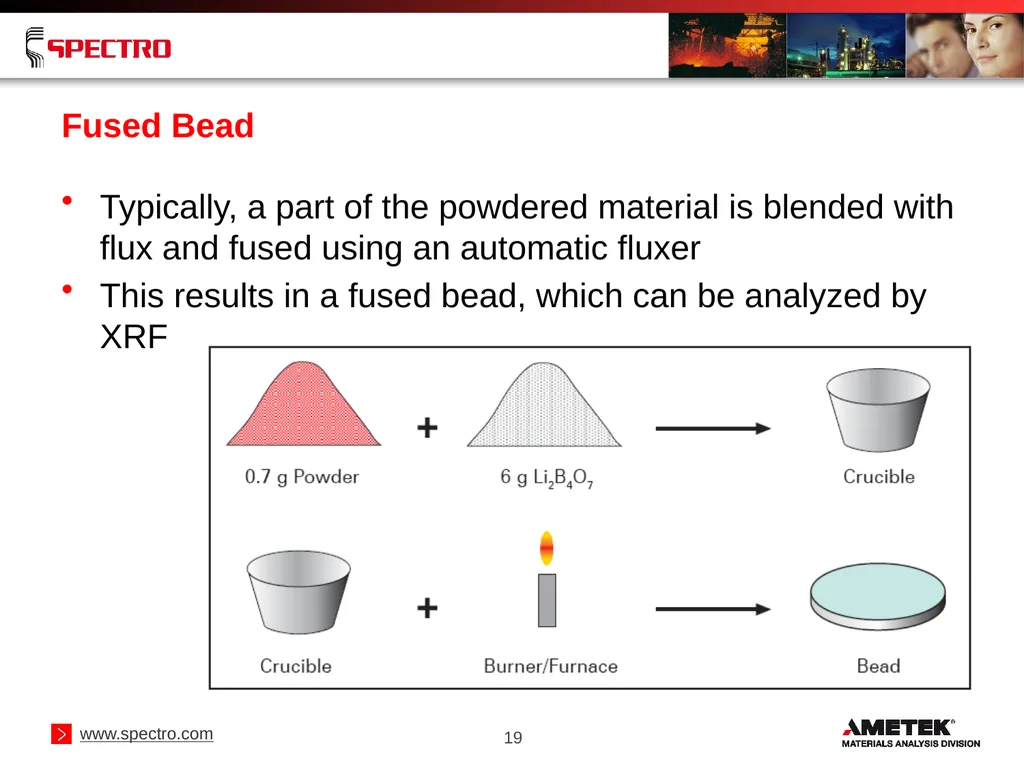
19 Fused Bead Typically, a part of the powdered material is blended with flux and fused using an automatic fluxer
This results in a fused bead, which can be analyzed by XRF<br>
This results in a fused bead, which can be analyzed by XRF<br>
20
20 Analysis of Elements 11 ≤ Z ≤ 22 in Geological Samples by XRF To achieve a homogenous specimen, the minimum sample mass should be 0.5 g
When analyzing elements 11 ≤ Z ≤ 22 from pressed pellets using XRF, only a very thin layer of the sample is investigated; the mass of the analyzed material is clearly less than 0.5 g
Prepare the sample as a fused bead with a minimum of 0.5 g of sample; this will be dissolved and homogenized
The analyzed specimen in the form of a fused bead can represent the sample entity<br>
When analyzing elements 11 ≤ Z ≤ 22 from pressed pellets using XRF, only a very thin layer of the sample is investigated; the mass of the analyzed material is clearly less than 0.5 g
Prepare the sample as a fused bead with a minimum of 0.5 g of sample; this will be dissolved and homogenized
The analyzed specimen in the form of a fused bead can represent the sample entity<br>
21
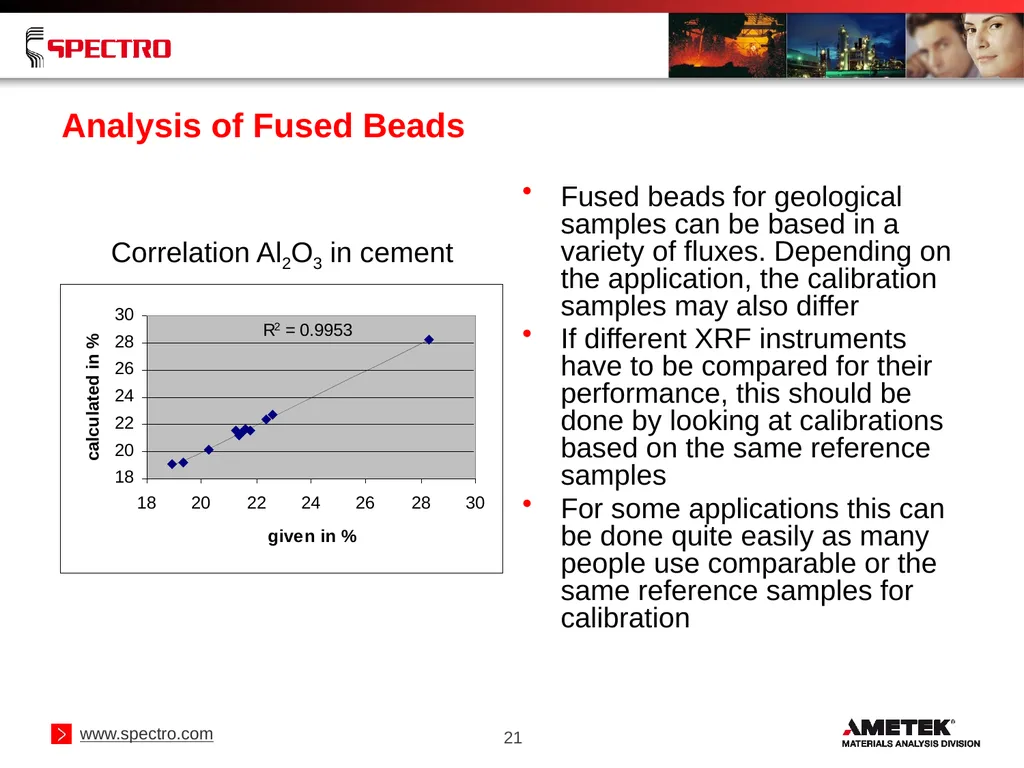
21 Analysis of Fused Beads Fused beads for geological samples can be based in a variety of fluxes. Depending on the application, the calibration samples may also differ
If different XRF instruments have to be compared for their performance, this should be done by looking at calibrations based on the same reference samples
For some applications this can be done quite easily as many people use comparable or the same reference samples for calibration Correlation Al2O3 in cement<br>
If different XRF instruments have to be compared for their performance, this should be done by looking at calibrations based on the same reference samples
For some applications this can be done quite easily as many people use comparable or the same reference samples for calibration Correlation Al2O3 in cement<br>
22
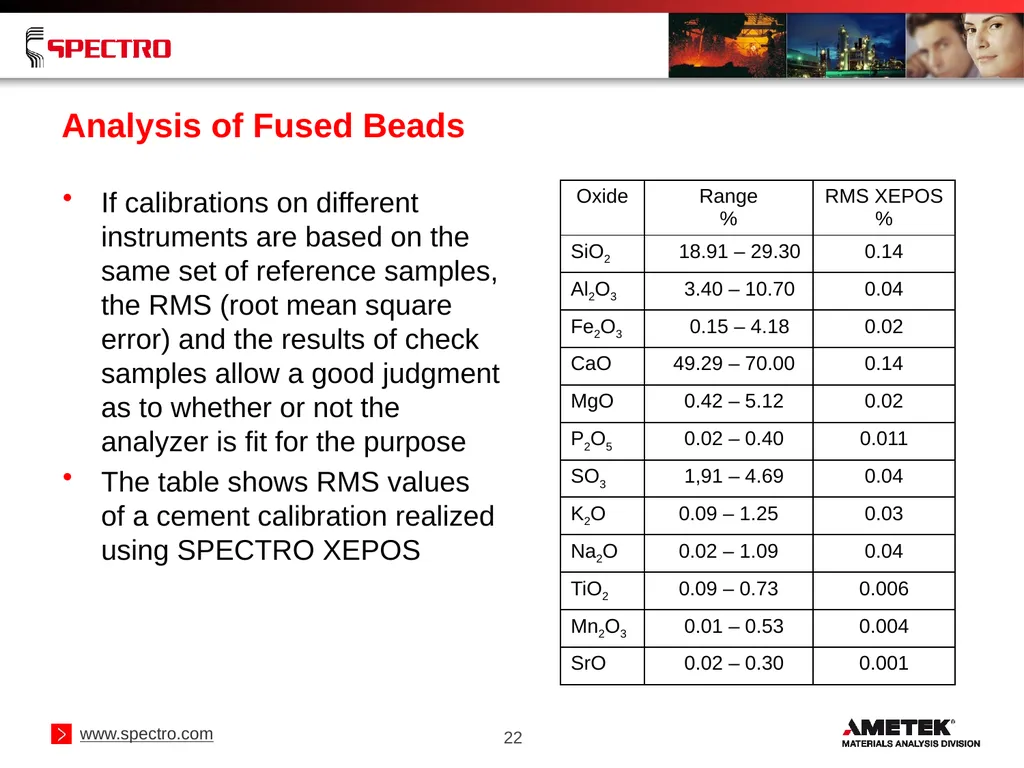
22 Analysis of Fused Beads If calibrations on different instruments are based on the same set of reference samples, the RMS (root mean square error) and the results of check samples allow a good judgment as to whether or not the analyzer is fit for the purpose
The table shows RMS values of a cement calibration realized using SPECTRO XEPOS<br>
The table shows RMS values of a cement calibration realized using SPECTRO XEPOS<br>
23
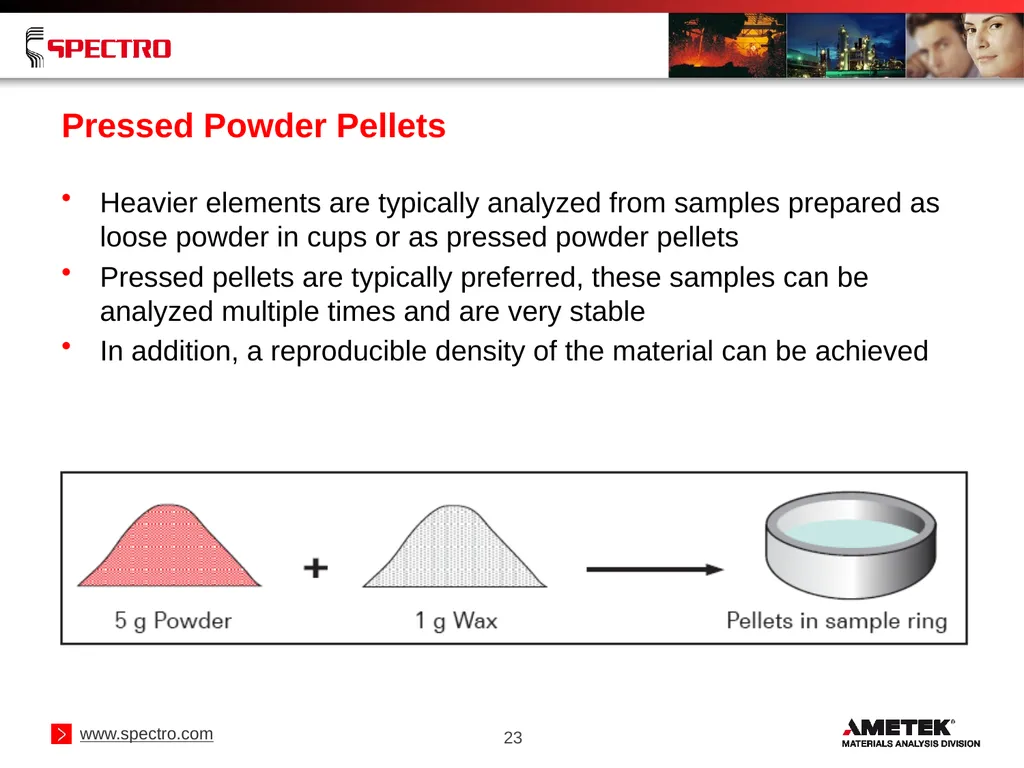
23 Pressed Powder Pellets Heavier elements are typically analyzed from samples prepared as loose powder in cups or as pressed powder pellets
Pressed pellets are typically preferred, these samples can be analyzed multiple times and are very stable
In addition, a reproducible density of the material can be achieved<br>
Pressed pellets are typically preferred, these samples can be analyzed multiple times and are very stable
In addition, a reproducible density of the material can be achieved<br>
24
24 Analysis of Pressed Powder Pellets When pressed powder pellets from geological material are analyzed, the main purpose is to determine minor or trace contents
Comparing different instruments can be done based on the achievable detection limits as well as the accuracy when analyzing typical check samples
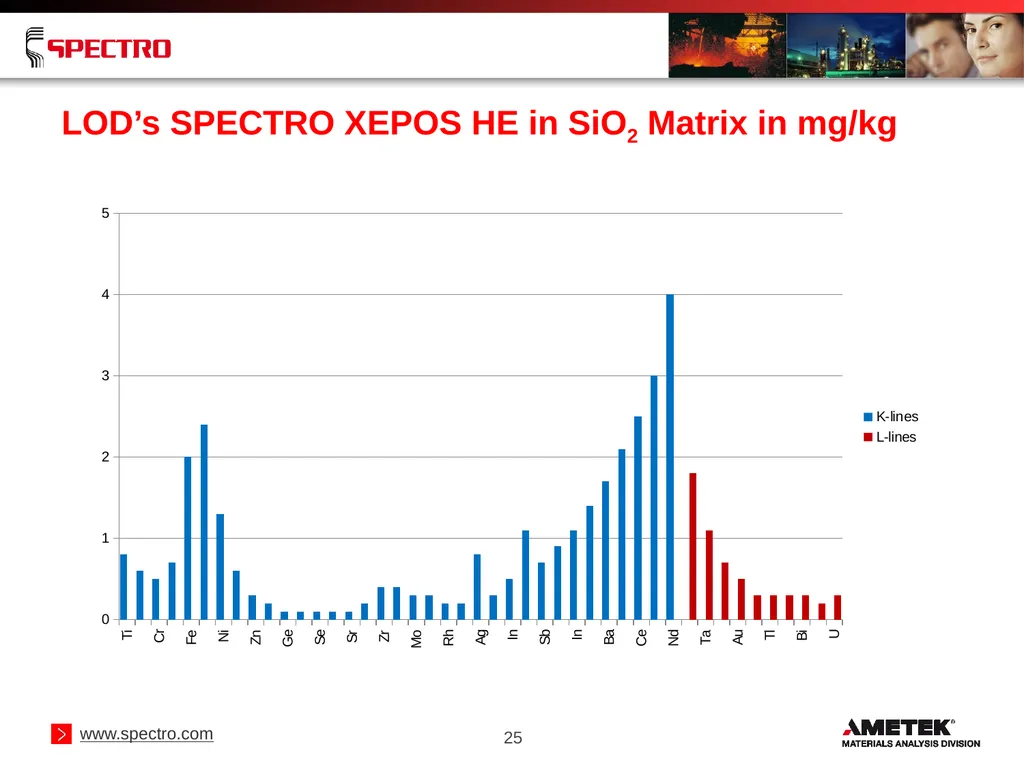
The following slide shows LOD’s of SPECTRO XEPOS HE for samples of silicate matrix<br>
Comparing different instruments can be done based on the achievable detection limits as well as the accuracy when analyzing typical check samples
The following slide shows LOD’s of SPECTRO XEPOS HE for samples of silicate matrix<br>
25
25 LOD’s SPECTRO XEPOS HE in SiO2 Matrix in mg/kg<br>
26
26 Analysis of Pressed Powder Pellets Not only the sensitivity, but also the accuracy is a crucial goal for the analysis of “light” elements as well as for the analysis of minor and trace elements
To achieve the best possible accuracy, various matrix correction algorithms are used
SPECTRO XEPOS instruments apply the proprietary Turboquant method. This algorithm considers fundamental parameters for fluorescence and scattering
Compared to other application packages, this offers the analysis of completely unknown samples without any further input from the user<br>
To achieve the best possible accuracy, various matrix correction algorithms are used
SPECTRO XEPOS instruments apply the proprietary Turboquant method. This algorithm considers fundamental parameters for fluorescence and scattering
Compared to other application packages, this offers the analysis of completely unknown samples without any further input from the user<br>
27
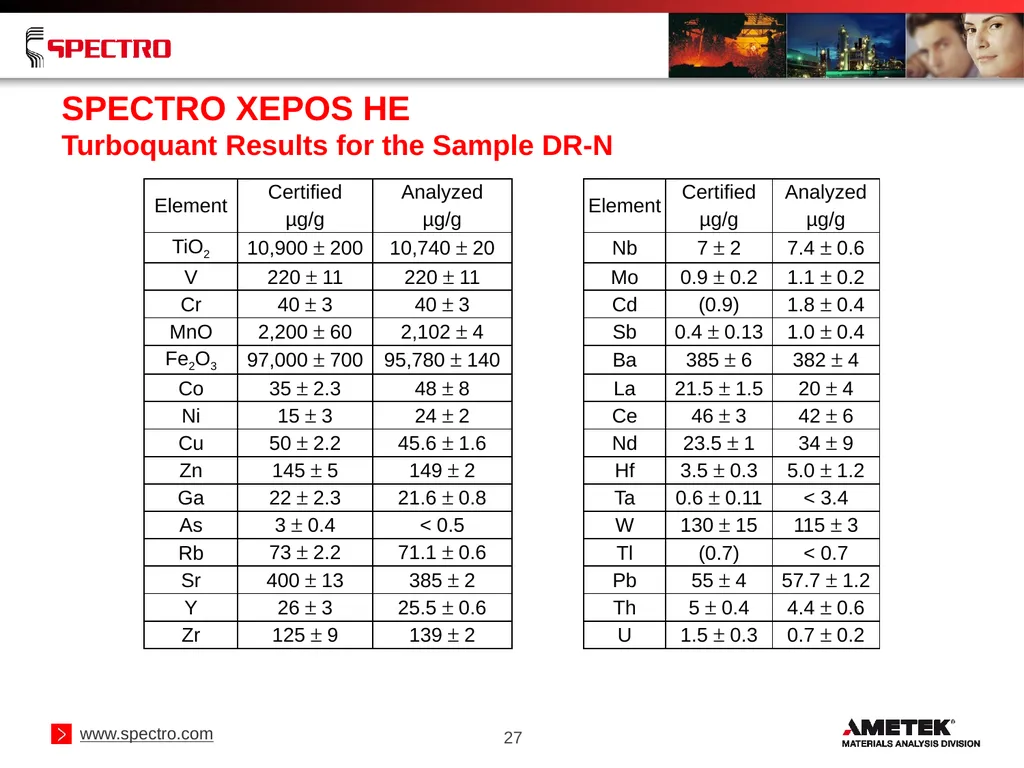
SPECTRO XEPOS HE
Turboquant Results for the Sample DR-N 27<br>
28
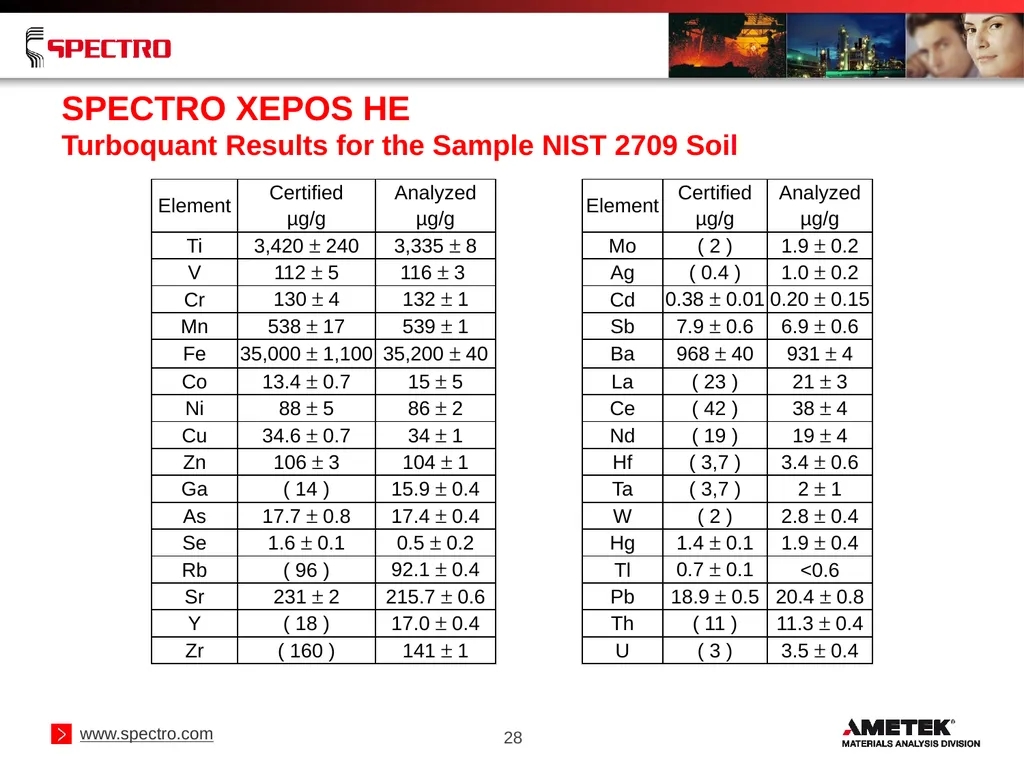
28 SPECTRO XEPOS HE
Turboquant Results for the Sample NIST 2709 Soil<br>
29
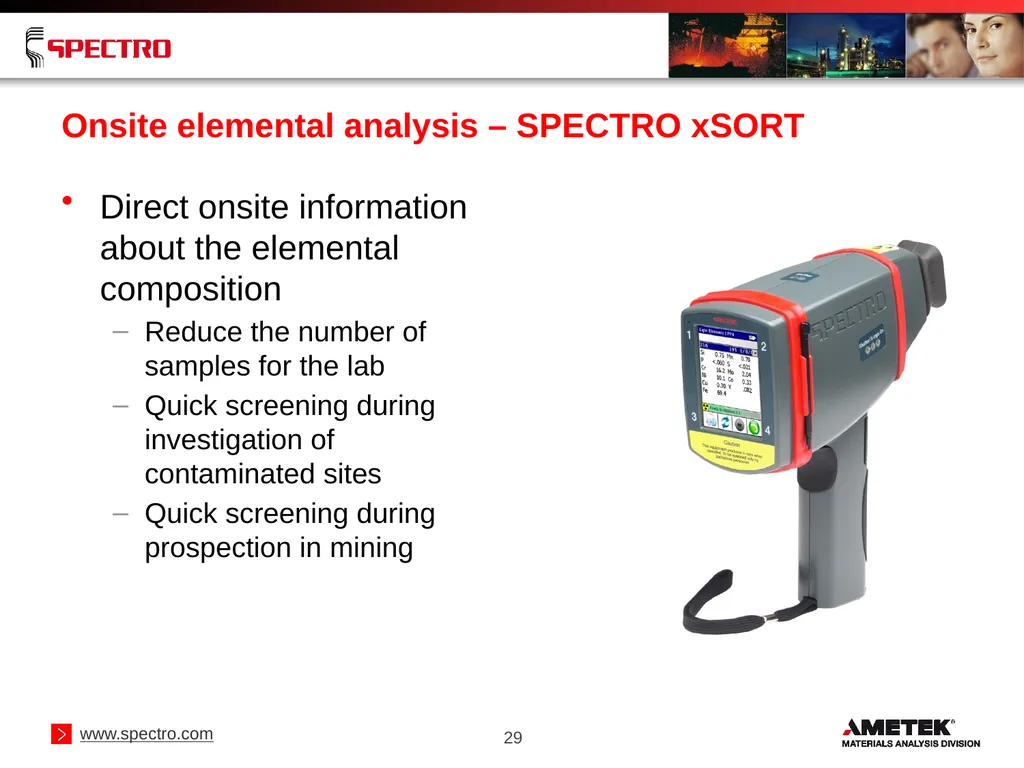
Onsite elemental analysis – SPECTRO xSORT Direct onsite information about the elemental composition
Reduce the number of samples for the lab
Quick screening during investigation of contaminated sites
Quick screening during prospection in mining 29<br>
Reduce the number of samples for the lab
Quick screening during investigation of contaminated sites
Quick screening during prospection in mining 29<br>
30
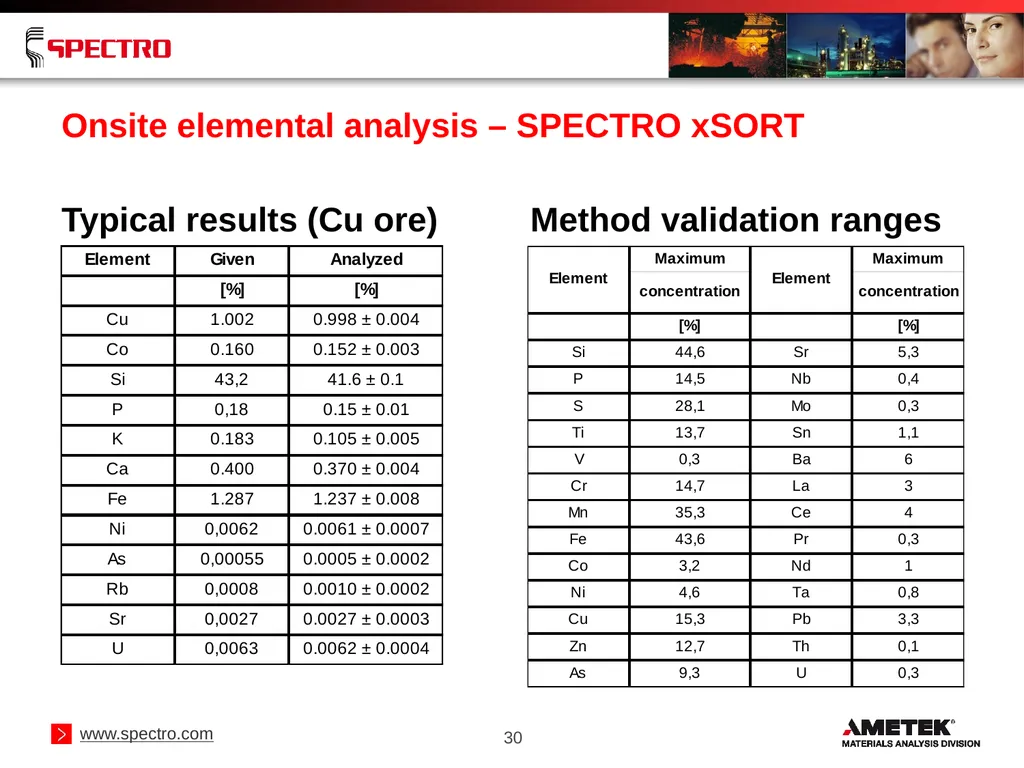
Typical results (Cu ore) Method validation ranges 30 Onsite elemental analysis – SPECTRO xSORT<br>
31
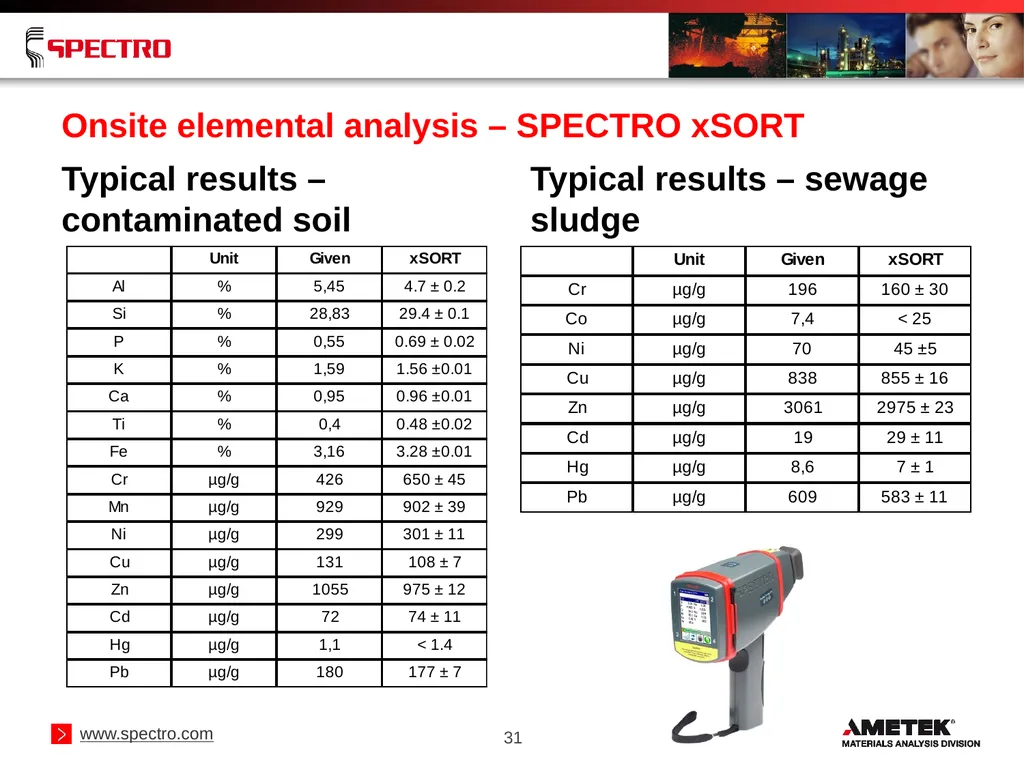
Typical results – contaminated soil Typical results – sewage sludge 31 Onsite elemental analysis – SPECTRO xSORT<br>
32
32 Summary In geological samples, elements 11 ≤ Z ≤ 22 (26) (except S, Cl if applicable) are typically analyzed using fused beads if high accuracy is required
In geological matrices, elements Z > 22 as minor or trace elements are typically analyzed using pressed powder pellets or powdered samples
SPECTRO XEPOS offers high performance when analyzing fused beads
SPECTRO XEPOS HE offers excellent LOD’s for minor and trace elements
Turboquant offers accurate analysis for a wide range of elements in a wide range of different matrices
SPECTRO xSORT can be used for fast onsite screening<br>
In geological matrices, elements Z > 22 as minor or trace elements are typically analyzed using pressed powder pellets or powdered samples
SPECTRO XEPOS offers high performance when analyzing fused beads
SPECTRO XEPOS HE offers excellent LOD’s for minor and trace elements
Turboquant offers accurate analysis for a wide range of elements in a wide range of different matrices
SPECTRO xSORT can be used for fast onsite screening<br>
33
…for additional information Visit
http://www.spectro.com
http://www.spectrolive.com
Or contact
dirk.wissmann@ametek.com<br>
http://www.spectro.com
http://www.spectrolive.com
Or contact
dirk.wissmann@ametek.com<br>
34
Thank You for Your Attention !<br>