04
Problem Do statistical programmatic work in SAS then…
….hand type them in to Excel or Word tables?!
This is a problem for because
Super inefficient
Tweaking an analysis / update? Yuck
Plenty of human error problems already! Don’t need to add typos to the list.<br>
05
Solutions … part 1 R
1. write.csv() & shell.exec()
2. write.table() clipboard
3. clipr
4. tableone()
5. …markdown, etc. (later)
Excel
A. Basic Excel
B. Fancy Excel
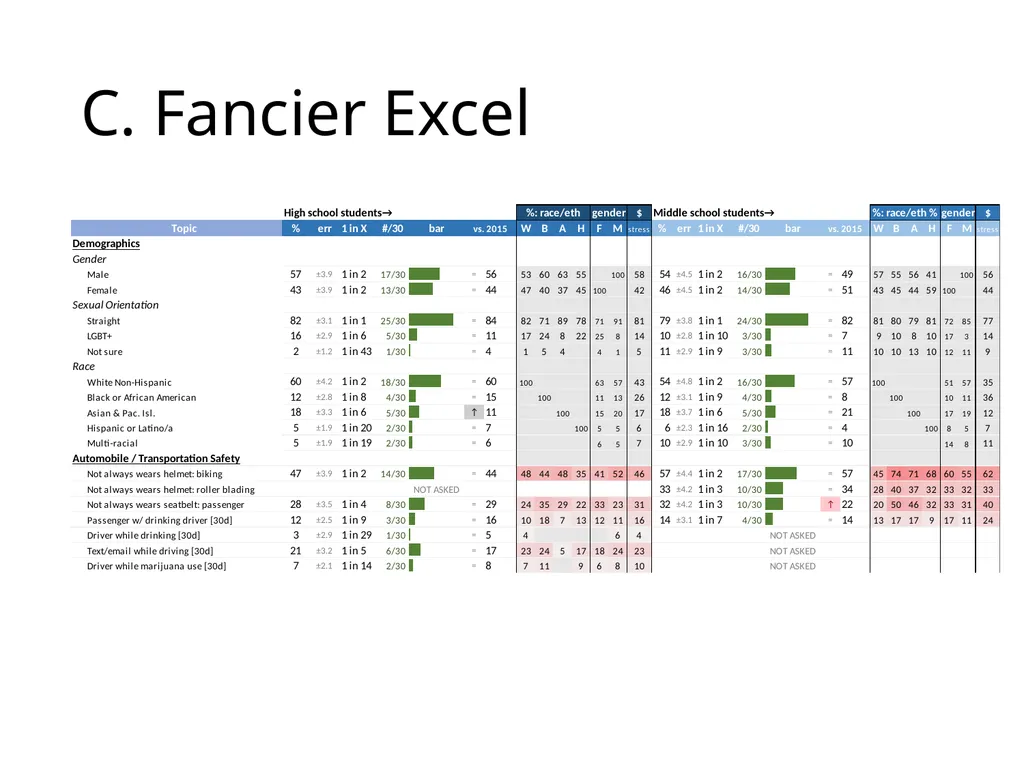
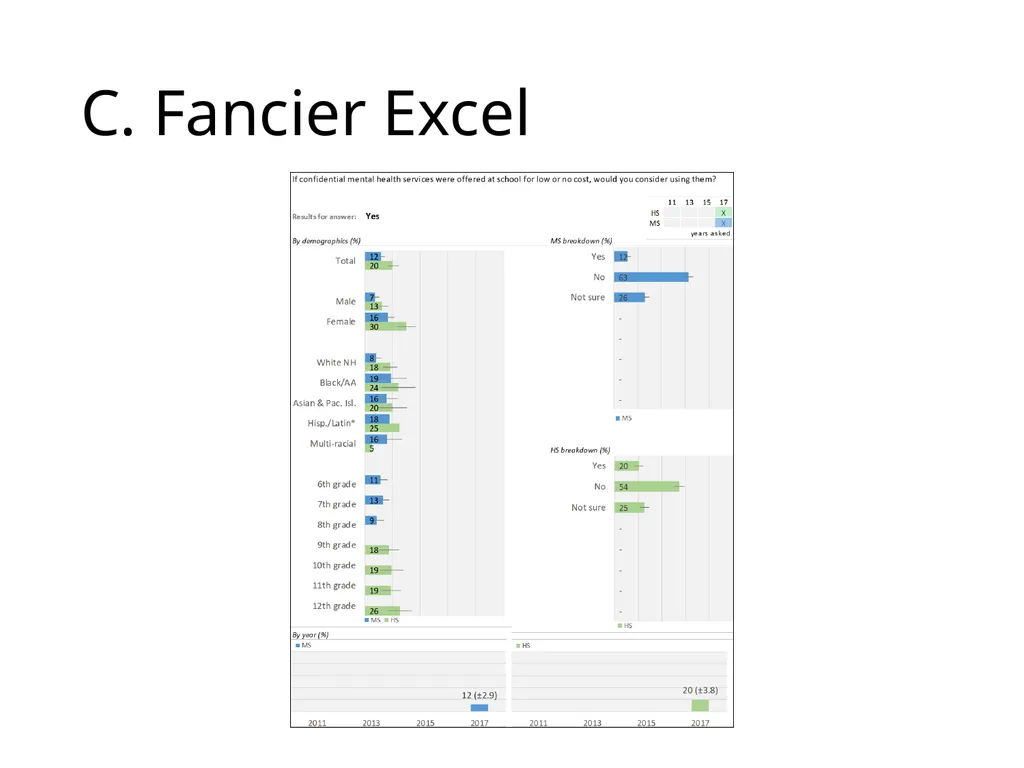
C. Fancier Excel (w VBA)<br>
06
Caveats There are many ways to do this better in R.
We’re only reviewing the most approachable ones today, which work if you’re so-so in Excel/Word (often required for journals anyway). High bang for buck.
Getting better at this (truly push-button or web-based) is probably worth the time …on select projects!
We’ll look at other approaches with markdown and shiny later.<br>
07
1. write.csv() / shell.exec() It’s pretty much that easy. Let’s try.
Got Mac? This is not system independent since we’re asking something of the operating system.�system(paste("open", filename))��https://stackoverflow.com/questions/12273346/system-independent-method-of-opening-afile<br>
08
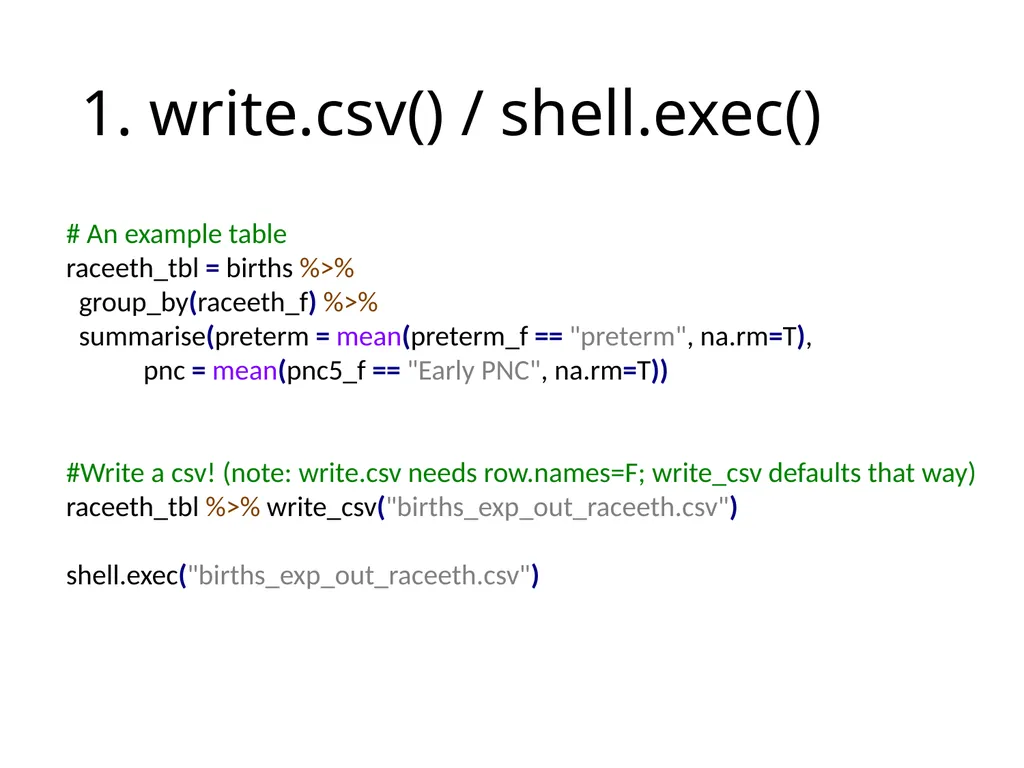
1. write.csv() / shell.exec() # An example table
raceeth_tbl = births %>%
group_by(raceeth_f) %>%
summarise(preterm = mean(preterm_f == "preterm", na.rm=T),
pnc = mean(pnc5_f == "Early PNC", na.rm=T))
#Write a csv! (note: write.csv needs row.names=F; write_csv defaults that way)
raceeth_tbl %>% write_csv("births_exp_out_raceeth.csv")
shell.exec("births_exp_out_raceeth.csv")<br>
09
2. write.table() clipboard Often I do 1 and 2 together
Got Mac? Maybe helpful?�data <- rbind(c(1,1,2,3), c(1,1, 3, 4), c(1,4,6,7))
clip <- pipe("pbcopy", "w")
write.table(data, file=clip)
close(clip)��https://stackoverflow.com/questions/14547069/how-to-write-from-r-to-the-clipboard-on-a-mac # Write right to the clipboard
raceeth_tbl %>% write.table("clipboard", sep="\t", row.names = F)<br>
10
3. Try out the newer clipr package clipr::write_clip(raceeth_tbl)
Mac users, does this work?<br>
11
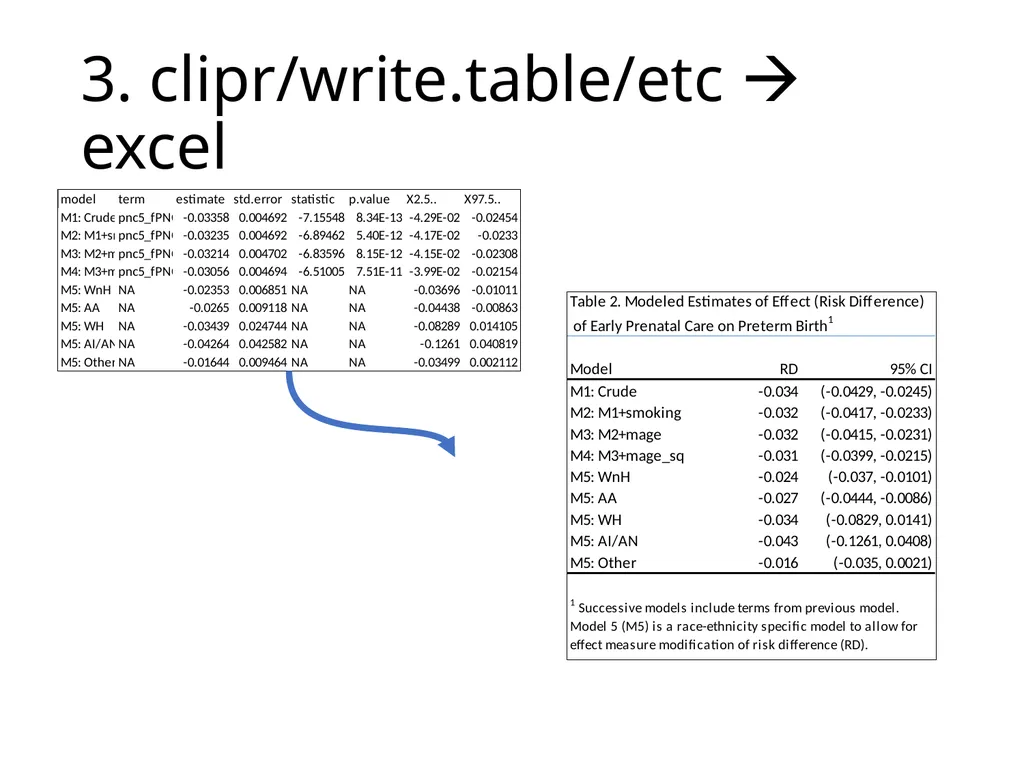
3. clipr/write.table/etc excel<br>
12
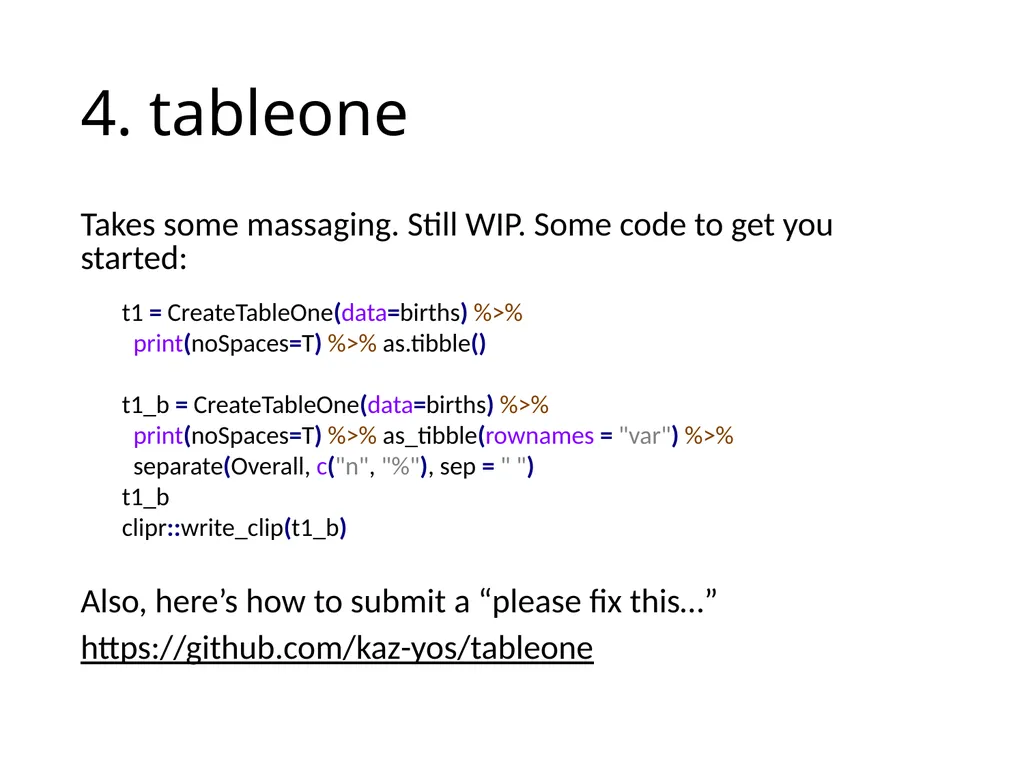
4. tableone Takes some massaging. Still WIP. Some code to get you started:
Also, here’s how to submit a “please fix this…”
https://github.com/kaz-yos/tableone t1 = CreateTableOne(data=births) %>%
print(noSpaces=T) %>% as.tibble()
t1_b = CreateTableOne(data=births) %>%
print(noSpaces=T) %>% as_tibble(rownames = "var") %>%
separate(Overall, c("n", "%"), sep = " ")
t1_b
clipr::write_clip(t1_b)<br>
13
A. Basic Excel Basic patterns for automation using R and Excel
Send to clipboard and format in Excel, then re-paste values if you need to update. Meh.
Send to clipboard, paste in Excel, then link values to a table you format exactly as you like. Better!
Use readxl::write_excel() to plop the data frame in the range you want.<br>
14
B. Fancy Excel Fancy patterns for automation using R and Excel:
Use live-linked images (secret camera tool!) to keep tables up to date and easy to share in gmail, linked in powerpoints, etc.<br>
15
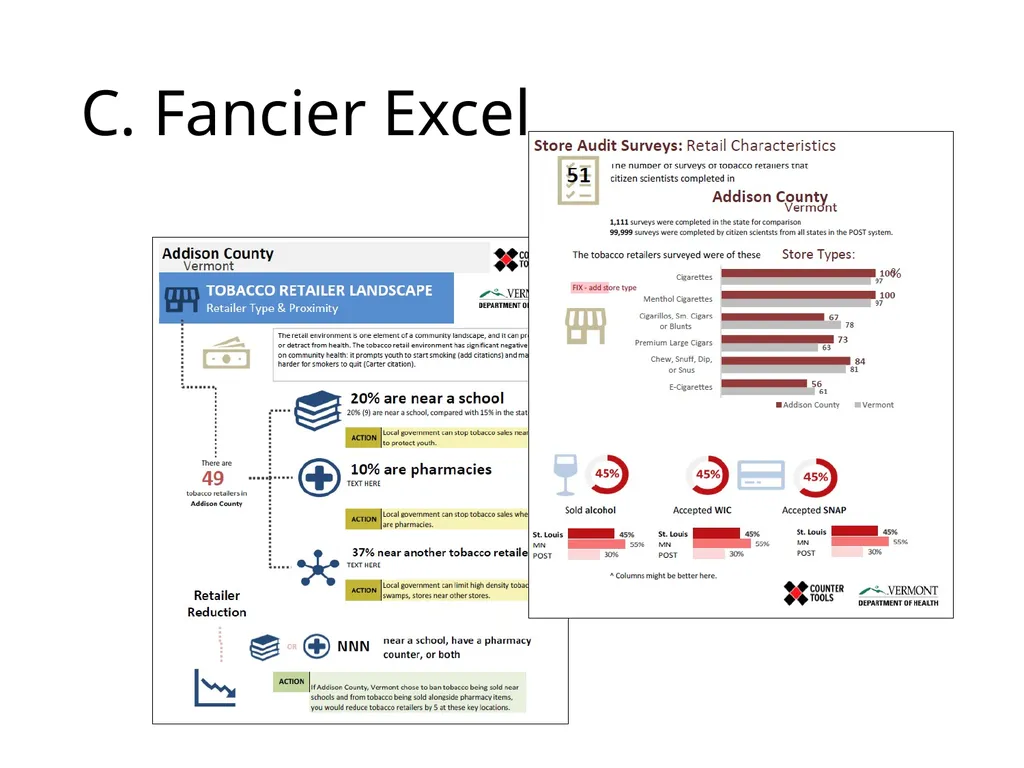
C. Fancier Excel Use well-formatted summary output tables from R to build (basic, it’s not ggplot…) graphics in Excel<br>
19
D. Fancier Excel (just showing) Process data in R as before
Use Excel drop-down selectors to navigate your output datasets and build good lookin’ dashboards
Consider VBA to power through all options, fill tables, and dump long reports in word, pdf or powerpoint<br>
20
D. Fancier Excel (VBA example) Sub PDF_Printer()
‘ Mike Dolan Fliss, 2016
� Dim ws As Worksheet
Dim ws_unique As Worksheet
Dim DataRange As Range
Dim iLastRow As Long
Dim iLastRow_unique As Long
Dim UniqueRng As Range
Dim Cell As Range
Dim LastRow As Long
Dim LastColumn As Long
Dim DropDown As Range
printdirectorypostfix = "SAC 1 pagers"
Report = " SAC 4Ps"
printpage_start = 9
printpage_end = 12
'Would be better to assign directory names, sheet range
printdirectorybase = "D:\User\Dropbox\Community\CounterTools-Mike Collab\Report Store"
printdir = printdirectorybase & "\" & printdirectorypostfix & "\"
printtype = xlTypePDF
printfiletype = ".pdf"
'added so it works across workbooks
Windows("CountyHealthData_v6.xlsx").Activate
Set ws = Worksheets("Reports") 'Amend to reflect the sheet you wish to work with
Set ws_unique = Worksheets("CT plans") 'Amend to reflect the sheet you wish to work with
Set DropDown = ws.Range("B25")
'Application.ScreenUpdating = False
With ws
Set UniqueRng = ws_unique.Range("F3:F38") 'to F38
For Each Cell In UniqueRng
DropDown.Value = Cell.Value
Name = printdir & Cell.Value & Report & printfiletype
ws.ExportAsFixedFormat Type:=printtype, Filename:=Name, _
Quality:=xlQualityStandard, IncludeDocProperties:=False, IgnorePrintAreas _
:=False, OpenAfterPublish:=False, From:=printpage_start, To:=printpage_end
Next Cell
End With
Application.ScreenUpdating = True
End Sub<br>
21
E. Excel End Game (not demoing) Connect R and SQL Server or Excel’s Power BI.
Ingest R-built summary tables as linkable objects in Excel Power BI/SQL relational databases
Build basic web-based or printable excel dashboards
Similar workflow for Tableau – rerun your R, and refresh! Or write summary tables out to google sheets. Sky’s the limit.<br>
22
LaTeX R can export tables in LaTeX, HTML, word, etc.
Wait for knitr/markdown, coming up soon!
tables package: �https://cran.r-project.org/web/packages/tables/vignettes/tables.pdf
knitr, stargazer, xtable: �https://sachsmc.github.io/knit-git-markr-guide/knitr/knit.html �https://www.jakeruss.com/cheatsheets/stargazer/�https://cran.r-project.org/web/packages/xtable/vignettes/xtableGallery.pdf
kable: �https://cran.r-project.org/web/packages/kableExtra/vignettes/awesome_table_in_html.html
formattable / shiny: �https://cran.r-project.org/web/packages/formattable/vignettes/formattable-data-frame.html<br>