
Estimation of key ecosystem services in the
DJ
Published · 29 slides · 0 views

1 / 1


Description
Estimation of key ecosystem services in the GreenTwin Martin Allik, landscape architect 31-05-2023 1 Keywords Ecosystem services estimation GreenTwin Urban Digital Twin Green Urban Infrastructure Summary This document is a short literature
Related Topics
Share
Embed code
Download this presentation From Below
"Estimation of key ecosystem services in the" is the property of its rightful owner. Permission is granted to download and print the materials on this website for personal, non-commercial use only, and to display it on your personal computer provided you do not modify the materials and that you retain all copyright notices contained in the materials. By downloading content from our website, you accept the terms of this agreement.
Presentation Transcript
01
Estimation of key ecosystem services in the GreenTwin Martin Allik, landscape architect
31-05-2023 1<br>
31-05-2023 1<br>
02
Keywords Ecosystem services estimation
GreenTwin
Urban Digital Twin
Green Urban Infrastructure<br>
GreenTwin
Urban Digital Twin
Green Urban Infrastructure<br>
03
Summary This document is a short literature review of the necessary data of urban green infrastructure to approximate the provision of key urban ecosystem services in the GreenTwin. It is based on the currently stored and collected data for Individual plants and Green areas in the Plant Library.
To ensure a broad group of users, these key ecosystem services need to be estimated relatively easily and without a site visit. The latter enables the user to test possible changes to ecosystem services even in future scenarios – a key moment in the GreenTwin.
More data can provide more exact calculations of these key services and eventually enable the estimation of all ecosystem services, but this might require further studies and/or in-situ sensors.<br>
To ensure a broad group of users, these key ecosystem services need to be estimated relatively easily and without a site visit. The latter enables the user to test possible changes to ecosystem services even in future scenarios – a key moment in the GreenTwin.
More data can provide more exact calculations of these key services and eventually enable the estimation of all ecosystem services, but this might require further studies and/or in-situ sensors.<br>
04
The task Provide a short literature review on what data of urban green infrastructure are needed to approximate the provision of key urban ecosystem services in pilot areas. The focus is not on the most sophisticated measures, but rather approximate ones for which data can realistically be collected and stored in a digital twin database.
How could the data that we are currently storing and collecting for Individual plants and Green areas be used to approximate the chosen ecosystem services at our pilot areas?
Based on the literature and our information model, what are the most important additional data that should be collected, to better enable the estimation of the chosen ecosystem services in the digital twin?<br>
How could the data that we are currently storing and collecting for Individual plants and Green areas be used to approximate the chosen ecosystem services at our pilot areas?
Based on the literature and our information model, what are the most important additional data that should be collected, to better enable the estimation of the chosen ecosystem services in the digital twin?<br>
05
The Green Area Factor and the GreenTwin Green Area Factor (GAF) is a practical planning tool that is used to create greener neighbourhoods in the city. This means that a certain portion of a plot of land must consist of vegetation and/or a water surface. (SMHI)
One of Green Twin’s many uses is the possibility to estimate the GAF of an area. In accordance to the C/O City GAF manual (Grönytefaktor för allmän platsmark 2.0), this is done through the estimation of six key ecosystem services.<br>
One of Green Twin’s many uses is the possibility to estimate the GAF of an area. In accordance to the C/O City GAF manual (Grönytefaktor för allmän platsmark 2.0), this is done through the estimation of six key ecosystem services.<br>
06
The Green Area Factor and the GreenTwin Using GAF as a planning and design analysis tool enables the user to study a specific (nature-based) solution with several ecosystem services in mind. GAF can be used for example to promote biodiversity, enhance climate adaptation or improve recreation and mental health. To ensure a broad group of users, these key ecosystem services need to be estimated relatively easily.
C/O City GAF manual provides a structured and straightforward way to estimate these ecosystem services, but in some cases it might require a site vist. It also provides a point system enabling comparison of different areas.<br>
C/O City GAF manual provides a structured and straightforward way to estimate these ecosystem services, but in some cases it might require a site vist. It also provides a point system enabling comparison of different areas.<br>
07
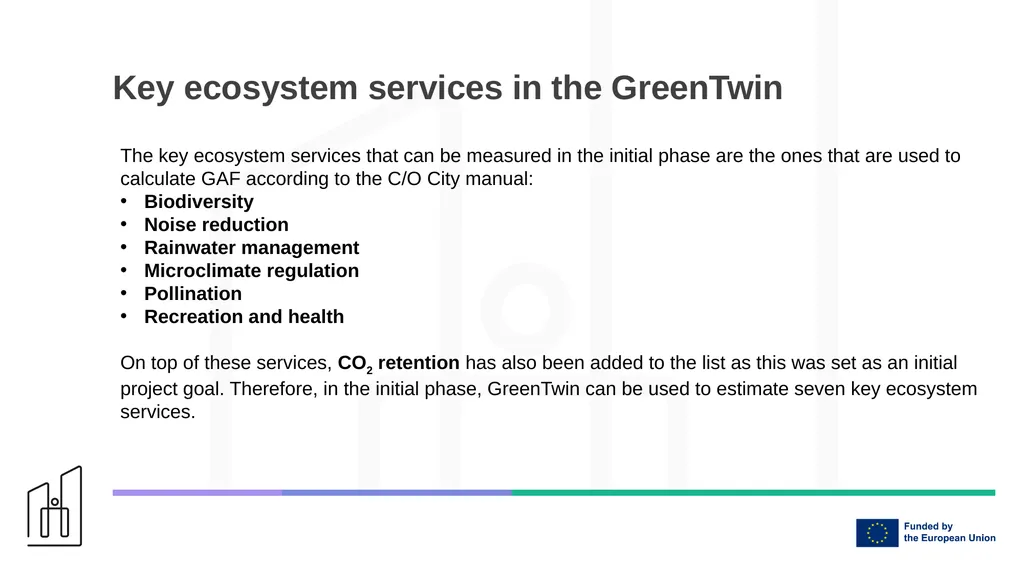
Key ecosystem services in the GreenTwin The key ecosystem services that can be measured in the initial phase are the ones that are used to calculate GAF according to the C/O City manual:
Biodiversity
Noise reduction
Rainwater management
Microclimate regulation
Pollination
Recreation and health
On top of these services, CO2 retention has also been added to the list as this was set as an initial project goal. Therefore, in the initial phase, GreenTwin can be used to estimate seven key ecosystem services.<br>
Biodiversity
Noise reduction
Rainwater management
Microclimate regulation
Pollination
Recreation and health
On top of these services, CO2 retention has also been added to the list as this was set as an initial project goal. Therefore, in the initial phase, GreenTwin can be used to estimate seven key ecosystem services.<br>
08
Key ecosystem services in the GreenTwin 8 These key ecosystem services can be calculated based on the data available in the Plant Library. This could be for example species or indvidual specimen specific data such as trunk and branch volume, leaf area, date of leaf outbreak. But also, area and habitat specific data such as habitat (surface) type, species cover percentage or area size.
More data can provide more exact calculations of these key services and eventually enable the estimation of all ecosystem services, but this might require further studies and/or in situ sensors.<br>
More data can provide more exact calculations of these key services and eventually enable the estimation of all ecosystem services, but this might require further studies and/or in situ sensors.<br>
09
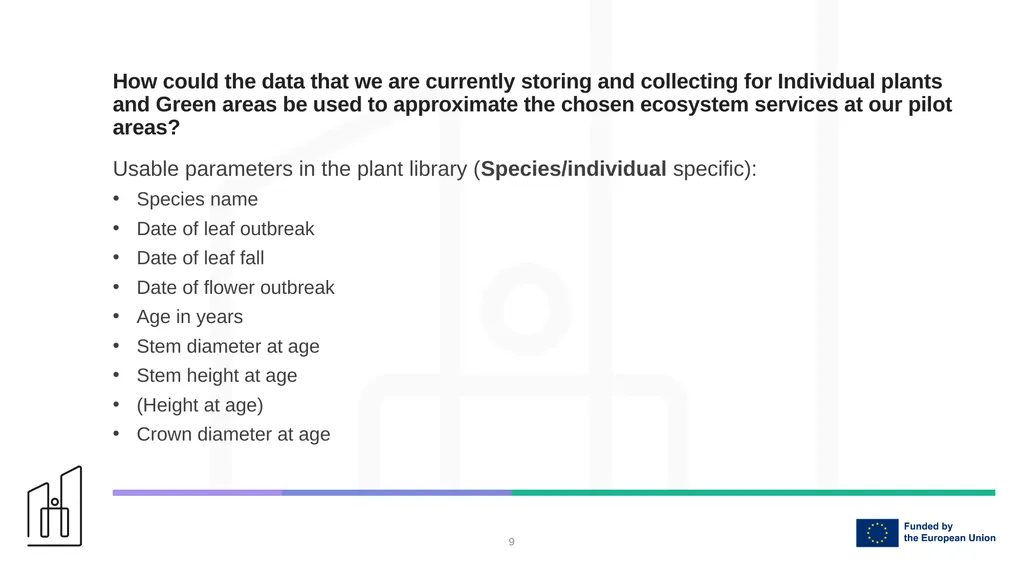
How could the data that we are currently storing and collecting for Individual plants and Green areas be used to approximate the chosen ecosystem services at our pilot areas? 9 Usable parameters in the plant library (Species/individual specific):
Species name
Date of leaf outbreak
Date of leaf fall
Date of flower outbreak
Age in years
Stem diameter at age
Stem height at age
(Height at age)
Crown diameter at age<br>
Species name
Date of leaf outbreak
Date of leaf fall
Date of flower outbreak
Age in years
Stem diameter at age
Stem height at age
(Height at age)
Crown diameter at age<br>
10
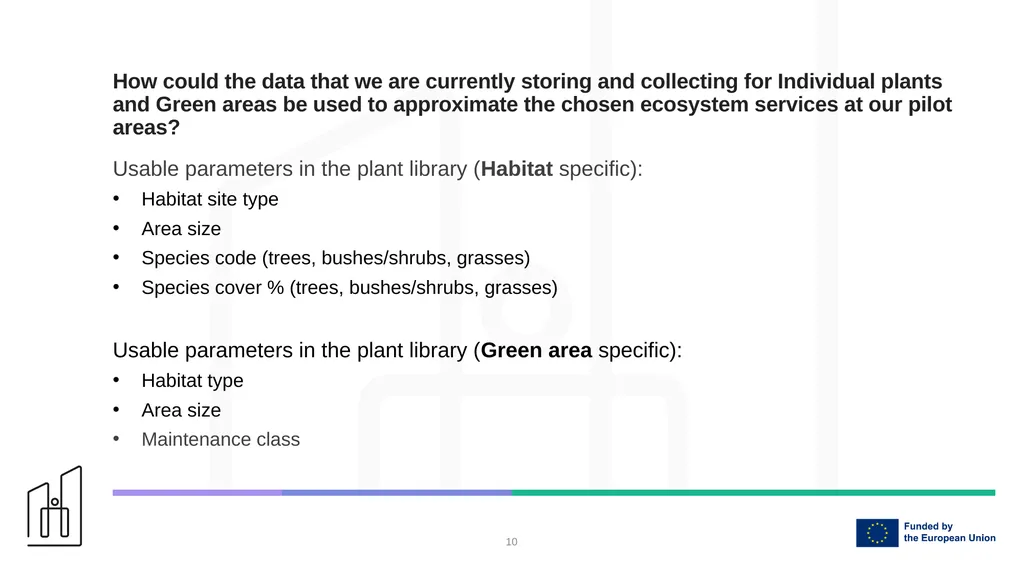
How could the data that we are currently storing and collecting for Individual plants and Green areas be used to approximate the chosen ecosystem services at our pilot areas? 10 Usable parameters in the plant library (Habitat specific):
Habitat site type
Area size
Species code (trees, bushes/shrubs, grasses)
Species cover % (trees, bushes/shrubs, grasses)
Usable parameters in the plant library (Green area specific):
Habitat type
Area size
Maintenance class<br>
Habitat site type
Area size
Species code (trees, bushes/shrubs, grasses)
Species cover % (trees, bushes/shrubs, grasses)
Usable parameters in the plant library (Green area specific):
Habitat type
Area size
Maintenance class<br>
11
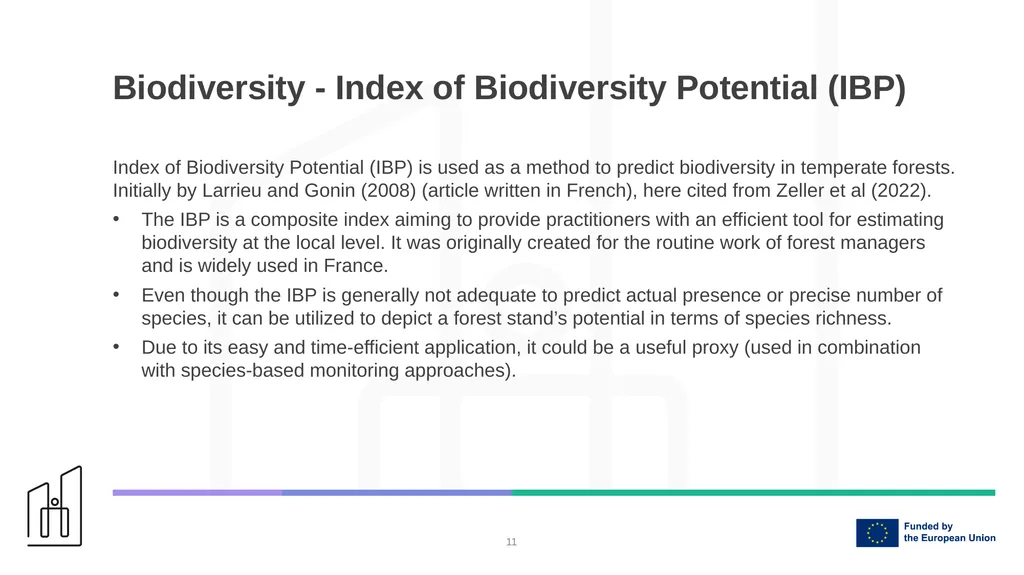
Biodiversity - Index of Biodiversity Potential (IBP) 11 Index of Biodiversity Potential (IBP) is used as a method to predict biodiversity in temperate forests. Initially by Larrieu and Gonin (2008) (article written in French), here cited from Zeller et al (2022).
The IBP is a composite index aiming to provide practitioners with an efficient tool for estimating biodiversity at the local level. It was originally created for the routine work of forest managers and is widely used in France.
Even though the IBP is generally not adequate to predict actual presence or precise number of species, it can be utilized to depict a forest stand’s potential in terms of species richness.
Due to its easy and time-efficient application, it could be a useful proxy (used in combination with species-based monitoring approaches).<br>
The IBP is a composite index aiming to provide practitioners with an efficient tool for estimating biodiversity at the local level. It was originally created for the routine work of forest managers and is widely used in France.
Even though the IBP is generally not adequate to predict actual presence or precise number of species, it can be utilized to depict a forest stand’s potential in terms of species richness.
Due to its easy and time-efficient application, it could be a useful proxy (used in combination with species-based monitoring approaches).<br>
12
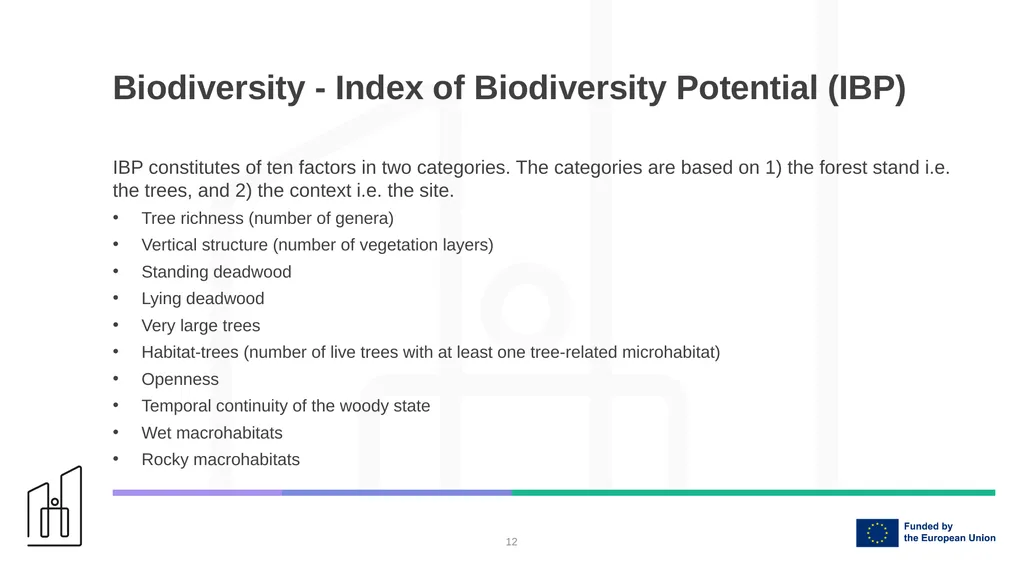
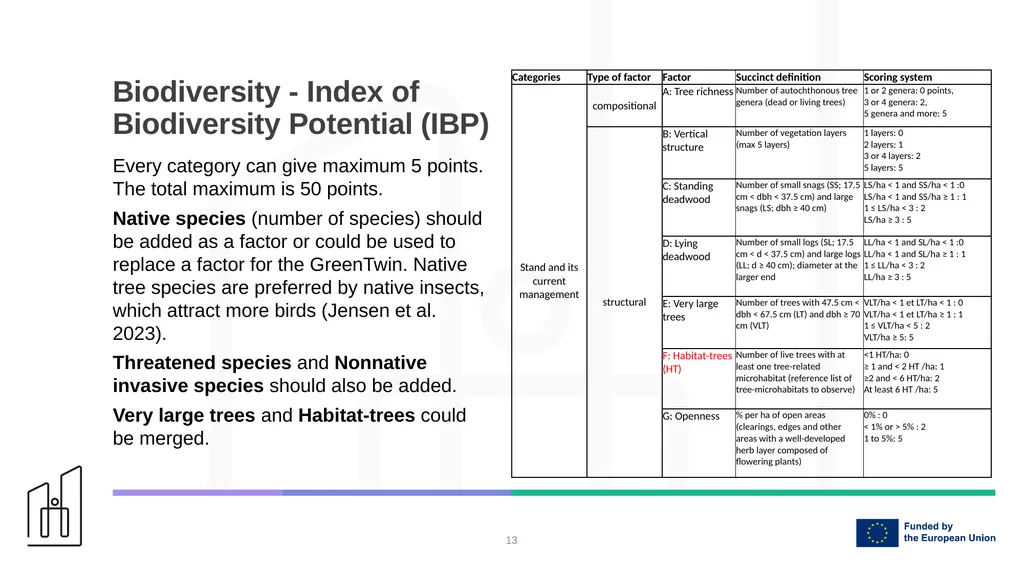
Biodiversity - Index of Biodiversity Potential (IBP) 12 IBP constitutes of ten factors in two categories. The categories are based on 1) the forest stand i.e. the trees, and 2) the context i.e. the site.
Tree richness (number of genera)
Vertical structure (number of vegetation layers)
Standing deadwood
Lying deadwood
Very large trees
Habitat-trees (number of live trees with at least one tree-related microhabitat)
Openness
Temporal continuity of the woody state
Wet macrohabitats
Rocky macrohabitats<br>
Tree richness (number of genera)
Vertical structure (number of vegetation layers)
Standing deadwood
Lying deadwood
Very large trees
Habitat-trees (number of live trees with at least one tree-related microhabitat)
Openness
Temporal continuity of the woody state
Wet macrohabitats
Rocky macrohabitats<br>
13
Biodiversity - Index of Biodiversity Potential (IBP) Every category can give maximum 5 points. The total maximum is 50 points.
Native species (number of species) should be added as a factor or could be used to replace a factor for the GreenTwin. Native tree species are preferred by native insects, which attract more birds (Jensen et al. 2023).
Threatened species and Nonnative invasive species should also be added.
Very large trees and Habitat-trees could be merged. 13<br>
Native species (number of species) should be added as a factor or could be used to replace a factor for the GreenTwin. Native tree species are preferred by native insects, which attract more birds (Jensen et al. 2023).
Threatened species and Nonnative invasive species should also be added.
Very large trees and Habitat-trees could be merged. 13<br>
14
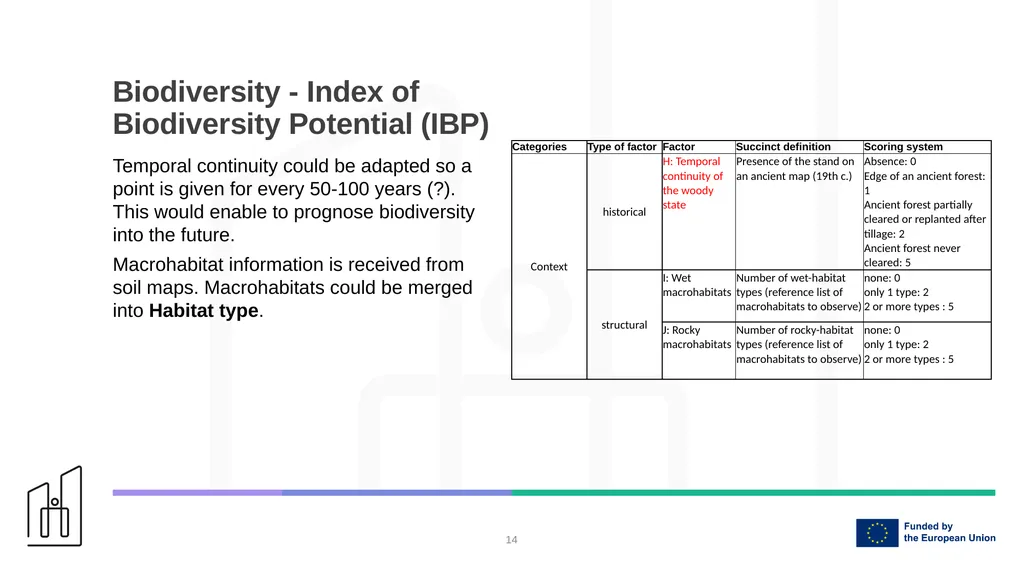
14 Biodiversity - Index of Biodiversity Potential (IBP) Temporal continuity could be adapted so a point is given for every 50-100 years (?). This would enable to prognose biodiversity into the future.
Macrohabitat information is received from soil maps. Macrohabitats could be merged into Habitat type.<br>
Macrohabitat information is received from soil maps. Macrohabitats could be merged into Habitat type.<br>
15
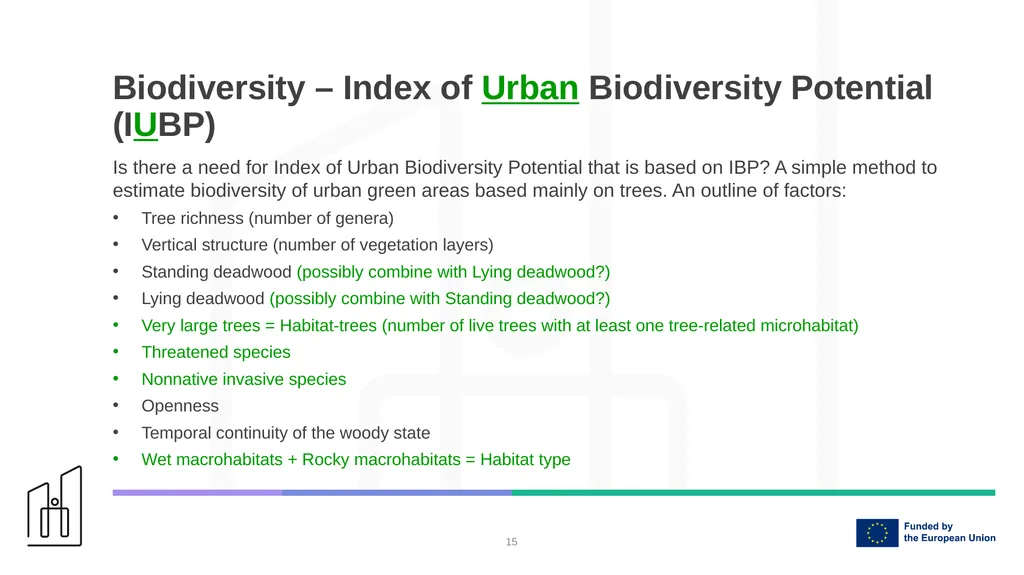
Biodiversity – Index of Urban Biodiversity Potential (IUBP) 15 Is there a need for Index of Urban Biodiversity Potential that is based on IBP? A simple method to estimate biodiversity of urban green areas based mainly on trees. An outline of factors:
Tree richness (number of genera)
Vertical structure (number of vegetation layers)
Standing deadwood (possibly combine with Lying deadwood?)
Lying deadwood (possibly combine with Standing deadwood?)
Very large trees = Habitat-trees (number of live trees with at least one tree-related microhabitat)
Threatened species
Nonnative invasive species
Openness
Temporal continuity of the woody state
Wet macrohabitats + Rocky macrohabitats = Habitat type<br>
Tree richness (number of genera)
Vertical structure (number of vegetation layers)
Standing deadwood (possibly combine with Lying deadwood?)
Lying deadwood (possibly combine with Standing deadwood?)
Very large trees = Habitat-trees (number of live trees with at least one tree-related microhabitat)
Threatened species
Nonnative invasive species
Openness
Temporal continuity of the woody state
Wet macrohabitats + Rocky macrohabitats = Habitat type<br>
16
Noise reduction 16 Tree height and belt width had positive relationships and visibility had a negative relationships with relative attenuation (Fang & Ling, 2004).
Tree belts have good noise reduction effect when d’ ≤ 8, and h’ = 0.15 or 0.3 (Fig. 3). That is, when the ratio of receiver and noise source height to tree height is 1:6.6 or 1:3.3, an effective noise reduction can be expected within a distance of eight times the tree height.
A tree belt is effective in noise reduction when both receiver and noise source height and tree belt visibility are low, the tree belt is high and wide, and the distance between the noise source and receiver was less than eight times that of the tree height.<br>
Tree belts have good noise reduction effect when d’ ≤ 8, and h’ = 0.15 or 0.3 (Fig. 3). That is, when the ratio of receiver and noise source height to tree height is 1:6.6 or 1:3.3, an effective noise reduction can be expected within a distance of eight times the tree height.
A tree belt is effective in noise reduction when both receiver and noise source height and tree belt visibility are low, the tree belt is high and wide, and the distance between the noise source and receiver was less than eight times that of the tree height.<br>
17
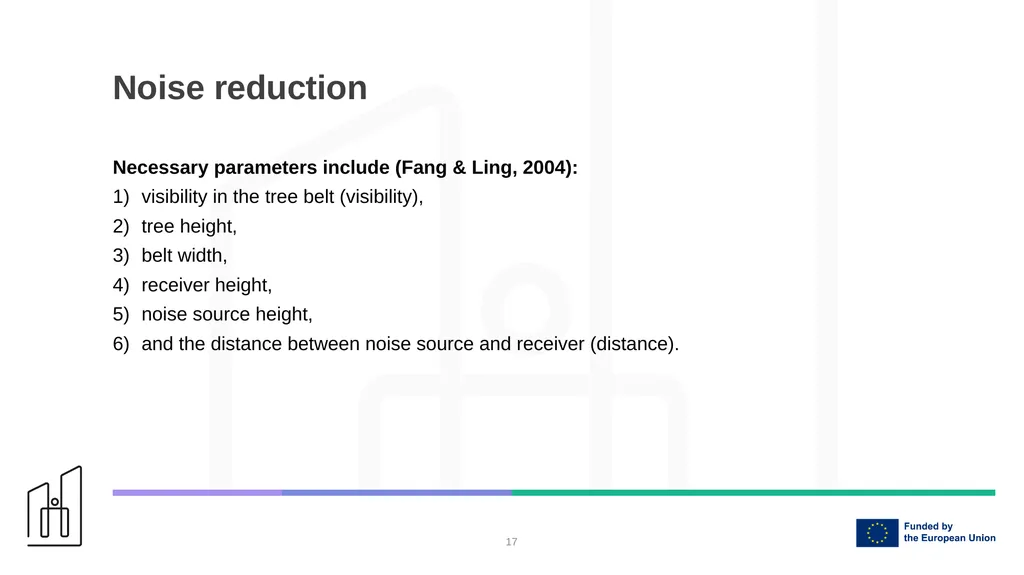
Noise reduction 17 Necessary parameters include (Fang & Ling, 2004):
visibility in the tree belt (visibility),
tree height,
belt width,
receiver height,
noise source height,
and the distance between noise source and receiver (distance).<br>
visibility in the tree belt (visibility),
tree height,
belt width,
receiver height,
noise source height,
and the distance between noise source and receiver (distance).<br>
18
Rainwater management 18 Species specific information on evapotransportation is unavailable for most of the species available in the Plant Library. Evapotransipration varies too much from species to species to enable generalizations.
Classification of tree species, based on their water absorption, by a group of experts could be a method to work around obtaining species specific data. This could be done by a panel of experts (e.g. dendrologists at Tallinn Botanical Garden) and could be done without in situ measurements.
Most articles on water absorption seem to focus on exotic tree species. Gray literature sources are available for a more general estimation of water absorption, but these are mainly from North America.<br>
Classification of tree species, based on their water absorption, by a group of experts could be a method to work around obtaining species specific data. This could be done by a panel of experts (e.g. dendrologists at Tallinn Botanical Garden) and could be done without in situ measurements.
Most articles on water absorption seem to focus on exotic tree species. Gray literature sources are available for a more general estimation of water absorption, but these are mainly from North America.<br>
19
Rainwater management 19 iTree Design tool enables an estimation of stormwater mitigation by a single tree. The tool is built on research by Xiao et al. (1998), Wang et al. (2008) and improved by Hirabayashi (2013). But the formula itself is based on canopy surface water storage and evaporation, data, which is currently unavailable in the Plant Library.
It is documented that urbanization (i.e. more impervious surfaces) leads to increased runoff (e.g. Moscrip & Montgomery, 1997). Therefore, rainwater management could be roughly estimated based on surface material type (pervious-impervious). But according to Shuster et al. (2008) runoff rate ratios are strongly affected by antecedent moisture condition. According to Pappas et al. (2008) slope grade, amount of rainfall and length of rainfall also factor in. This requires in-situ data, which is currently unavailable in the Plant Library.
Therefore, it might be reasonable that in the initial phase a relatively general categorization of surface materials based on their density is done for the GreenTwin.<br>
It is documented that urbanization (i.e. more impervious surfaces) leads to increased runoff (e.g. Moscrip & Montgomery, 1997). Therefore, rainwater management could be roughly estimated based on surface material type (pervious-impervious). But according to Shuster et al. (2008) runoff rate ratios are strongly affected by antecedent moisture condition. According to Pappas et al. (2008) slope grade, amount of rainfall and length of rainfall also factor in. This requires in-situ data, which is currently unavailable in the Plant Library.
Therefore, it might be reasonable that in the initial phase a relatively general categorization of surface materials based on their density is done for the GreenTwin.<br>
20
Microclimate regulation 20 Species specific information on evapotransportation is unavailable for most of the species available in the Plant Library. Evapotransipration varies too much from species to species to enable generalizations.
Several studies have demonstrated the positive effect of green infrastructure on lowering daytime temperatures (e.g. Yu & Hien, 2006; Bowler et al., 2010). But temperature difference in these studies can vary greatly depending on the site (size, paved area, amount of vegetation etc.) and climate.
Microclimate regulation could be estimated based on green area size, shape, vegetation cover, connectivity.
Date of leaf outbreak and Date of leaf fall would make the estimate more precise.<br>
Several studies have demonstrated the positive effect of green infrastructure on lowering daytime temperatures (e.g. Yu & Hien, 2006; Bowler et al., 2010). But temperature difference in these studies can vary greatly depending on the site (size, paved area, amount of vegetation etc.) and climate.
Microclimate regulation could be estimated based on green area size, shape, vegetation cover, connectivity.
Date of leaf outbreak and Date of leaf fall would make the estimate more precise.<br>
21
Microclimate regulation 21 Following traits should be considered for green areas:
Size - The area around a park that benefits from the cooling effect increases with park size. Lin et al., 2015. Zhang et al. 2014. (Although, no specific scale can be given at this moment)
Shape - Compact greenspaces in the shape of a circle or square provide significant cooling effects in terms of intensity and efficiency (Yu et al. 2017). More on shape in Zhang et al. 2014.
Vegetation cover - Parks and other open spaces should be designed with less than 50% paved area and at least 30% trees, shrubs, and other shadings (Chang and Li, 2014).
Edge and Connectivity - Elements such as shape, edge or connectivity have cooling effects (Chen et al., 2014)
NB! A large number of relevant studies have been conducted in warmer climates.<br>
Size - The area around a park that benefits from the cooling effect increases with park size. Lin et al., 2015. Zhang et al. 2014. (Although, no specific scale can be given at this moment)
Shape - Compact greenspaces in the shape of a circle or square provide significant cooling effects in terms of intensity and efficiency (Yu et al. 2017). More on shape in Zhang et al. 2014.
Vegetation cover - Parks and other open spaces should be designed with less than 50% paved area and at least 30% trees, shrubs, and other shadings (Chang and Li, 2014).
Edge and Connectivity - Elements such as shape, edge or connectivity have cooling effects (Chen et al., 2014)
NB! A large number of relevant studies have been conducted in warmer climates.<br>
22
Pollination 22 Connectedness of a landscape is important both to bumblebee movement and to those plants which depend on bumblebees for pollination services. (Cranmer et al., 2012)
Increased landscape heterogeneity and landscape configuration can play an important role in the maintenance of diverse pollinator communities. (Senapathi et al., 2017)
Large-bodied bees, Bombus and Apis species, were positively associated with increasing amounts of impervious cover, while the abundance of small-bodied soil nesting Halictus species increased as the proportion of flower area increased. Bee richness declined with increasing levels of impervious cover, while bee community composition changed along a gradient of increasing impervious cover. (Bennett & Lovell, 2019)
Adding honeybee hives could negatively affect wild pollinators in urban areas. Allotments and domestic gardens benefit urban pollinator communities. Adding flowers and nesting sites and reducing grass mowing benefits pollinators. (Baldock, 2020)<br>
Increased landscape heterogeneity and landscape configuration can play an important role in the maintenance of diverse pollinator communities. (Senapathi et al., 2017)
Large-bodied bees, Bombus and Apis species, were positively associated with increasing amounts of impervious cover, while the abundance of small-bodied soil nesting Halictus species increased as the proportion of flower area increased. Bee richness declined with increasing levels of impervious cover, while bee community composition changed along a gradient of increasing impervious cover. (Bennett & Lovell, 2019)
Adding honeybee hives could negatively affect wild pollinators in urban areas. Allotments and domestic gardens benefit urban pollinator communities. Adding flowers and nesting sites and reducing grass mowing benefits pollinators. (Baldock, 2020)<br>
23
Pollination 23 Use date of flower outbreak for individual trees to demonstrate possibilities for pollination.
Surface type (impervious vs permeable), habitat type (lawn, forest, allotment, meadow etc.) and landscape heterogeneity (variation of surface type and vegetation on a specified area) can be used to estimate possibilities for pollination (or in some cases rather the habitat quality for some pollinators).
Maintenance frequency would enable a more exact estimation of potential pollination service on lawns and open green areas. Also Length of flowering enables a more exact estimation.<br>
Surface type (impervious vs permeable), habitat type (lawn, forest, allotment, meadow etc.) and landscape heterogeneity (variation of surface type and vegetation on a specified area) can be used to estimate possibilities for pollination (or in some cases rather the habitat quality for some pollinators).
Maintenance frequency would enable a more exact estimation of potential pollination service on lawns and open green areas. Also Length of flowering enables a more exact estimation.<br>
24
The Relevance of Pollination 24 Pollination plays a crucial role in ensuring the availability of food, maintaining biodiversity, producing medicines, and contributing to the economy, making it an essential process for humans.
It is essential for the production of many of the fruits, vegetables, and nuts that make up a significant portion of our diet. Without pollination, many of these crops would not produce fruit or would produce very low yields.
It is a process that helps to maintain the diversity of plant species in our ecosystems. Without pollination, many plant species would not be able to reproduce, leading to a loss of biodiversity and potentially destabilizing the entire ecosystem.
Pollination is also important to produce many medicinal plants. Many of the medicines we use today are derived from plants that rely on pollination for reproduction.
Pollination has significant economic value. According to some estimates, pollination services contribute billions of dollars to the global economy each year.<br>
It is essential for the production of many of the fruits, vegetables, and nuts that make up a significant portion of our diet. Without pollination, many of these crops would not produce fruit or would produce very low yields.
It is a process that helps to maintain the diversity of plant species in our ecosystems. Without pollination, many plant species would not be able to reproduce, leading to a loss of biodiversity and potentially destabilizing the entire ecosystem.
Pollination is also important to produce many medicinal plants. Many of the medicines we use today are derived from plants that rely on pollination for reproduction.
Pollination has significant economic value. According to some estimates, pollination services contribute billions of dollars to the global economy each year.<br>
25
Recreation and health 25 People recognize urban areas with high biodiversity and appreciate them, and have reported being happier in sites with a greater variety of habitats (Gunnarsson et al., 2017; Cameron et al., 2020). This is further enhanced when then green areas show signs of management so-called cues-to-care (Nassauer, 1988; Li and Nassauer, 2020). Therefore, once we know areas with high biodiversity, we also have areas with moderate to high recreation value. But this doesn’t show the whole picture! Maintenance frequency would enable a more exact estimation.
People have responded being happier in sites with greater avian biodiversity (Hedblom et al., 2014; Cameron et al., 2020). Urban avian biodiversity is increased by canopy cover and multi-layered vegetation (Sandström et al., 2006; Threlfall et al., 2017).<br>
People have responded being happier in sites with greater avian biodiversity (Hedblom et al., 2014; Cameron et al., 2020). Urban avian biodiversity is increased by canopy cover and multi-layered vegetation (Sandström et al., 2006; Threlfall et al., 2017).<br>
26
Recreation and health 26 The 3-30-300 rule is an evidence-based rule proposed by Cecil Konijnendijk. According to the rule everyone should see at least 3 trees from their home; each neighborhood should have 30% tree canopy cover; and the maximum distance from to nearest public green space should not exceed 300 meters.
Besides having an impact on mental and physical health this rule might give implications on better microclimates, and possibly reduction of noise and air pollution. (Konijnendijk, C. Biophilic Cities Journal, vol. 4 no. 2).<br>
Besides having an impact on mental and physical health this rule might give implications on better microclimates, and possibly reduction of noise and air pollution. (Konijnendijk, C. Biophilic Cities Journal, vol. 4 no. 2).<br>
27
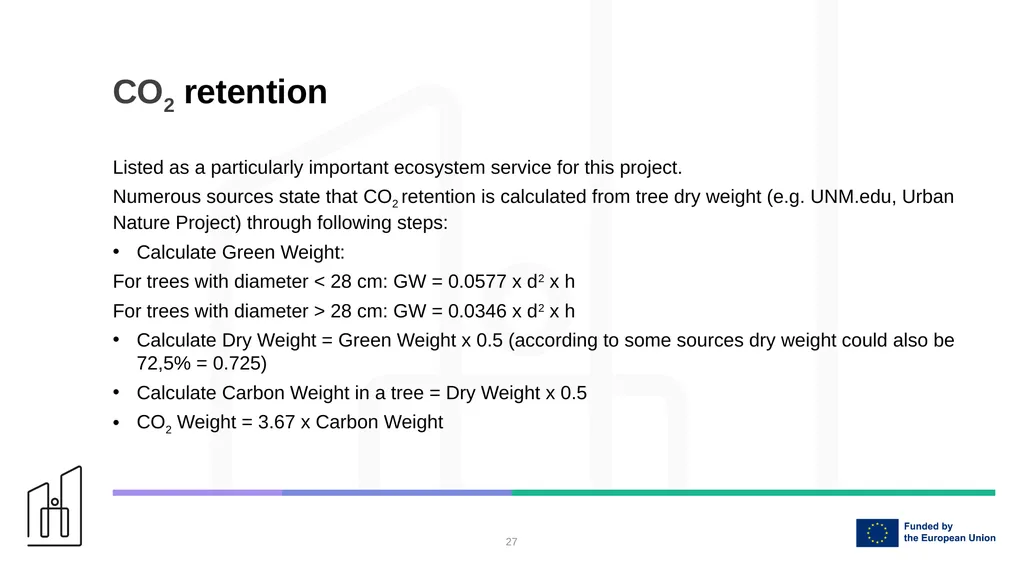
CO2 retention 27 Listed as a particularly important ecosystem service for this project.
Numerous sources state that CO2 retention is calculated from tree dry weight (e.g. UNM.edu, Urban Nature Project) through following steps:
Calculate Green Weight:
For trees with diameter < 28 cm: GW = 0.0577 x d2 x h
For trees with diameter > 28 cm: GW = 0.0346 x d2 x h
Calculate Dry Weight = Green Weight x 0.5 (according to some sources dry weight could also be 72,5% = 0.725)
Calculate Carbon Weight in a tree = Dry Weight x 0.5
CO2 Weight = 3.67 x Carbon Weight<br>
Numerous sources state that CO2 retention is calculated from tree dry weight (e.g. UNM.edu, Urban Nature Project) through following steps:
Calculate Green Weight:
For trees with diameter < 28 cm: GW = 0.0577 x d2 x h
For trees with diameter > 28 cm: GW = 0.0346 x d2 x h
Calculate Dry Weight = Green Weight x 0.5 (according to some sources dry weight could also be 72,5% = 0.725)
Calculate Carbon Weight in a tree = Dry Weight x 0.5
CO2 Weight = 3.67 x Carbon Weight<br>
28
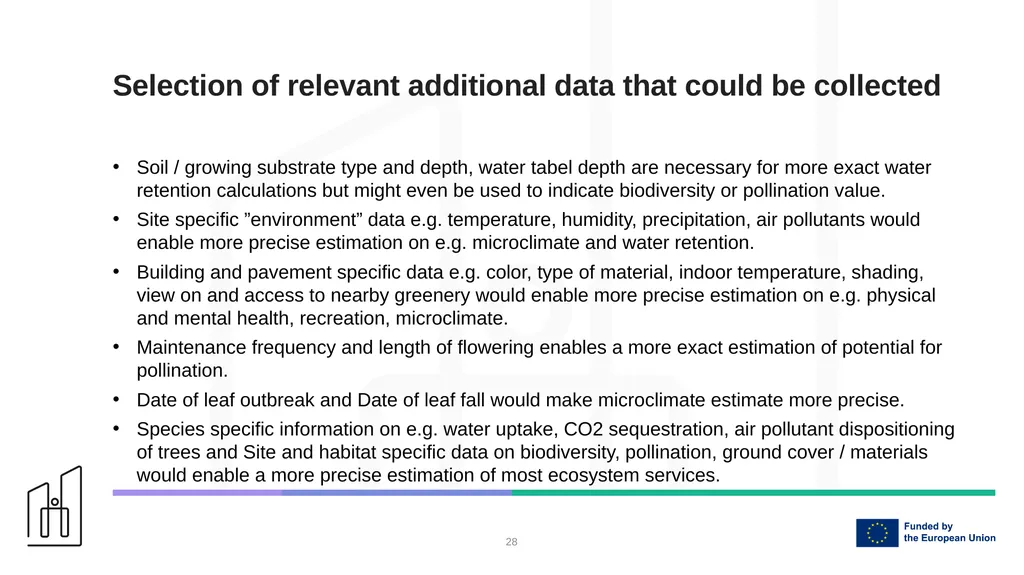
Selection of relevant additional data that could be collected 28 Soil / growing substrate type and depth, water tabel depth are necessary for more exact water retention calculations but might even be used to indicate biodiversity or pollination value.
Site specific ”environment” data e.g. temperature, humidity, precipitation, air pollutants would enable more precise estimation on e.g. microclimate and water retention.
Building and pavement specific data e.g. color, type of material, indoor temperature, shading, view on and access to nearby greenery would enable more precise estimation on e.g. physical and mental health, recreation, microclimate.
Maintenance frequency and length of flowering enables a more exact estimation of potential for pollination.
Date of leaf outbreak and Date of leaf fall would make microclimate estimate more precise.
Species specific information on e.g. water uptake, CO2 sequestration, air pollutant dispositioning of trees and Site and habitat specific data on biodiversity, pollination, ground cover / materials would enable a more precise estimation of most ecosystem services.<br>
Site specific ”environment” data e.g. temperature, humidity, precipitation, air pollutants would enable more precise estimation on e.g. microclimate and water retention.
Building and pavement specific data e.g. color, type of material, indoor temperature, shading, view on and access to nearby greenery would enable more precise estimation on e.g. physical and mental health, recreation, microclimate.
Maintenance frequency and length of flowering enables a more exact estimation of potential for pollination.
Date of leaf outbreak and Date of leaf fall would make microclimate estimate more precise.
Species specific information on e.g. water uptake, CO2 sequestration, air pollutant dispositioning of trees and Site and habitat specific data on biodiversity, pollination, ground cover / materials would enable a more precise estimation of most ecosystem services.<br>
29
Estimation of key ecosystem services in the Green Twin Martin Allik, landscape architect
31-05-2023 29<br>
31-05-2023 29<br>