Examining Road Transport Services in Kenya: A Case Study for Tea Value Chain Study undertaken by Christopher H. Onyango, National Consultant Presented by Komi Tsowou, Africa and LDCs Division, UNCTAD Contact : tsowouun.org Development
"Examining Road Transport Services in Kenya: A Case" is the property of its rightful owner. Permission is granted to
download and print the materials on this website for personal, non-commercial use only, and to display it
on your personal computer provided you do not modify the materials and that you retain all copyright
notices contained in the materials. By downloading content from our website, you accept the terms of this
agreement.
Presentation Transcript
01
Examining Road Transport Services in Kenya: A Case Study for Tea Value Chain
Study undertaken by Christopher H. Onyango, National Consultant
Presented by Komi Tsowou, Africa and LDCs Division, UNCTAD
Contact : tsowou@un.org Development Account project on Trade in Services<br>
02
OUTLINE Context and objectives of the Study
Methodology
Key findings
Policy recommendations<br>
03
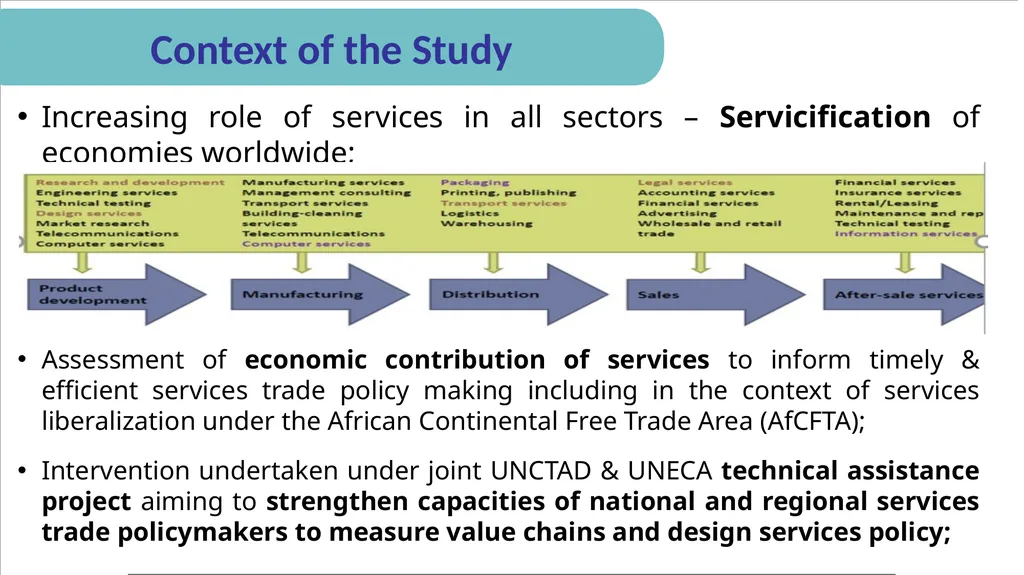
Context of the Study Increasing role of services in all sectors – Servicification of economies worldwide;
Assessment of economic contribution of services to inform timely & efficient services trade policy making including in the context of services liberalization under the African Continental Free Trade Area (AfCFTA);
Intervention undertaken under joint UNCTAD & UNECA technical assistance project aiming to strengthen capacities of national and regional services trade policymakers to measure value chains and design services policy;<br>
04
Objectives of the case Study Examine the contributions of road transport/freight services to Kenya’s tea value chain;
Assess the degree to which road transport sector contributes to production and export of tea and associated investments, employment and integration in RVCs;
Identify the emerging opportunities and challenges for the road transport services sector;
Analyze policy gaps in transport services with a view to improve its contribution to tea value chains and overall economic performance;<br>
05
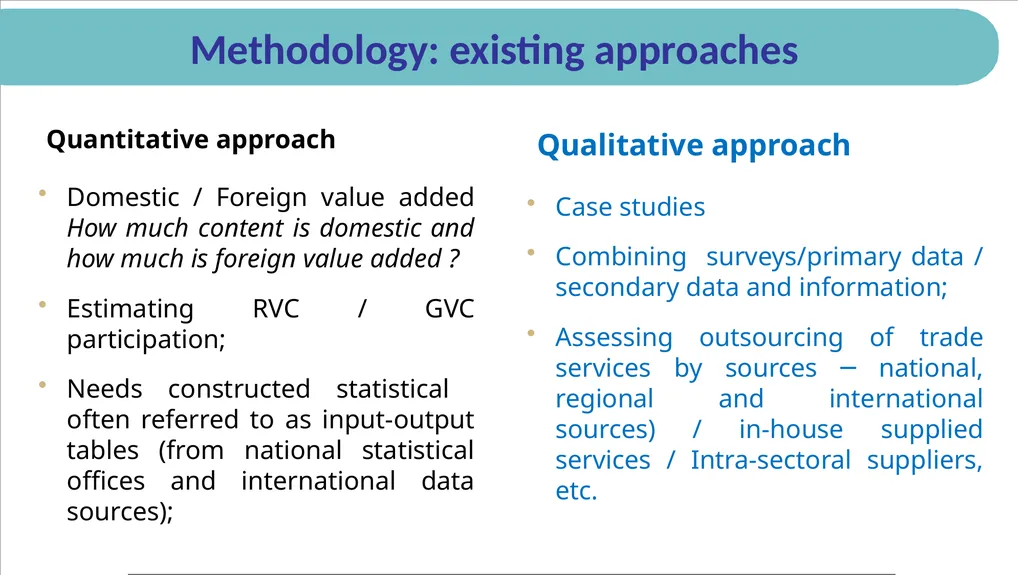
Methodology: existing approaches Domestic / Foreign value added How much content is domestic and how much is foreign value added ?
Estimating RVC / GVC participation;
Needs constructed statistical often referred to as input-output tables (from national statistical offices and international data sources); Case studies
Combining surveys/primary data / secondary data and information;
Assessing outsourcing of trade services by sources ─ national, regional and international sources) / in-house supplied services / Intra-sectoral suppliers, etc. Quantitative approach Qualitative approach<br>
06
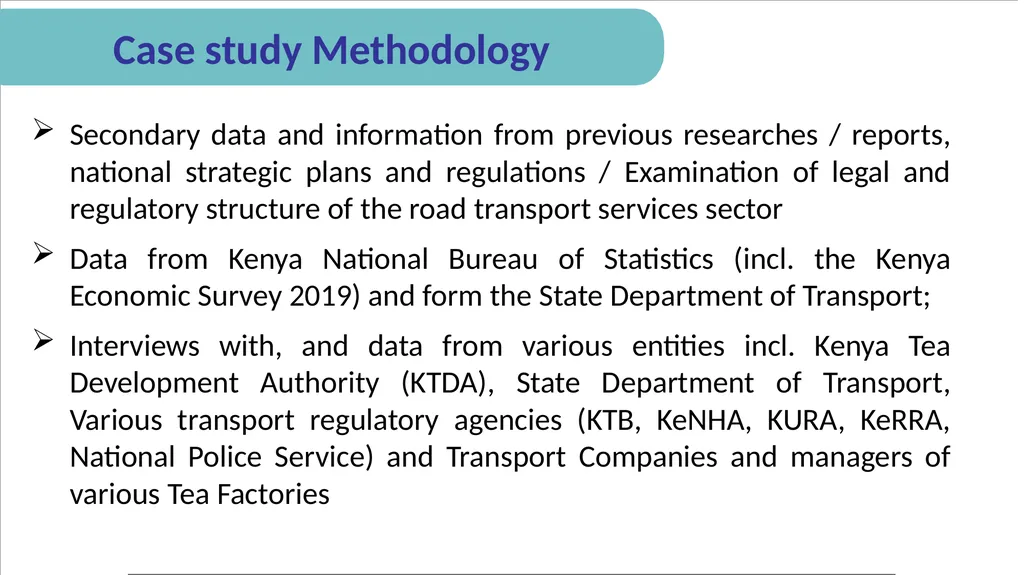
Case study Methodology Secondary data and information from previous researches / reports, national strategic plans and regulations / Examination of legal and regulatory structure of the road transport services sector
Data from Kenya National Bureau of Statistics (incl. the Kenya Economic Survey 2019) and form the State Department of Transport;
Interviews with, and data from various entities incl. Kenya Tea Development Authority (KTDA), State Department of Transport, Various transport regulatory agencies (KTB, KeNHA, KURA, KeRRA, National Police Service) and Transport Companies and managers of various Tea Factories<br>
07
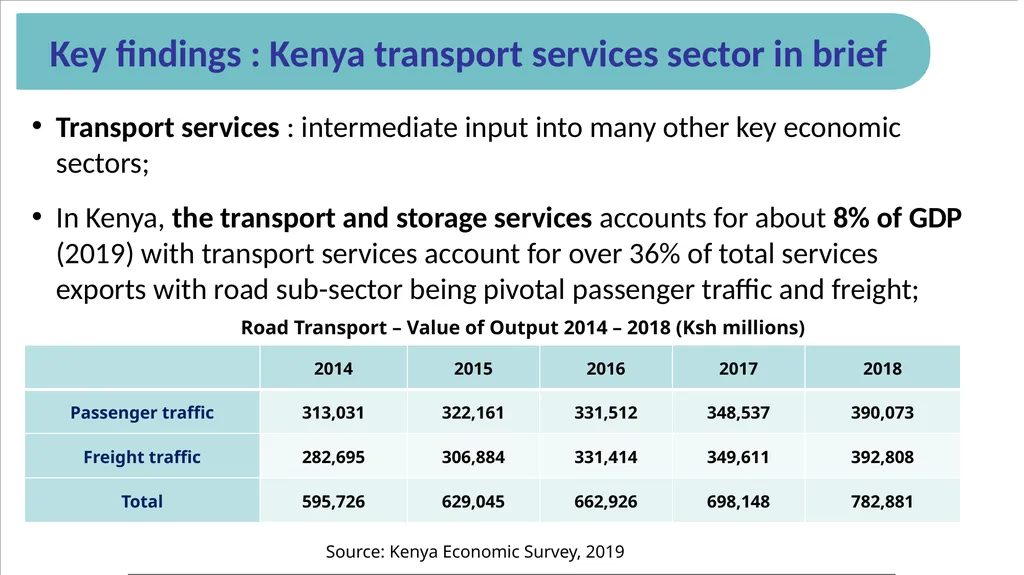
Key findings : Kenya transport services sector in brief Transport services : intermediate input into many other key economic sectors;
In Kenya, the transport and storage services accounts for about 8% of GDP (2019) with transport services account for over 36% of total services exports with road sub-sector being pivotal passenger traffic and freight; Road Transport – Value of Output 2014 – 2018 (Ksh millions) Source: Kenya Economic Survey, 2019<br>
08
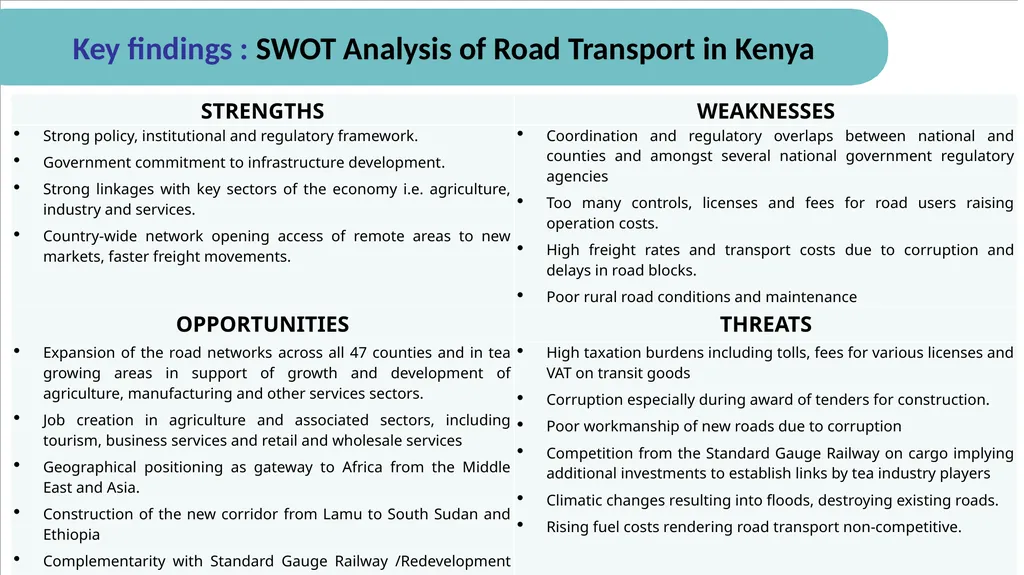
Key findings : SWOT Analysis of Road Transport in Kenya<br>
09
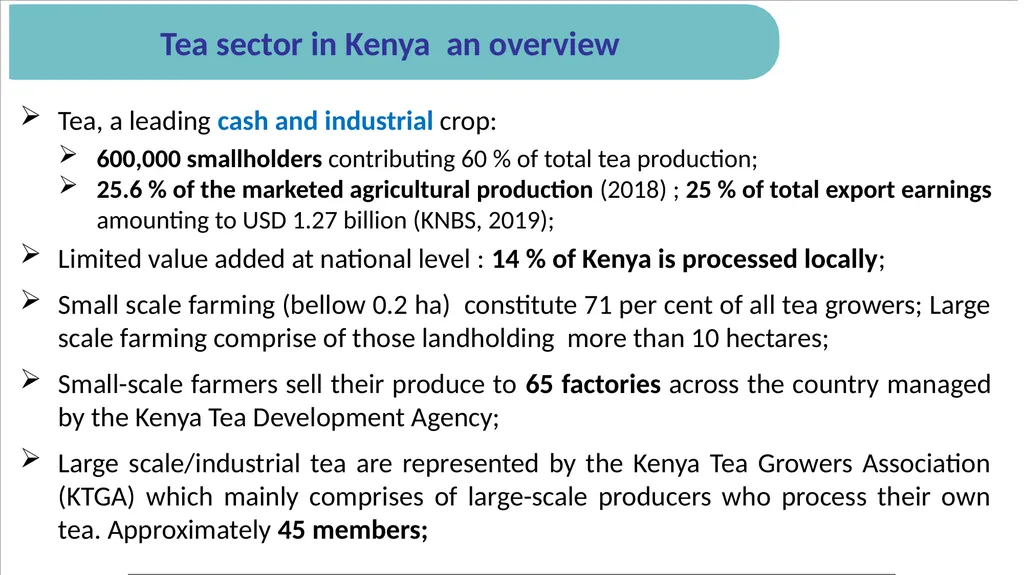
Tea sector in Kenya an overview Tea, a leading cash and industrial crop:
600,000 smallholders contributing 60 % of total tea production;
25.6 % of the marketed agricultural production (2018) ; 25 % of total export earnings amounting to USD 1.27 billion (KNBS, 2019);
Limited value added at national level : 14 % of Kenya is processed locally;
Small scale farming (bellow 0.2 ha) constitute 71 per cent of all tea growers; Large scale farming comprise of those landholding more than 10 hectares;
Small-scale farmers sell their produce to 65 factories across the country managed by the Kenya Tea Development Agency;
Large scale/industrial tea are represented by the Kenya Tea Growers Association (KTGA) which mainly comprises of large-scale producers who process their own tea. Approximately 45 members;<br>
10
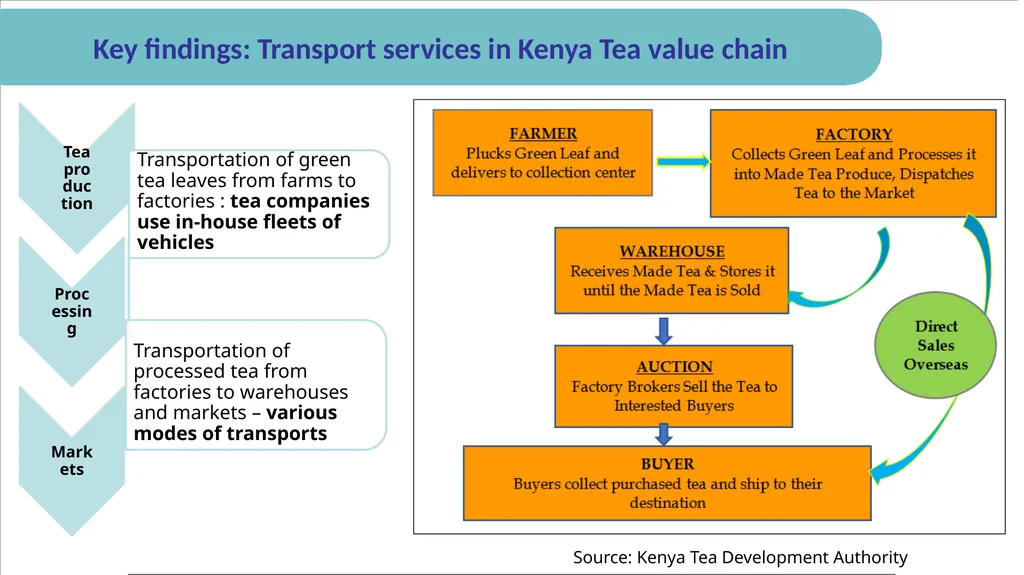
Key findings: Transport services in Kenya Tea value chain Source: Kenya Tea Development Authority<br>
11
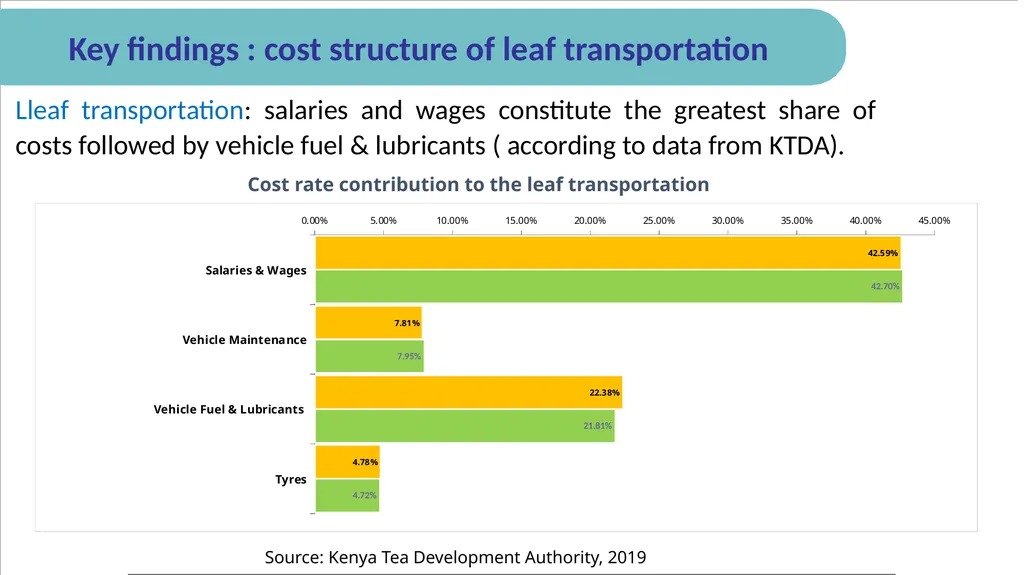
Key findings : cost structure of leaf transportation Cost rate contribution to the leaf transportation Source: Kenya Tea Development Authority, 2019 Lleaf transportation: salaries and wages constitute the greatest share of costs followed by vehicle fuel & lubricants ( according to data from KTDA).<br>
12
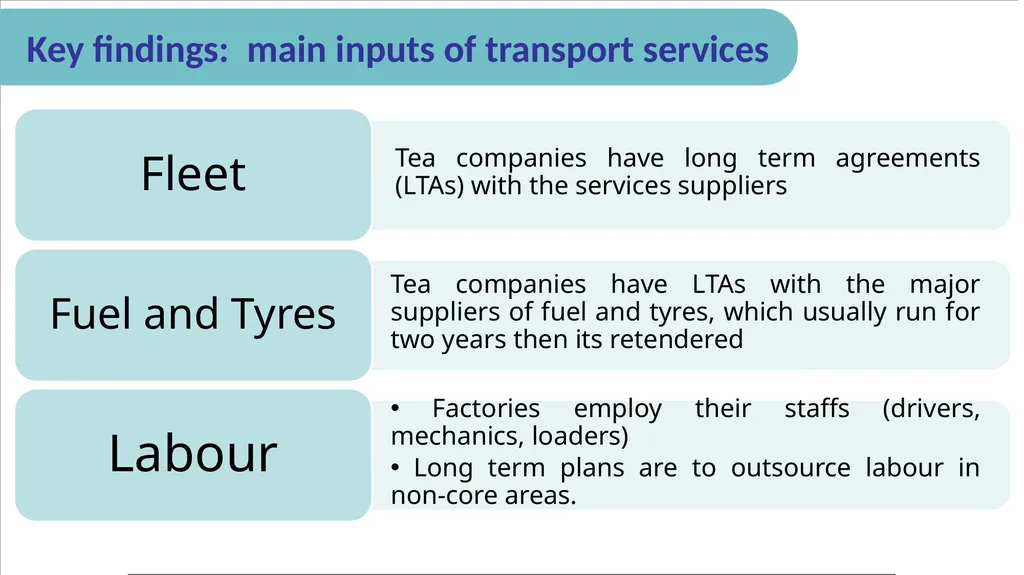
Key findings: main inputs of transport services …<br>
13
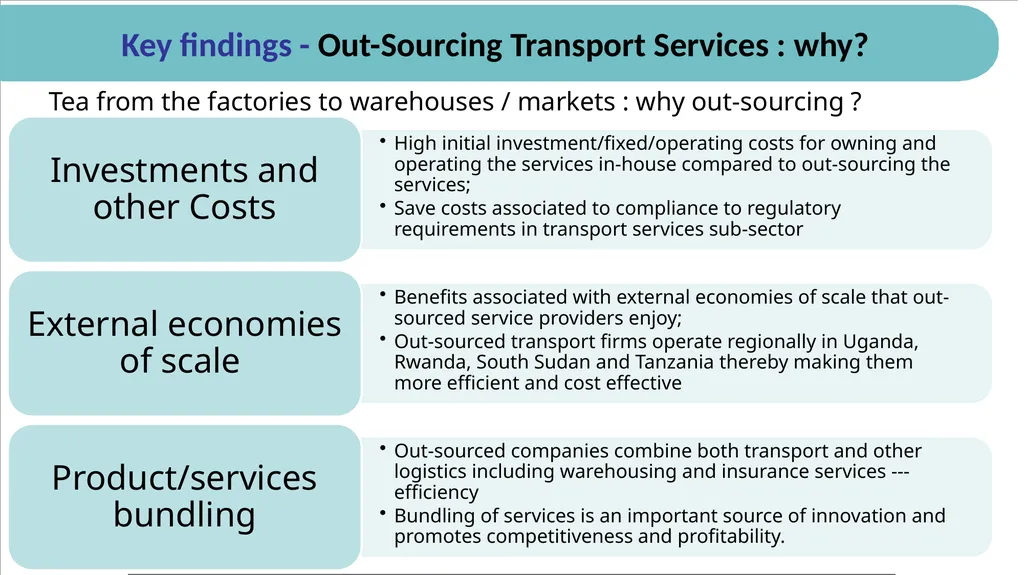
Key findings - Out-Sourcing Transport Services : why? Tea from the factories to warehouses / markets : why out-sourcing ?<br>
14
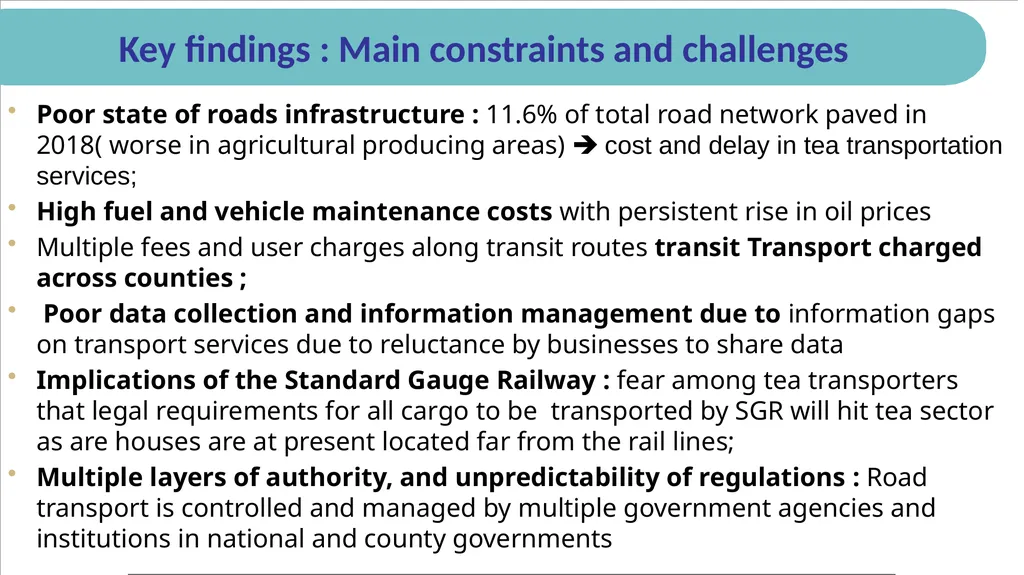
Key findings : Main constraints and challenges Poor state of roads infrastructure : 11.6% of total road network paved in 2018( worse in agricultural producing areas) cost and delay in tea transportation services;
High fuel and vehicle maintenance costs with persistent rise in oil prices
Multiple fees and user charges along transit routes transit Transport charged across counties ;
Poor data collection and information management due to information gaps on transport services due to reluctance by businesses to share data
Implications of the Standard Gauge Railway : fear among tea transporters that legal requirements for all cargo to be transported by SGR will hit tea sector as are houses are at present located far from the rail lines;
Multiple layers of authority, and unpredictability of regulations : Road transport is controlled and managed by multiple government agencies and institutions in national and county governments<br>
15
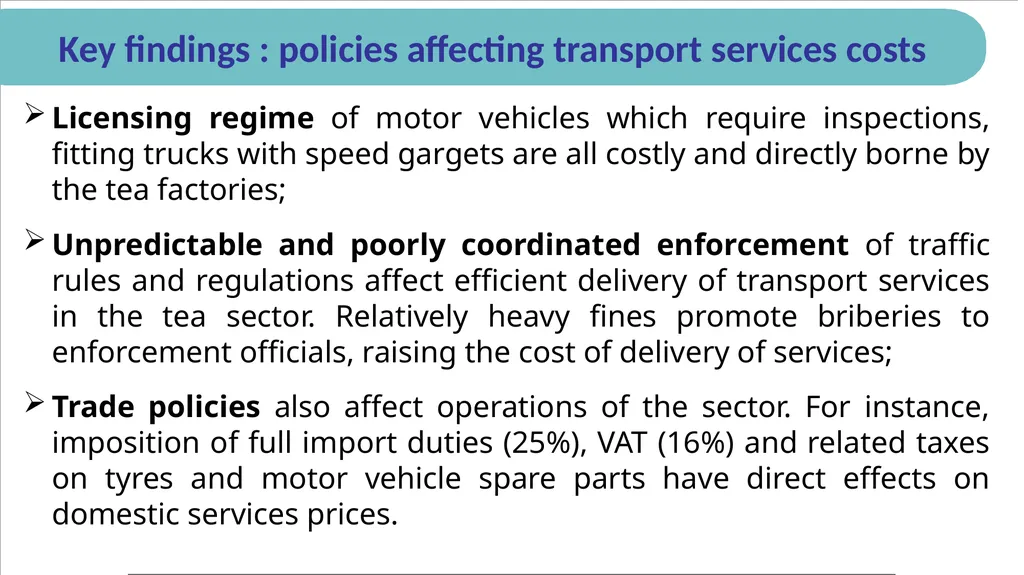
Key findings : policies affecting transport services costs Licensing regime of motor vehicles which require inspections, fitting trucks with speed gargets are all costly and directly borne by the tea factories;
Unpredictable and poorly coordinated enforcement of traffic rules and regulations affect efficient delivery of transport services in the tea sector. Relatively heavy fines promote briberies to enforcement officials, raising the cost of delivery of services;
Trade policies also affect operations of the sector. For instance, imposition of full import duties (25%), VAT (16%) and related taxes on tyres and motor vehicle spare parts have direct effects on domestic services prices.<br>
16
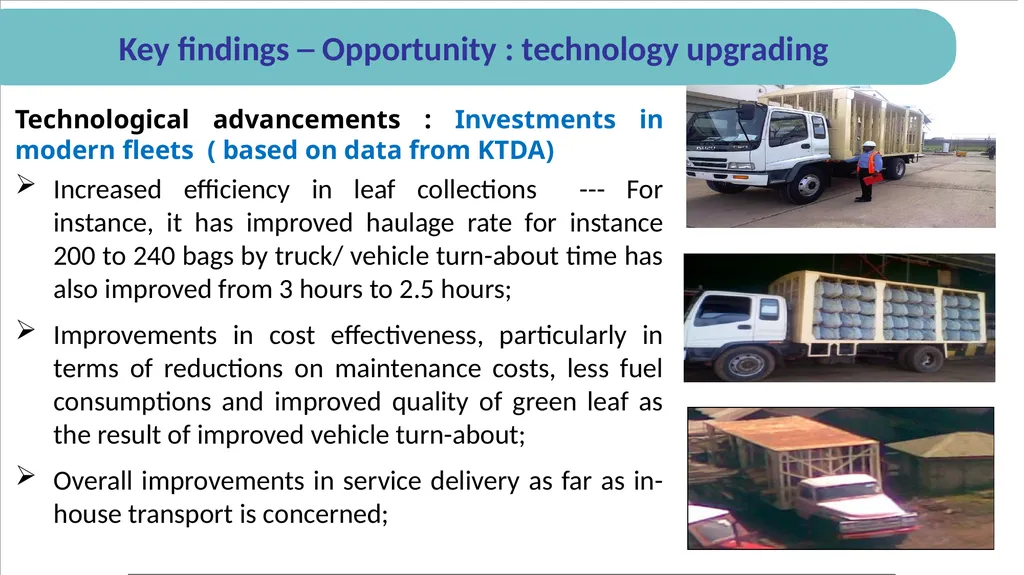
Key findings ─ Opportunity : technology upgrading Technological advancements : Investments in modern fleets ( based on data from KTDA)
Increased efficiency in leaf collections --- For instance, it has improved haulage rate for instance 200 to 240 bags by truck/ vehicle turn-about time has also improved from 3 hours to 2.5 hours;
Improvements in cost effectiveness, particularly in terms of reductions on maintenance costs, less fuel consumptions and improved quality of green leaf as the result of improved vehicle turn-about;
Overall improvements in service delivery as far as in-house transport is concerned;<br>
17
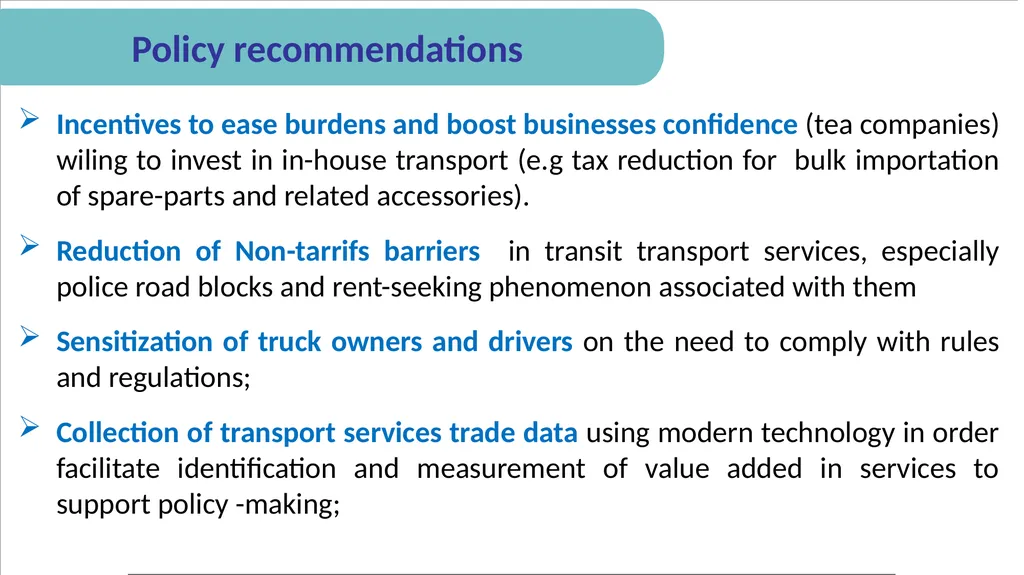
Policy recommendations Incentives to ease burdens and boost businesses confidence (tea companies) wiling to invest in in-house transport (e.g tax reduction for bulk importation of spare-parts and related accessories).
Reduction of Non-tarrifs barriers in transit transport services, especially police road blocks and rent-seeking phenomenon associated with them
Sensitization of truck owners and drivers on the need to comply with rules and regulations;
Collection of transport services trade data using modern technology in order facilitate identification and measurement of value added in services to support policy -making;<br>
18
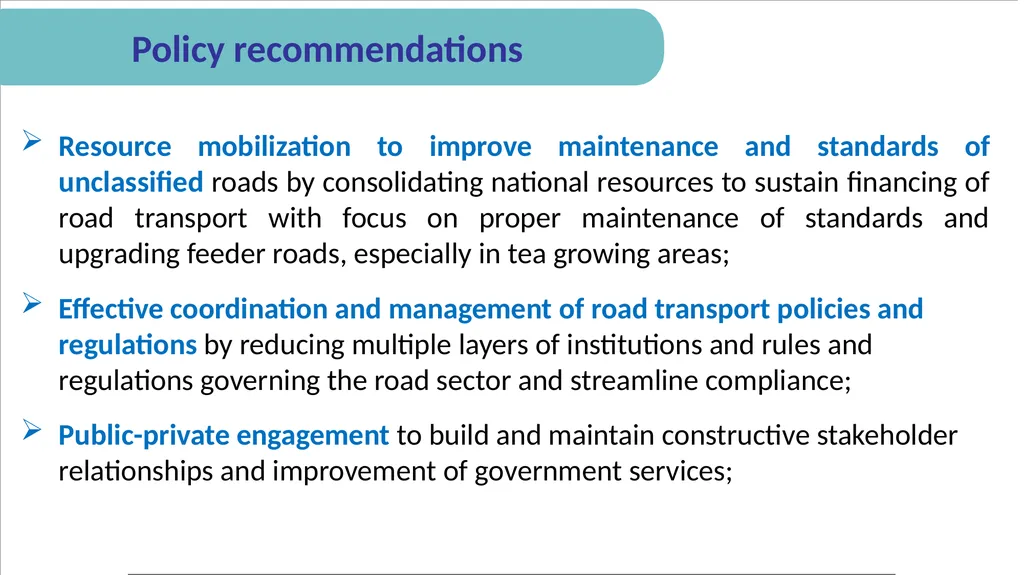
Policy recommendations Resource mobilization to improve maintenance and standards of unclassified roads by consolidating national resources to sustain financing of road transport with focus on proper maintenance of standards and upgrading feeder roads, especially in tea growing areas;
Effective coordination and management of road transport policies and regulations by reducing multiple layers of institutions and rules and regulations governing the road sector and streamline compliance;
Public-private engagement to build and maintain constructive stakeholder relationships and improvement of government services;<br>
19
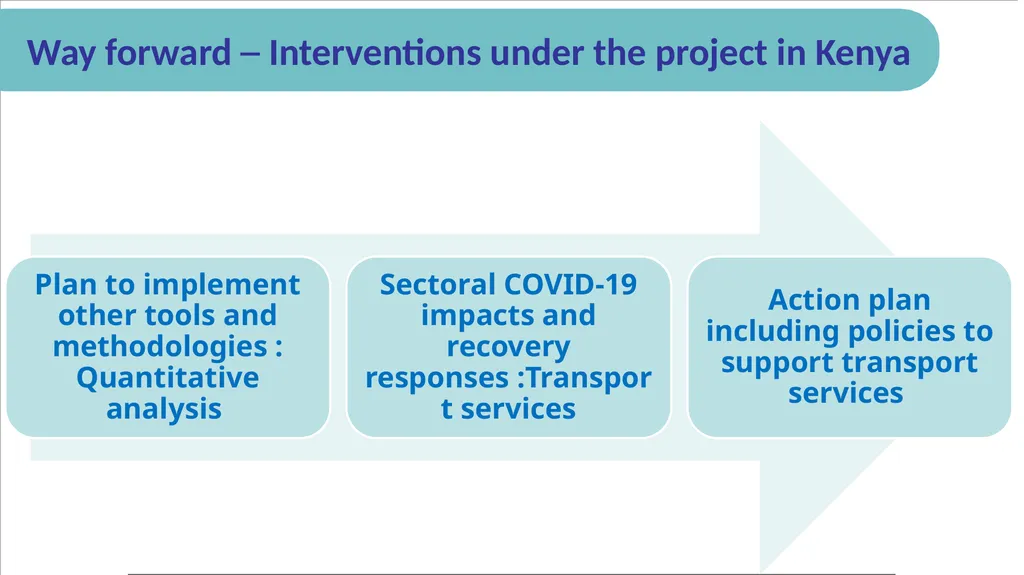
Way forward ─ Interventions under the project in Kenya<br>