
Exploring racial disparity How it affects children










Description: Exploring racial disparity How it affects children in their early years and within the youth justice system August 2020 Message from Keith Fraser, YJB Chairman: If we truly want to bring about change and live in a fair society with equal
Related Topics
Download Presentation
"Exploring racial disparity How it affects children" is the property of its rightful owner. Permission is granted to download and print the materials on this website for personal, non-commercial use only, and to display it on your personal computer provided you do not modify the materials and that you retain all copyright notices contained in the materials. By downloading content from our website, you accept the terms of this agreement.
Presentation Transcript
slide1. Exploring racial disparity How it affects children in their early years and within the youth justice system
August 2020<br>
slide2. Message from Keith Fraser, YJB Chairman:
“If we truly want to bring about change and live in a fair society with equal access to opportunities we must ensure that over-representation remains at the forefront of our thinking.
“If you work in the youth justice system, please ask yourself, are children from black, Asian and minority ethnic backgrounds over-represented in your area?
“If so, can you explain why that is, and if you can’t what are you going to do about it?”<br>
slide3. Introduction
We have produced this presentation to highlight the areas where over-representation occurs, and show how, from a very early age and within the youth justice system, there are systemic and institutional prejudices that result in some children not receiving equal treatment.
It’s unacceptable that a child is more likely to be criminalised because of their background. That is why, in our business plan, we have outlined the work we intend to deliver to tackle ethnic disproportionality within the youth justice system.
We have also included a summary of current plans for the YJB and Youth Custody Service that will make a difference.<br>
slide4. Children in England and Wales
Data from the 2011 Census provides a breakdown of the number of children in England and Wales by ethnicity.
White, 81%
Asian, 9%
Black, 4%
Mixed, 4%
Other, 1% Source: https://www.ons.gov.uk/census/2011census/howourcensusworks/howdidwedoin2011/2011
censusgeneralreport<br>
slide5. The youth justice workforce
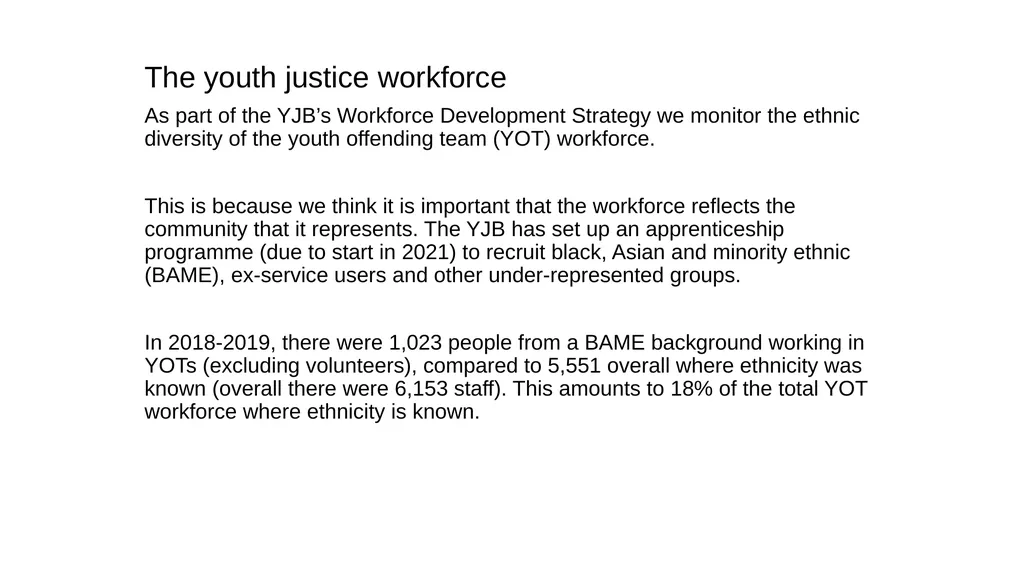
As part of the YJB’s Workforce Development Strategy we monitor the ethnic diversity of the youth offending team (YOT) workforce.
This is because we think it is important that the workforce reflects the community that it represents. The YJB has set up an apprenticeship programme (due to start in 2021) to recruit black, Asian and minority ethnic (BAME), ex-service users and other under-represented groups.
In 2018-2019, there were 1,023 people from a BAME background working in YOTs (excluding volunteers), compared to 5,551 overall where ethnicity was known (overall there were 6,153 staff). This amounts to 18% of the total YOT workforce where ethnicity is known.<br>
slide6. The youth justice workforce
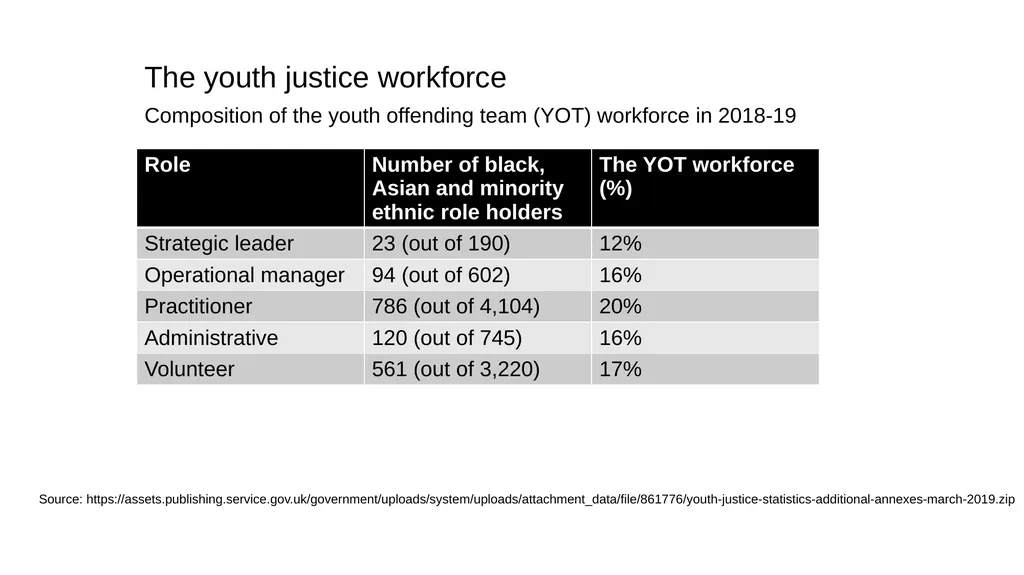
Composition of the youth offending team (YOT) workforce in 2018-19 Source: https://assets.publishing.service.gov.uk/government/uploads/system/uploads/attachment_data/file/861776/youth-justice-statistics-additional-annexes-march-2019.zip<br>
slide7. Early years<br>
slide8. Looked-after children
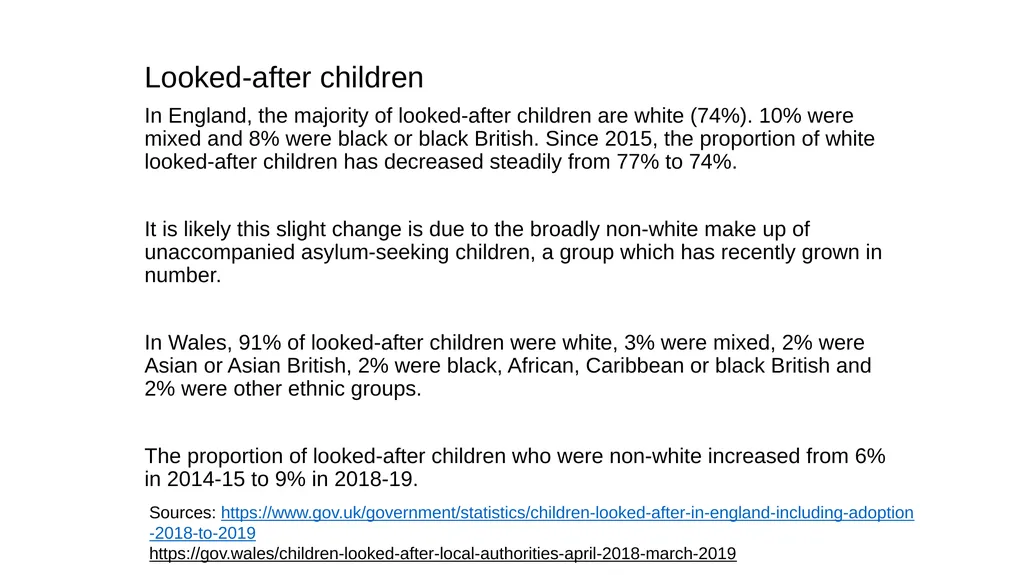
In England, the majority of looked-after children are white (74%). 10% were mixed and 8% were black or black British. Since 2015, the proportion of white looked-after children has decreased steadily from 77% to 74%.
It is likely this slight change is due to the broadly non-white make up of unaccompanied asylum-seeking children, a group which has recently grown in number.
In Wales, 91% of looked-after children were white, 3% were mixed, 2% were Asian or Asian British, 2% were black, African, Caribbean or black British and 2% were other ethnic groups.
The proportion of looked-after children who were non-white increased from 6% in 2014-15 to 9% in 2018-19. Sources: https://www.gov.uk/government/statistics/children-looked-after-in-england-including-adoption
-2018-to-2019
https://gov.wales/children-looked-after-local-authorities-april-2018-march-2019<br>
slide9. Children in need
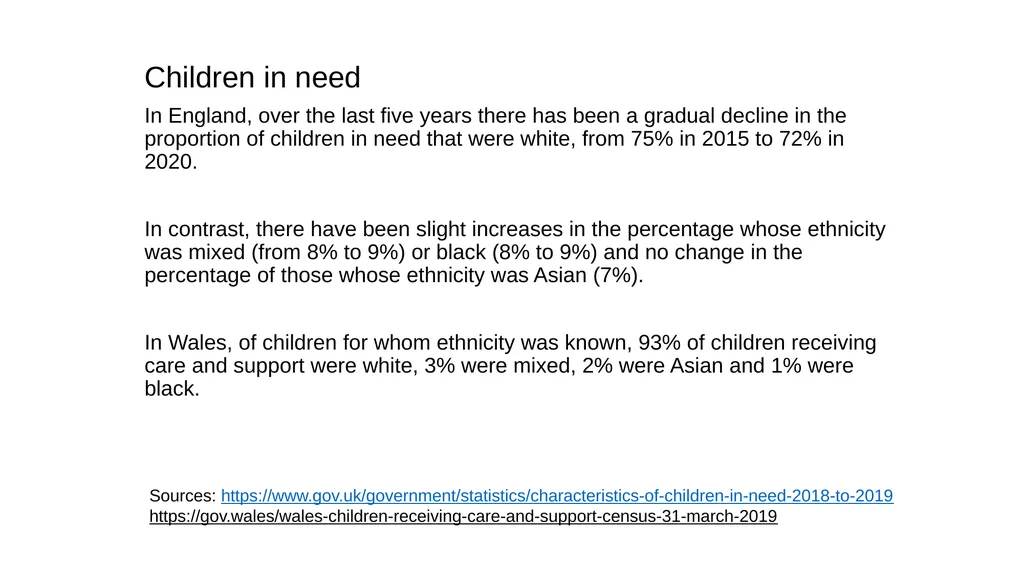
In England, over the last five years there has been a gradual decline in the proportion of children in need that were white, from 75% in 2015 to 72% in 2020.
In contrast, there have been slight increases in the percentage whose ethnicity was mixed (from 8% to 9%) or black (8% to 9%) and no change in the percentage of those whose ethnicity was Asian (7%).
In Wales, of children for whom ethnicity was known, 93% of children receiving care and support were white, 3% were mixed, 2% were Asian and 1% were black. Sources: https://www.gov.uk/government/statistics/characteristics-of-children-in-need-2018-to-2019
https://gov.wales/wales-children-receiving-care-and-support-census-31-march-2019<br>
slide10. Mental health
The nature of mental health inequality is complex, and affected by factors such as social and economic inequalities, racism and discrimination, stigma and the cultural appropriateness of treatments.
Data on children’s contact with mental health services in the UK is limited.
We cover this subject further in our notes at the end of this presentation.<br>
slide11. Mental health: prevalence
A 2017 survey of the mental health of children and young people (5 to 19 year olds) in England found Asian/Asian British (5.2%) and black/black British children (5.6%) were roughly three times less likely than white children (14.9%) to have a diagnosable mental disorder.
Children from black, Asian and minority ethnic communities are also less likely to engage with services which could intervene early to prevent any mental health issues worsening. Sources:
https://digital.nhs.uk/data-and-information/publications/statistical/mental-health-of-children-and-young-
people-in-england/2017/2017
http://www.better-health.org.uk/sites/default/files/briefings/downloads/Health%20Briefing%2033(2).pdf<br>
slide12. Mental health: rate of detentions
In the two years to March 2019, the rate of detentions of black children under the Mental Health Act was 1.7 times more than for white children.
In the year to March 2019, black people (not just children) were more than 4 times as likely as white people to be detained under the Mental Health Act. Source: https://digital.nhs.uk/data-and-information/data-collections-and-data-sets/data-sets/mental-
health-services-data-set<br>
slide13. Socio economic status
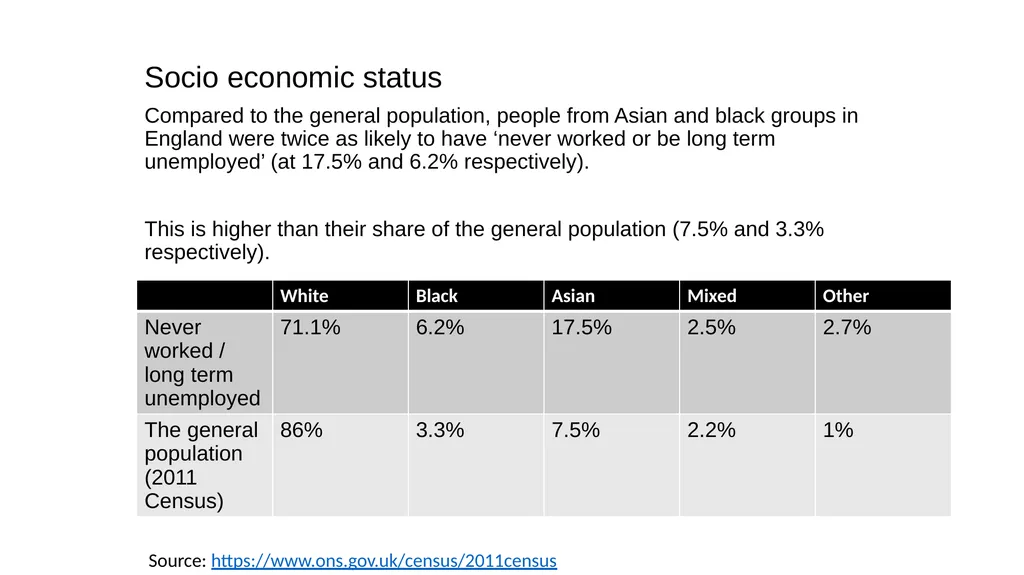
Compared to the general population, people from Asian and black groups in England were twice as likely to have ‘never worked or be long term unemployed’ (at 17.5% and 6.2% respectively).
This is higher than their share of the general population (7.5% and 3.3% respectively). Source: https://www.ons.gov.uk/census/2011census<br>
slide14. Socio economic status
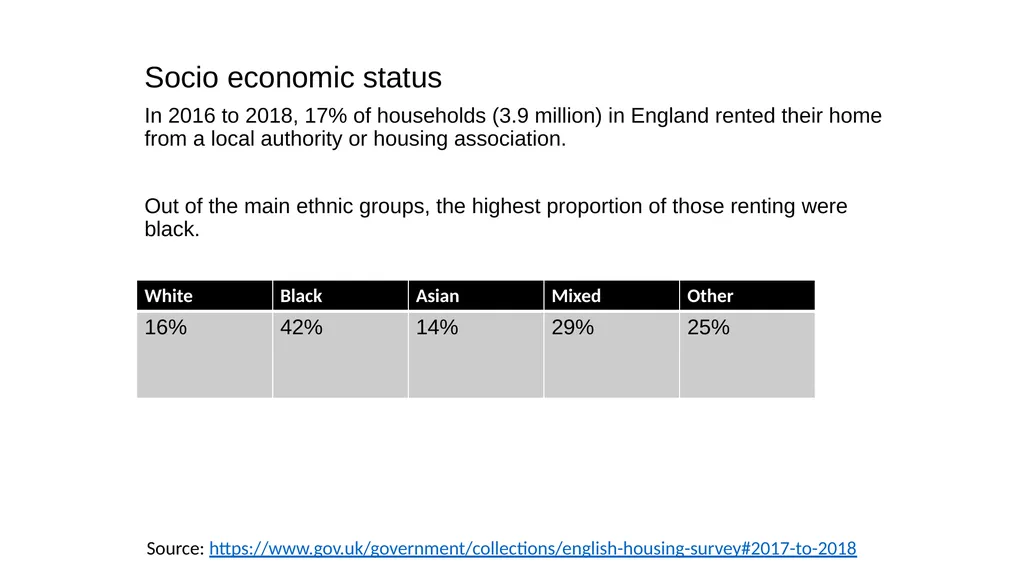
In 2016 to 2018, 17% of households (3.9 million) in England rented their home from a local authority or housing association.
Out of the main ethnic groups, the highest proportion of those renting were black. Source: https://www.gov.uk/government/collections/english-housing-survey#2017-to-2018<br>
slide15. Socio economic status
Households with persistent low income (less than 60% of the average UK income for 3 out of 4 years).
The highest proportion of children living in households with persistent low income were from Asian backgrounds. Source: https://www.gov.uk/government/collections/english-housing-survey#2017-to-2018<br>
slide16. Education<br>
slide17. Special educational needs
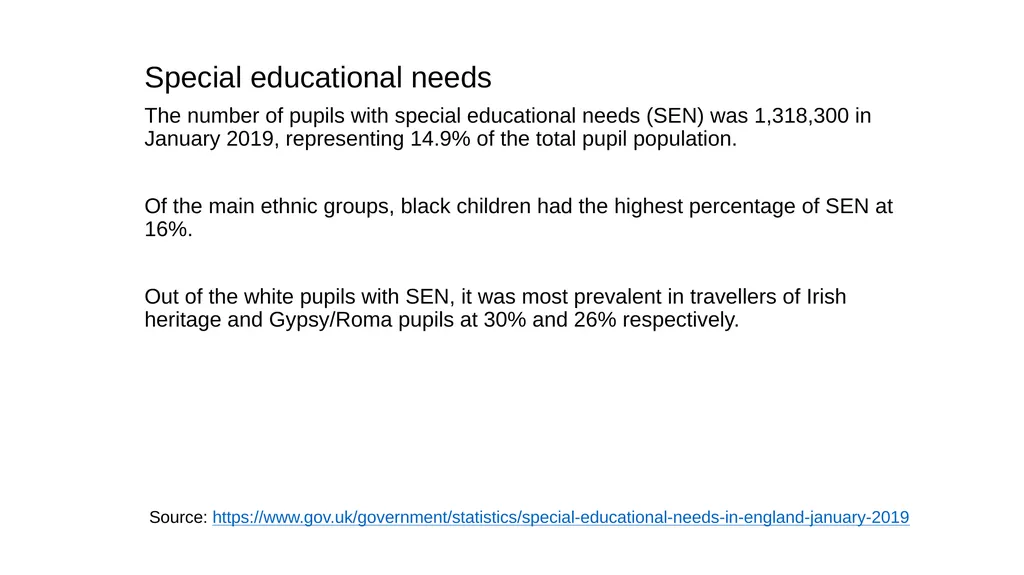
The number of pupils with special educational needs (SEN) was 1,318,300 in January 2019, representing 14.9% of the total pupil population.
Of the main ethnic groups, black children had the highest percentage of SEN at 16%.
Out of the white pupils with SEN, it was most prevalent in travellers of Irish heritage and Gypsy/Roma pupils at 30% and 26% respectively. Source: https://www.gov.uk/government/statistics/special-educational-needs-in-england-january-2019<br>
slide18. Key stages 2 and 4
The number of pupils with special educational needs (SEN) was 1,318,300 in January 2019, representing 14.9% of the total pupil population.
Key stage 2 attainment in England, percentage of children reaching the expected standard
Key stage 4 attainment in England, percentage of children reaching the expected standard Sources:
https://www.gov.uk/government/statistics/key-stage-2-and-multi-academy-trust-performance-2018-revised
https://www.gov.uk/government/statistics/key-stage-4-and-multi-academy-trust-performance-2018-revised<br>
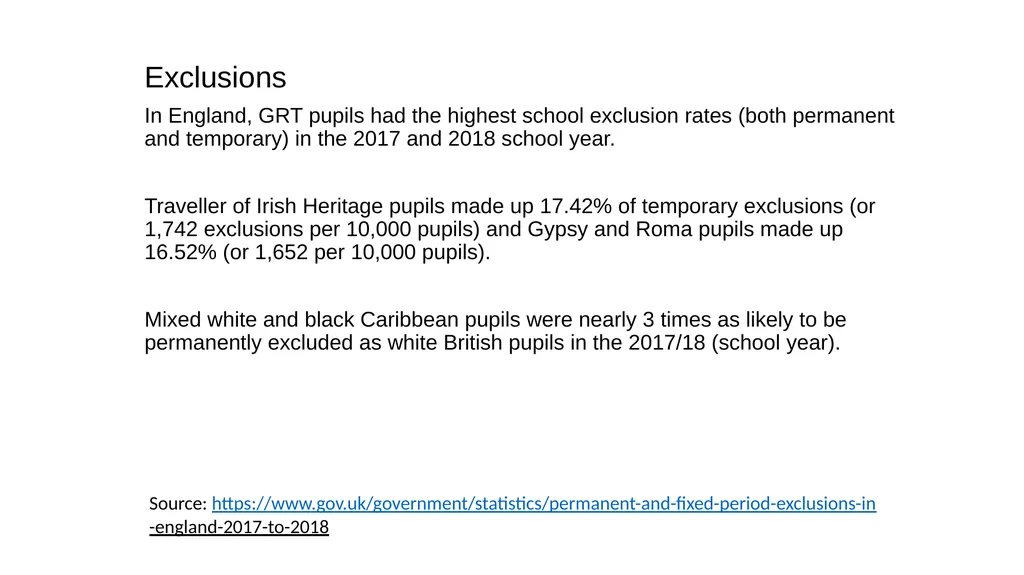
slide19. Exclusions
In England, GRT pupils had the highest school exclusion rates (both permanent and temporary) in the 2017 and 2018 school year.
Traveller of Irish Heritage pupils made up 17.42% of temporary exclusions (or 1,742 exclusions per 10,000 pupils) and Gypsy and Roma pupils made up 16.52% (or 1,652 per 10,000 pupils).
Mixed white and black Caribbean pupils were nearly 3 times as likely to be permanently excluded as white British pupils in the 2017/18 (school year). Source: https://www.gov.uk/government/statistics/permanent-and-fixed-period-exclusions-in
-england-2017-to-2018<br>
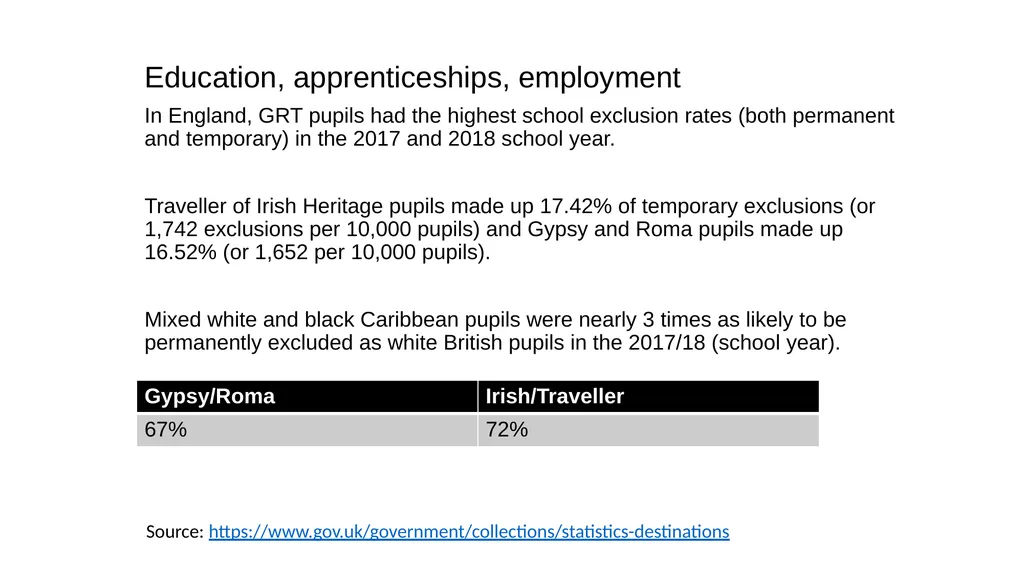
slide20. Education, apprenticeships, employment
In England, GRT pupils had the highest school exclusion rates (both permanent and temporary) in the 2017 and 2018 school year.
Traveller of Irish Heritage pupils made up 17.42% of temporary exclusions (or 1,742 exclusions per 10,000 pupils) and Gypsy and Roma pupils made up 16.52% (or 1,652 per 10,000 pupils).
Mixed white and black Caribbean pupils were nearly 3 times as likely to be permanently excluded as white British pupils in the 2017/18 (school year). Source: https://www.gov.uk/government/collections/statistics-destinations<br>
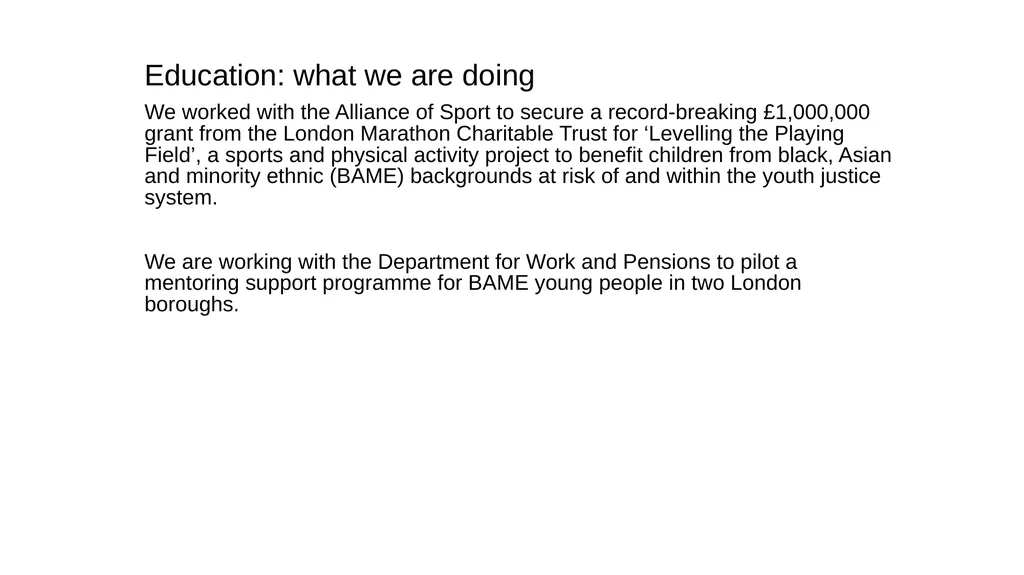
slide21. Education: what we are doing
We worked with the Alliance of Sport to secure a record-breaking £1,000,000 grant from the London Marathon Charitable Trust for ‘Levelling the Playing Field’, a sports and physical activity project to benefit children from black, Asian and minority ethnic (BAME) backgrounds at risk of and within the youth justice system.
We are working with the Department for Work and Pensions to pilot a mentoring support programme for BAME young people in two London boroughs.<br>
slide22. Education: what we are doing
We are organising an employability event involving government departments, businesses, the voluntary sector and children to consider how we work together to improve options for employment and training for over-represented children in the youth justice system.
We are also developing a Positive Action Apprenticeship Programme for BAME children to widen employment opportunities.<br>
slide23. Pre-court<br>
slide24. Confidence in the police
In the year ending March 2019, 75% of people aged 16 and over in England and Wales said they had confidence in their local police.
Among 16-17 year olds, a lower percentage of children with black (61%) and mixed backgrounds (68%) had confidence in their local police than white children (77%).<br>
slide25. Victims of crime
16 to 24 year olds from mixed (27%), black (23%) and white (22%) ethnic groups were more likely to be a victim of crime than people in the same age group from Asian (15%) and other (12%) ethnic groups.<br>
slide26. Arrests
Black children are over four times more likely to be arrested than white children. Relative rate index (RRI) Source: https://www.gov.uk/government/statistics/criminal-justice-system-statistics-quarterly-september-2019 RRI of arrests per 10,000 children in local 10-17 population, year ending March 2019<br>
slide27. Cautions
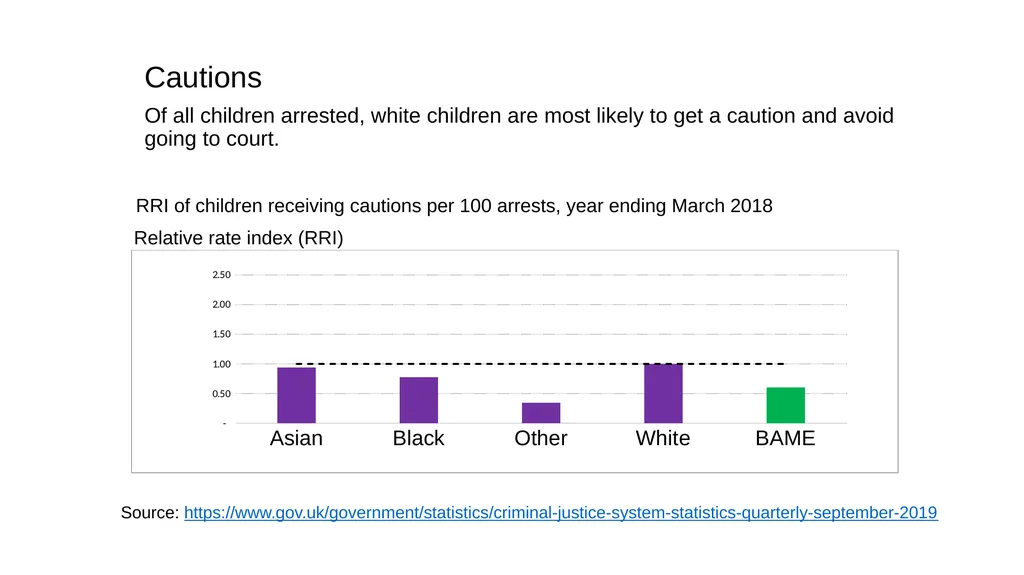
Of all children arrested, white children are most likely to get a caution and avoid going to court. Relative rate index (RRI) RRI of children receiving cautions per 100 arrests, year ending March 2018 Source: https://www.gov.uk/government/statistics/criminal-justice-system-statistics-quarterly-september-2019<br>
slide28. First time entrants to the youth justice system
From the year 2014 to 2019, the fall in first time entrants has been larger for white children (57% decrease) than for black, Asian and minority ethnic children. Source: https://www.gov.uk/government/statistics/criminal-justice-system-statistics-quarterly-september-2019<br>
slide29. Pre court: what we are doing
We have raised issues relating to disproportionality with the National Police Chiefs’ Council (NPCC). We assisted in identifying options to review force procedures, monitoring and scrutiny.
We influenced the guidance issued to stop and search scrutiny panels and visited them to identify good practice in addressing disproportionality.
We have influenced the Association of Police and Crime Commissioners guidance on Police and Crime Plans to ensure that disproportionality is considered within these plans.<br>
slide30. Pre court: what we are doing
We have engaged with the NPCC to assist with out-of-court disposals and disproportionality.
We have influenced the guidance on out-of-court disposal scrutiny panels and the requirement to thematically analyse these on the basis of ethnicity.<br>
slide31. Pre court: data sharing
We have agreed to provide the Association of Police and Crime Commissioners with annual summary data to share with Police and Crime Commissioners (PCCs) nationally.
This will enable PCCs to understand ethnic disproportionality data within their remit and consider this information when developing their Police and Crime Plans.
We assisted in the development of the ‘Chance to Change’ deferred prosecution pilot, based on the Lammy review recommendation.
This aims to divert children from the youth justice system without the requirement to admit responsibility.
This was identified as a significant factor in preventing BAME children from receiving out-of-court disposal options.<br>
slide32. Offences<br>
slide33. Knife possession
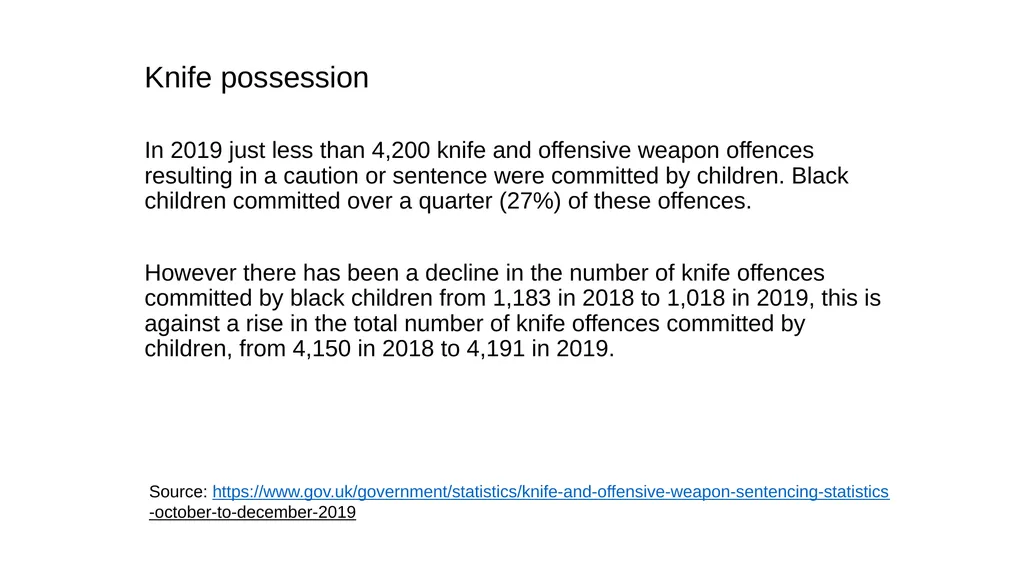
In 2019 just less than 4,200 knife and offensive weapon offences resulting in a caution or sentence were committed by children. Black children committed over a quarter (27%) of these offences.
However there has been a decline in the number of knife offences committed by black children from 1,183 in 2018 to 1,018 in 2019, this is against a rise in the total number of knife offences committed by children, from 4,150 in 2018 to 4,191 in 2019. Source: https://www.gov.uk/government/statistics/knife-and-offensive-weapon-sentencing-statistics
-october-to-december-2019<br>
slide34. Offences
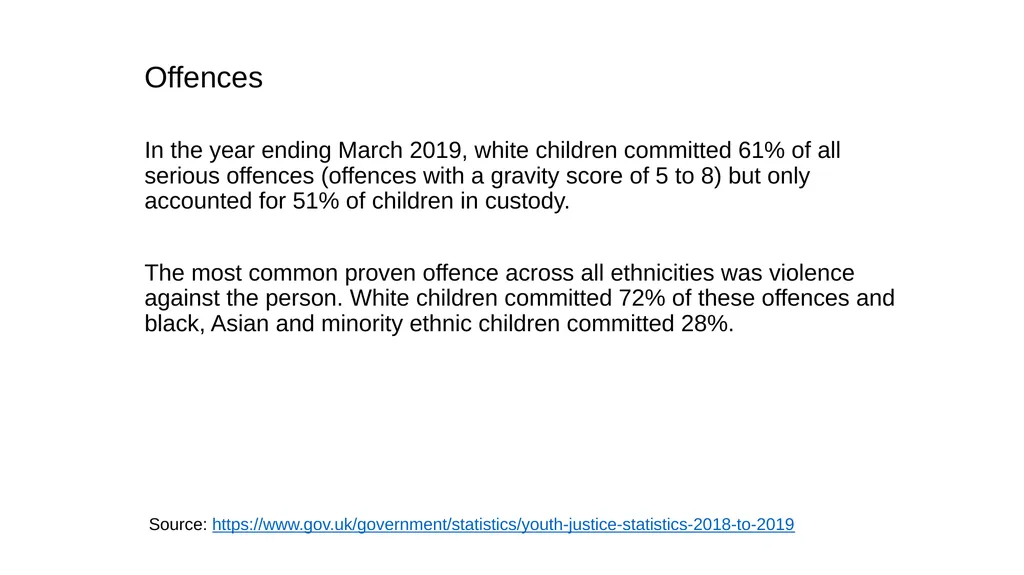
In the year ending March 2019, white children committed 61% of all serious offences (offences with a gravity score of 5 to 8) but only accounted for 51% of children in custody.
The most common proven offence across all ethnicities was violence against the person. White children committed 72% of these offences and black, Asian and minority ethnic children committed 28%. Source: https://www.gov.uk/government/statistics/youth-justice-statistics-2018-to-2019<br>
slide35. Court<br>
slide36. Sentenced to custody
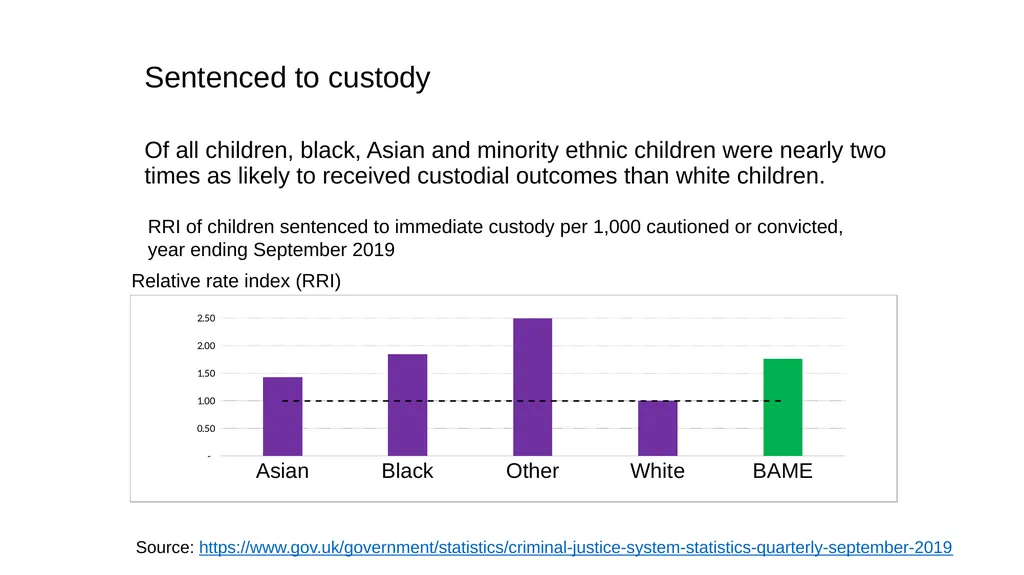
Of all children, black, Asian and minority ethnic children were nearly two times as likely to received custodial outcomes than white children. Source: https://www.gov.uk/government/statistics/criminal-justice-system-statistics-quarterly-september-2019 Relative rate index (RRI) RRI of children sentenced to immediate custody per 1,000 cautioned or convicted,
year ending September 2019<br>
slide37. Assessing the needs of sentenced children
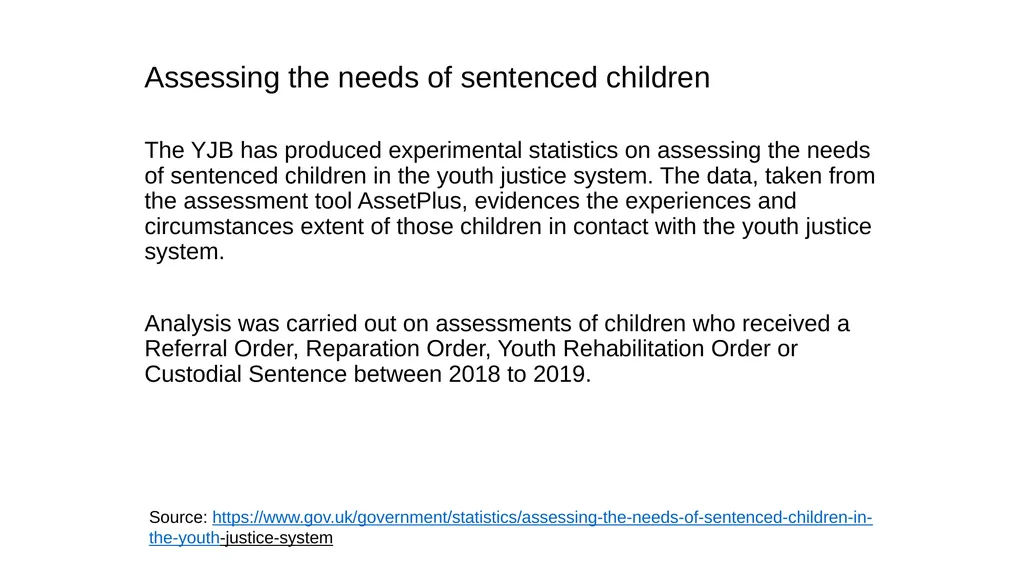
The YJB has produced experimental statistics on assessing the needs of sentenced children in the youth justice system. The data, taken from the assessment tool AssetPlus, evidences the experiences and circumstances extent of those children in contact with the youth justice system.
Analysis was carried out on assessments of children who received a Referral Order, Reparation Order, Youth Rehabilitation Order or Custodial Sentence between 2018 to 2019. Source: https://www.gov.uk/government/statistics/assessing-the-needs-of-sentenced-children-in-
the-youth-justice-system<br>
slide38. Assessing the needs of sentenced children
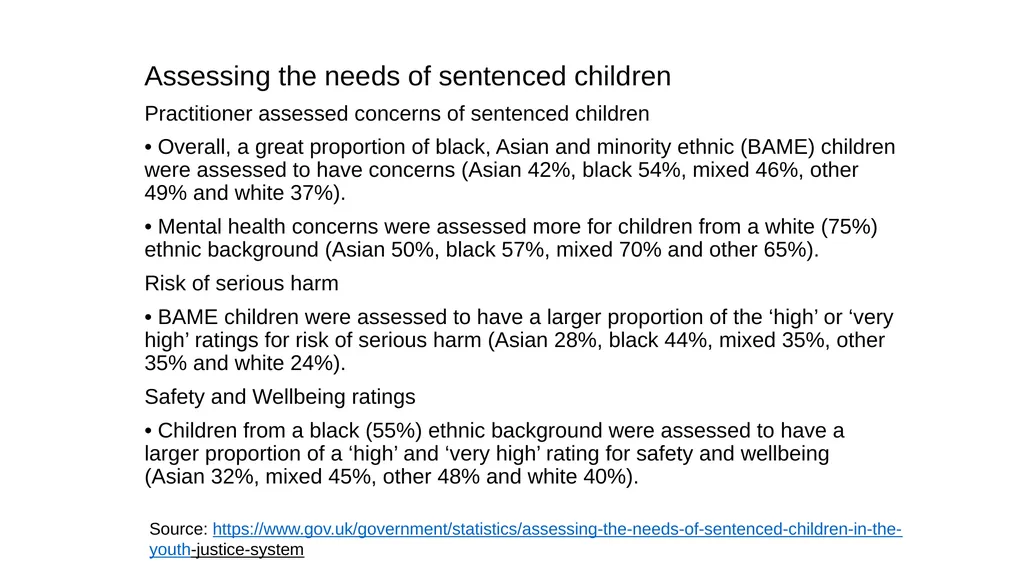
Practitioner assessed concerns of sentenced children
• Overall, a great proportion of black, Asian and minority ethnic (BAME) children were assessed to have concerns (Asian 42%, black 54%, mixed 46%, other 49% and white 37%).
• Mental health concerns were assessed more for children from a white (75%) ethnic background (Asian 50%, black 57%, mixed 70% and other 65%).
Risk of serious harm
• BAME children were assessed to have a larger proportion of the ‘high’ or ‘very high’ ratings for risk of serious harm (Asian 28%, black 44%, mixed 35%, other 35% and white 24%).
Safety and Wellbeing ratings
• Children from a black (55%) ethnic background were assessed to have a larger proportion of a ‘high’ and ‘very high’ rating for safety and wellbeing (Asian 32%, mixed 45%, other 48% and white 40%). Source: https://www.gov.uk/government/statistics/assessing-the-needs-of-sentenced-children-in-the-
youth-justice-system<br>
slide39. Court: what we are doing
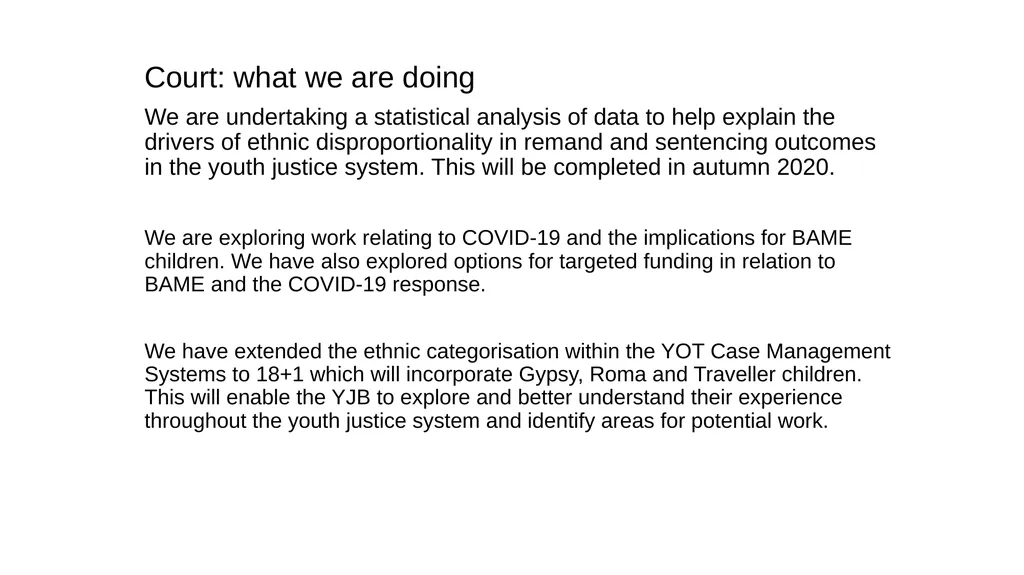
We are undertaking a statistical analysis of data to help explain the drivers of ethnic disproportionality in remand and sentencing outcomes in the youth justice system. This will be completed in autumn 2020.
We are exploring work relating to COVID-19 and the implications for BAME children. We have also explored options for targeted funding in relation to BAME and the COVID-19 response.
We have extended the ethnic categorisation within the YOT Case Management Systems to 18+1 which will incorporate Gypsy, Roma and Traveller children. This will enable the YJB to explore and better understand their experience throughout the youth justice system and identify areas for potential work.<br>
slide40. Custody<br>
slide41. Custodial population
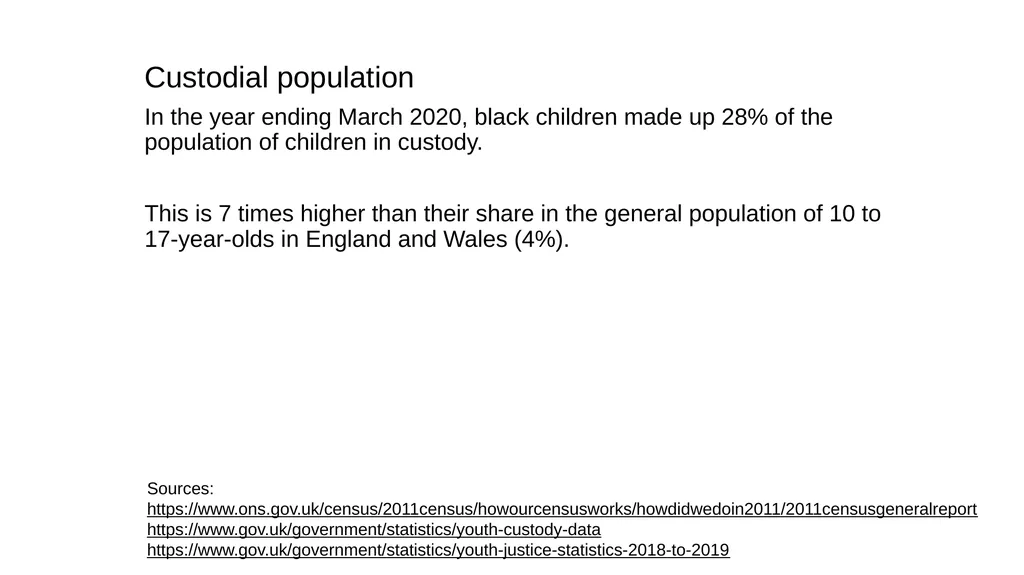
In the year ending March 2020, black children made up 28% of the population of children in custody.
This is 7 times higher than their share in the general population of 10 to 17-year-olds in England and Wales (4%). Sources:
https://www.ons.gov.uk/census/2011census/howourcensusworks/howdidwedoin2011/2011censusgeneralreport
https://www.gov.uk/government/statistics/youth-custody-data
https://www.gov.uk/government/statistics/youth-justice-statistics-2018-to-2019<br>
slide42. Custodial population
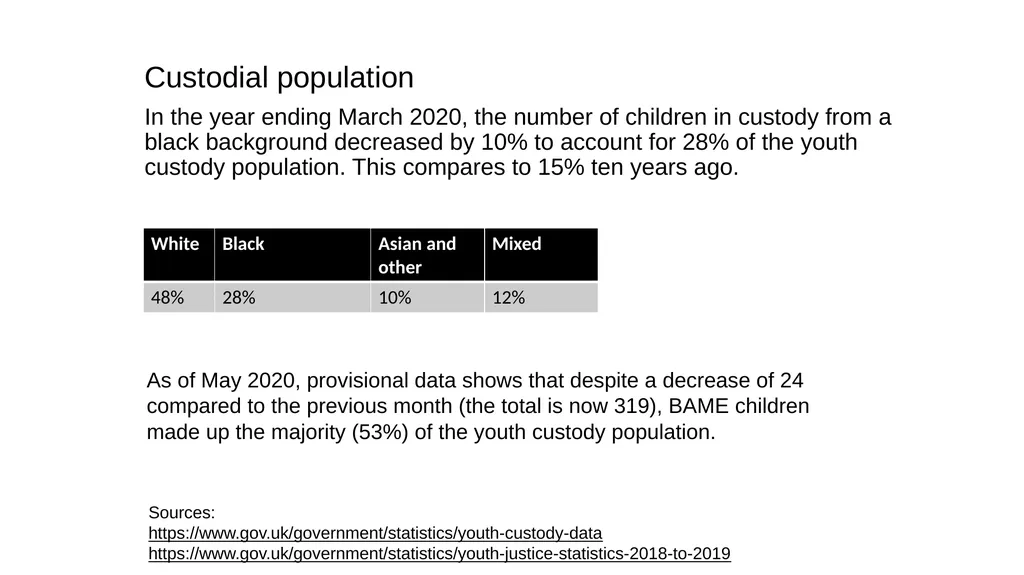
In the year ending March 2020, the number of children in custody from a black background decreased by 10% to account for 28% of the youth custody population. This compares to 15% ten years ago. Sources:
https://www.gov.uk/government/statistics/youth-custody-data
https://www.gov.uk/government/statistics/youth-justice-statistics-2018-to-2019 As of May 2020, provisional data shows that despite a decrease of 24
compared to the previous month (the total is now 319), BAME children
made up the majority (53%) of the youth custody population.<br>
slide43. Use of remand
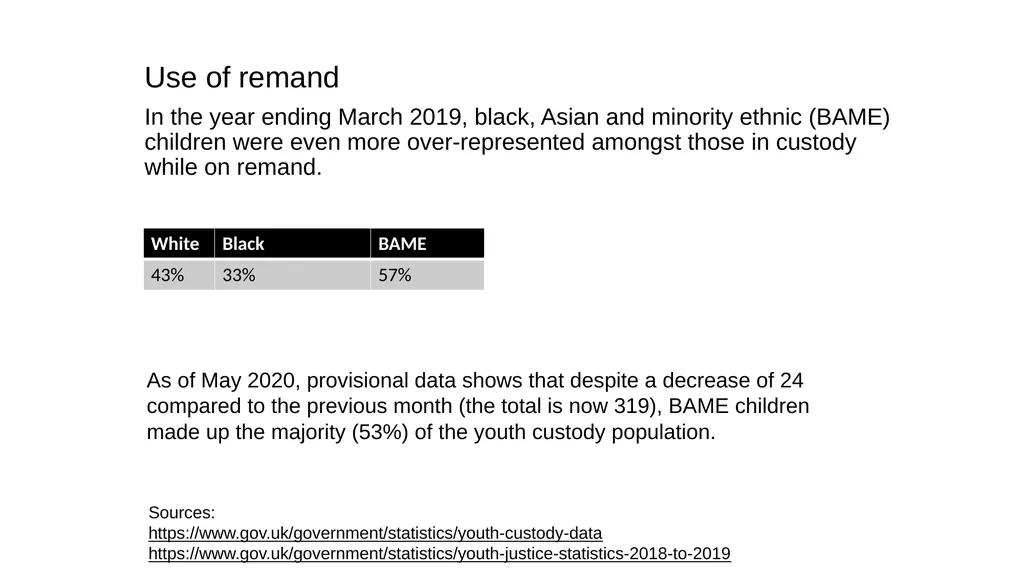
In the year ending March 2019, black, Asian and minority ethnic (BAME) children were even more over-represented amongst those in custody while on remand. Sources:
https://www.gov.uk/government/statistics/youth-custody-data
https://www.gov.uk/government/statistics/youth-justice-statistics-2018-to-2019 As of May 2020, provisional data shows that despite a decrease of 24
compared to the previous month (the total is now 319), BAME children
made up the majority (53%) of the youth custody population.<br>
slide44. Behaviour management
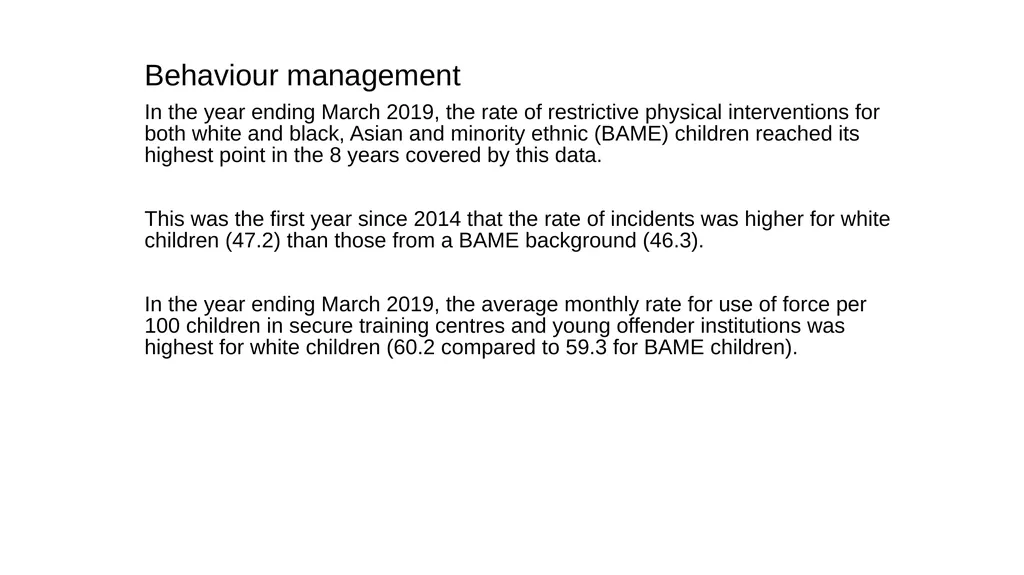
In the year ending March 2019, the rate of restrictive physical interventions for both white and black, Asian and minority ethnic (BAME) children reached its highest point in the 8 years covered by this data.
This was the first year since 2014 that the rate of incidents was higher for white children (47.2) than those from a BAME background (46.3).
In the year ending March 2019, the average monthly rate for use of force per 100 children in secure training centres and young offender institutions was highest for white children (60.2 compared to 59.3 for BAME children).<br>
slide45. Behaviour management
In the year ending March 2019, the rates of assault committed by black, Asian and minority ethnic (BAME) children were higher for children in secure children’s homes and secure training centres than for white children.
The average monthly rate for assault for BAME children in young offender institutions was higher than for white children.
In the year ending March 2019, the rate of self-harm by white children in custody was 2.75 times the rate of BAME children.
In the year ending March 2019, the average monthly rates for the use of single separation in secure children’s homes and secure training centres were higher for white children (95.9 compared to 78.1 for those from a BAME background).<br>
slide46. What the Youth Custody Service is doing
The Youth Custody Service (YCS) is identifying and investigating disproportionality in youth custody.
Where disparities cannot be explained it is putting in place reforms. This includes improving data accessibility and analysis and driving improvements in service delivery though establishment level plans.
The YCS is undertaking a specific programme of work to improve services for girls in custody.<br>
slide47. What the Youth Custody Service is doing
Staff are being supported through the identification and production of effective practice products and policies that address priority areas relating to diversity and inclusion.
The Youth Custody Service will increase the internal supply of black, Asian and minority ethnic employees at all levels who have the skill-set and desire to be senior leaders.<br>
slide48. Reoffending<br>
slide49. Number of offences
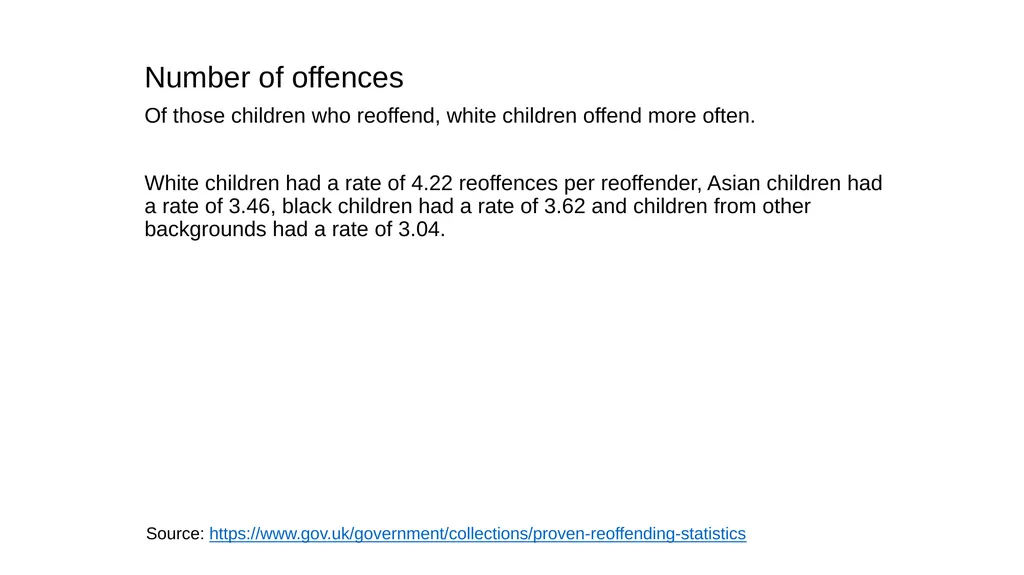
Of those children who reoffend, white children offend more often.
White children had a rate of 4.22 reoffences per reoffender, Asian children had a rate of 3.46, black children had a rate of 3.62 and children from other backgrounds had a rate of 3.04. Source: https://www.gov.uk/government/collections/proven-reoffending-statistics<br>
slide50. Likelihood of reoffending
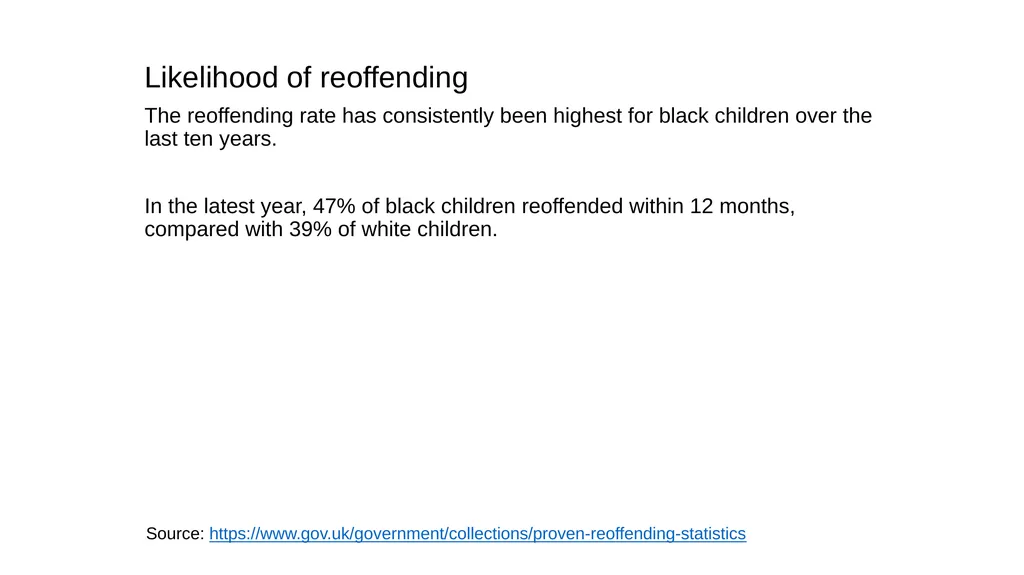
The reoffending rate has consistently been highest for black children over the last ten years.
In the latest year, 47% of black children reoffended within 12 months, compared with 39% of white children. Source: https://www.gov.uk/government/collections/proven-reoffending-statistics<br>
slide51. Reoffending: what we are doing
We have developed a Reoffending Disproportionality Tool. This tool uses data from the Police National Computer (PNC) to help highlight the over-representation of ethnic groups according to reoffending data.
The Tool is available to YOTs via the Youth justice Application Framework (YJAF).<br>
slide52. Toolkits<br>
slide53. Toolkits
We have developed the following toolkits:
Summary Ethnic Disproportionality Tool
Local Ethnic Disproportionality Tool
Reoffending Disproportionality Tool
These are available to YOTs via the Youth Justice Application Framework (YJAF). We have also reviewed and redesigned the Local Ethnic Disproportionality Tool following the recommendation made as part of the Lammy Review. This is now available to all youth offending teams nationally and is updated on an annual basis
We continue to update the Summary Ethnic Disproportionality Tool on an annual basis. This tool now includes Police and Crime Commissioner level disproportionality data.<br>
slide54. Notes on the data<br>
slide55. Notes on the data
We developed this presentation to highlight where disproportionality occurs and to help bring about change.
Wherever possible we used the most up to date data available. All of the data shown includes Wales unless we specifically say that it is for England only.Wherever possible we used the data for Gypsy, Roma and Traveller (GRT) children in this presentation.
We have also extended the ethnic categorisation within the case management system for youth offending teams to include GRT children. This will enable us to explore and better understand the experiences of these children throughout the youth justice system and identify areas for potential work.
We have chosen to omit ‘stop and search’ data from this presentation because it was not possible to break down by age.<br>
slide56. Notes on recording ethnicity
In this publication we include two measures to record ethnicity: officer identified ethnicity and self-identified ethnicity. This appendix details the categorical breakdowns of both types of ethnicity.
Officer identified ethnicity is ethnicity as recorded by a police officer or a member of the administrative or clerical team, based on visual appearance. The data is initially inputted into six detailed categories, which are then re-categorised in the Court Proceedings database into the following four categories: black, white, Asian, other. This is known as 4+1 and most sections in this report use this classification when referring to officer identified ethnicity.
Self-identified ethnicity is ethnicity as defined by an individual. Categories are based on the classifications as defined by the 2001 and 2011 Census. The ONS introduced two further categories to the Census in 2011: ‘White –Gypsy or Irish Traveller’ and ‘Arab’; and moved ‘Chinese’ to the broader Asian category. To allow for comparability with previous editions of Race and the Criminal Justice System, Chinese are placed in the ‘Chinese or Other’, or ‘Other’ category, following the 2001 Census. Source: https://assets.publishing.service.gov.uk/government/uploads/system/uploads/attachment_
data/file/849200/statistics-on-race-and-the-cjs-2018.pdf<br>
slide57. What is RRI
We use the relative rate index (RRI) in this presentation to compare the relative difference in rates between two fixed populations. This was a recommendation from the 2017 Lammy Review.
We used the RRI, rates for each ethnic group relative to the white ethnic group. These were compared to determine whether outcomes differed significantly.
An RRI value of ‘one’ indicates no disparity, whereas an RRI greater than one means the group of interest had a greater likelihood of experiencing the particular outcome. An RRI less than one indicates the group of interest was less likely than the white ethnic group to experience that outcome. https://www.gov.uk/government/publications/covid-19-review-of-disparities-in-risks-and-outcomes<br>
slide58. What is RRI
Please note that there has been a change to the methodology used to determine the level of disproportionality for knife possession offences. In the previous version of the presentation (July 2019) the relative rate index (RRI) for knife possession was determined by comparing the number of possession offences by ethnicity with the general population by ethnicity, in this version of the knife possession offences are compared with the number of arrests by ethnicity data to calculate a RRI.
We made this change to stay in line with guidance on using RRI that recommends that comparisons should be made against the previous stage in the criminal justice system, in this case the arrest stage, rather than with the general population.<br>
slide59. Notes on the mental health data
For adults, black, Asian and minority ethnic (BAME) groups are less likely to obtain treatment for mental health needs than white British people. Diverse barriers to timely access have been identified. Differences in the prevalence of mental disorders between ethnic groups vary by type of disorder.
However, BAME groups and black adults in particular, are over-represented at the more critical end of the system, in referrals from the criminal justice system, in restrictive interventions and detentions under the Mental Health Act. BAME groups also receive poorer treatment outcomes.<br>
slide60. Find out more
It is our strategic objective to influence the youth justice system to treat children fairly and reduce ethnic disproportionality. You can find out more about how we intend to do this in our business plan.
Email YJBProgrammeSupportOffice@yjb.gov.uk with general queries about this presentation.
https://www.gov.uk/government/publications/yjb-business-plan-2020-to-2021<br>
August 2020<br>
slide2. Message from Keith Fraser, YJB Chairman:
“If we truly want to bring about change and live in a fair society with equal access to opportunities we must ensure that over-representation remains at the forefront of our thinking.
“If you work in the youth justice system, please ask yourself, are children from black, Asian and minority ethnic backgrounds over-represented in your area?
“If so, can you explain why that is, and if you can’t what are you going to do about it?”<br>
slide3. Introduction
We have produced this presentation to highlight the areas where over-representation occurs, and show how, from a very early age and within the youth justice system, there are systemic and institutional prejudices that result in some children not receiving equal treatment.
It’s unacceptable that a child is more likely to be criminalised because of their background. That is why, in our business plan, we have outlined the work we intend to deliver to tackle ethnic disproportionality within the youth justice system.
We have also included a summary of current plans for the YJB and Youth Custody Service that will make a difference.<br>
slide4. Children in England and Wales
Data from the 2011 Census provides a breakdown of the number of children in England and Wales by ethnicity.
White, 81%
Asian, 9%
Black, 4%
Mixed, 4%
Other, 1% Source: https://www.ons.gov.uk/census/2011census/howourcensusworks/howdidwedoin2011/2011
censusgeneralreport<br>
slide5. The youth justice workforce
As part of the YJB’s Workforce Development Strategy we monitor the ethnic diversity of the youth offending team (YOT) workforce.
This is because we think it is important that the workforce reflects the community that it represents. The YJB has set up an apprenticeship programme (due to start in 2021) to recruit black, Asian and minority ethnic (BAME), ex-service users and other under-represented groups.
In 2018-2019, there were 1,023 people from a BAME background working in YOTs (excluding volunteers), compared to 5,551 overall where ethnicity was known (overall there were 6,153 staff). This amounts to 18% of the total YOT workforce where ethnicity is known.<br>
slide6. The youth justice workforce
Composition of the youth offending team (YOT) workforce in 2018-19 Source: https://assets.publishing.service.gov.uk/government/uploads/system/uploads/attachment_data/file/861776/youth-justice-statistics-additional-annexes-march-2019.zip<br>
slide7. Early years<br>
slide8. Looked-after children
In England, the majority of looked-after children are white (74%). 10% were mixed and 8% were black or black British. Since 2015, the proportion of white looked-after children has decreased steadily from 77% to 74%.
It is likely this slight change is due to the broadly non-white make up of unaccompanied asylum-seeking children, a group which has recently grown in number.
In Wales, 91% of looked-after children were white, 3% were mixed, 2% were Asian or Asian British, 2% were black, African, Caribbean or black British and 2% were other ethnic groups.
The proportion of looked-after children who were non-white increased from 6% in 2014-15 to 9% in 2018-19. Sources: https://www.gov.uk/government/statistics/children-looked-after-in-england-including-adoption
-2018-to-2019
https://gov.wales/children-looked-after-local-authorities-april-2018-march-2019<br>
slide9. Children in need
In England, over the last five years there has been a gradual decline in the proportion of children in need that were white, from 75% in 2015 to 72% in 2020.
In contrast, there have been slight increases in the percentage whose ethnicity was mixed (from 8% to 9%) or black (8% to 9%) and no change in the percentage of those whose ethnicity was Asian (7%).
In Wales, of children for whom ethnicity was known, 93% of children receiving care and support were white, 3% were mixed, 2% were Asian and 1% were black. Sources: https://www.gov.uk/government/statistics/characteristics-of-children-in-need-2018-to-2019
https://gov.wales/wales-children-receiving-care-and-support-census-31-march-2019<br>
slide10. Mental health
The nature of mental health inequality is complex, and affected by factors such as social and economic inequalities, racism and discrimination, stigma and the cultural appropriateness of treatments.
Data on children’s contact with mental health services in the UK is limited.
We cover this subject further in our notes at the end of this presentation.<br>
slide11. Mental health: prevalence
A 2017 survey of the mental health of children and young people (5 to 19 year olds) in England found Asian/Asian British (5.2%) and black/black British children (5.6%) were roughly three times less likely than white children (14.9%) to have a diagnosable mental disorder.
Children from black, Asian and minority ethnic communities are also less likely to engage with services which could intervene early to prevent any mental health issues worsening. Sources:
https://digital.nhs.uk/data-and-information/publications/statistical/mental-health-of-children-and-young-
people-in-england/2017/2017
http://www.better-health.org.uk/sites/default/files/briefings/downloads/Health%20Briefing%2033(2).pdf<br>
slide12. Mental health: rate of detentions
In the two years to March 2019, the rate of detentions of black children under the Mental Health Act was 1.7 times more than for white children.
In the year to March 2019, black people (not just children) were more than 4 times as likely as white people to be detained under the Mental Health Act. Source: https://digital.nhs.uk/data-and-information/data-collections-and-data-sets/data-sets/mental-
health-services-data-set<br>
slide13. Socio economic status
Compared to the general population, people from Asian and black groups in England were twice as likely to have ‘never worked or be long term unemployed’ (at 17.5% and 6.2% respectively).
This is higher than their share of the general population (7.5% and 3.3% respectively). Source: https://www.ons.gov.uk/census/2011census<br>
slide14. Socio economic status
In 2016 to 2018, 17% of households (3.9 million) in England rented their home from a local authority or housing association.
Out of the main ethnic groups, the highest proportion of those renting were black. Source: https://www.gov.uk/government/collections/english-housing-survey#2017-to-2018<br>
slide15. Socio economic status
Households with persistent low income (less than 60% of the average UK income for 3 out of 4 years).
The highest proportion of children living in households with persistent low income were from Asian backgrounds. Source: https://www.gov.uk/government/collections/english-housing-survey#2017-to-2018<br>
slide16. Education<br>
slide17. Special educational needs
The number of pupils with special educational needs (SEN) was 1,318,300 in January 2019, representing 14.9% of the total pupil population.
Of the main ethnic groups, black children had the highest percentage of SEN at 16%.
Out of the white pupils with SEN, it was most prevalent in travellers of Irish heritage and Gypsy/Roma pupils at 30% and 26% respectively. Source: https://www.gov.uk/government/statistics/special-educational-needs-in-england-january-2019<br>
slide18. Key stages 2 and 4
The number of pupils with special educational needs (SEN) was 1,318,300 in January 2019, representing 14.9% of the total pupil population.
Key stage 2 attainment in England, percentage of children reaching the expected standard
Key stage 4 attainment in England, percentage of children reaching the expected standard Sources:
https://www.gov.uk/government/statistics/key-stage-2-and-multi-academy-trust-performance-2018-revised
https://www.gov.uk/government/statistics/key-stage-4-and-multi-academy-trust-performance-2018-revised<br>
slide19. Exclusions
In England, GRT pupils had the highest school exclusion rates (both permanent and temporary) in the 2017 and 2018 school year.
Traveller of Irish Heritage pupils made up 17.42% of temporary exclusions (or 1,742 exclusions per 10,000 pupils) and Gypsy and Roma pupils made up 16.52% (or 1,652 per 10,000 pupils).
Mixed white and black Caribbean pupils were nearly 3 times as likely to be permanently excluded as white British pupils in the 2017/18 (school year). Source: https://www.gov.uk/government/statistics/permanent-and-fixed-period-exclusions-in
-england-2017-to-2018<br>
slide20. Education, apprenticeships, employment
In England, GRT pupils had the highest school exclusion rates (both permanent and temporary) in the 2017 and 2018 school year.
Traveller of Irish Heritage pupils made up 17.42% of temporary exclusions (or 1,742 exclusions per 10,000 pupils) and Gypsy and Roma pupils made up 16.52% (or 1,652 per 10,000 pupils).
Mixed white and black Caribbean pupils were nearly 3 times as likely to be permanently excluded as white British pupils in the 2017/18 (school year). Source: https://www.gov.uk/government/collections/statistics-destinations<br>
slide21. Education: what we are doing
We worked with the Alliance of Sport to secure a record-breaking £1,000,000 grant from the London Marathon Charitable Trust for ‘Levelling the Playing Field’, a sports and physical activity project to benefit children from black, Asian and minority ethnic (BAME) backgrounds at risk of and within the youth justice system.
We are working with the Department for Work and Pensions to pilot a mentoring support programme for BAME young people in two London boroughs.<br>
slide22. Education: what we are doing
We are organising an employability event involving government departments, businesses, the voluntary sector and children to consider how we work together to improve options for employment and training for over-represented children in the youth justice system.
We are also developing a Positive Action Apprenticeship Programme for BAME children to widen employment opportunities.<br>
slide23. Pre-court<br>
slide24. Confidence in the police
In the year ending March 2019, 75% of people aged 16 and over in England and Wales said they had confidence in their local police.
Among 16-17 year olds, a lower percentage of children with black (61%) and mixed backgrounds (68%) had confidence in their local police than white children (77%).<br>
slide25. Victims of crime
16 to 24 year olds from mixed (27%), black (23%) and white (22%) ethnic groups were more likely to be a victim of crime than people in the same age group from Asian (15%) and other (12%) ethnic groups.<br>
slide26. Arrests
Black children are over four times more likely to be arrested than white children. Relative rate index (RRI) Source: https://www.gov.uk/government/statistics/criminal-justice-system-statistics-quarterly-september-2019 RRI of arrests per 10,000 children in local 10-17 population, year ending March 2019<br>
slide27. Cautions
Of all children arrested, white children are most likely to get a caution and avoid going to court. Relative rate index (RRI) RRI of children receiving cautions per 100 arrests, year ending March 2018 Source: https://www.gov.uk/government/statistics/criminal-justice-system-statistics-quarterly-september-2019<br>
slide28. First time entrants to the youth justice system
From the year 2014 to 2019, the fall in first time entrants has been larger for white children (57% decrease) than for black, Asian and minority ethnic children. Source: https://www.gov.uk/government/statistics/criminal-justice-system-statistics-quarterly-september-2019<br>
slide29. Pre court: what we are doing
We have raised issues relating to disproportionality with the National Police Chiefs’ Council (NPCC). We assisted in identifying options to review force procedures, monitoring and scrutiny.
We influenced the guidance issued to stop and search scrutiny panels and visited them to identify good practice in addressing disproportionality.
We have influenced the Association of Police and Crime Commissioners guidance on Police and Crime Plans to ensure that disproportionality is considered within these plans.<br>
slide30. Pre court: what we are doing
We have engaged with the NPCC to assist with out-of-court disposals and disproportionality.
We have influenced the guidance on out-of-court disposal scrutiny panels and the requirement to thematically analyse these on the basis of ethnicity.<br>
slide31. Pre court: data sharing
We have agreed to provide the Association of Police and Crime Commissioners with annual summary data to share with Police and Crime Commissioners (PCCs) nationally.
This will enable PCCs to understand ethnic disproportionality data within their remit and consider this information when developing their Police and Crime Plans.
We assisted in the development of the ‘Chance to Change’ deferred prosecution pilot, based on the Lammy review recommendation.
This aims to divert children from the youth justice system without the requirement to admit responsibility.
This was identified as a significant factor in preventing BAME children from receiving out-of-court disposal options.<br>
slide32. Offences<br>
slide33. Knife possession
In 2019 just less than 4,200 knife and offensive weapon offences resulting in a caution or sentence were committed by children. Black children committed over a quarter (27%) of these offences.
However there has been a decline in the number of knife offences committed by black children from 1,183 in 2018 to 1,018 in 2019, this is against a rise in the total number of knife offences committed by children, from 4,150 in 2018 to 4,191 in 2019. Source: https://www.gov.uk/government/statistics/knife-and-offensive-weapon-sentencing-statistics
-october-to-december-2019<br>
slide34. Offences
In the year ending March 2019, white children committed 61% of all serious offences (offences with a gravity score of 5 to 8) but only accounted for 51% of children in custody.
The most common proven offence across all ethnicities was violence against the person. White children committed 72% of these offences and black, Asian and minority ethnic children committed 28%. Source: https://www.gov.uk/government/statistics/youth-justice-statistics-2018-to-2019<br>
slide35. Court<br>
slide36. Sentenced to custody
Of all children, black, Asian and minority ethnic children were nearly two times as likely to received custodial outcomes than white children. Source: https://www.gov.uk/government/statistics/criminal-justice-system-statistics-quarterly-september-2019 Relative rate index (RRI) RRI of children sentenced to immediate custody per 1,000 cautioned or convicted,
year ending September 2019<br>
slide37. Assessing the needs of sentenced children
The YJB has produced experimental statistics on assessing the needs of sentenced children in the youth justice system. The data, taken from the assessment tool AssetPlus, evidences the experiences and circumstances extent of those children in contact with the youth justice system.
Analysis was carried out on assessments of children who received a Referral Order, Reparation Order, Youth Rehabilitation Order or Custodial Sentence between 2018 to 2019. Source: https://www.gov.uk/government/statistics/assessing-the-needs-of-sentenced-children-in-
the-youth-justice-system<br>
slide38. Assessing the needs of sentenced children
Practitioner assessed concerns of sentenced children
• Overall, a great proportion of black, Asian and minority ethnic (BAME) children were assessed to have concerns (Asian 42%, black 54%, mixed 46%, other 49% and white 37%).
• Mental health concerns were assessed more for children from a white (75%) ethnic background (Asian 50%, black 57%, mixed 70% and other 65%).
Risk of serious harm
• BAME children were assessed to have a larger proportion of the ‘high’ or ‘very high’ ratings for risk of serious harm (Asian 28%, black 44%, mixed 35%, other 35% and white 24%).
Safety and Wellbeing ratings
• Children from a black (55%) ethnic background were assessed to have a larger proportion of a ‘high’ and ‘very high’ rating for safety and wellbeing (Asian 32%, mixed 45%, other 48% and white 40%). Source: https://www.gov.uk/government/statistics/assessing-the-needs-of-sentenced-children-in-the-
youth-justice-system<br>
slide39. Court: what we are doing
We are undertaking a statistical analysis of data to help explain the drivers of ethnic disproportionality in remand and sentencing outcomes in the youth justice system. This will be completed in autumn 2020.
We are exploring work relating to COVID-19 and the implications for BAME children. We have also explored options for targeted funding in relation to BAME and the COVID-19 response.
We have extended the ethnic categorisation within the YOT Case Management Systems to 18+1 which will incorporate Gypsy, Roma and Traveller children. This will enable the YJB to explore and better understand their experience throughout the youth justice system and identify areas for potential work.<br>
slide40. Custody<br>
slide41. Custodial population
In the year ending March 2020, black children made up 28% of the population of children in custody.
This is 7 times higher than their share in the general population of 10 to 17-year-olds in England and Wales (4%). Sources:
https://www.ons.gov.uk/census/2011census/howourcensusworks/howdidwedoin2011/2011censusgeneralreport
https://www.gov.uk/government/statistics/youth-custody-data
https://www.gov.uk/government/statistics/youth-justice-statistics-2018-to-2019<br>
slide42. Custodial population
In the year ending March 2020, the number of children in custody from a black background decreased by 10% to account for 28% of the youth custody population. This compares to 15% ten years ago. Sources:
https://www.gov.uk/government/statistics/youth-custody-data
https://www.gov.uk/government/statistics/youth-justice-statistics-2018-to-2019 As of May 2020, provisional data shows that despite a decrease of 24
compared to the previous month (the total is now 319), BAME children
made up the majority (53%) of the youth custody population.<br>
slide43. Use of remand
In the year ending March 2019, black, Asian and minority ethnic (BAME) children were even more over-represented amongst those in custody while on remand. Sources:
https://www.gov.uk/government/statistics/youth-custody-data
https://www.gov.uk/government/statistics/youth-justice-statistics-2018-to-2019 As of May 2020, provisional data shows that despite a decrease of 24
compared to the previous month (the total is now 319), BAME children
made up the majority (53%) of the youth custody population.<br>
slide44. Behaviour management
In the year ending March 2019, the rate of restrictive physical interventions for both white and black, Asian and minority ethnic (BAME) children reached its highest point in the 8 years covered by this data.
This was the first year since 2014 that the rate of incidents was higher for white children (47.2) than those from a BAME background (46.3).
In the year ending March 2019, the average monthly rate for use of force per 100 children in secure training centres and young offender institutions was highest for white children (60.2 compared to 59.3 for BAME children).<br>
slide45. Behaviour management
In the year ending March 2019, the rates of assault committed by black, Asian and minority ethnic (BAME) children were higher for children in secure children’s homes and secure training centres than for white children.
The average monthly rate for assault for BAME children in young offender institutions was higher than for white children.
In the year ending March 2019, the rate of self-harm by white children in custody was 2.75 times the rate of BAME children.
In the year ending March 2019, the average monthly rates for the use of single separation in secure children’s homes and secure training centres were higher for white children (95.9 compared to 78.1 for those from a BAME background).<br>
slide46. What the Youth Custody Service is doing
The Youth Custody Service (YCS) is identifying and investigating disproportionality in youth custody.
Where disparities cannot be explained it is putting in place reforms. This includes improving data accessibility and analysis and driving improvements in service delivery though establishment level plans.
The YCS is undertaking a specific programme of work to improve services for girls in custody.<br>
slide47. What the Youth Custody Service is doing
Staff are being supported through the identification and production of effective practice products and policies that address priority areas relating to diversity and inclusion.
The Youth Custody Service will increase the internal supply of black, Asian and minority ethnic employees at all levels who have the skill-set and desire to be senior leaders.<br>
slide48. Reoffending<br>
slide49. Number of offences
Of those children who reoffend, white children offend more often.
White children had a rate of 4.22 reoffences per reoffender, Asian children had a rate of 3.46, black children had a rate of 3.62 and children from other backgrounds had a rate of 3.04. Source: https://www.gov.uk/government/collections/proven-reoffending-statistics<br>
slide50. Likelihood of reoffending
The reoffending rate has consistently been highest for black children over the last ten years.
In the latest year, 47% of black children reoffended within 12 months, compared with 39% of white children. Source: https://www.gov.uk/government/collections/proven-reoffending-statistics<br>
slide51. Reoffending: what we are doing
We have developed a Reoffending Disproportionality Tool. This tool uses data from the Police National Computer (PNC) to help highlight the over-representation of ethnic groups according to reoffending data.
The Tool is available to YOTs via the Youth justice Application Framework (YJAF).<br>
slide52. Toolkits<br>
slide53. Toolkits
We have developed the following toolkits:
Summary Ethnic Disproportionality Tool
Local Ethnic Disproportionality Tool
Reoffending Disproportionality Tool
These are available to YOTs via the Youth Justice Application Framework (YJAF). We have also reviewed and redesigned the Local Ethnic Disproportionality Tool following the recommendation made as part of the Lammy Review. This is now available to all youth offending teams nationally and is updated on an annual basis
We continue to update the Summary Ethnic Disproportionality Tool on an annual basis. This tool now includes Police and Crime Commissioner level disproportionality data.<br>
slide54. Notes on the data<br>
slide55. Notes on the data
We developed this presentation to highlight where disproportionality occurs and to help bring about change.
Wherever possible we used the most up to date data available. All of the data shown includes Wales unless we specifically say that it is for England only.Wherever possible we used the data for Gypsy, Roma and Traveller (GRT) children in this presentation.
We have also extended the ethnic categorisation within the case management system for youth offending teams to include GRT children. This will enable us to explore and better understand the experiences of these children throughout the youth justice system and identify areas for potential work.
We have chosen to omit ‘stop and search’ data from this presentation because it was not possible to break down by age.<br>
slide56. Notes on recording ethnicity
In this publication we include two measures to record ethnicity: officer identified ethnicity and self-identified ethnicity. This appendix details the categorical breakdowns of both types of ethnicity.
Officer identified ethnicity is ethnicity as recorded by a police officer or a member of the administrative or clerical team, based on visual appearance. The data is initially inputted into six detailed categories, which are then re-categorised in the Court Proceedings database into the following four categories: black, white, Asian, other. This is known as 4+1 and most sections in this report use this classification when referring to officer identified ethnicity.
Self-identified ethnicity is ethnicity as defined by an individual. Categories are based on the classifications as defined by the 2001 and 2011 Census. The ONS introduced two further categories to the Census in 2011: ‘White –Gypsy or Irish Traveller’ and ‘Arab’; and moved ‘Chinese’ to the broader Asian category. To allow for comparability with previous editions of Race and the Criminal Justice System, Chinese are placed in the ‘Chinese or Other’, or ‘Other’ category, following the 2001 Census. Source: https://assets.publishing.service.gov.uk/government/uploads/system/uploads/attachment_
data/file/849200/statistics-on-race-and-the-cjs-2018.pdf<br>
slide57. What is RRI
We use the relative rate index (RRI) in this presentation to compare the relative difference in rates between two fixed populations. This was a recommendation from the 2017 Lammy Review.
We used the RRI, rates for each ethnic group relative to the white ethnic group. These were compared to determine whether outcomes differed significantly.
An RRI value of ‘one’ indicates no disparity, whereas an RRI greater than one means the group of interest had a greater likelihood of experiencing the particular outcome. An RRI less than one indicates the group of interest was less likely than the white ethnic group to experience that outcome. https://www.gov.uk/government/publications/covid-19-review-of-disparities-in-risks-and-outcomes<br>
slide58. What is RRI
Please note that there has been a change to the methodology used to determine the level of disproportionality for knife possession offences. In the previous version of the presentation (July 2019) the relative rate index (RRI) for knife possession was determined by comparing the number of possession offences by ethnicity with the general population by ethnicity, in this version of the knife possession offences are compared with the number of arrests by ethnicity data to calculate a RRI.
We made this change to stay in line with guidance on using RRI that recommends that comparisons should be made against the previous stage in the criminal justice system, in this case the arrest stage, rather than with the general population.<br>
slide59. Notes on the mental health data
For adults, black, Asian and minority ethnic (BAME) groups are less likely to obtain treatment for mental health needs than white British people. Diverse barriers to timely access have been identified. Differences in the prevalence of mental disorders between ethnic groups vary by type of disorder.
However, BAME groups and black adults in particular, are over-represented at the more critical end of the system, in referrals from the criminal justice system, in restrictive interventions and detentions under the Mental Health Act. BAME groups also receive poorer treatment outcomes.<br>
slide60. Find out more
It is our strategic objective to influence the youth justice system to treat children fairly and reduce ethnic disproportionality. You can find out more about how we intend to do this in our business plan.
Email YJBProgrammeSupportOffice@yjb.gov.uk with general queries about this presentation.
https://www.gov.uk/government/publications/yjb-business-plan-2020-to-2021<br>