
Externalities: There’s No Use Crying Over
Description: Externalities: Theres No Use Crying Over Spillovers Note: On slides 3, 5, 7, 9 in presentation mode students may slide the graph pieces on a separate monitor in the normaledit view. Supply Demand Graph Quantity Price Supply Demand P Q
Related Topics
Download Presentation
"Externalities: There’s No Use Crying Over" is the property of its rightful owner. Permission is granted to download and print the materials on this website for personal, non-commercial use only, and to display it on your personal computer provided you do not modify the materials and that you retain all copyright notices contained in the materials. By downloading content from our website, you accept the terms of this agreement.
Presentation Transcript
slide1. Externalities:
There’s No Use Crying Over Spillovers Note: On slides 3, 5, 7, & 9 in presentation mode students may slide the graph pieces on a separate monitor in the normal/edit view.<br>
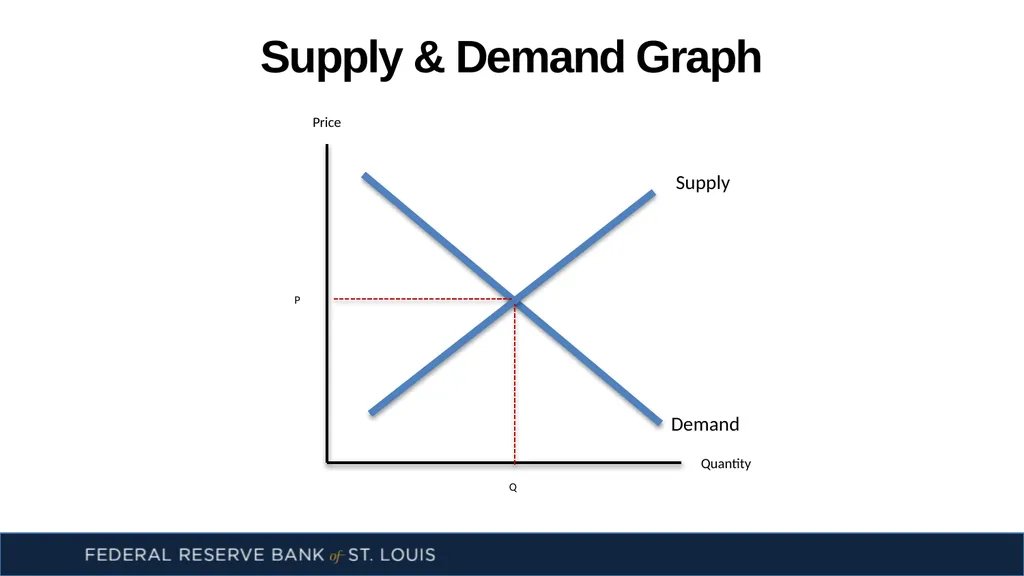
slide2. Supply & Demand Graph Quantity Price Supply Demand P Q<br>
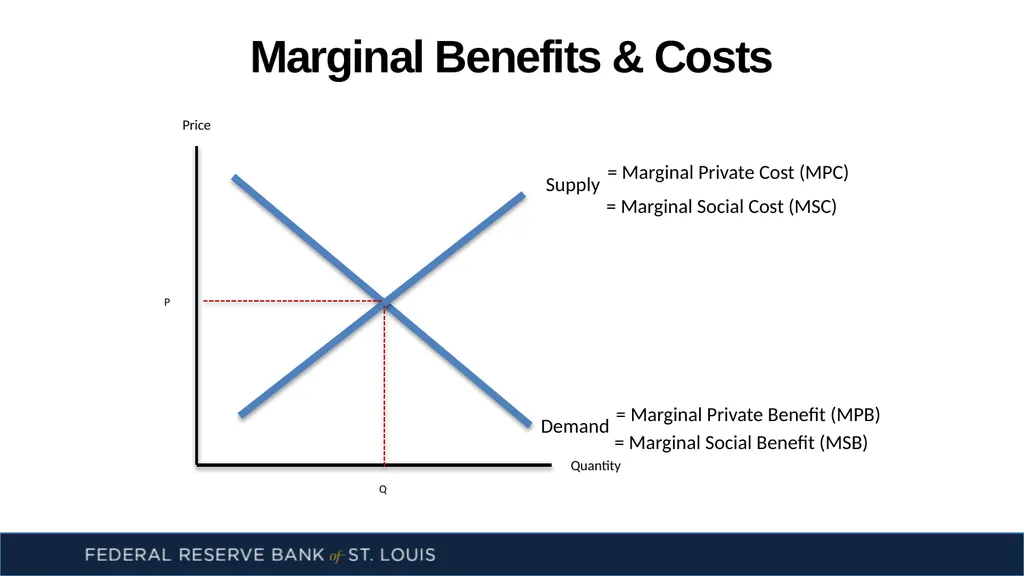
slide3. Marginal Benefits & Costs Quantity Price Supply Demand P Q = Marginal Private Cost (MPC) = Marginal Private Benefit (MPB) = Marginal Social Cost (MSC) = Marginal Social Benefit (MSB)<br>
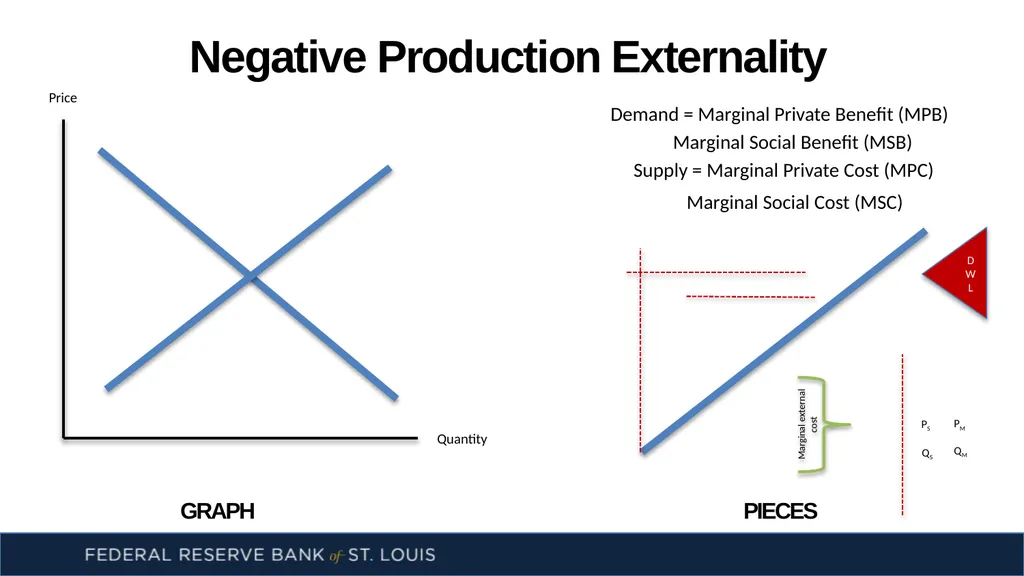
slide4. Negative Production Externality Quantity Price PM QM Marginal Social Cost (MSC) Demand = Marginal Private Benefit (MPB) DWL Supply = Marginal Private Cost (MPC) Marginal Social Benefit (MSB) QS PS GRAPH PIECES Marginal external cost<br>
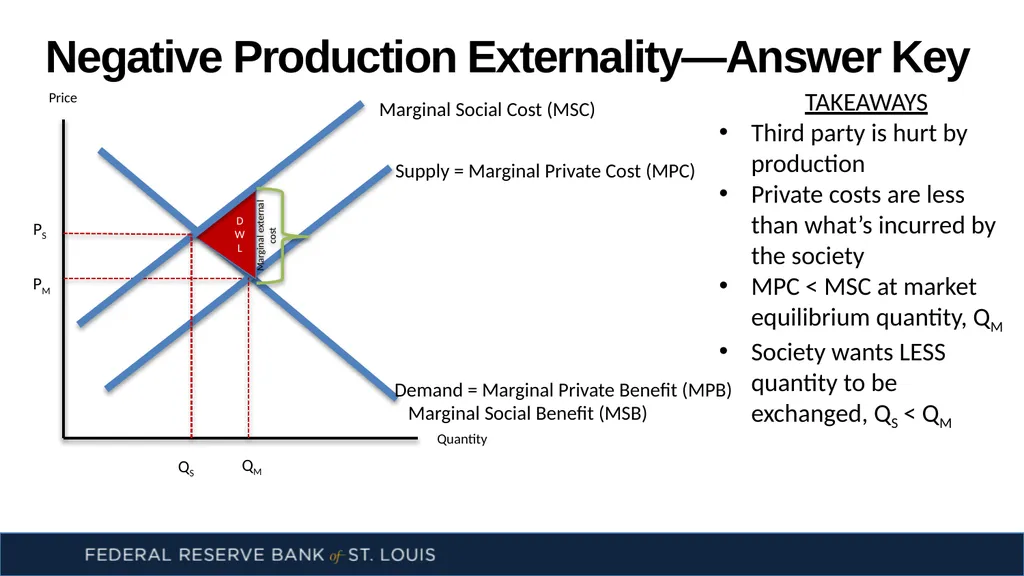
slide5. Negative Production Externality—Answer Key Quantity Price PM QM Marginal Social Cost (MSC) Demand = Marginal Private Benefit (MPB) DWL Supply = Marginal Private Cost (MPC) Marginal Social Benefit (MSB) QS PS TAKEAWAYS
Third party is hurt by production
Private costs are less than what’s incurred by the society
MPC < MSC at market equilibrium quantity, QM
Society wants LESS quantity to be exchanged, QS < QM Marginal external cost<br>
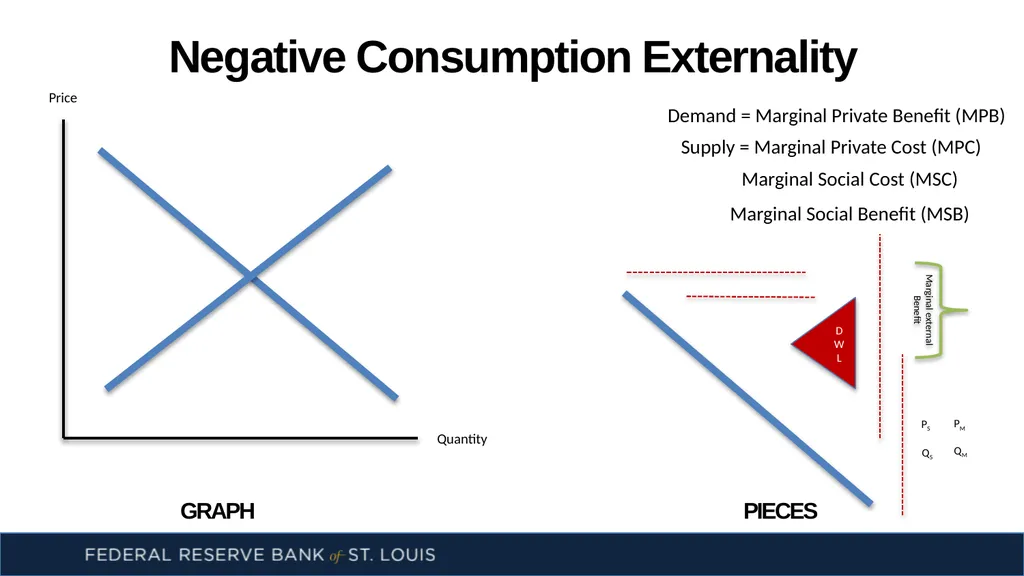
slide6. Negative Consumption Externality Quantity Price PM QM Marginal Social Cost (MSC) Demand = Marginal Private Benefit (MPB) DWL Supply = Marginal Private Cost (MPC) Marginal Social Benefit (MSB) QS PS GRAPH PIECES Marginal external Benefit<br>
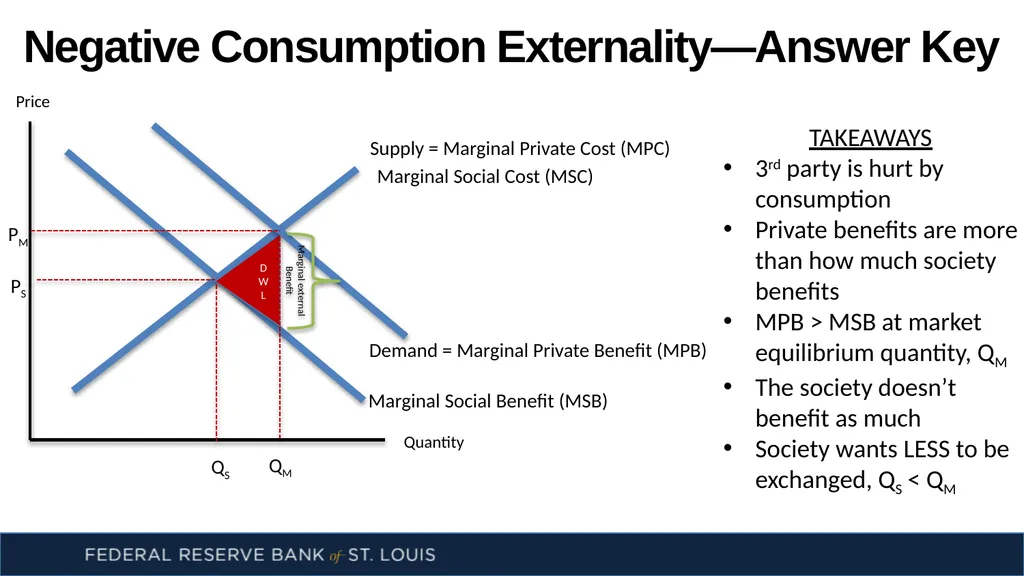
slide7. Negative Consumption Externality—Answer Key Quantity Price PM QM Marginal Social Cost (MSC) Demand = Marginal Private Benefit (MPB) DWL Supply = Marginal Private Cost (MPC) Marginal Social Benefit (MSB) QS PS TAKEAWAYS
3rd party is hurt by consumption
Private benefits are more than how much society benefits
MPB > MSB at market equilibrium quantity, QM
The society doesn’t benefit as much
Society wants LESS to be exchanged, QS < QM Marginal external Benefit<br>
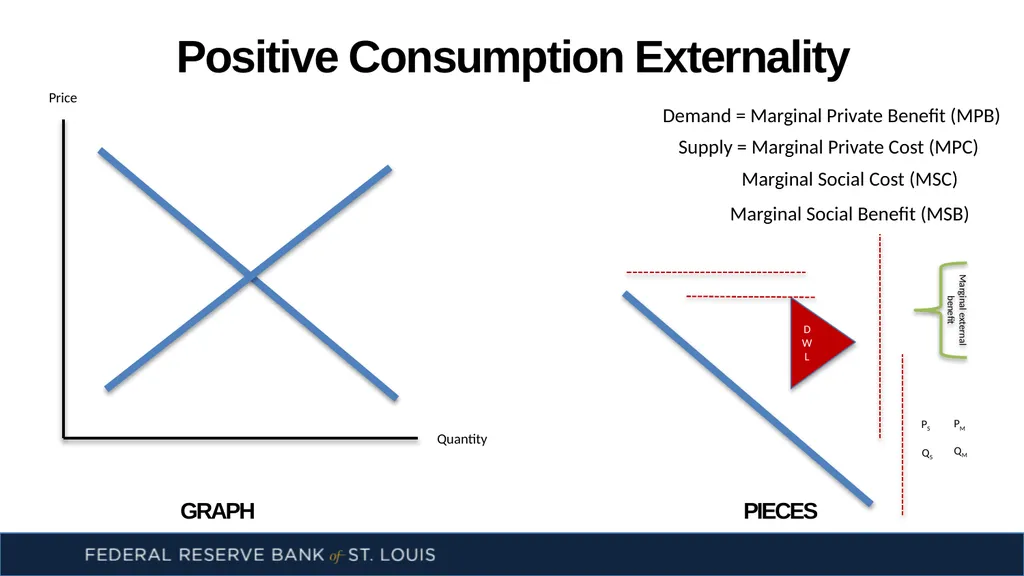
slide8. Positive Consumption Externality Quantity Price PM QM Marginal Social Cost (MSC) Demand = Marginal Private Benefit (MPB) DWL Supply = Marginal Private Cost (MPC) Marginal Social Benefit (MSB) QS PS GRAPH PIECES Marginal external benefit<br>
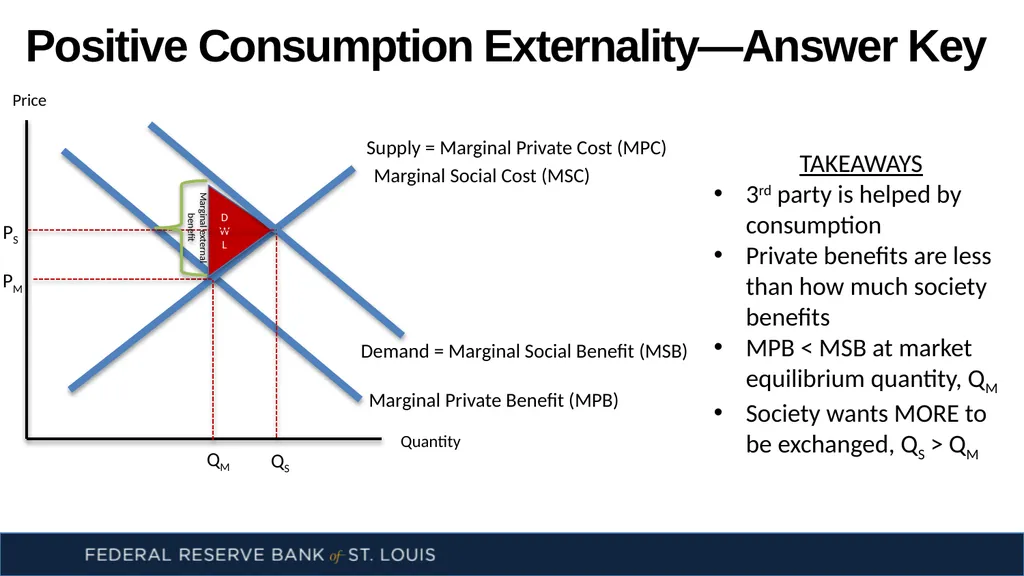
slide9. Positive Consumption Externality—Answer Key Quantity Price PM QM Marginal Social Cost (MSC) Marginal Private Benefit (MPB) DWL Supply = Marginal Private Cost (MPC) Demand = Marginal Social Benefit (MSB) QS PS TAKEAWAYS
3rd party is helped by consumption
Private benefits are less than how much society benefits
MPB < MSB at market equilibrium quantity, QM
Society wants MORE to be exchanged, QS > QM Marginal external benefit<br>
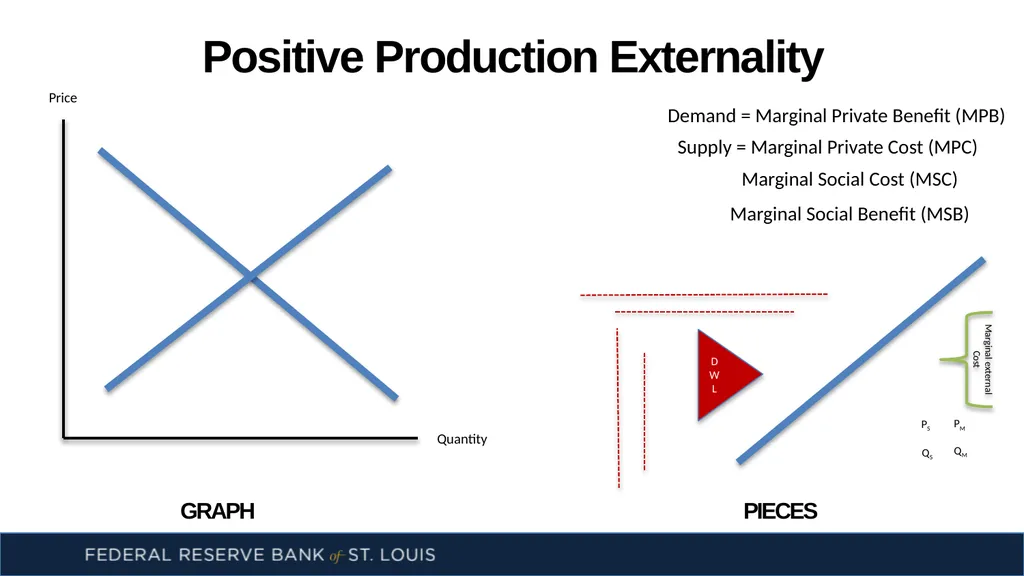
slide10. Positive Production Externality Quantity Price PM QM Marginal Social Cost (MSC) Demand = Marginal Private Benefit (MPB) DWL Supply = Marginal Private Cost (MPC) Marginal Social Benefit (MSB) QS PS GRAPH PIECES Marginal external Cost<br>
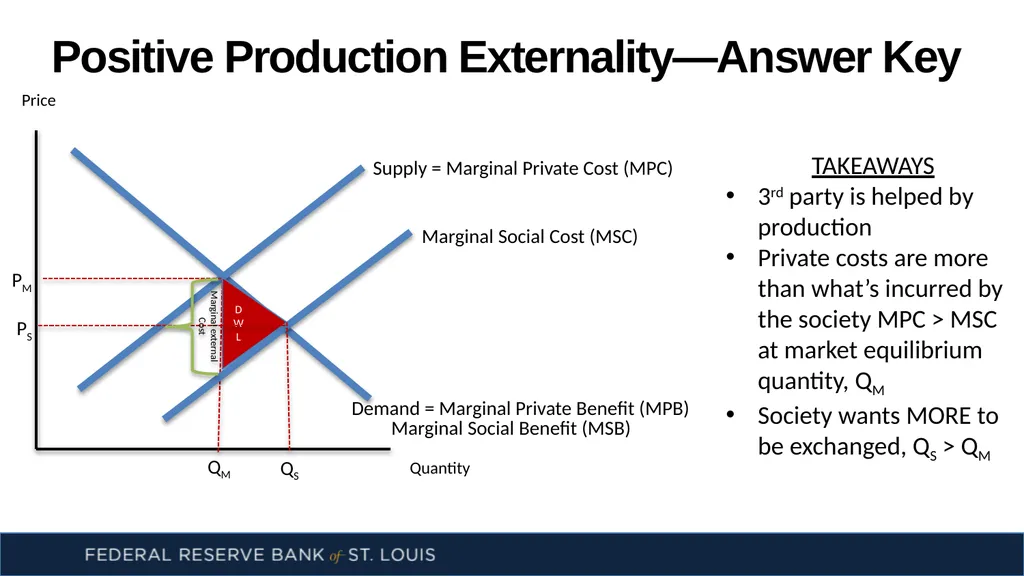
slide11. Positive Production Externality—Answer Key Quantity Price PM QM Marginal Social Cost (MSC) Demand = Marginal Private Benefit (MPB) DWL Supply = Marginal Private Cost (MPC) Marginal Social Benefit (MSB) QS PS TAKEAWAYS
3rd party is helped by production
Private costs are more than what’s incurred by the society MPC > MSC at market equilibrium quantity, QM
Society wants MORE to be exchanged, QS > QM Marginal external Cost<br>
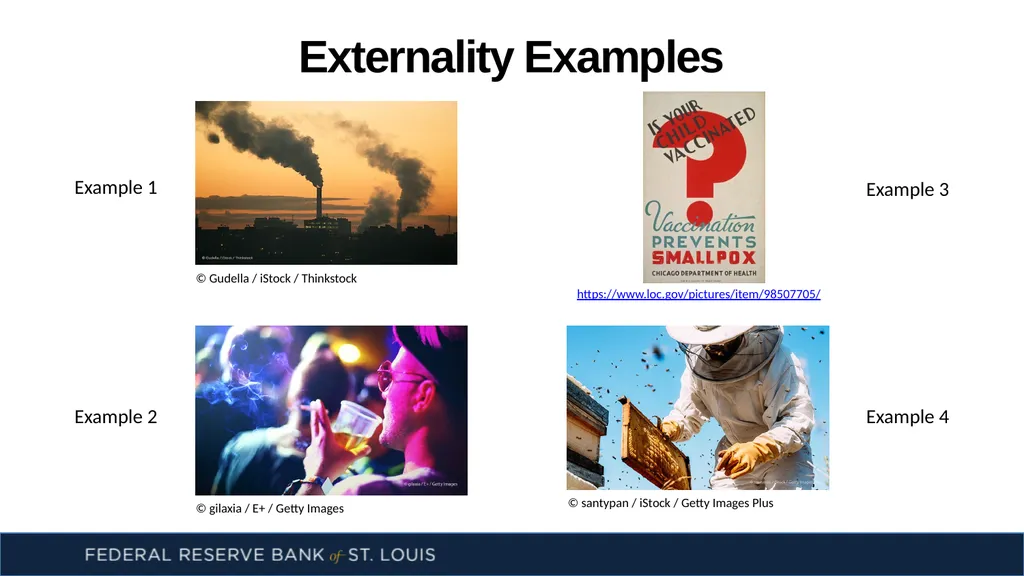
slide12. Externality Examples Example 1 Example 2 Example 3 Example 4 © santypan / iStock / Getty Images Plus https://www.loc.gov/pictures/item/98507705/ © gilaxia / E+ / Getty Images © Gudella / iStock / Thinkstock<br>
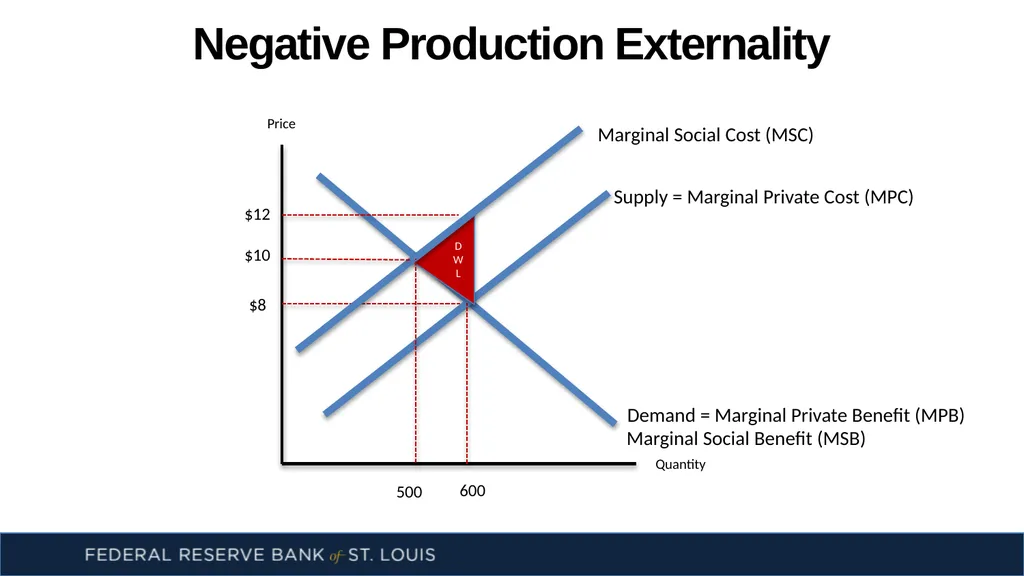
slide13. Negative Production Externality Quantity Price $8 600 Marginal Social Cost (MSC) Demand = Marginal Private Benefit (MPB) DWL Supply = Marginal Private Cost (MPC) Marginal Social Benefit (MSB) 500 $10 $12<br>
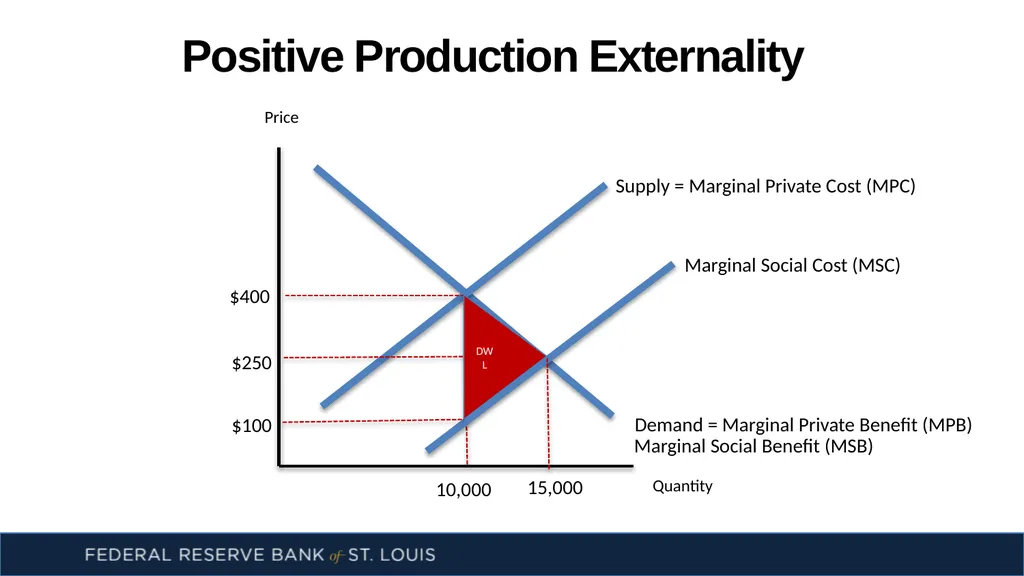
slide14. Positive Production Externality Quantity Price $400 10,000 Marginal Social Cost (MSC) Demand = Marginal Private Benefit (MPB) DWL Supply = Marginal Private Cost (MPC) Marginal Social Benefit (MSB) 15,000 $250 $100<br>
slide2. Supply & Demand Graph Quantity Price Supply Demand P Q<br>
slide3. Marginal Benefits & Costs Quantity Price Supply Demand P Q = Marginal Private Cost (MPC) = Marginal Private Benefit (MPB) = Marginal Social Cost (MSC) = Marginal Social Benefit (MSB)<br>
slide4. Negative Production Externality Quantity Price PM QM Marginal Social Cost (MSC) Demand = Marginal Private Benefit (MPB) DWL Supply = Marginal Private Cost (MPC) Marginal Social Benefit (MSB) QS PS GRAPH PIECES Marginal external cost<br>
slide5. Negative Production Externality—Answer Key Quantity Price PM QM Marginal Social Cost (MSC) Demand = Marginal Private Benefit (MPB) DWL Supply = Marginal Private Cost (MPC) Marginal Social Benefit (MSB) QS PS TAKEAWAYS
Third party is hurt by production
Private costs are less than what’s incurred by the society
MPC < MSC at market equilibrium quantity, QM
Society wants LESS quantity to be exchanged, QS < QM Marginal external cost<br>
slide6. Negative Consumption Externality Quantity Price PM QM Marginal Social Cost (MSC) Demand = Marginal Private Benefit (MPB) DWL Supply = Marginal Private Cost (MPC) Marginal Social Benefit (MSB) QS PS GRAPH PIECES Marginal external Benefit<br>
slide7. Negative Consumption Externality—Answer Key Quantity Price PM QM Marginal Social Cost (MSC) Demand = Marginal Private Benefit (MPB) DWL Supply = Marginal Private Cost (MPC) Marginal Social Benefit (MSB) QS PS TAKEAWAYS
3rd party is hurt by consumption
Private benefits are more than how much society benefits
MPB > MSB at market equilibrium quantity, QM
The society doesn’t benefit as much
Society wants LESS to be exchanged, QS < QM Marginal external Benefit<br>
slide8. Positive Consumption Externality Quantity Price PM QM Marginal Social Cost (MSC) Demand = Marginal Private Benefit (MPB) DWL Supply = Marginal Private Cost (MPC) Marginal Social Benefit (MSB) QS PS GRAPH PIECES Marginal external benefit<br>
slide9. Positive Consumption Externality—Answer Key Quantity Price PM QM Marginal Social Cost (MSC) Marginal Private Benefit (MPB) DWL Supply = Marginal Private Cost (MPC) Demand = Marginal Social Benefit (MSB) QS PS TAKEAWAYS
3rd party is helped by consumption
Private benefits are less than how much society benefits
MPB < MSB at market equilibrium quantity, QM
Society wants MORE to be exchanged, QS > QM Marginal external benefit<br>
slide10. Positive Production Externality Quantity Price PM QM Marginal Social Cost (MSC) Demand = Marginal Private Benefit (MPB) DWL Supply = Marginal Private Cost (MPC) Marginal Social Benefit (MSB) QS PS GRAPH PIECES Marginal external Cost<br>
slide11. Positive Production Externality—Answer Key Quantity Price PM QM Marginal Social Cost (MSC) Demand = Marginal Private Benefit (MPB) DWL Supply = Marginal Private Cost (MPC) Marginal Social Benefit (MSB) QS PS TAKEAWAYS
3rd party is helped by production
Private costs are more than what’s incurred by the society MPC > MSC at market equilibrium quantity, QM
Society wants MORE to be exchanged, QS > QM Marginal external Cost<br>
slide12. Externality Examples Example 1 Example 2 Example 3 Example 4 © santypan / iStock / Getty Images Plus https://www.loc.gov/pictures/item/98507705/ © gilaxia / E+ / Getty Images © Gudella / iStock / Thinkstock<br>
slide13. Negative Production Externality Quantity Price $8 600 Marginal Social Cost (MSC) Demand = Marginal Private Benefit (MPB) DWL Supply = Marginal Private Cost (MPC) Marginal Social Benefit (MSB) 500 $10 $12<br>
slide14. Positive Production Externality Quantity Price $400 10,000 Marginal Social Cost (MSC) Demand = Marginal Private Benefit (MPB) DWL Supply = Marginal Private Cost (MPC) Marginal Social Benefit (MSB) 15,000 $250 $100<br>