
F.I.E.L.D. Immersion Program Dr. Shaun William

Description: F.I.E.L.D. Immersion Program Dr. Shaun William Davies, CFA July 25, 2018 1 Business Economics A Few Words About Me 2 Assistant Professor of Finance Leeds School of Business, University of Colorado at Boulder Finance PhD (UCLA 2013),
Related Topics
Download Presentation
"F.I.E.L.D. Immersion Program Dr. Shaun William" is the property of its rightful owner. Permission is granted to download and print the materials on this website for personal, non-commercial use only, and to display it on your personal computer provided you do not modify the materials and that you retain all copyright notices contained in the materials. By downloading content from our website, you accept the terms of this agreement.
Presentation Transcript
slide1. F.I.E.L.D. Immersion Program
Dr. Shaun William Davies, CFA July 25, 2018 1 Business Economics<br>
slide2. A Few Words About Me 2 Assistant Professor of Finance
Leeds School of Business, University of Colorado at Boulder
Finance PhD (UCLA 2013), Economics MA (UCLA 2010)
CFA Charterholder
Research in Venture Financing, Exchange Traded Funds (ETFs), and Impact Investing & Socially Responsible Investing (SRI)<br>
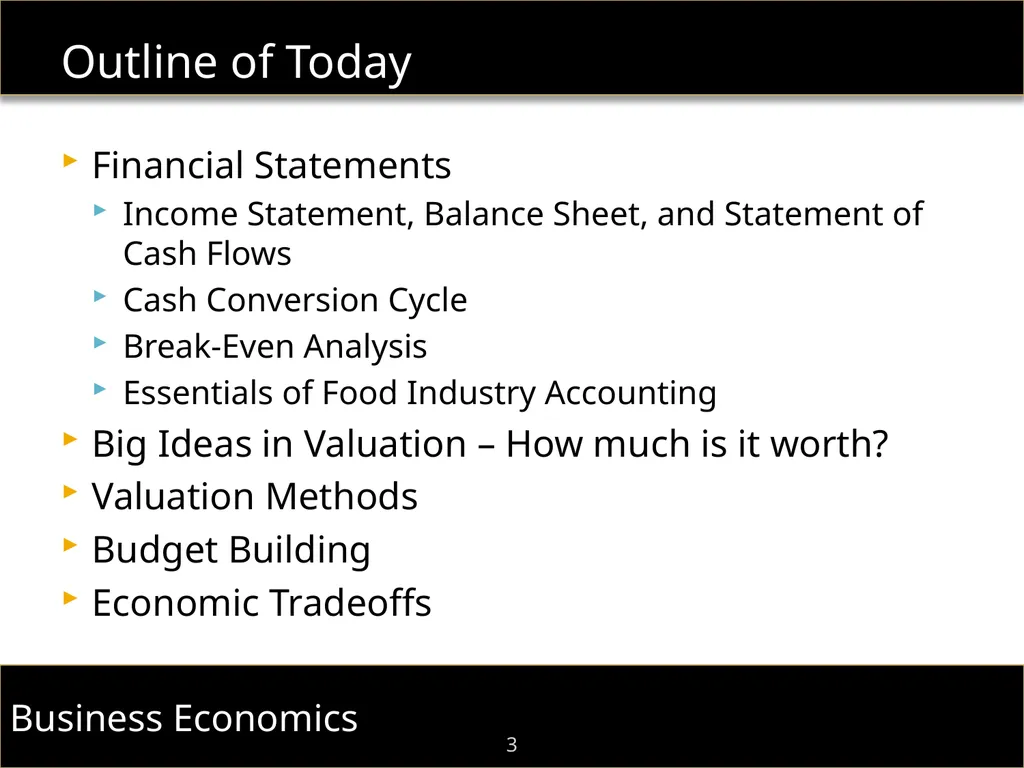
slide3. Outline of Today 3 Financial Statements
Income Statement, Balance Sheet, and Statement of Cash Flows
Cash Conversion Cycle
Break-Even Analysis
Essentials of Food Industry Accounting
Big Ideas in Valuation – How much is it worth?
Valuation Methods
Budget Building
Economic Tradeoffs<br>
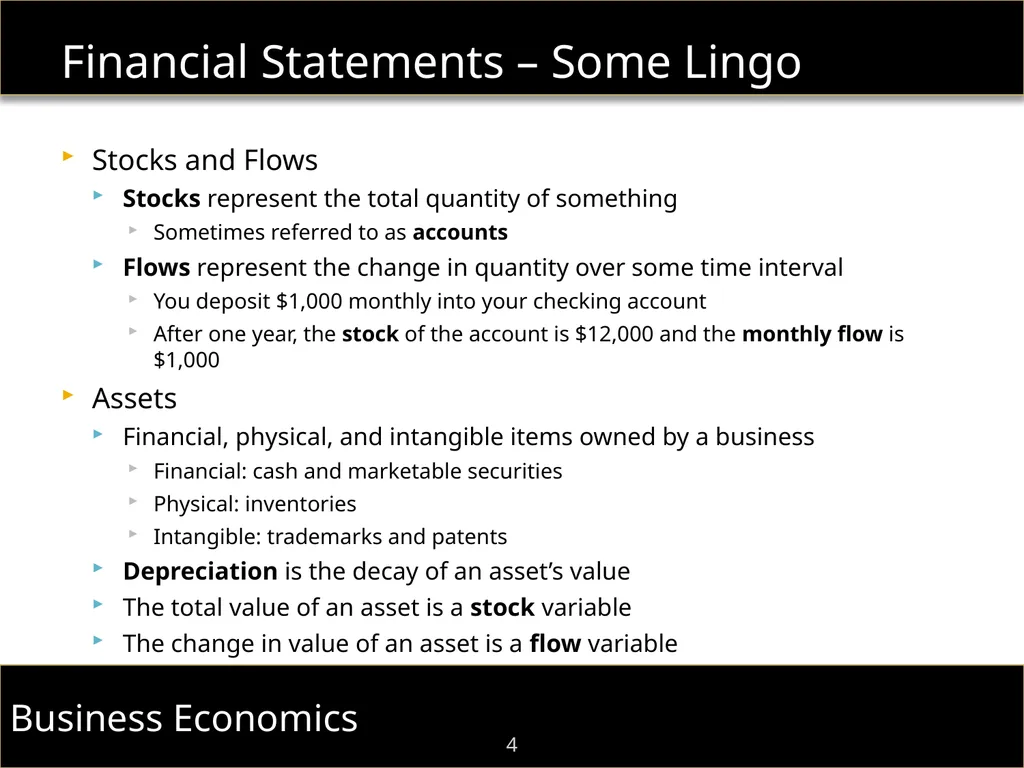
slide4. Financial Statements – Some Lingo 4 Stocks and Flows
Stocks represent the total quantity of something
Sometimes referred to as accounts
Flows represent the change in quantity over some time interval
You deposit $1,000 monthly into your checking account
After one year, the stock of the account is $12,000 and the monthly flow is $1,000
Assets
Financial, physical, and intangible items owned by a business
Financial: cash and marketable securities
Physical: inventories
Intangible: trademarks and patents
Depreciation is the decay of an asset’s value
The total value of an asset is a stock variable
The change in value of an asset is a flow variable<br>
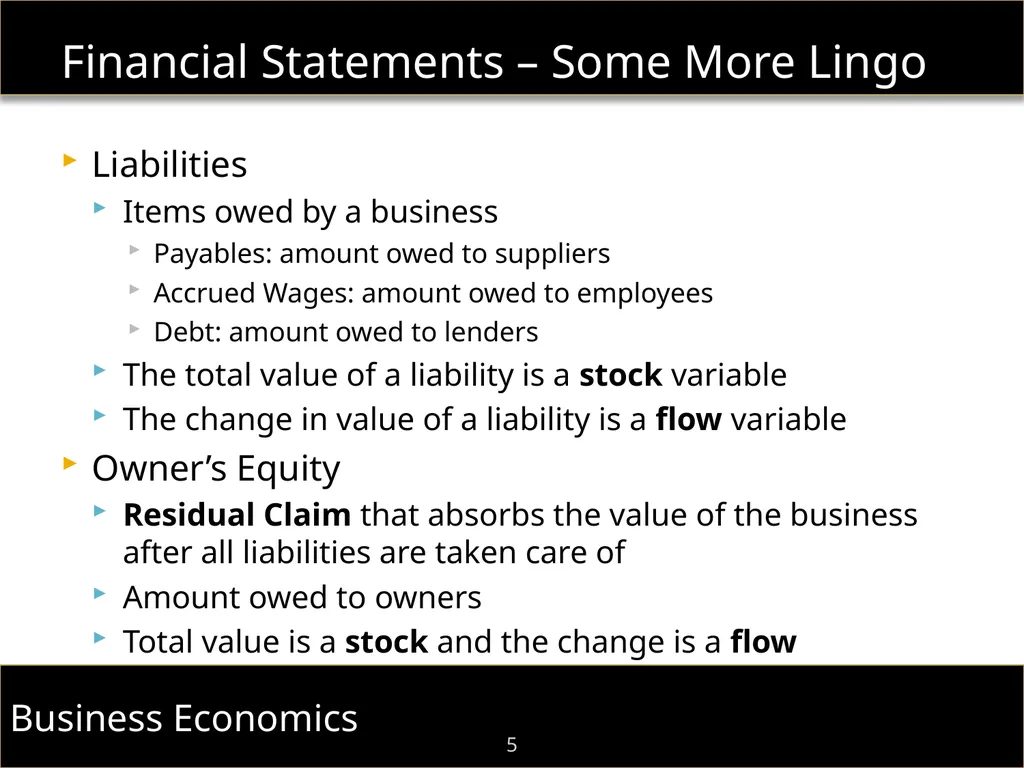
slide5. Financial Statements – Some More Lingo 5 Liabilities
Items owed by a business
Payables: amount owed to suppliers
Accrued Wages: amount owed to employees
Debt: amount owed to lenders
The total value of a liability is a stock variable
The change in value of a liability is a flow variable
Owner’s Equity
Residual Claim that absorbs the value of the business after all liabilities are taken care of
Amount owed to owners
Total value is a stock and the change is a flow<br>
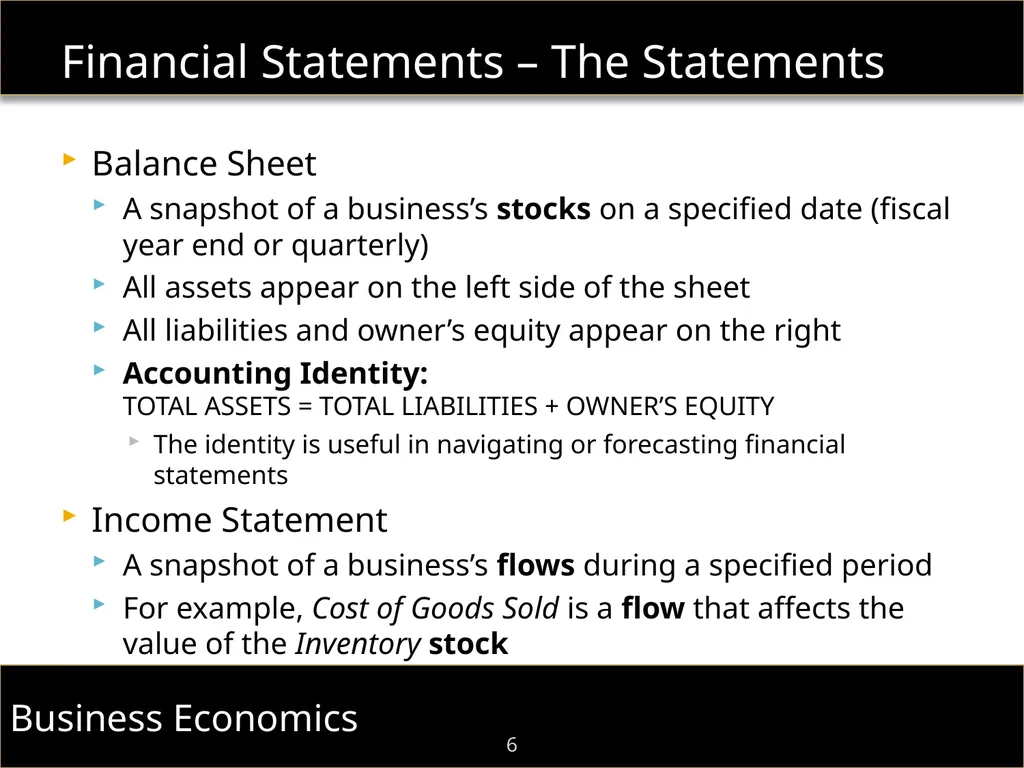
slide6. Financial Statements – The Statements 6 Balance Sheet
A snapshot of a business’s stocks on a specified date (fiscal year end or quarterly)
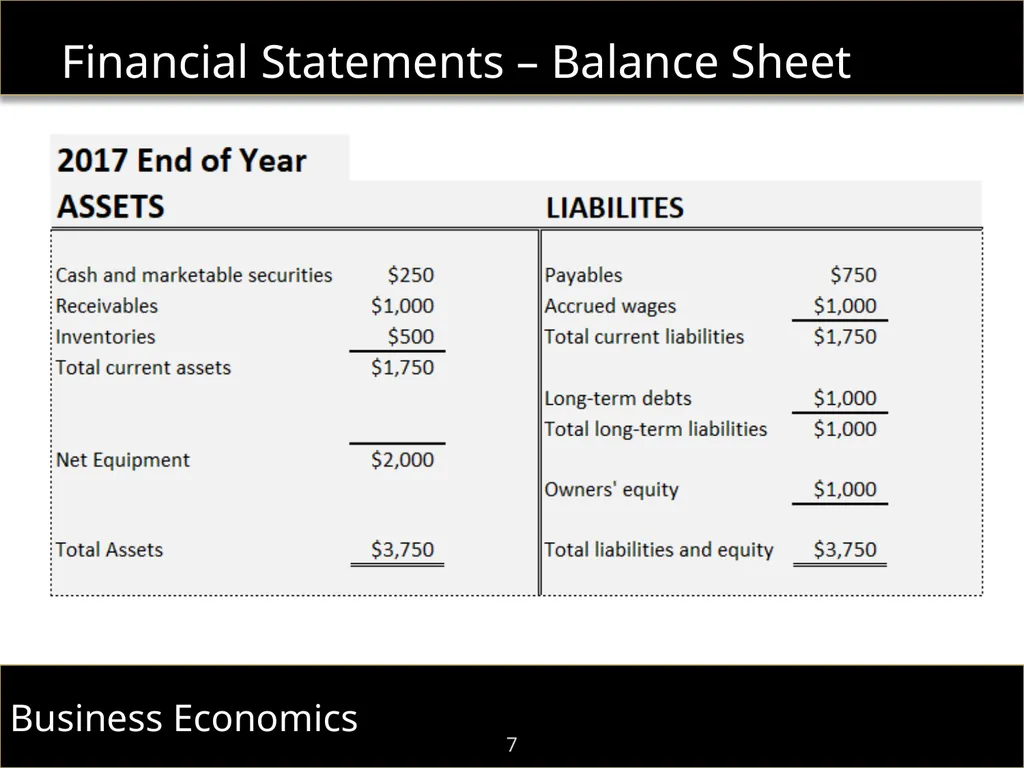
All assets appear on the left side of the sheet
All liabilities and owner’s equity appear on the right
Accounting Identity: TOTAL ASSETS = TOTAL LIABILITIES + OWNER’S EQUITY
The identity is useful in navigating or forecasting financial statements
Income Statement
A snapshot of a business’s flows during a specified period
For example, Cost of Goods Sold is a flow that affects the value of the Inventory stock<br>
slide7. Financial Statements – Balance Sheet 7<br>
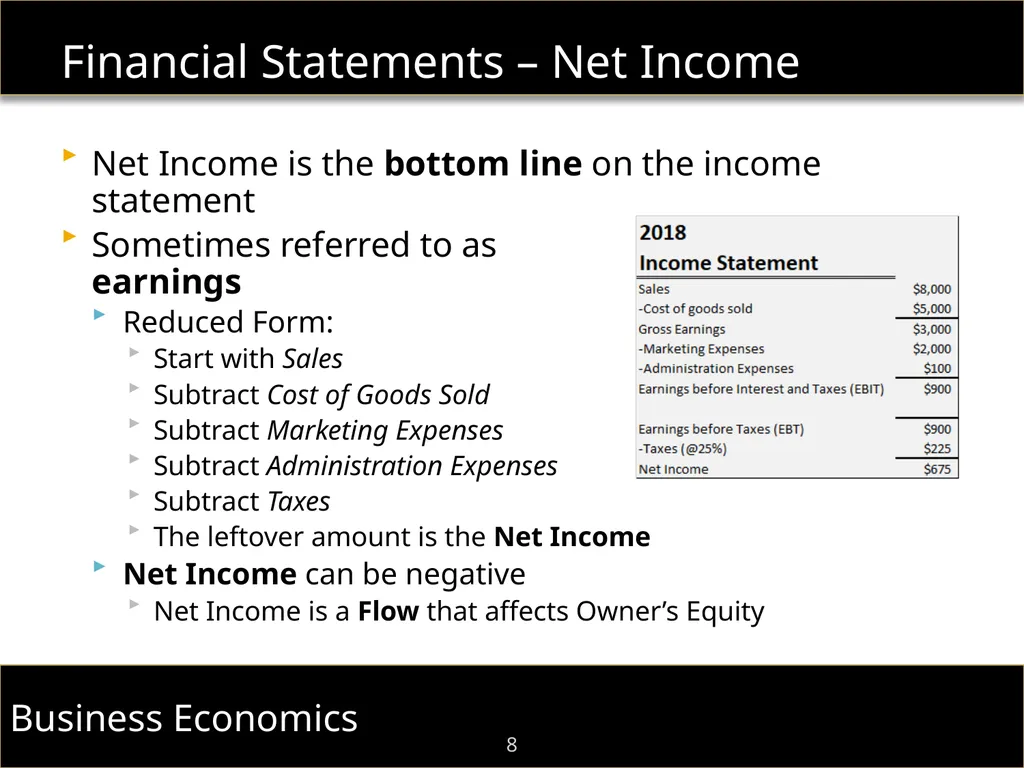
slide8. Financial Statements – Net Income 8 Net Income is the bottom line on the income statement
Sometimes referred to as earnings
Reduced Form:
Start with Sales
Subtract Cost of Goods Sold
Subtract Marketing Expenses
Subtract Administration Expenses
Subtract Taxes
The leftover amount is the Net Income
Net Income can be negative
Net Income is a Flow that affects Owner’s Equity<br>
slide9. Financial Statements – Net Income vs. Cash 9 Net Income is often referred to as accounting profit
Importantly, net income is not equal to the cash profit
Accrual Accounting
Net income is an accrual accounting measure
Accrual accounting is: “earned”, “incurred”, and “recognized”
Accrual accounting is not: “realized”
Accrual accounting makes sense in some regards
Depreciation allows smoothing of asset value erosion over time
Accrual accounting distorts cash flows
Not all sources/uses of cash show up on the income statement
For example, Capital Expenditures
Not all items on the income statement are sources/uses of cash
For example, Depreciation<br>
slide10. Financial Statements – Statement of Cash Flows 10 Statement of Cash Flows
This financial statement is the “anti-accrual-accounting” statement
Statement shows how changes in balance sheet stocks (i.e., flows) affect the cash account (or stock) and the cash flow
Statement of Cash Flows is broken into three categories
Operating Cash Flow
Measures the cash flow generated by the business‘s normal operations
Investing Cash Flow
Measures the cash flow generated by investments in capital assets, subsidiaries, and financial markets
Financing Cash Flow
Measures the cash flow generated by financing activities like issuing new equity or repaying loans<br>
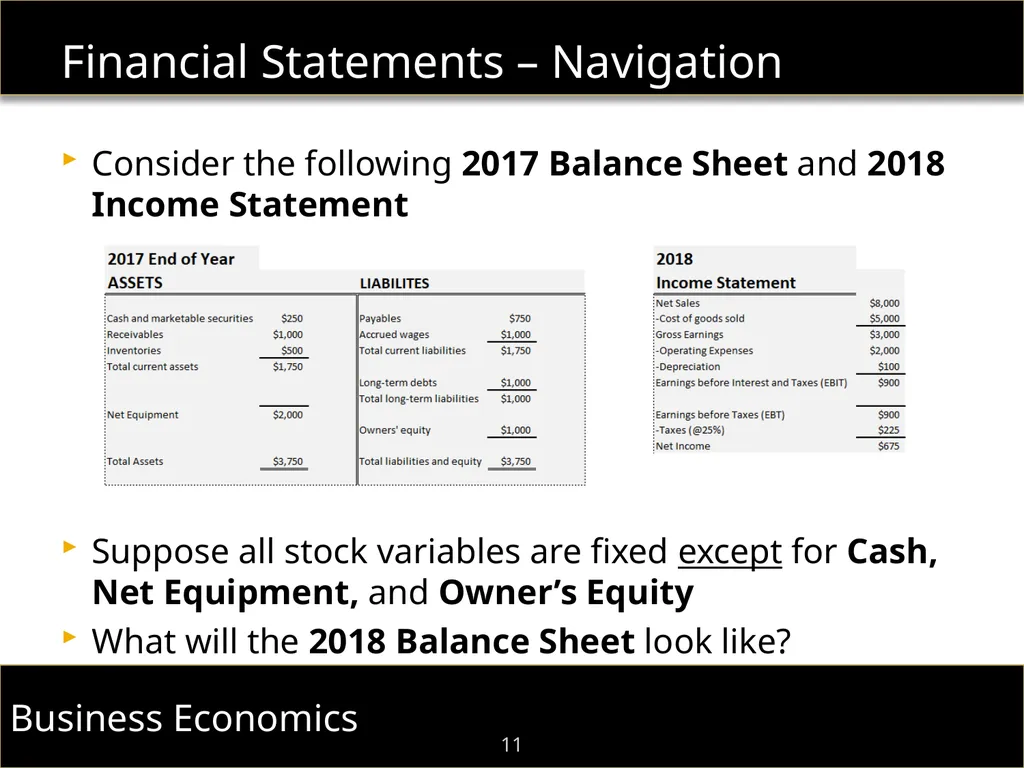
slide11. Financial Statements – Navigation 11 Consider the following 2017 Balance Sheet and 2018 Income Statement
Suppose all stock variables are fixed except for Cash, Net Equipment, and Owner’s Equity
What will the 2018 Balance Sheet look like?<br>
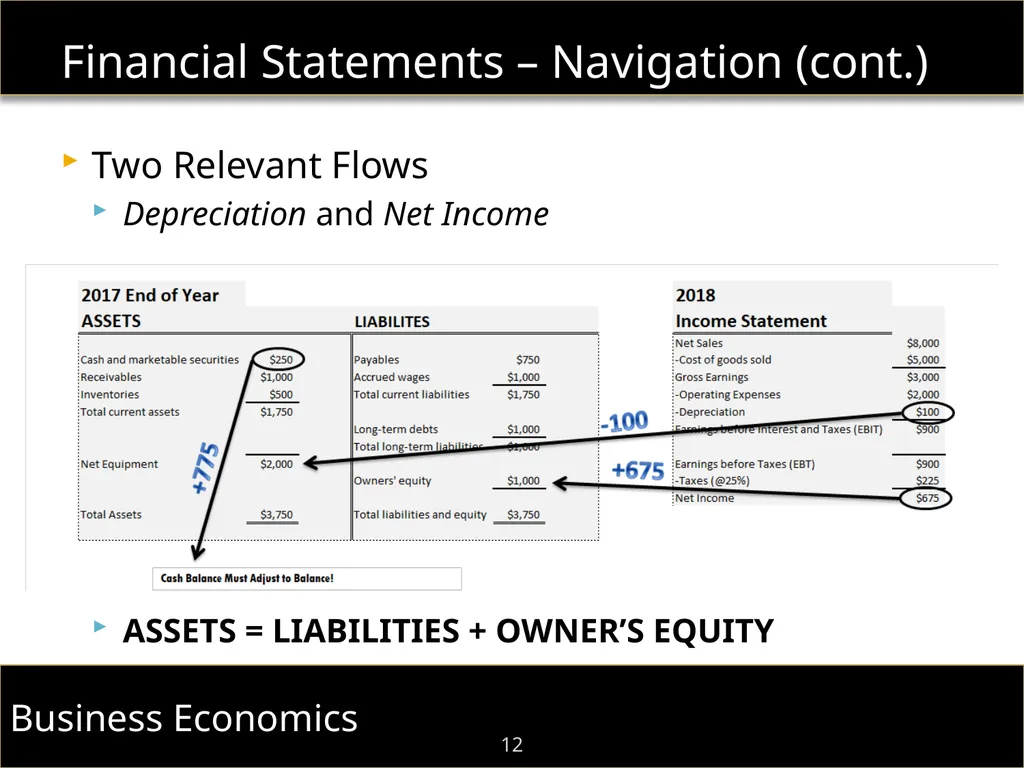
slide12. Financial Statements – Navigation (cont.) 12 Two Relevant Flows
Depreciation and Net Income
ASSETS = LIABILITIES + OWNER’S EQUITY<br>
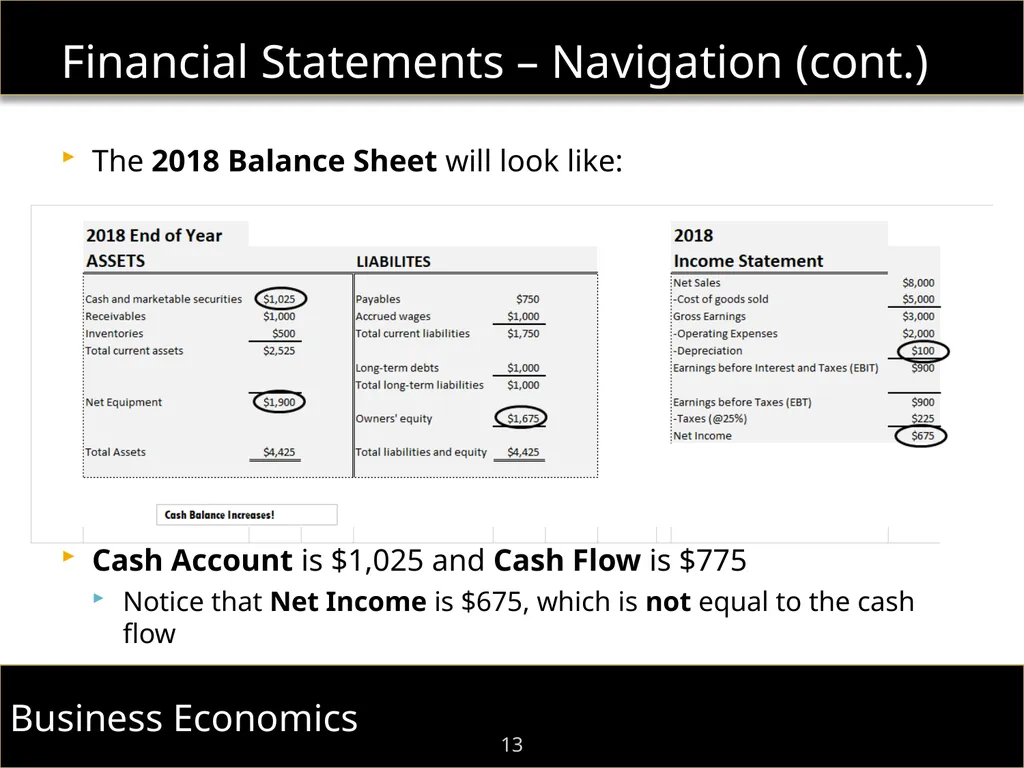
slide13. Financial Statements – Navigation (cont.) 13 The 2018 Balance Sheet will look like:
Cash Account is $1,025 and Cash Flow is $775
Notice that Net Income is $675, which is not equal to the cash flow<br>
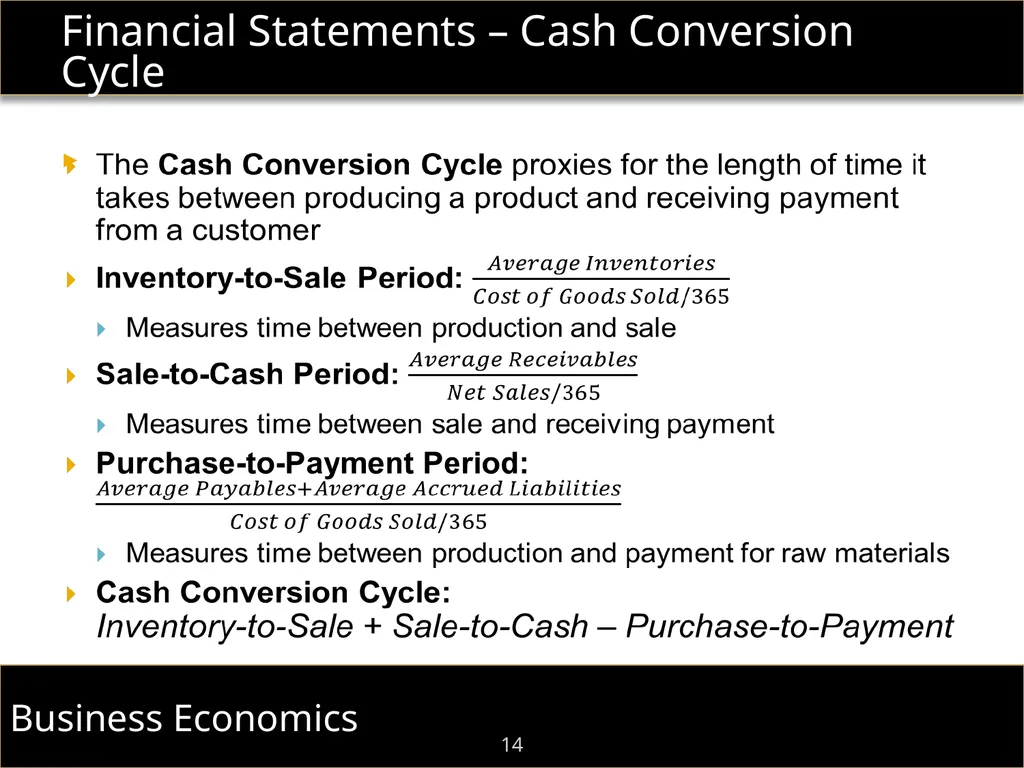
slide14. Financial Statements – Cash Conversion Cycle 14<br>
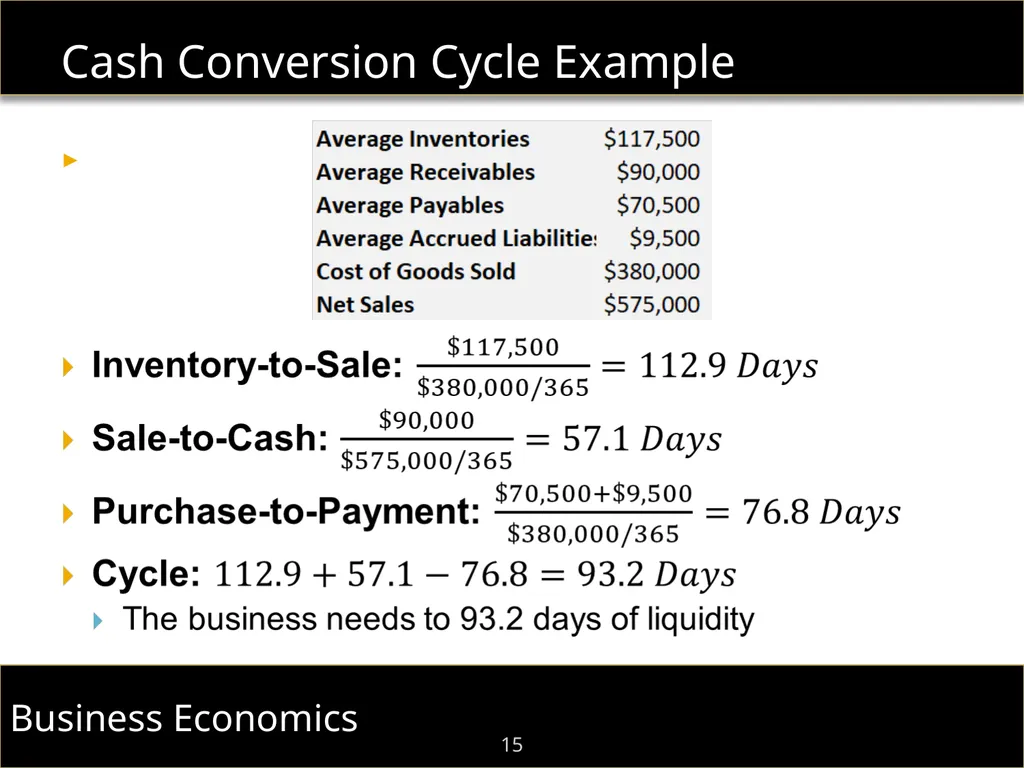
slide15. Cash Conversion Cycle Example 15<br>
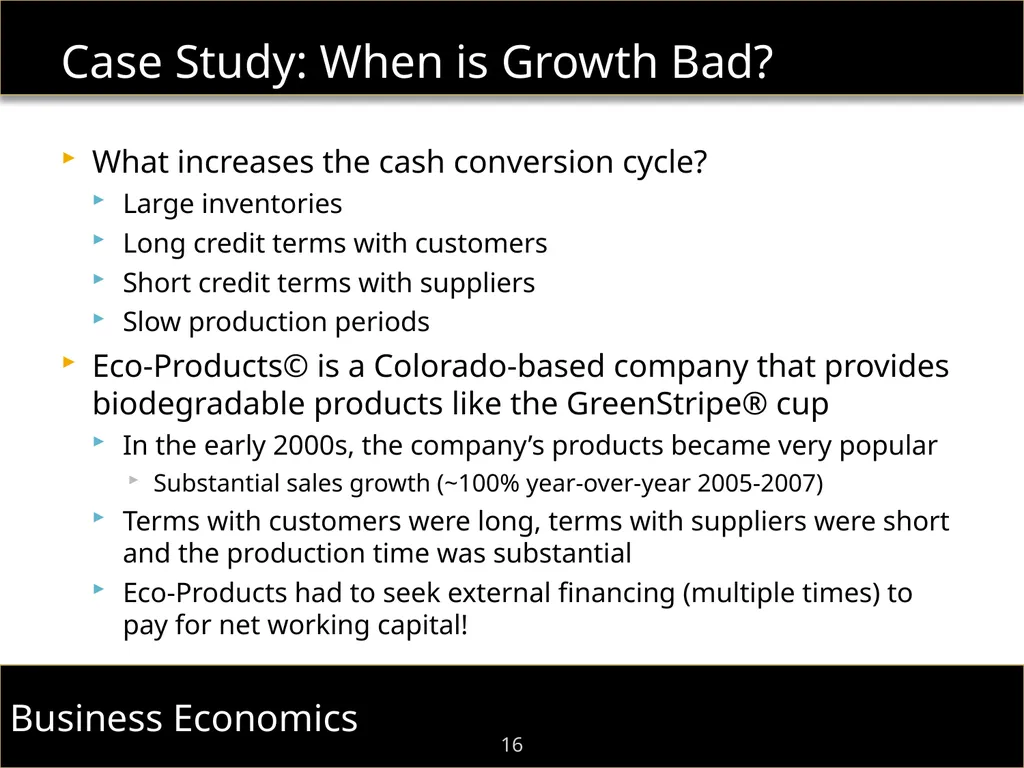
slide16. Case Study: When is Growth Bad? 16 What increases the cash conversion cycle?
Large inventories
Long credit terms with customers
Short credit terms with suppliers
Slow production periods
Eco-Products© is a Colorado-based company that provides biodegradable products like the GreenStripe® cup
In the early 2000s, the company’s products became very popular
Substantial sales growth (~100% year-over-year 2005-2007)
Terms with customers were long, terms with suppliers were short and the production time was substantial
Eco-Products had to seek external financing (multiple times) to pay for net working capital!<br>
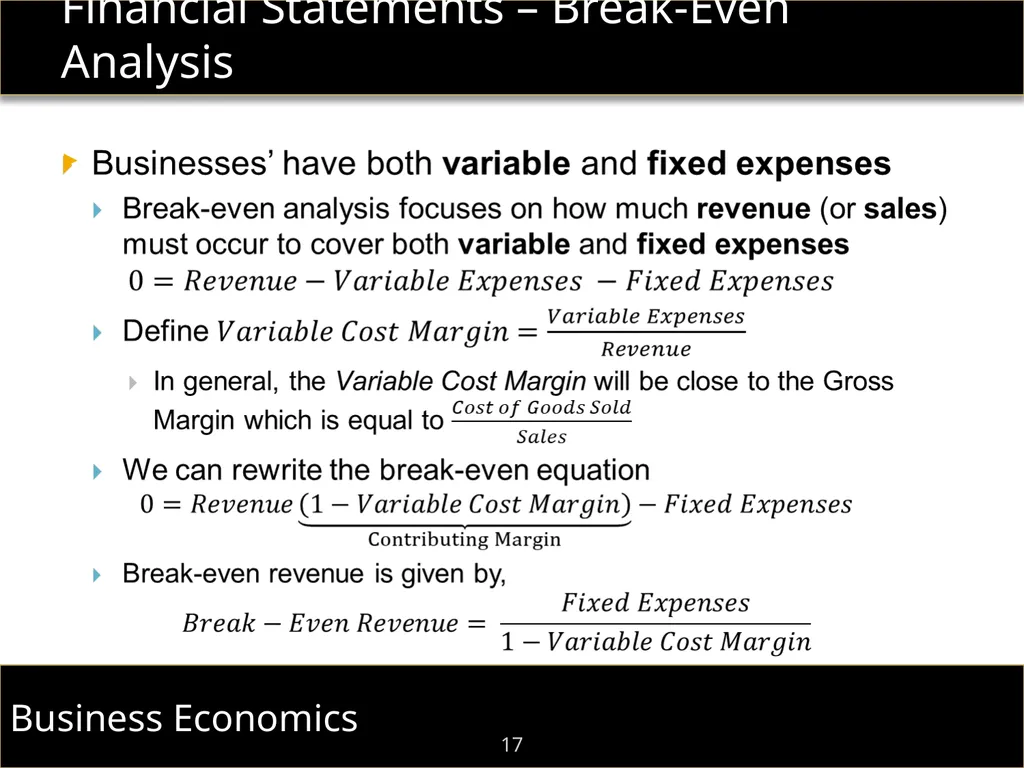
slide17. Financial Statements – Break-Even Analysis 17<br>
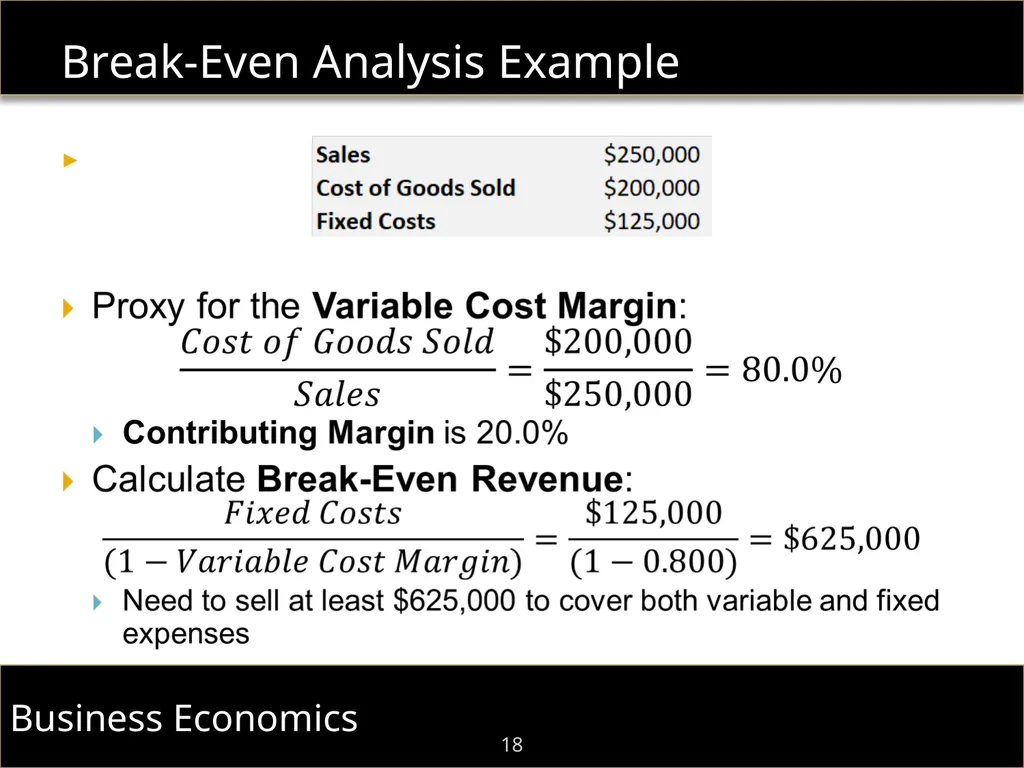
slide18. Break-Even Analysis Example 18<br>
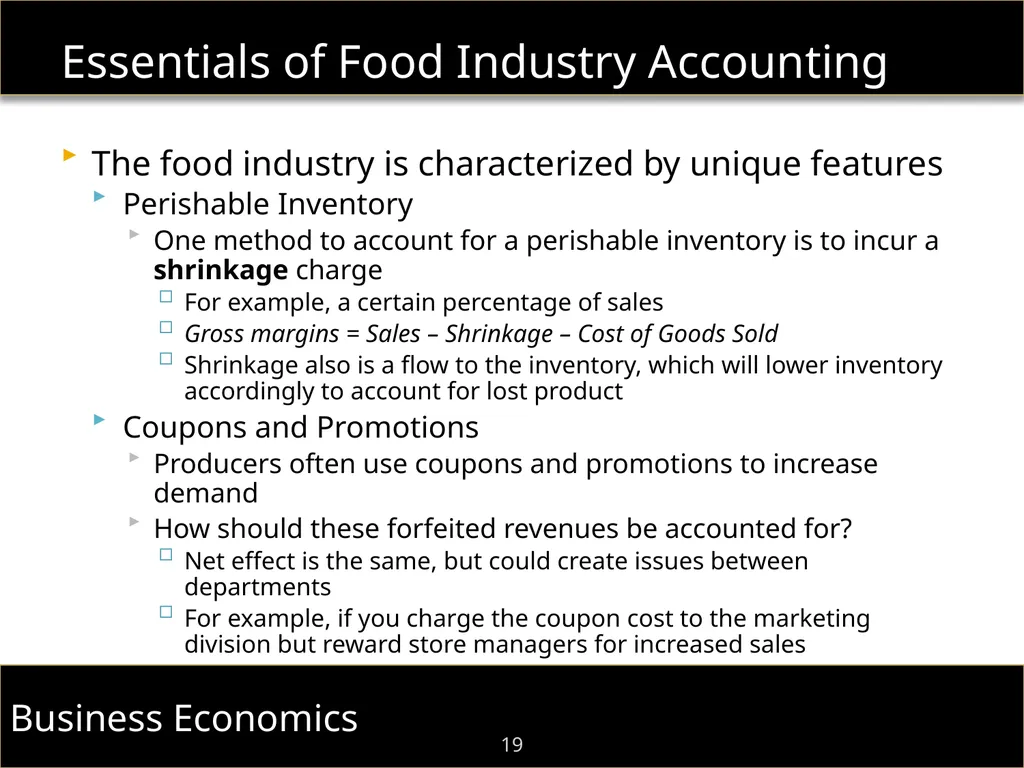
slide19. Essentials of Food Industry Accounting 19 The food industry is characterized by unique features
Perishable Inventory
One method to account for a perishable inventory is to incur a shrinkage charge
For example, a certain percentage of sales
Gross margins = Sales – Shrinkage – Cost of Goods Sold
Shrinkage also is a flow to the inventory, which will lower inventory accordingly to account for lost product
Coupons and Promotions
Producers often use coupons and promotions to increase demand
How should these forfeited revenues be accounted for?
Net effect is the same, but could create issues between departments
For example, if you charge the coupon cost to the marketing division but reward store managers for increased sales<br>
slide20. 2 Minute Break 20 Quick Break<br>
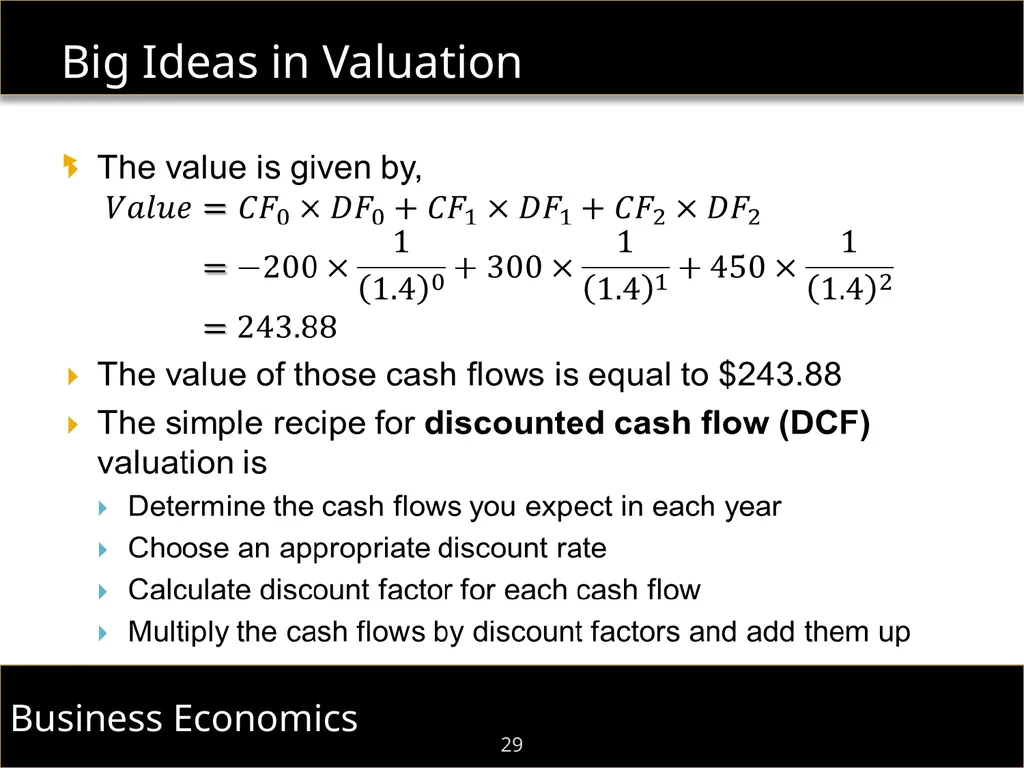
slide21. Big Ideas in Valuation 21 The value of a project is determined by how much cash it generates (in-flows) and how much cash it uses (out-flows)
A positive cash flow cash it generates
A negative cash flow cash it uses
The process of valuation is summing all these positive and negative cash flows
But how do we compare cash flows that happen tomorrow to those that happen in three years?
What about safe cash flows versus risky cash flows?<br>
slide22. Big Ideas in Valuation 22 You will each earn $100 for sitting through my session today (not really)
Let’s play “Would You Rather”
Would you rather get the $100 at the conclusion of today’s session or in the mail ten years from today?
Why?
“A dollar today is worth more than a dollar tomorrow”
Time Value of Money!
When a cash flow occurs affects the value of a project!<br>
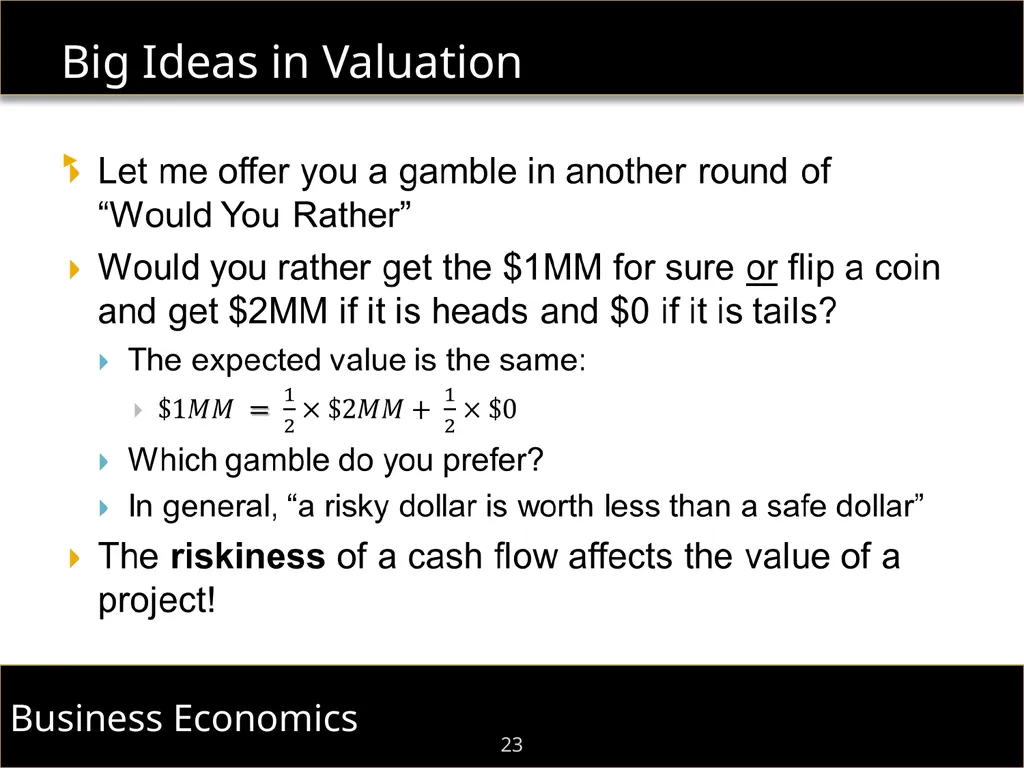
slide23. Big Ideas in Valuation 23<br>
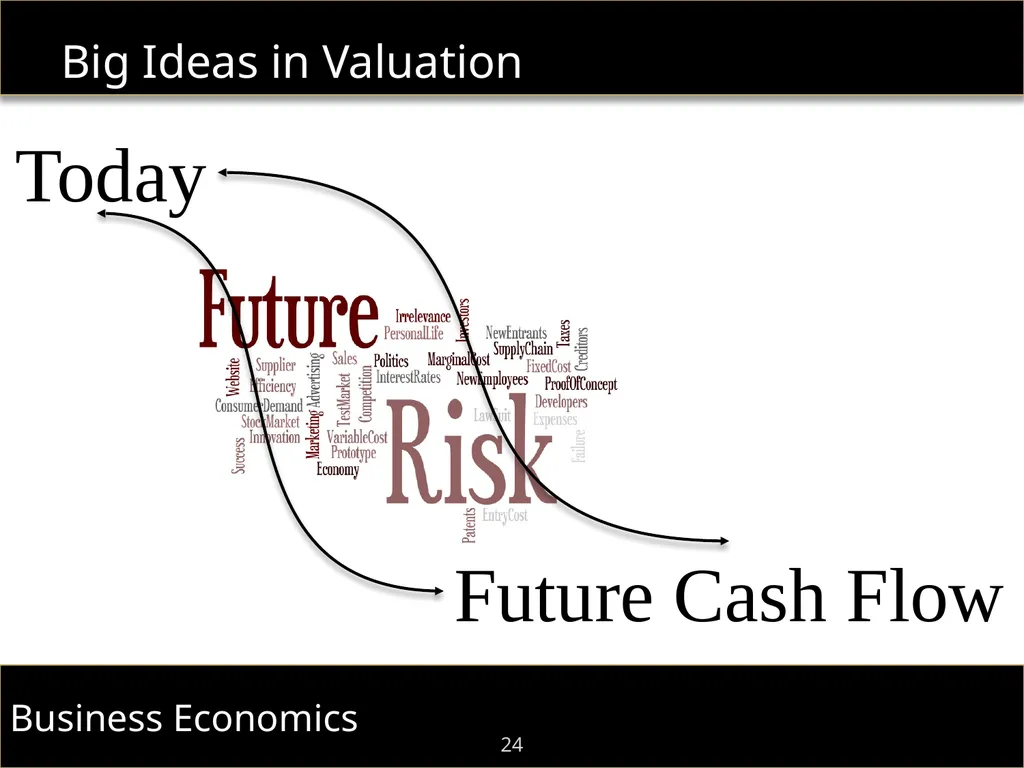
slide24. Big Ideas in Valuation 24 Today Future Cash Flow<br>
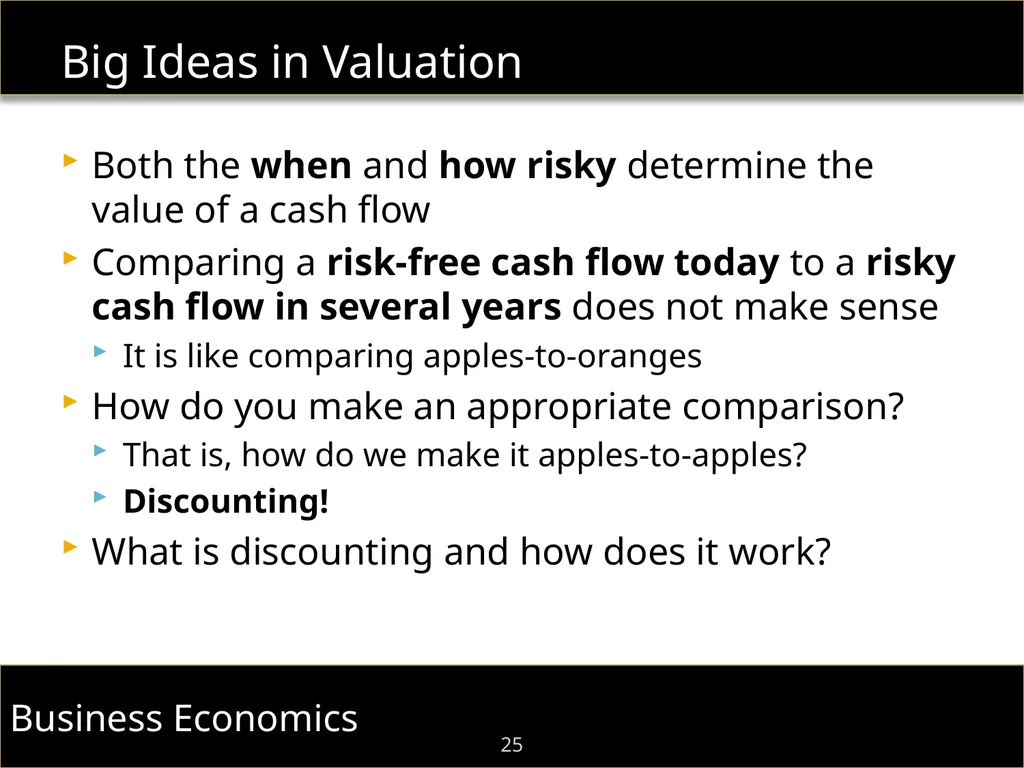
slide25. Big Ideas in Valuation 25 Both the when and how risky determine the value of a cash flow
Comparing a risk-free cash flow today to a risky cash flow in several years does not make sense
It is like comparing apples-to-oranges
How do you make an appropriate comparison?
That is, how do we make it apples-to-apples?
Discounting!
What is discounting and how does it work?<br>
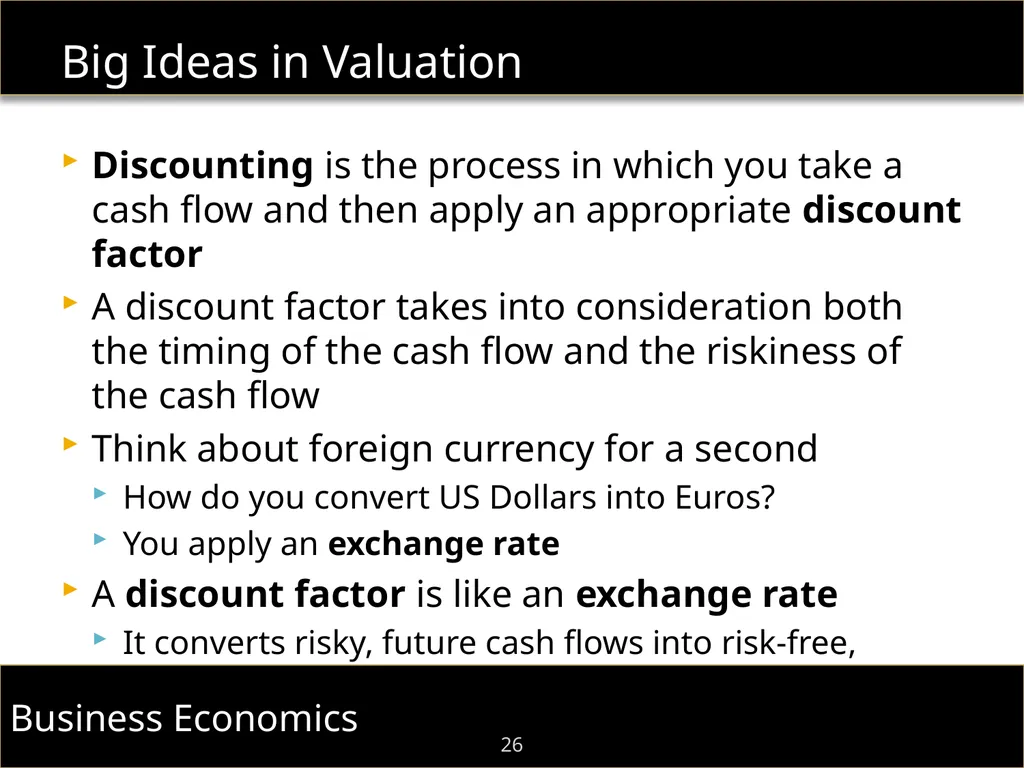
slide26. Big Ideas in Valuation 26 Discounting is the process in which you take a cash flow and then apply an appropriate discount factor
A discount factor takes into consideration both the timing of the cash flow and the riskiness of the cash flow
Think about foreign currency for a second
How do you convert US Dollars into Euros?
You apply an exchange rate
A discount factor is like an exchange rate
It converts risky, future cash flows into risk-free, current cash flows<br>
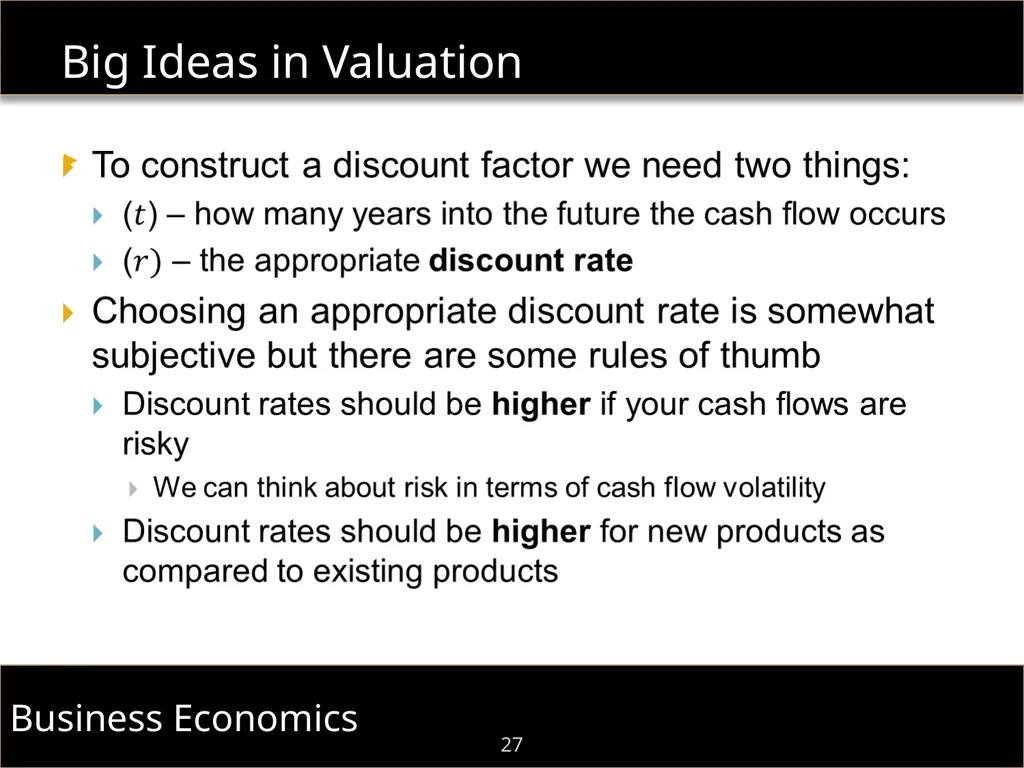
slide27. Big Ideas in Valuation 27<br>
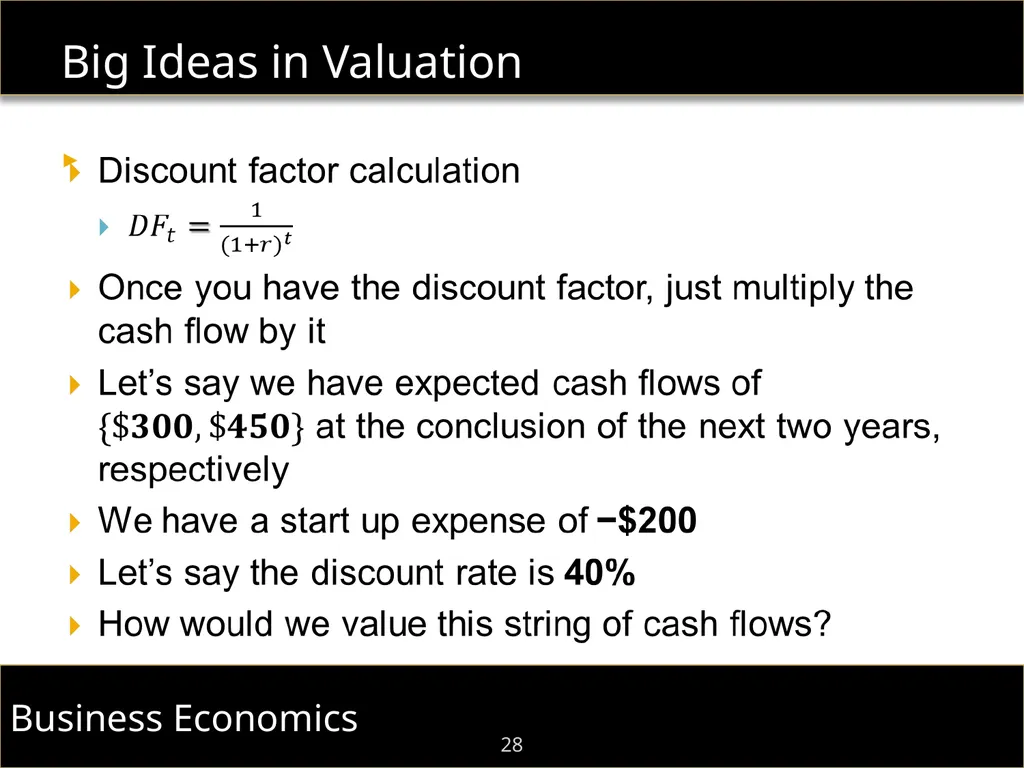
slide28. Big Ideas in Valuation 28<br>
slide29. Big Ideas in Valuation 29<br>
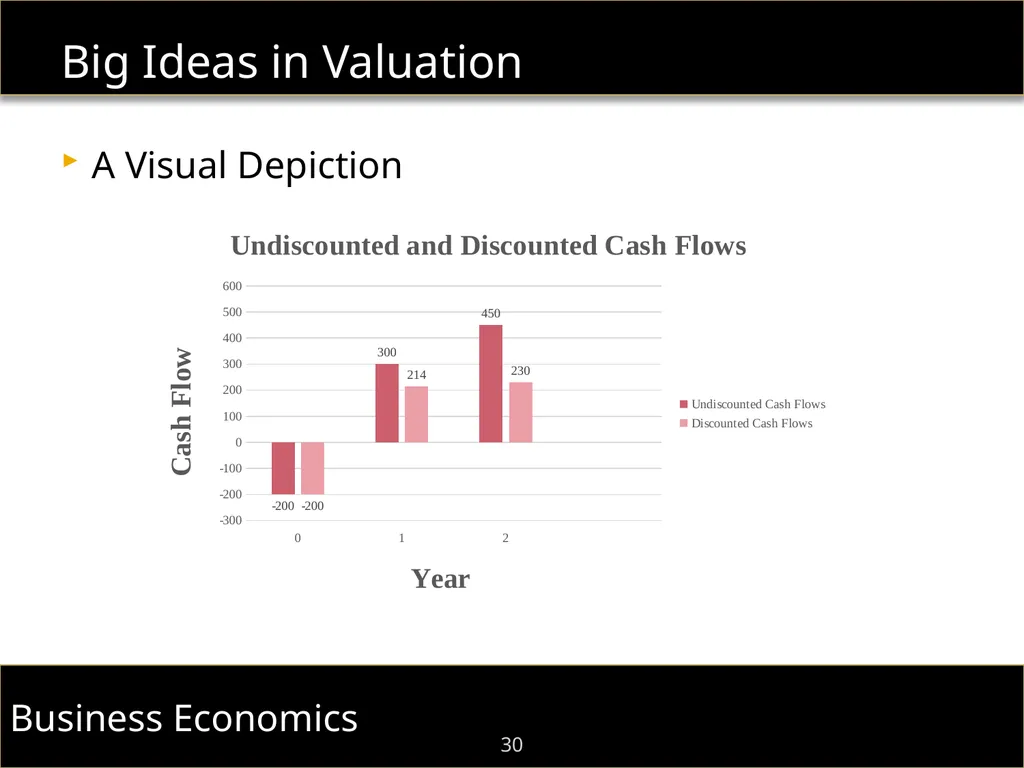
slide30. Big Ideas in Valuation 30 A Visual Depiction<br>
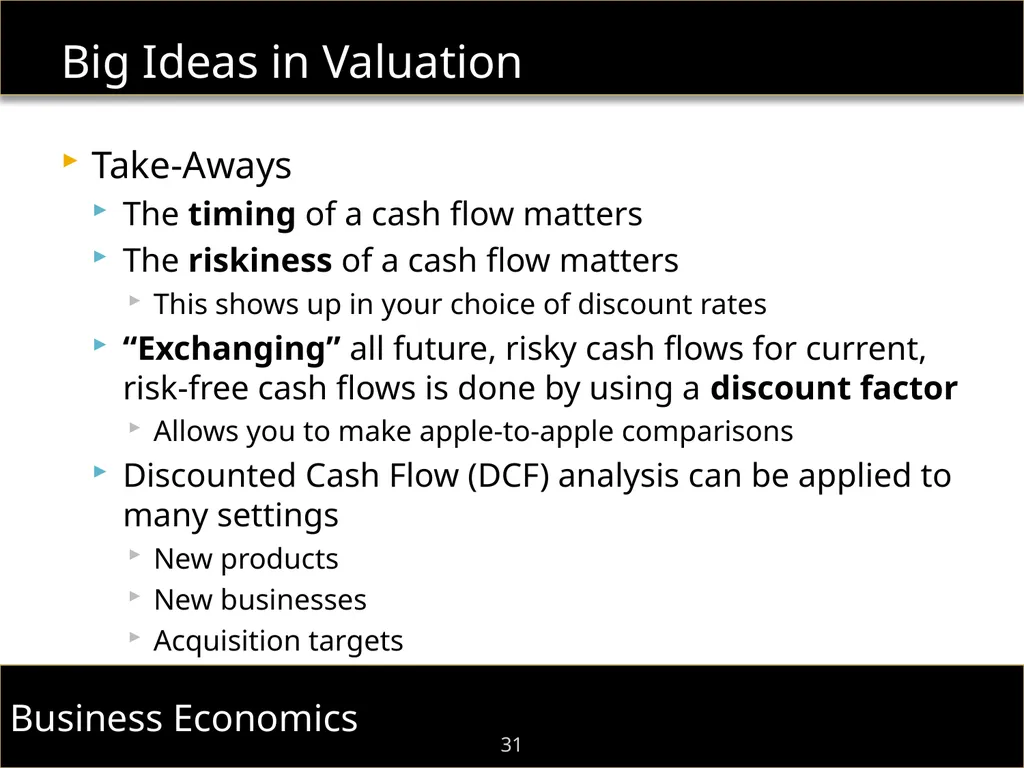
slide31. Big Ideas in Valuation 31 Take-Aways
The timing of a cash flow matters
The riskiness of a cash flow matters
This shows up in your choice of discount rates
“Exchanging” all future, risky cash flows for current, risk-free cash flows is done by using a discount factor
Allows you to make apple-to-apple comparisons
Discounted Cash Flow (DCF) analysis can be applied to many settings
New products
New businesses
Acquisition targets<br>
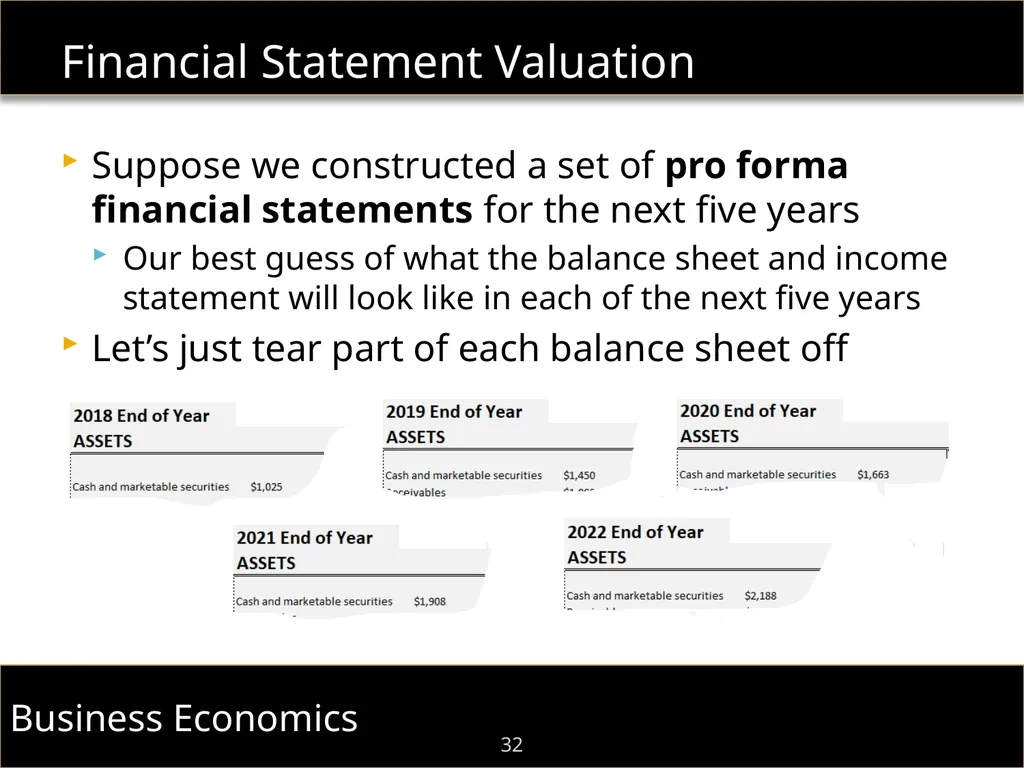
slide32. Financial Statement Valuation 32 Suppose we constructed a set of pro forma financial statements for the next five years
Our best guess of what the balance sheet and income statement will look like in each of the next five years
Let’s just tear part of each balance sheet off<br>
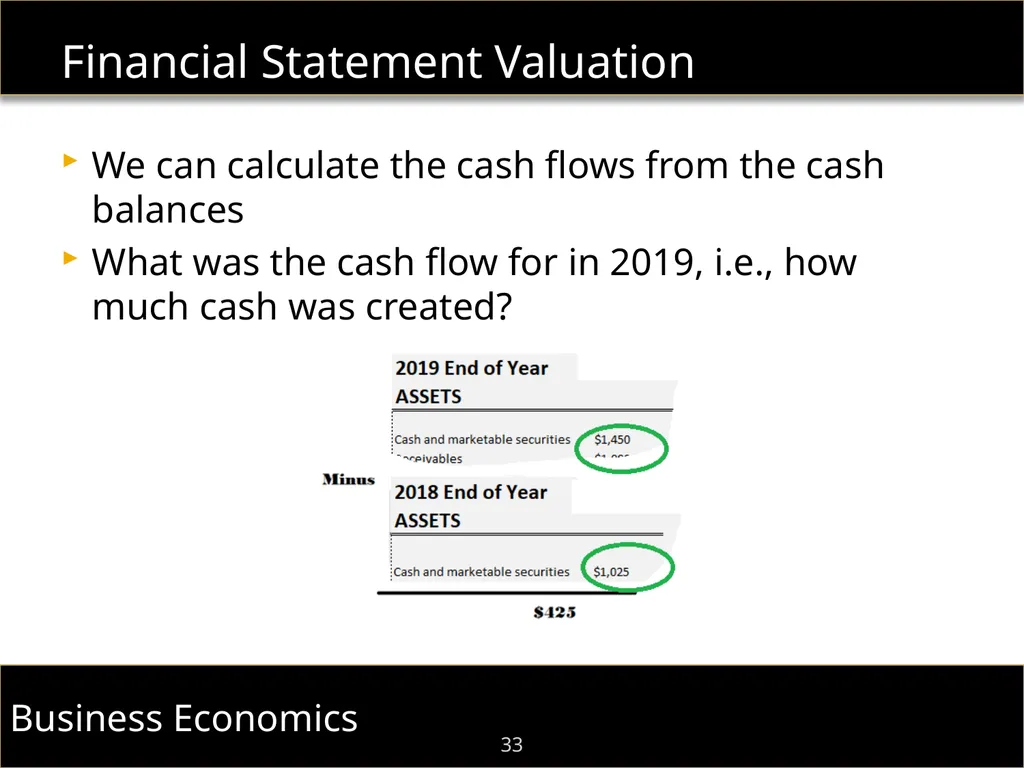
slide33. Financial Statement Valuation 33 We can calculate the cash flows from the cash balances
What was the cash flow for in 2019, i.e., how much cash was created?<br>
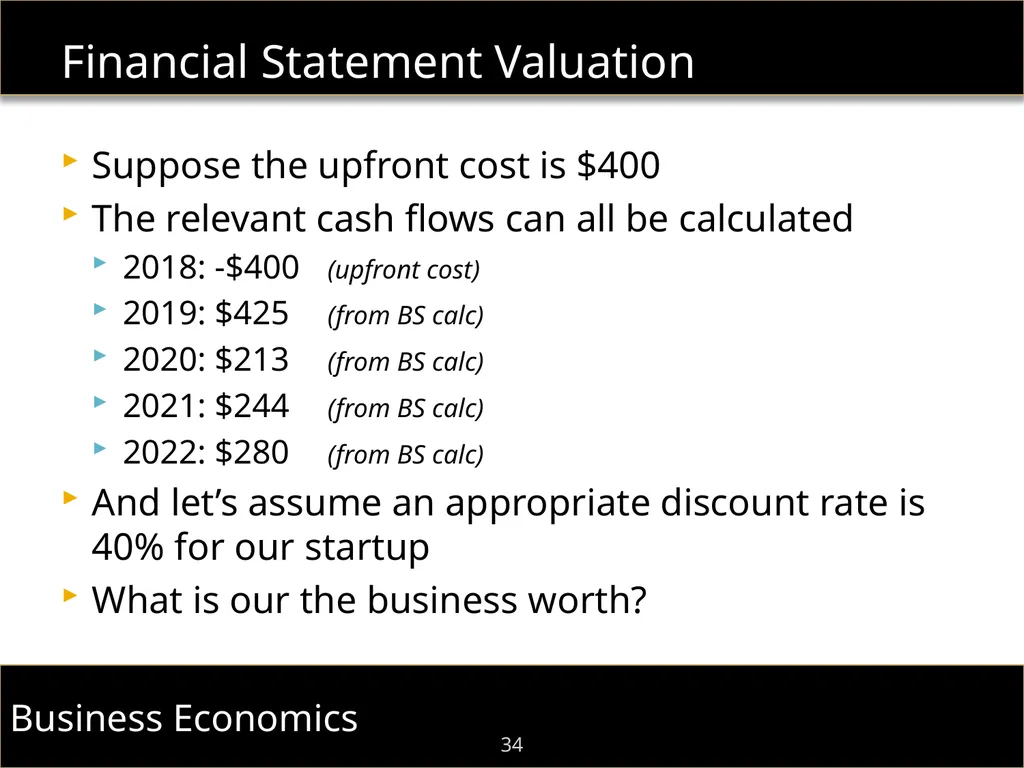
slide34. Financial Statement Valuation 34 Suppose the upfront cost is $400
The relevant cash flows can all be calculated
2018: -$400 (upfront cost)
2019: $425 (from BS calc)
2020: $213 (from BS calc)
2021: $244 (from BS calc)
2022: $280 (from BS calc)
And let’s assume an appropriate discount rate is 40% for our startup
What is our the business worth?<br>
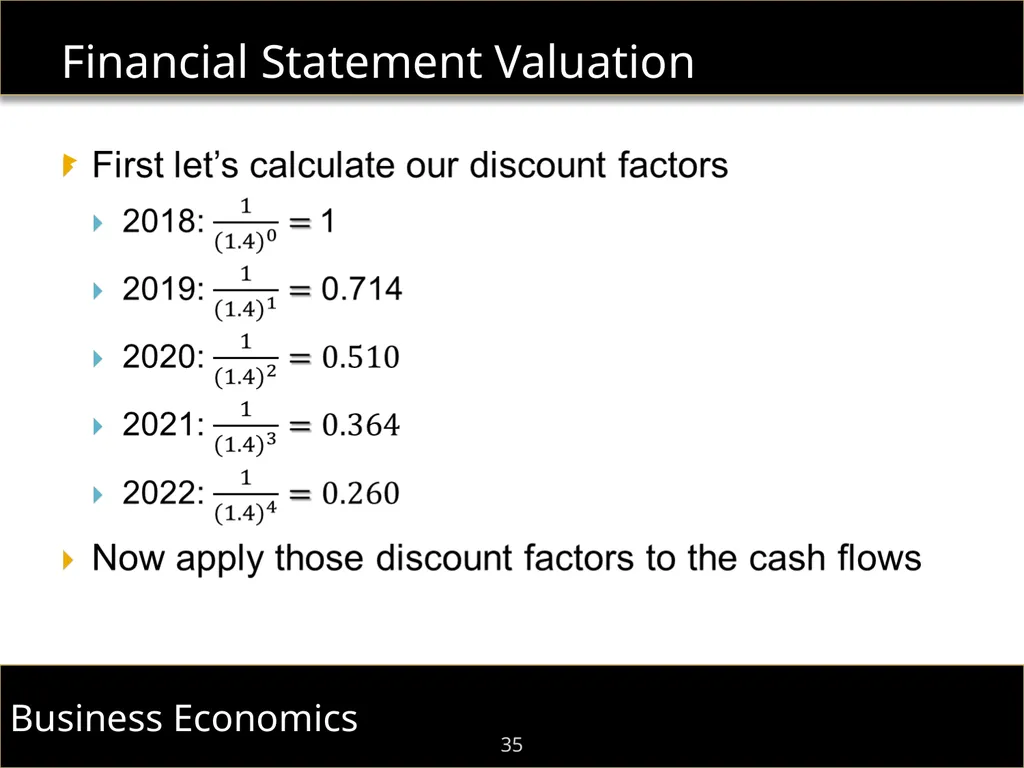
slide35. Financial Statement Valuation 35<br>
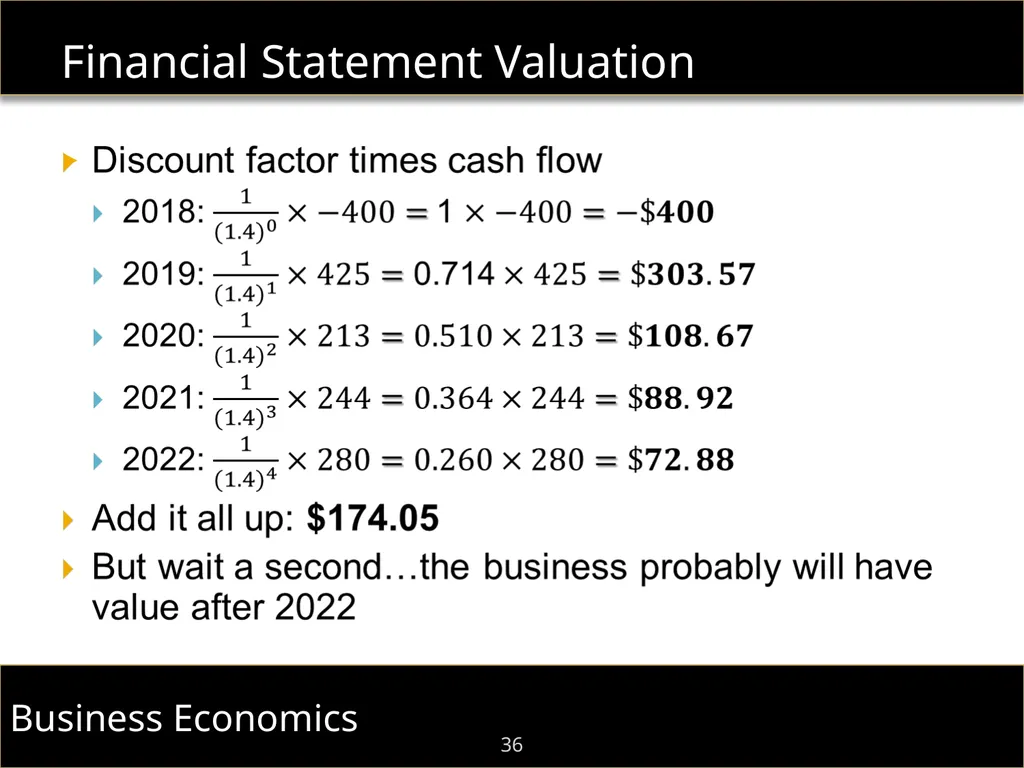
slide36. Financial Statement Valuation 36<br>
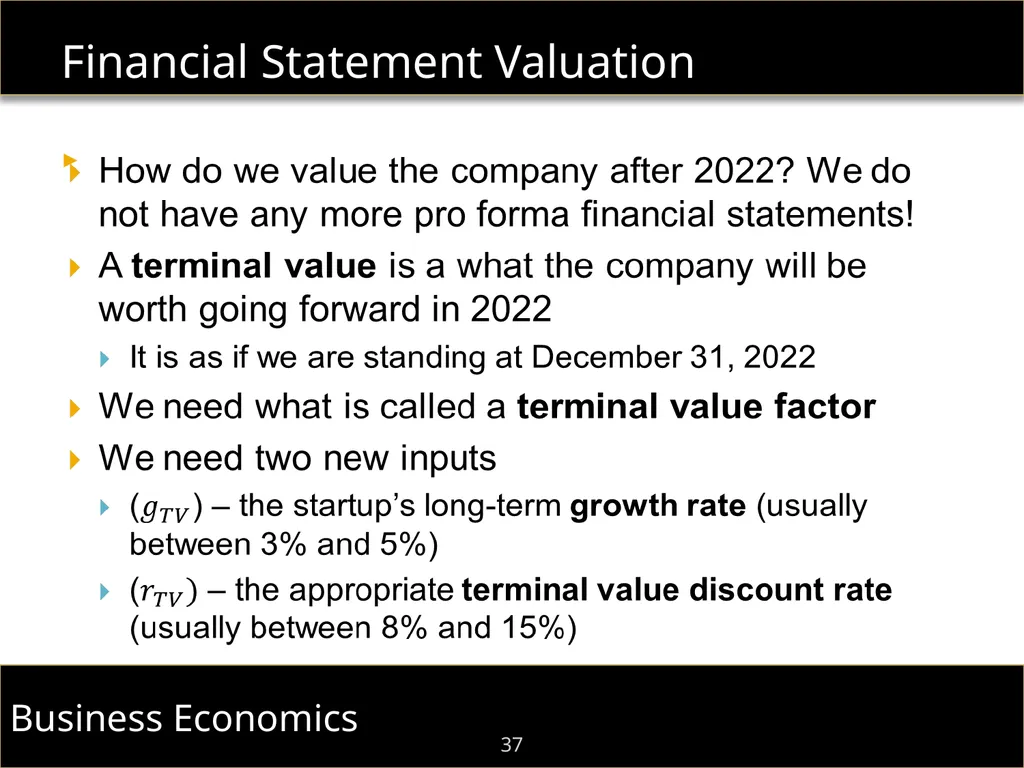
slide37. Financial Statement Valuation 37<br>
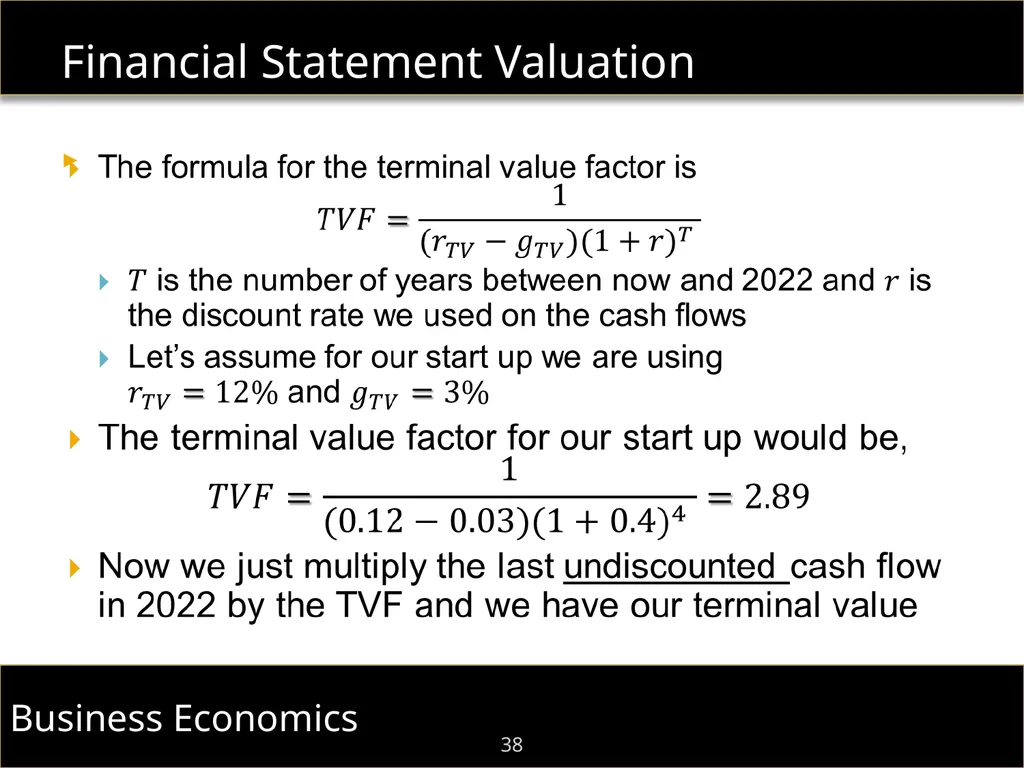
slide38. Financial Statement Valuation 38<br>
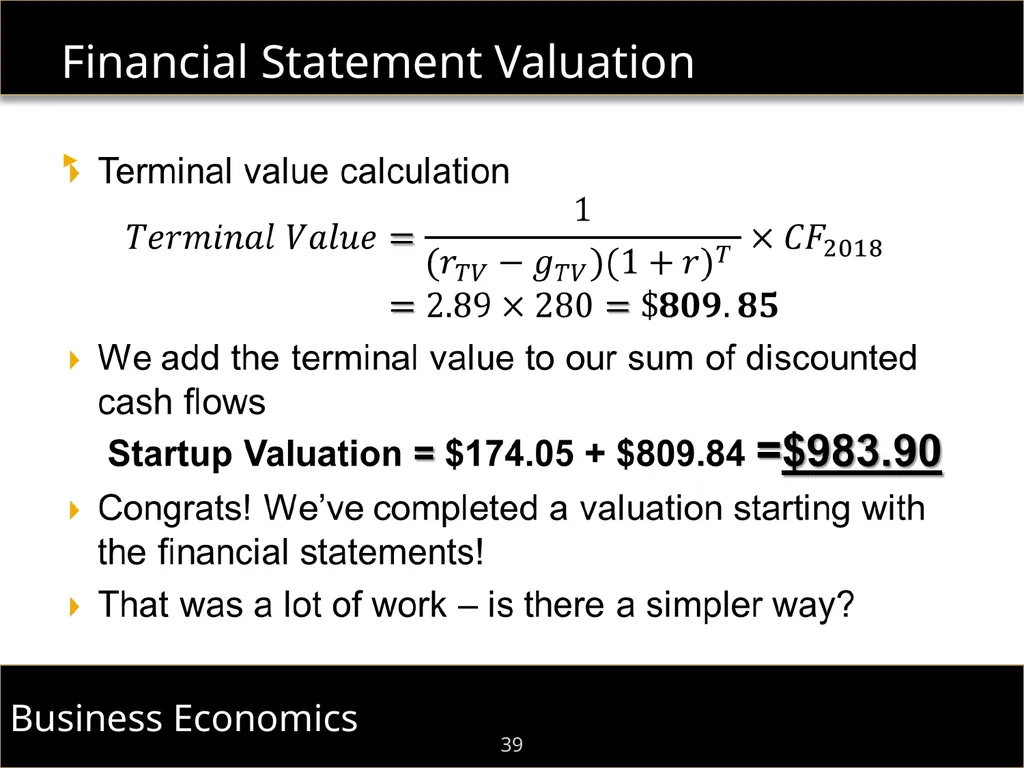
slide39. Financial Statement Valuation 39<br>
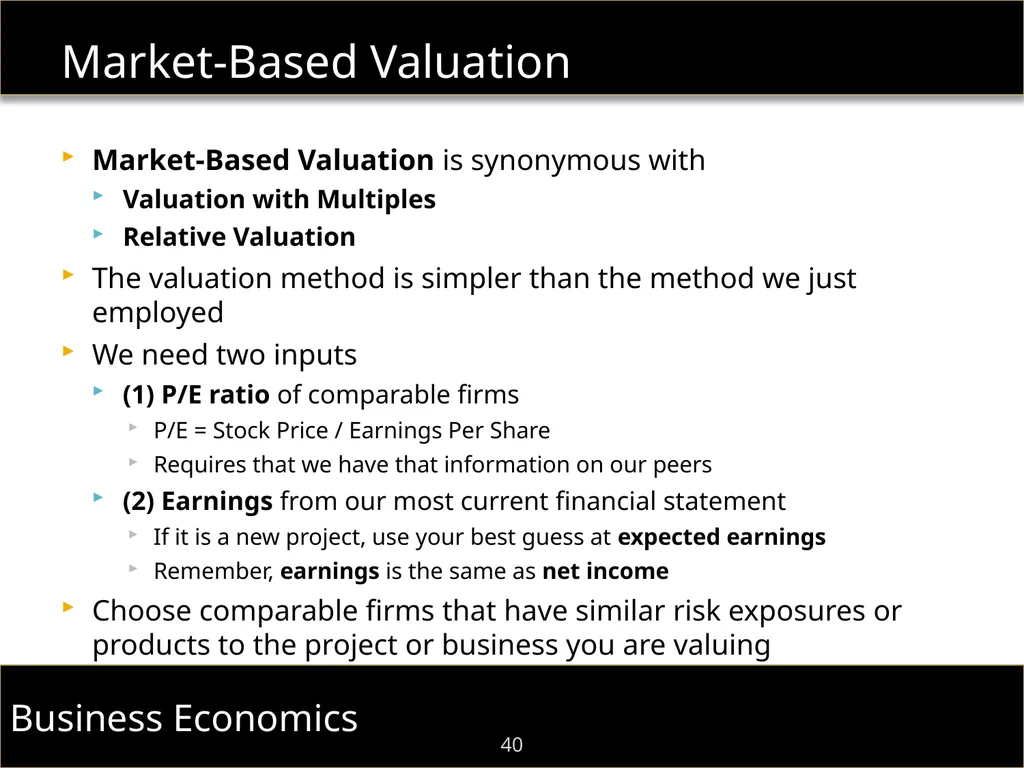
slide40. Market-Based Valuation 40 Market-Based Valuation is synonymous with
Valuation with Multiples
Relative Valuation
The valuation method is simpler than the method we just employed
We need two inputs
(1) P/E ratio of comparable firms
P/E = Stock Price / Earnings Per Share
Requires that we have that information on our peers
(2) Earnings from our most current financial statement
If it is a new project, use your best guess at expected earnings
Remember, earnings is the same as net income
Choose comparable firms that have similar risk exposures or products to the project or business you are valuing<br>
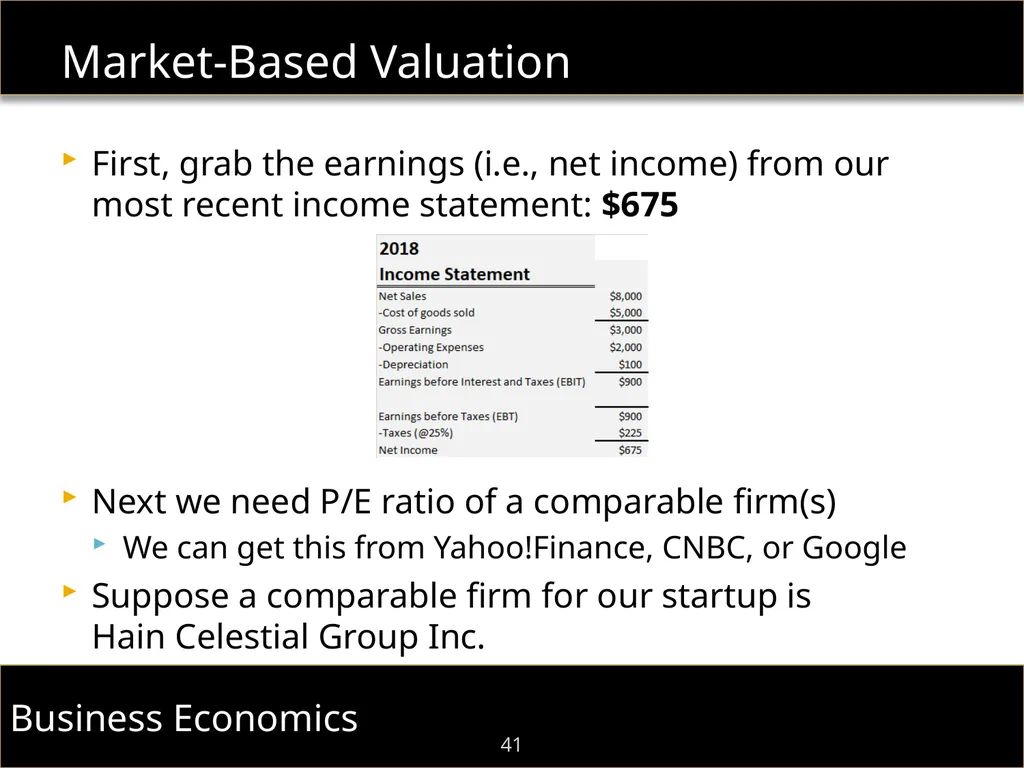
slide41. Market-Based Valuation 41 First, grab the earnings (i.e., net income) from our most recent income statement: $675
Next we need P/E ratio of a comparable firm(s)
We can get this from Yahoo!Finance, CNBC, or Google
Suppose a comparable firm for our startup is Hain Celestial Group Inc.<br>
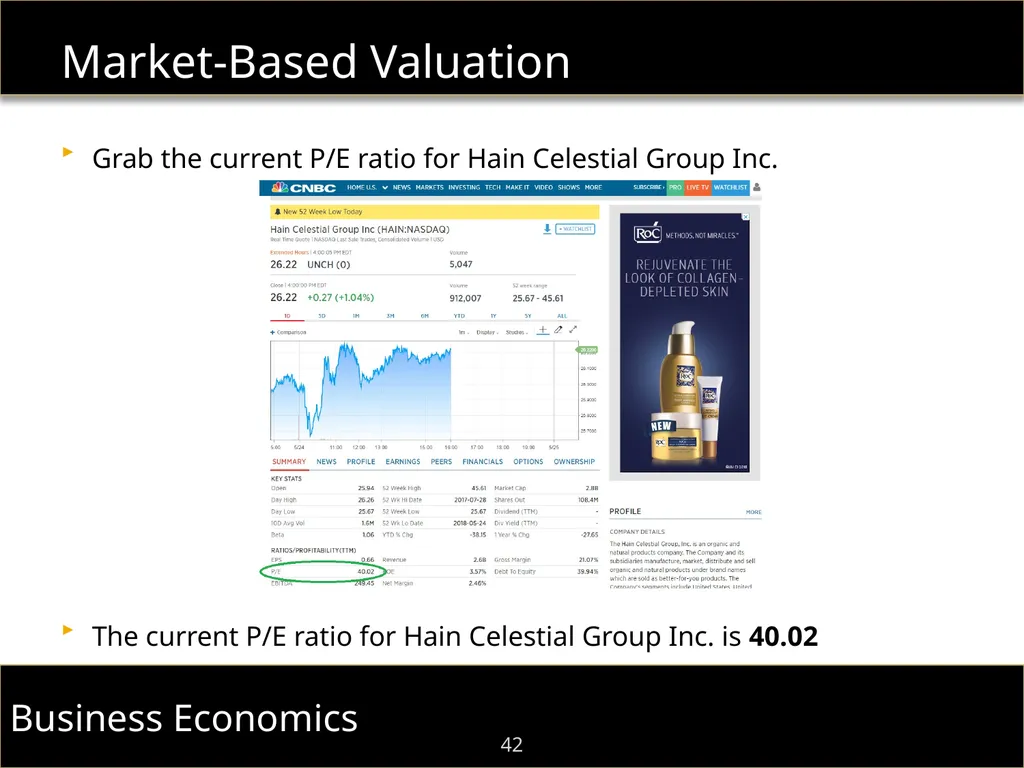
slide42. Market-Based Valuation 42 Grab the current P/E ratio for Hain Celestial Group Inc.
The current P/E ratio for Hain Celestial Group Inc. is 40.02<br>
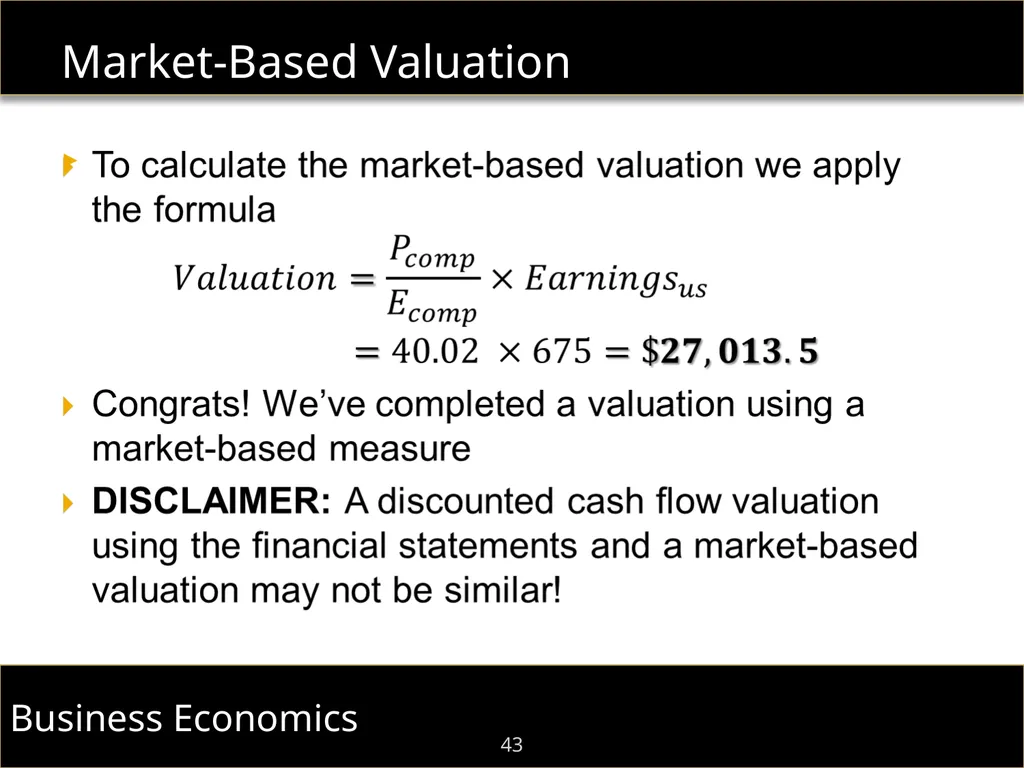
slide43. Market-Based Valuation 43<br>
slide44. Valuation 44 Take-Aways
There is little “objective” truth when doing a valuation
Lots and lots of assumptions
Different valuation models will yield different results
It is not about the end result as much as it about the process
It is useful to know what drives a valuation
Cash flow generation
Discount rates
Growth rates
Comparable firms<br>
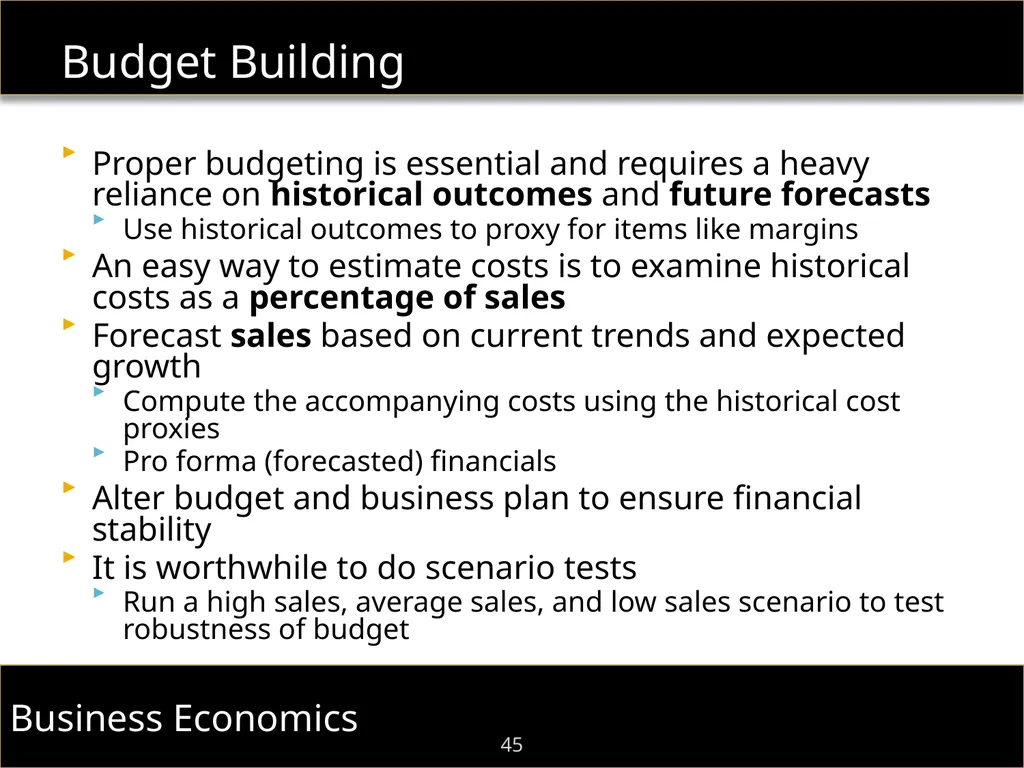
slide45. Budget Building 45 Proper budgeting is essential and requires a heavy reliance on historical outcomes and future forecasts
Use historical outcomes to proxy for items like margins
An easy way to estimate costs is to examine historical costs as a percentage of sales
Forecast sales based on current trends and expected growth
Compute the accompanying costs using the historical cost proxies
Pro forma (forecasted) financials
Alter budget and business plan to ensure financial stability
It is worthwhile to do scenario tests
Run a high sales, average sales, and low sales scenario to test robustness of budget<br>
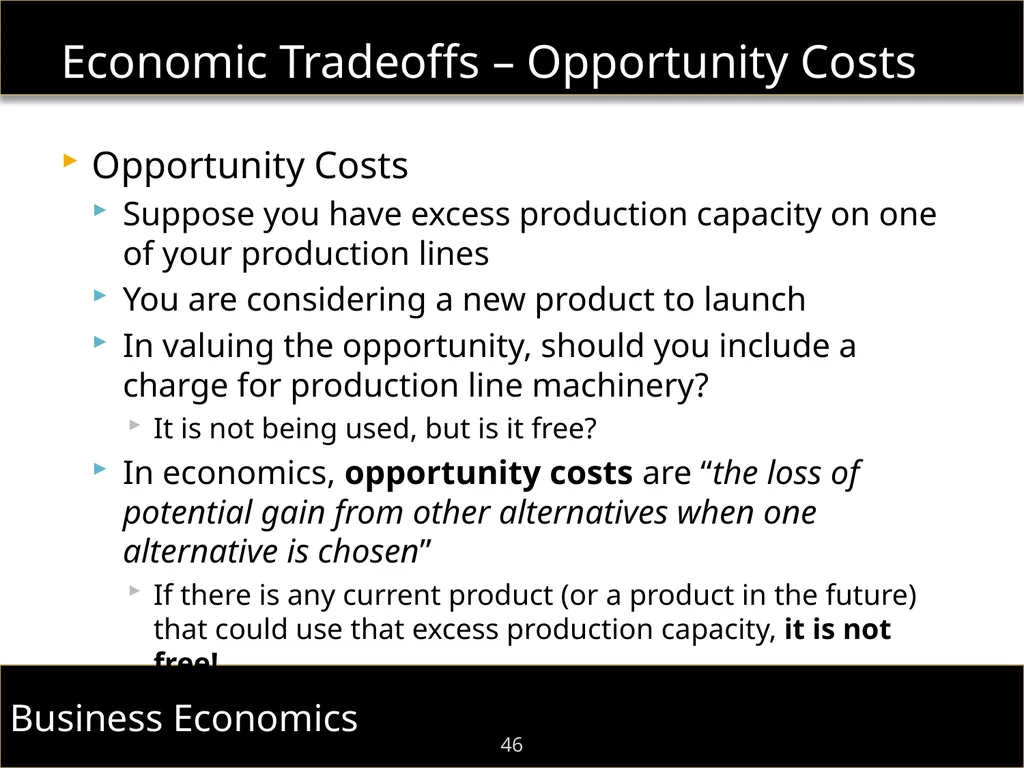
slide46. Economic Tradeoffs – Opportunity Costs 46 Opportunity Costs
Suppose you have excess production capacity on one of your production lines
You are considering a new product to launch
In valuing the opportunity, should you include a charge for production line machinery?
It is not being used, but is it free?
In economics, opportunity costs are “the loss of potential gain from other alternatives when one alternative is chosen”
If there is any current product (or a product in the future) that could use that excess production capacity, it is not free!<br>
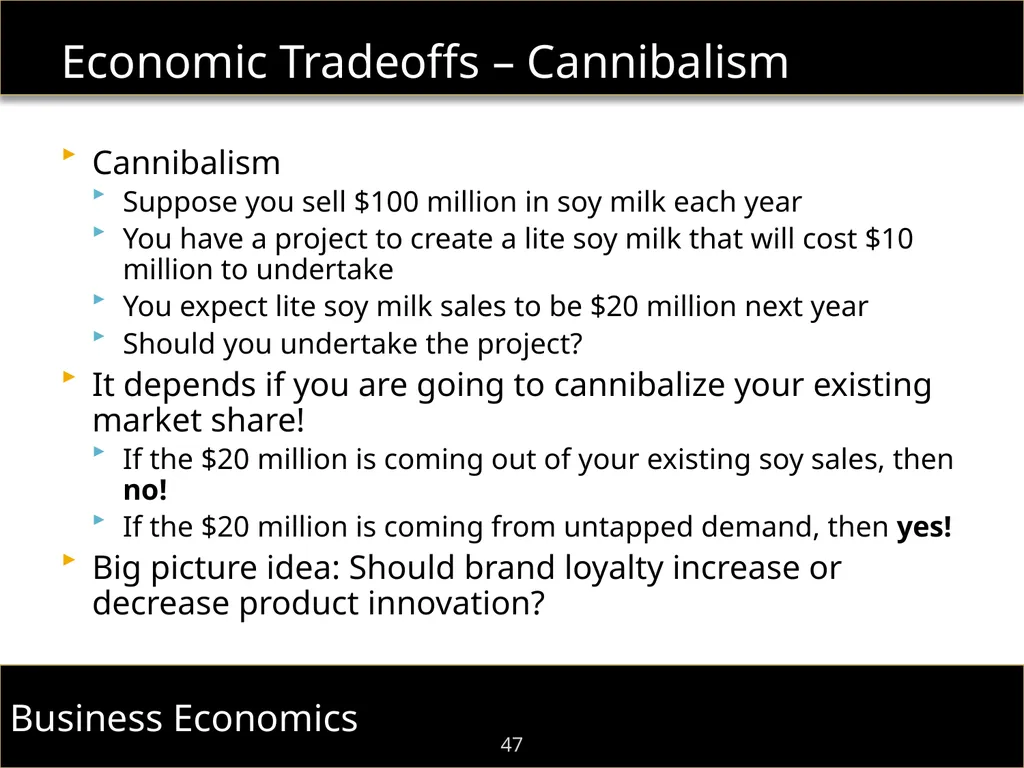
slide47. Economic Tradeoffs – Cannibalism 47 Cannibalism
Suppose you sell $100 million in soy milk each year
You have a project to create a lite soy milk that will cost $10 million to undertake
You expect lite soy milk sales to be $20 million next year
Should you undertake the project?
It depends if you are going to cannibalize your existing market share!
If the $20 million is coming out of your existing soy sales, then no!
If the $20 million is coming from untapped demand, then yes!
Big picture idea: Should brand loyalty increase or decrease product innovation?<br>
slide48. Any Final Questions? 48 Questions? Comments?<br>
slide2. A Few Words About Me 2 Assistant Professor of Finance
Leeds School of Business, University of Colorado at Boulder
Finance PhD (UCLA 2013), Economics MA (UCLA 2010)
CFA Charterholder
Research in Venture Financing, Exchange Traded Funds (ETFs), and Impact Investing & Socially Responsible Investing (SRI)<br>
slide3. Outline of Today 3 Financial Statements
Income Statement, Balance Sheet, and Statement of Cash Flows
Cash Conversion Cycle
Break-Even Analysis
Essentials of Food Industry Accounting
Big Ideas in Valuation – How much is it worth?
Valuation Methods
Budget Building
Economic Tradeoffs<br>
slide4. Financial Statements – Some Lingo 4 Stocks and Flows
Stocks represent the total quantity of something
Sometimes referred to as accounts
Flows represent the change in quantity over some time interval
You deposit $1,000 monthly into your checking account
After one year, the stock of the account is $12,000 and the monthly flow is $1,000
Assets
Financial, physical, and intangible items owned by a business
Financial: cash and marketable securities
Physical: inventories
Intangible: trademarks and patents
Depreciation is the decay of an asset’s value
The total value of an asset is a stock variable
The change in value of an asset is a flow variable<br>
slide5. Financial Statements – Some More Lingo 5 Liabilities
Items owed by a business
Payables: amount owed to suppliers
Accrued Wages: amount owed to employees
Debt: amount owed to lenders
The total value of a liability is a stock variable
The change in value of a liability is a flow variable
Owner’s Equity
Residual Claim that absorbs the value of the business after all liabilities are taken care of
Amount owed to owners
Total value is a stock and the change is a flow<br>
slide6. Financial Statements – The Statements 6 Balance Sheet
A snapshot of a business’s stocks on a specified date (fiscal year end or quarterly)
All assets appear on the left side of the sheet
All liabilities and owner’s equity appear on the right
Accounting Identity: TOTAL ASSETS = TOTAL LIABILITIES + OWNER’S EQUITY
The identity is useful in navigating or forecasting financial statements
Income Statement
A snapshot of a business’s flows during a specified period
For example, Cost of Goods Sold is a flow that affects the value of the Inventory stock<br>
slide7. Financial Statements – Balance Sheet 7<br>
slide8. Financial Statements – Net Income 8 Net Income is the bottom line on the income statement
Sometimes referred to as earnings
Reduced Form:
Start with Sales
Subtract Cost of Goods Sold
Subtract Marketing Expenses
Subtract Administration Expenses
Subtract Taxes
The leftover amount is the Net Income
Net Income can be negative
Net Income is a Flow that affects Owner’s Equity<br>
slide9. Financial Statements – Net Income vs. Cash 9 Net Income is often referred to as accounting profit
Importantly, net income is not equal to the cash profit
Accrual Accounting
Net income is an accrual accounting measure
Accrual accounting is: “earned”, “incurred”, and “recognized”
Accrual accounting is not: “realized”
Accrual accounting makes sense in some regards
Depreciation allows smoothing of asset value erosion over time
Accrual accounting distorts cash flows
Not all sources/uses of cash show up on the income statement
For example, Capital Expenditures
Not all items on the income statement are sources/uses of cash
For example, Depreciation<br>
slide10. Financial Statements – Statement of Cash Flows 10 Statement of Cash Flows
This financial statement is the “anti-accrual-accounting” statement
Statement shows how changes in balance sheet stocks (i.e., flows) affect the cash account (or stock) and the cash flow
Statement of Cash Flows is broken into three categories
Operating Cash Flow
Measures the cash flow generated by the business‘s normal operations
Investing Cash Flow
Measures the cash flow generated by investments in capital assets, subsidiaries, and financial markets
Financing Cash Flow
Measures the cash flow generated by financing activities like issuing new equity or repaying loans<br>
slide11. Financial Statements – Navigation 11 Consider the following 2017 Balance Sheet and 2018 Income Statement
Suppose all stock variables are fixed except for Cash, Net Equipment, and Owner’s Equity
What will the 2018 Balance Sheet look like?<br>
slide12. Financial Statements – Navigation (cont.) 12 Two Relevant Flows
Depreciation and Net Income
ASSETS = LIABILITIES + OWNER’S EQUITY<br>
slide13. Financial Statements – Navigation (cont.) 13 The 2018 Balance Sheet will look like:
Cash Account is $1,025 and Cash Flow is $775
Notice that Net Income is $675, which is not equal to the cash flow<br>
slide14. Financial Statements – Cash Conversion Cycle 14<br>
slide15. Cash Conversion Cycle Example 15<br>
slide16. Case Study: When is Growth Bad? 16 What increases the cash conversion cycle?
Large inventories
Long credit terms with customers
Short credit terms with suppliers
Slow production periods
Eco-Products© is a Colorado-based company that provides biodegradable products like the GreenStripe® cup
In the early 2000s, the company’s products became very popular
Substantial sales growth (~100% year-over-year 2005-2007)
Terms with customers were long, terms with suppliers were short and the production time was substantial
Eco-Products had to seek external financing (multiple times) to pay for net working capital!<br>
slide17. Financial Statements – Break-Even Analysis 17<br>
slide18. Break-Even Analysis Example 18<br>
slide19. Essentials of Food Industry Accounting 19 The food industry is characterized by unique features
Perishable Inventory
One method to account for a perishable inventory is to incur a shrinkage charge
For example, a certain percentage of sales
Gross margins = Sales – Shrinkage – Cost of Goods Sold
Shrinkage also is a flow to the inventory, which will lower inventory accordingly to account for lost product
Coupons and Promotions
Producers often use coupons and promotions to increase demand
How should these forfeited revenues be accounted for?
Net effect is the same, but could create issues between departments
For example, if you charge the coupon cost to the marketing division but reward store managers for increased sales<br>
slide20. 2 Minute Break 20 Quick Break<br>
slide21. Big Ideas in Valuation 21 The value of a project is determined by how much cash it generates (in-flows) and how much cash it uses (out-flows)
A positive cash flow cash it generates
A negative cash flow cash it uses
The process of valuation is summing all these positive and negative cash flows
But how do we compare cash flows that happen tomorrow to those that happen in three years?
What about safe cash flows versus risky cash flows?<br>
slide22. Big Ideas in Valuation 22 You will each earn $100 for sitting through my session today (not really)
Let’s play “Would You Rather”
Would you rather get the $100 at the conclusion of today’s session or in the mail ten years from today?
Why?
“A dollar today is worth more than a dollar tomorrow”
Time Value of Money!
When a cash flow occurs affects the value of a project!<br>
slide23. Big Ideas in Valuation 23<br>
slide24. Big Ideas in Valuation 24 Today Future Cash Flow<br>
slide25. Big Ideas in Valuation 25 Both the when and how risky determine the value of a cash flow
Comparing a risk-free cash flow today to a risky cash flow in several years does not make sense
It is like comparing apples-to-oranges
How do you make an appropriate comparison?
That is, how do we make it apples-to-apples?
Discounting!
What is discounting and how does it work?<br>
slide26. Big Ideas in Valuation 26 Discounting is the process in which you take a cash flow and then apply an appropriate discount factor
A discount factor takes into consideration both the timing of the cash flow and the riskiness of the cash flow
Think about foreign currency for a second
How do you convert US Dollars into Euros?
You apply an exchange rate
A discount factor is like an exchange rate
It converts risky, future cash flows into risk-free, current cash flows<br>
slide27. Big Ideas in Valuation 27<br>
slide28. Big Ideas in Valuation 28<br>
slide29. Big Ideas in Valuation 29<br>
slide30. Big Ideas in Valuation 30 A Visual Depiction<br>
slide31. Big Ideas in Valuation 31 Take-Aways
The timing of a cash flow matters
The riskiness of a cash flow matters
This shows up in your choice of discount rates
“Exchanging” all future, risky cash flows for current, risk-free cash flows is done by using a discount factor
Allows you to make apple-to-apple comparisons
Discounted Cash Flow (DCF) analysis can be applied to many settings
New products
New businesses
Acquisition targets<br>
slide32. Financial Statement Valuation 32 Suppose we constructed a set of pro forma financial statements for the next five years
Our best guess of what the balance sheet and income statement will look like in each of the next five years
Let’s just tear part of each balance sheet off<br>
slide33. Financial Statement Valuation 33 We can calculate the cash flows from the cash balances
What was the cash flow for in 2019, i.e., how much cash was created?<br>
slide34. Financial Statement Valuation 34 Suppose the upfront cost is $400
The relevant cash flows can all be calculated
2018: -$400 (upfront cost)
2019: $425 (from BS calc)
2020: $213 (from BS calc)
2021: $244 (from BS calc)
2022: $280 (from BS calc)
And let’s assume an appropriate discount rate is 40% for our startup
What is our the business worth?<br>
slide35. Financial Statement Valuation 35<br>
slide36. Financial Statement Valuation 36<br>
slide37. Financial Statement Valuation 37<br>
slide38. Financial Statement Valuation 38<br>
slide39. Financial Statement Valuation 39<br>
slide40. Market-Based Valuation 40 Market-Based Valuation is synonymous with
Valuation with Multiples
Relative Valuation
The valuation method is simpler than the method we just employed
We need two inputs
(1) P/E ratio of comparable firms
P/E = Stock Price / Earnings Per Share
Requires that we have that information on our peers
(2) Earnings from our most current financial statement
If it is a new project, use your best guess at expected earnings
Remember, earnings is the same as net income
Choose comparable firms that have similar risk exposures or products to the project or business you are valuing<br>
slide41. Market-Based Valuation 41 First, grab the earnings (i.e., net income) from our most recent income statement: $675
Next we need P/E ratio of a comparable firm(s)
We can get this from Yahoo!Finance, CNBC, or Google
Suppose a comparable firm for our startup is Hain Celestial Group Inc.<br>
slide42. Market-Based Valuation 42 Grab the current P/E ratio for Hain Celestial Group Inc.
The current P/E ratio for Hain Celestial Group Inc. is 40.02<br>
slide43. Market-Based Valuation 43<br>
slide44. Valuation 44 Take-Aways
There is little “objective” truth when doing a valuation
Lots and lots of assumptions
Different valuation models will yield different results
It is not about the end result as much as it about the process
It is useful to know what drives a valuation
Cash flow generation
Discount rates
Growth rates
Comparable firms<br>
slide45. Budget Building 45 Proper budgeting is essential and requires a heavy reliance on historical outcomes and future forecasts
Use historical outcomes to proxy for items like margins
An easy way to estimate costs is to examine historical costs as a percentage of sales
Forecast sales based on current trends and expected growth
Compute the accompanying costs using the historical cost proxies
Pro forma (forecasted) financials
Alter budget and business plan to ensure financial stability
It is worthwhile to do scenario tests
Run a high sales, average sales, and low sales scenario to test robustness of budget<br>
slide46. Economic Tradeoffs – Opportunity Costs 46 Opportunity Costs
Suppose you have excess production capacity on one of your production lines
You are considering a new product to launch
In valuing the opportunity, should you include a charge for production line machinery?
It is not being used, but is it free?
In economics, opportunity costs are “the loss of potential gain from other alternatives when one alternative is chosen”
If there is any current product (or a product in the future) that could use that excess production capacity, it is not free!<br>
slide47. Economic Tradeoffs – Cannibalism 47 Cannibalism
Suppose you sell $100 million in soy milk each year
You have a project to create a lite soy milk that will cost $10 million to undertake
You expect lite soy milk sales to be $20 million next year
Should you undertake the project?
It depends if you are going to cannibalize your existing market share!
If the $20 million is coming out of your existing soy sales, then no!
If the $20 million is coming from untapped demand, then yes!
Big picture idea: Should brand loyalty increase or decrease product innovation?<br>
slide48. Any Final Questions? 48 Questions? Comments?<br>