
FEBRUARY 2018 ANALYSIS INTO THE IMPACT OF


Description: FEBRUARY 2018 ANALYSIS INTO THE IMPACT OF IMPLEMENTED AND PROPOSED POLICY INTERVENTIONS AGENDA 2 CREDIT MARKET OVERVIEW INTRODUCTION TO RESEARCH AND METHODOLOGY BORROWERS ELIGIBLE FOR DEBT INTERVENTION South Africa is unique in that the NCR
Related Topics
Download Presentation
"FEBRUARY 2018 ANALYSIS INTO THE IMPACT OF" is the property of its rightful owner. Permission is granted to download and print the materials on this website for personal, non-commercial use only, and to display it on your personal computer provided you do not modify the materials and that you retain all copyright notices contained in the materials. By downloading content from our website, you accept the terms of this agreement.
Presentation Transcript
slide1. FEBRUARY 2018 ANALYSIS INTO THE IMPACT OF IMPLEMENTED
AND PROPOSED POLICY INTERVENTIONS<br>
slide2. AGENDA 2 CREDIT MARKET OVERVIEW INTRODUCTION TO RESEARCH AND METHODOLOGY BORROWERS ELIGIBLE FOR DEBT INTERVENTION<br>
slide3. South Africa is unique in that the NCR publishes data for the entire consumer credit sector. This data includes data on the gross debtors book, arrears levels, new loans granted and active borrowers 3 GROSS DEBTORS BOOK: 2017 Q3
R BILLIONS CREDIT
FACILITIES MORTGAGES UNSECURED
CREDIT SECURED
CREDIT SHORT-TERM
CREDIT 895 398 224 166 3 ACCOUNTS (000’S) 5 278 1 730 3 640 25 403 953 Source: NCR Consumer credit report. Developmental credit is provided by lenders registered as developmental credit providers and includes educational loans; small business loans; loans for the acquisition, rehabilitation, building or expansion of low income housing 42 DEVELOPMENTAL
CREDIT 1 167 % 90 days or more in arrears 3% 14% 14% 18% 3% 12% 3% 17% 4% 9% 4% 13% 91 DAYS + OTHER<br>
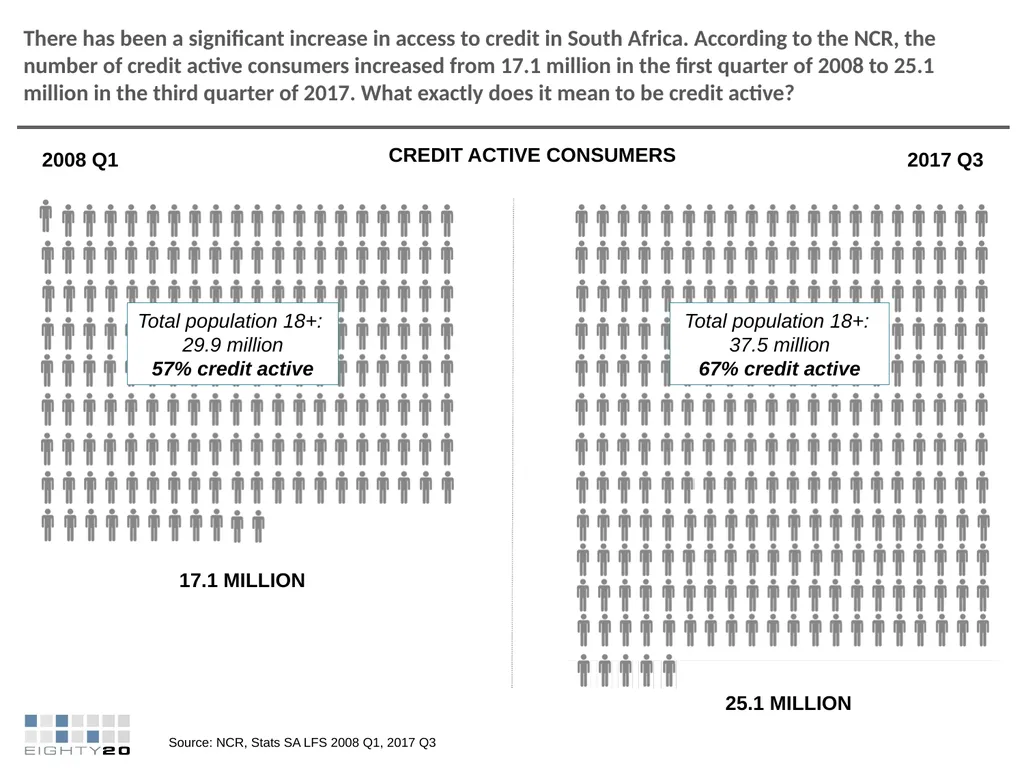
slide4. There has been a significant increase in access to credit in South Africa. According to the NCR, the number of credit active consumers increased from 17.1 million in the first quarter of 2008 to 25.1 million in the third quarter of 2017. What exactly does it mean to be credit active? CREDIT ACTIVE CONSUMERS 2008 Q1 2017 Q3 17.1 MILLION 25.1 MILLION Total population 18+:
29.9 million
57% credit active Total population 18+:
37.5 million
67% credit active Source: NCR, Stats SA LFS 2008 Q1, 2017 Q3<br>
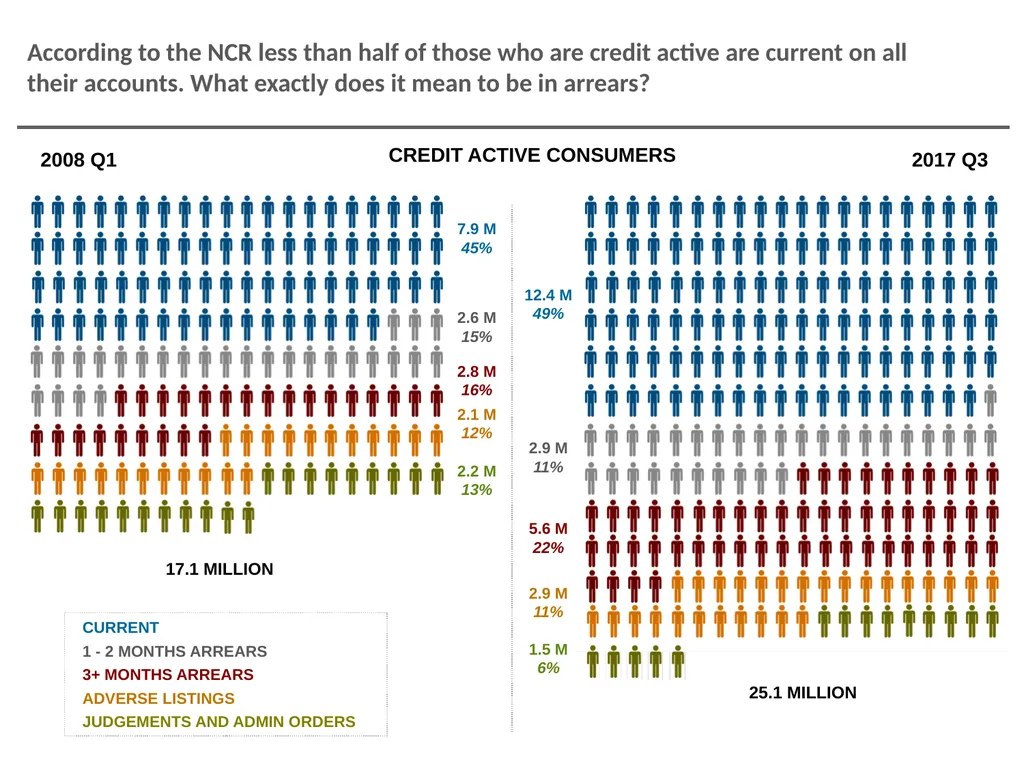
slide5. According to the NCR less than half of those who are credit active are current on all their accounts. What exactly does it mean to be in arrears? CREDIT ACTIVE CONSUMERS 2008 Q1 2017 Q3 17.1 MILLION 7.9 M
45% 2.6 M
15% 2.8 M
16% 2.1 M
12% 2.2 M
13% 12.4 M
49% 2.9 M
11% 5.6 M
22% 2.9 M
11% 1.5 M
6% CURRENT 1 - 2 MONTHS ARREARS 3+ MONTHS ARREARS ADVERSE LISTINGS JUDGEMENTS AND ADMIN ORDERS 25.1 MILLION<br>
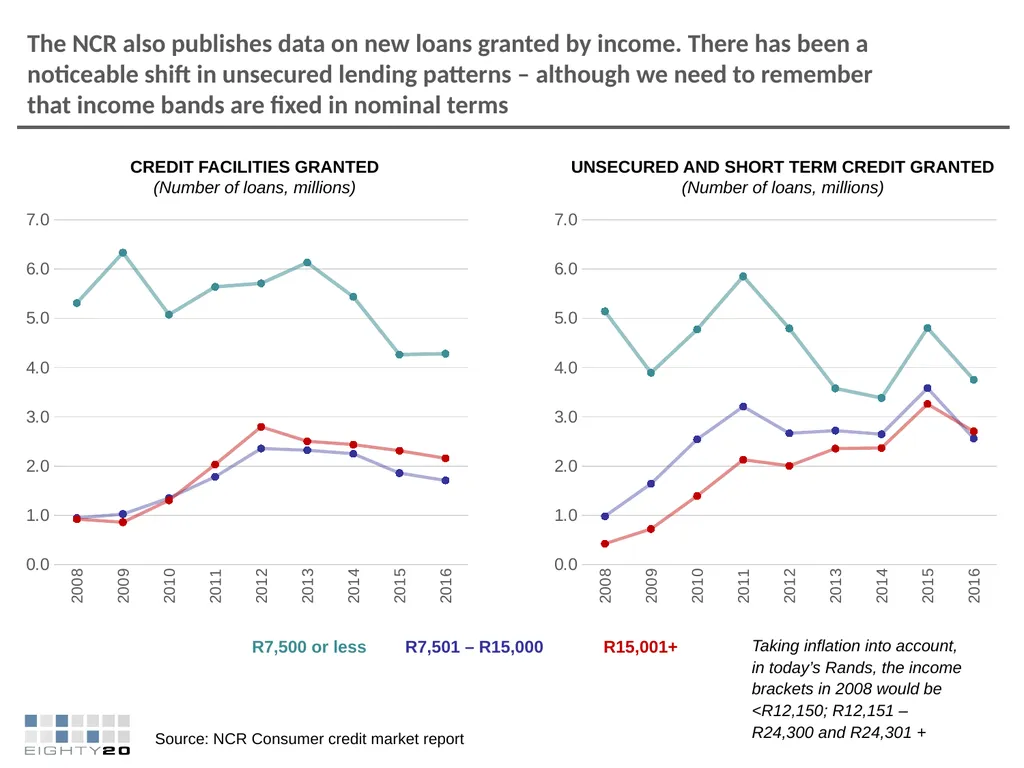
slide6. The NCR also publishes data on new loans granted by income. There has been a noticeable shift in unsecured lending patterns – although we need to remember that income bands are fixed in nominal terms CREDIT FACILITIES GRANTED
(Number of loans, millions) UNSECURED AND SHORT TERM CREDIT GRANTED
(Number of loans, millions) R7,500 or less R7,501 – R15,000 R15,001+ Source: NCR Consumer credit market report Taking inflation into account, in today’s Rands, the income brackets in 2008 would be <R12,150; R12,151 – R24,300 and R24,301 +<br>
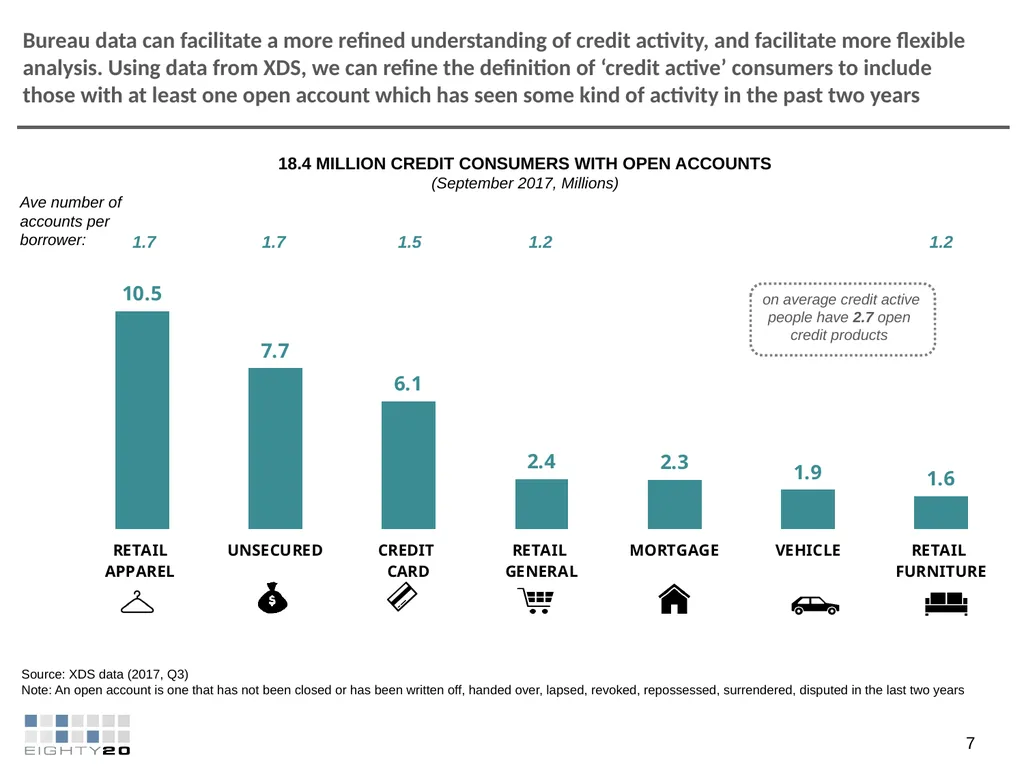
slide7. Bureau data can facilitate a more refined understanding of credit activity, and facilitate more flexible analysis. Using data from XDS, we can refine the definition of ‘credit active’ consumers to include those with at least one open account which has seen some kind of activity in the past two years 7 Source: XDS data (2017, Q3)
Note: An open account is one that has not been closed or has been written off, handed over, lapsed, revoked, repossessed, surrendered, disputed in the last two years Ave number of accounts per borrower: 1.7 1.7 1.5 1.2 1.2 18.4 MILLION CREDIT CONSUMERS WITH OPEN ACCOUNTS
(September 2017, Millions) on average credit active people have 2.7 open credit products<br>
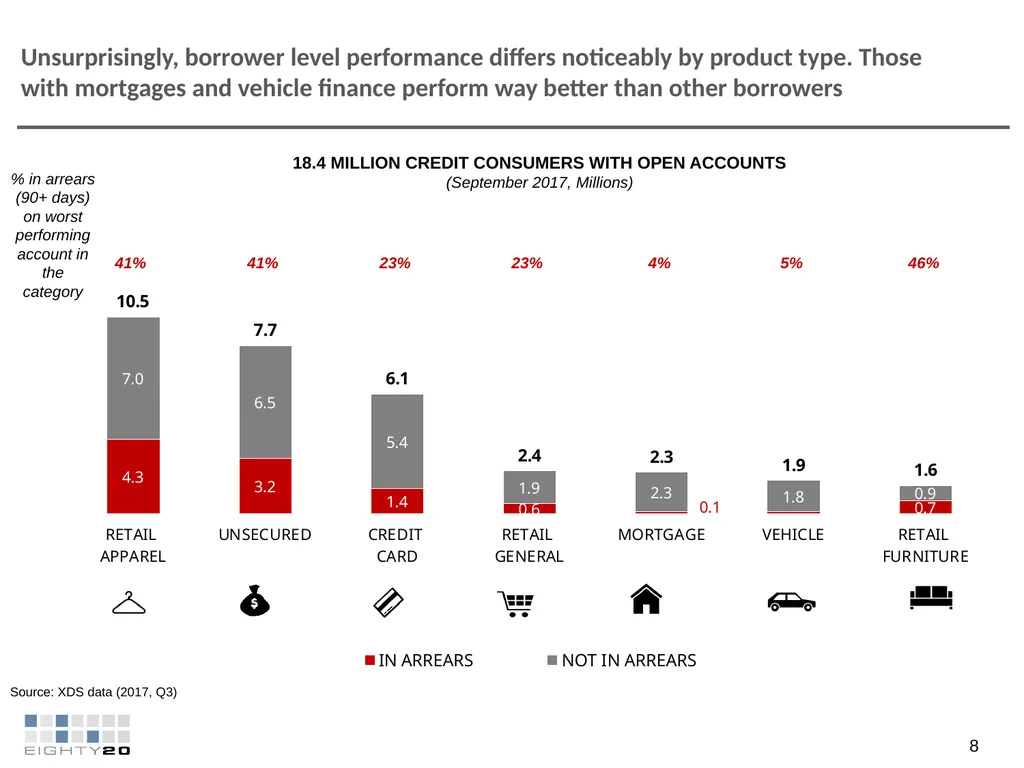
slide8. Unsurprisingly, borrower level performance differs noticeably by product type. Those with mortgages and vehicle finance perform way better than other borrowers 8 Source: XDS data (2017, Q3) % in arrears
(90+ days) on worst performing account in the category 41% 41% 23% 23% 46% 5% 4% 18.4 MILLION CREDIT CONSUMERS WITH OPEN ACCOUNTS
(September 2017, Millions)<br>
slide9. AGENDA 9 CREDIT MARKET OVERVIEW INTRODUCTION TO RESEARCH AND METHODOLOGY BORROWERS ELIGIBLE FOR DEBT INTERVENTION<br>
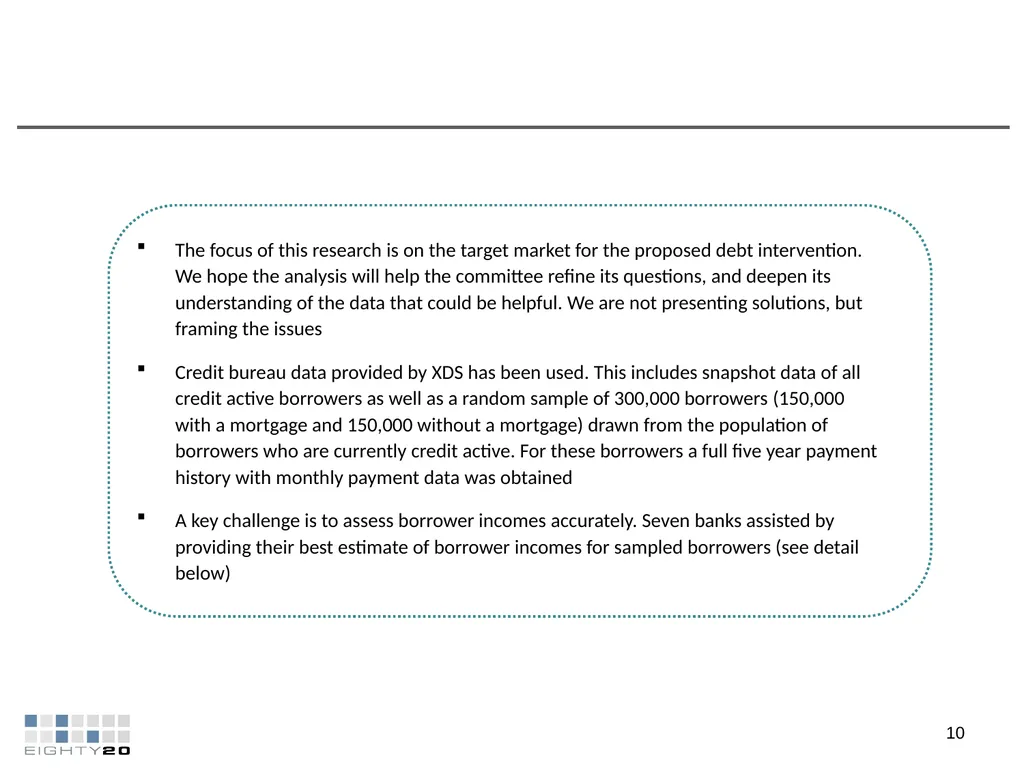
slide10. The focus of this research is on the target market for the proposed debt intervention. We hope the analysis will help the committee refine its questions, and deepen its understanding of the data that could be helpful. We are not presenting solutions, but framing the issues
Credit bureau data provided by XDS has been used. This includes snapshot data of all credit active borrowers as well as a random sample of 300,000 borrowers (150,000 with a mortgage and 150,000 without a mortgage) drawn from the population of borrowers who are currently credit active. For these borrowers a full five year payment history with monthly payment data was obtained
A key challenge is to assess borrower incomes accurately. Seven banks assisted by providing their best estimate of borrower incomes for sampled borrowers (see detail below) 10<br>
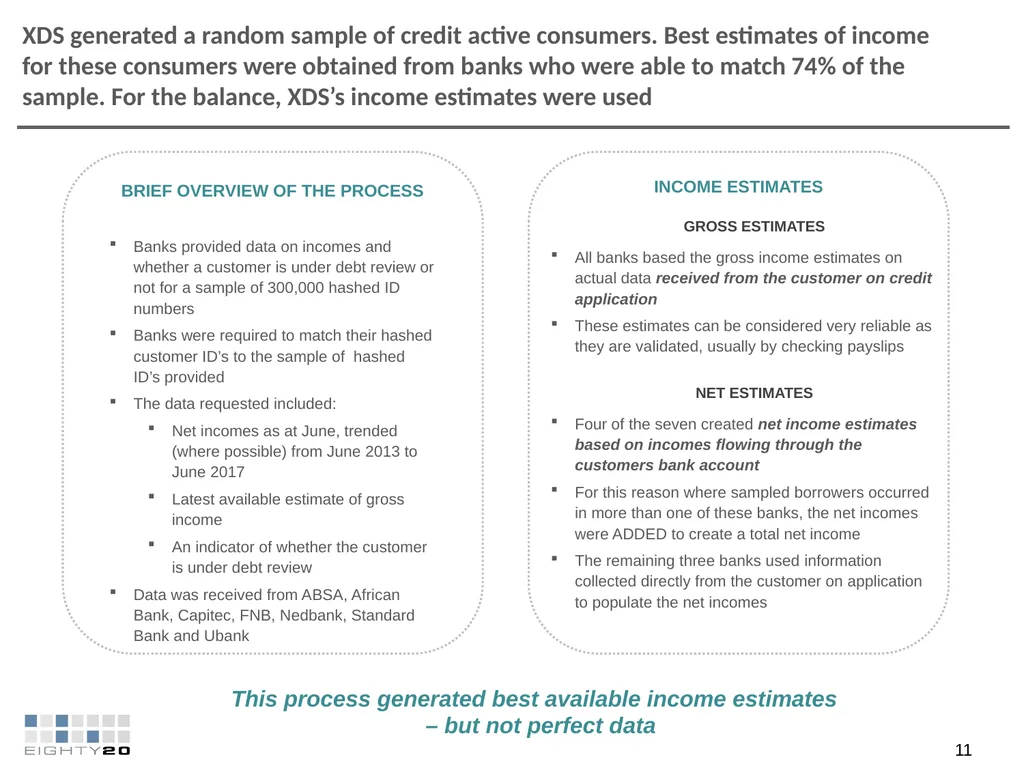
slide11. XDS generated a random sample of credit active consumers. Best estimates of income for these consumers were obtained from banks who were able to match 74% of the sample. For the balance, XDS’s income estimates were used 11 Banks provided data on incomes and whether a customer is under debt review or not for a sample of 300,000 hashed ID numbers
Banks were required to match their hashed customer ID’s to the sample of hashed ID’s provided
The data requested included:
Net incomes as at June, trended (where possible) from June 2013 to June 2017
Latest available estimate of gross income
An indicator of whether the customer is under debt review
Data was received from ABSA, African Bank, Capitec, FNB, Nedbank, Standard Bank and Ubank INCOME ESTIMATES All banks based the gross income estimates on actual data received from the customer on credit application
These estimates can be considered very reliable as they are validated, usually by checking payslips GROSS ESTIMATES Four of the seven created net income estimates based on incomes flowing through the customers bank account
For this reason where sampled borrowers occurred in more than one of these banks, the net incomes were ADDED to create a total net income
The remaining three banks used information collected directly from the customer on application to populate the net incomes NET ESTIMATES BRIEF OVERVIEW OF THE PROCESS This process generated best available income estimates
– but not perfect data<br>
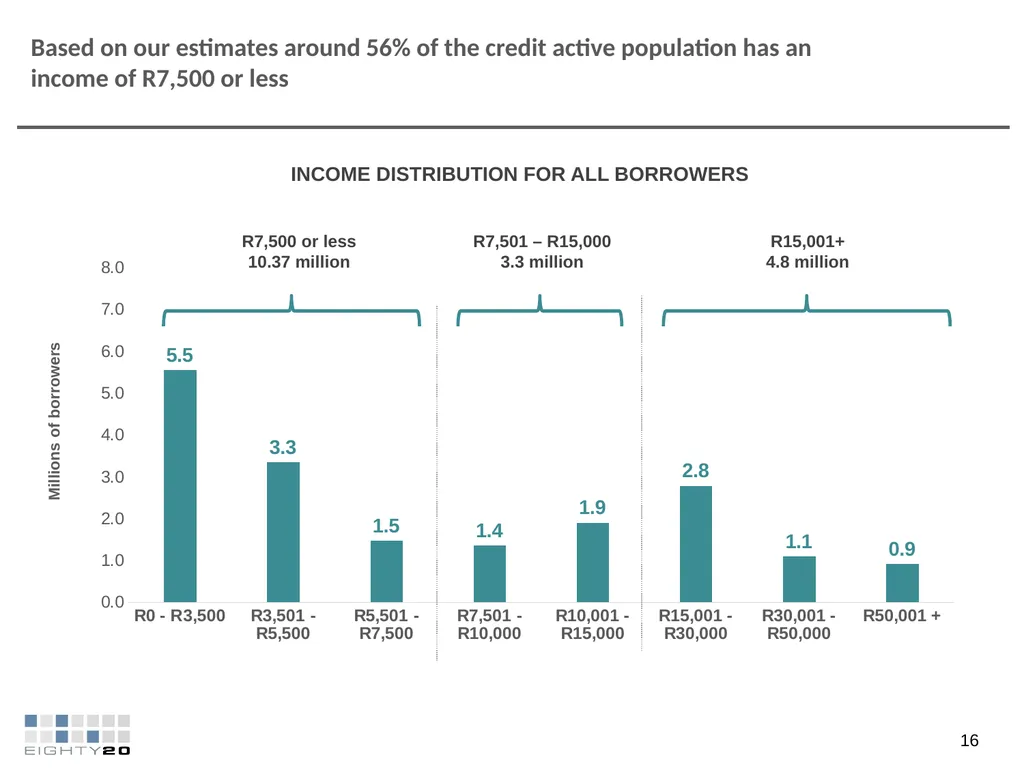
slide12. Based on our estimates around 56% of the credit active population has an income of R7,500 or less INCOME DISTRIBUTION FOR ALL BORROWERS Millions of borrowers R7,500 or less
10.37 million R15,001+
4.8 million R7,501 – R15,000
3.3 million 16<br>
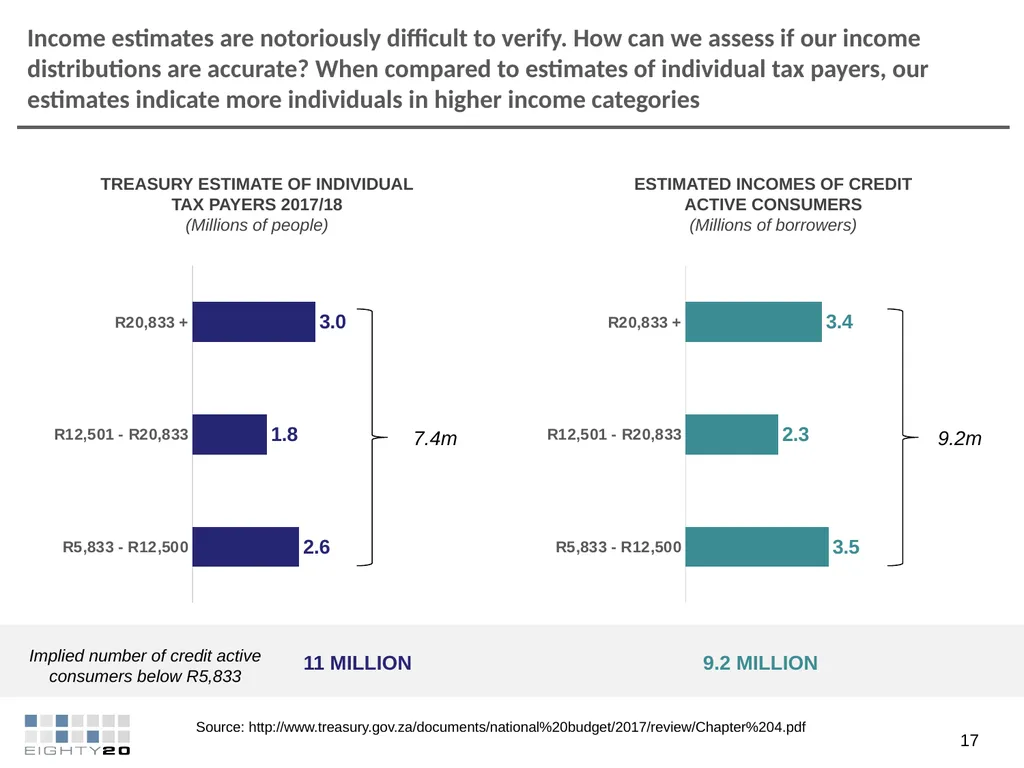
slide13. Income estimates are notoriously difficult to verify. How can we assess if our income distributions are accurate? When compared to estimates of individual tax payers, our estimates indicate more individuals in higher income categories TREASURY ESTIMATE OF INDIVIDUAL TAX PAYERS 2017/18
(Millions of people) Source: http://www.treasury.gov.za/documents/national%20budget/2017/review/Chapter%204.pdf 17 ESTIMATED INCOMES OF CREDIT ACTIVE CONSUMERS
(Millions of borrowers) 9.2m 7.4m Implied number of credit active consumers below R5,833 11 MILLION 9.2 MILLION<br>
slide14. AGENDA 14 CREDIT MARKET OVERVIEW INTRODUCTION TO RESEARCH AND METHODOLOGY BORROWERS ELIGIBLE FOR DEBT INTERVENTION<br>
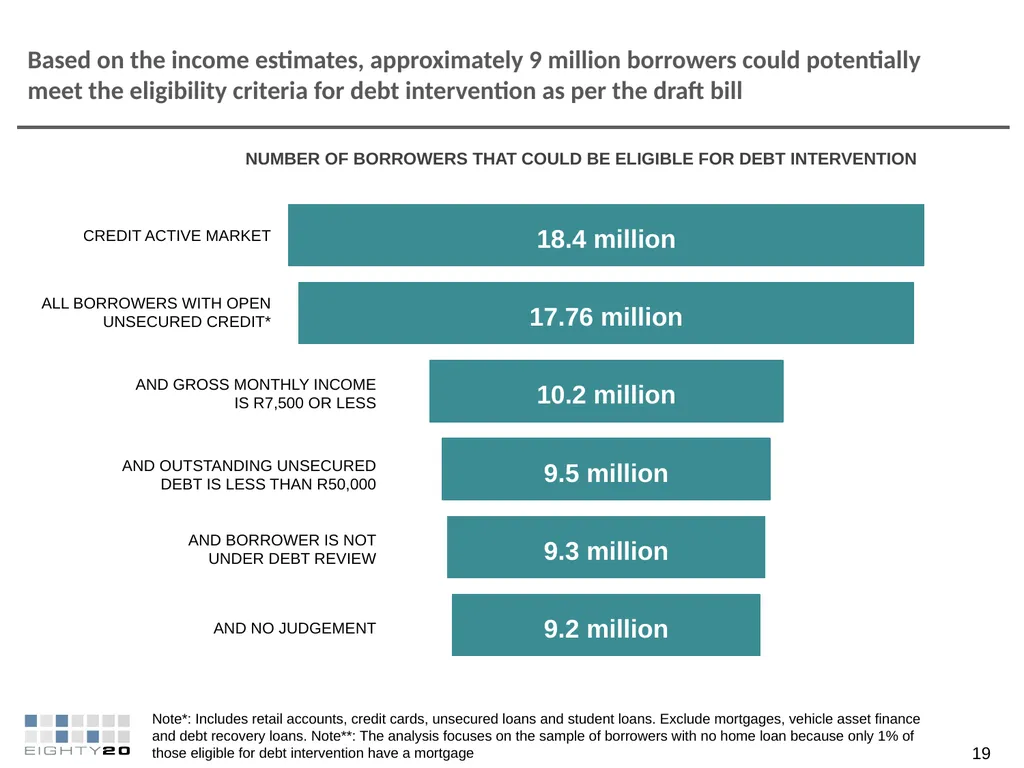
slide15. ALL BORROWERS WITH OPEN UNSECURED CREDIT* AND GROSS MONTHLY INCOME IS R7,500 OR LESS AND OUTSTANDING UNSECURED DEBT IS LESS THAN R50,000 AND BORROWER IS NOT UNDER DEBT REVIEW AND NO JUDGEMENT CREDIT ACTIVE MARKET 19 Note*: Includes retail accounts, credit cards, unsecured loans and student loans. Exclude mortgages, vehicle asset finance and debt recovery loans. Note**: The analysis focuses on the sample of borrowers with no home loan because only 1% of those eligible for debt intervention have a mortgage NUMBER OF BORROWERS THAT COULD BE ELIGIBLE FOR DEBT INTERVENTION Based on the income estimates, approximately 9 million borrowers could potentially meet the eligibility criteria for debt intervention as per the draft bill<br>
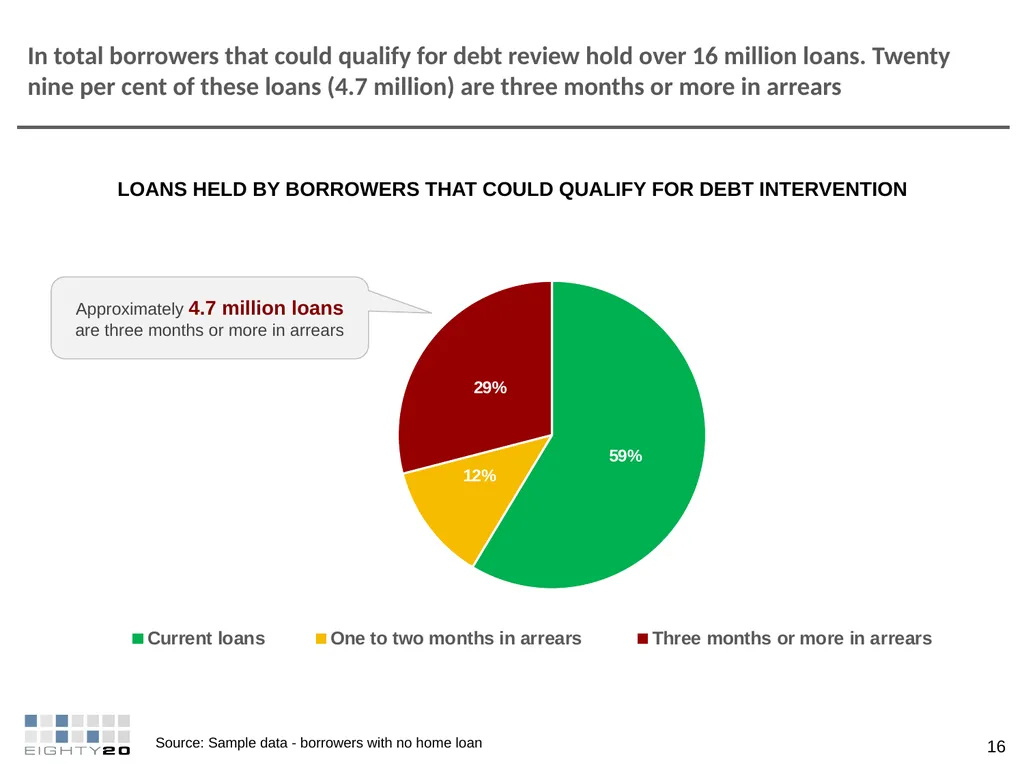
slide16. In total borrowers that could qualify for debt review hold over 16 million loans. Twenty nine per cent of these loans (4.7 million) are three months or more in arrears 16 LOANS HELD BY BORROWERS THAT COULD QUALIFY FOR DEBT INTERVENTION Approximately 4.7 million loans are three months or more in arrears Source: Sample data - borrowers with no home loan<br>
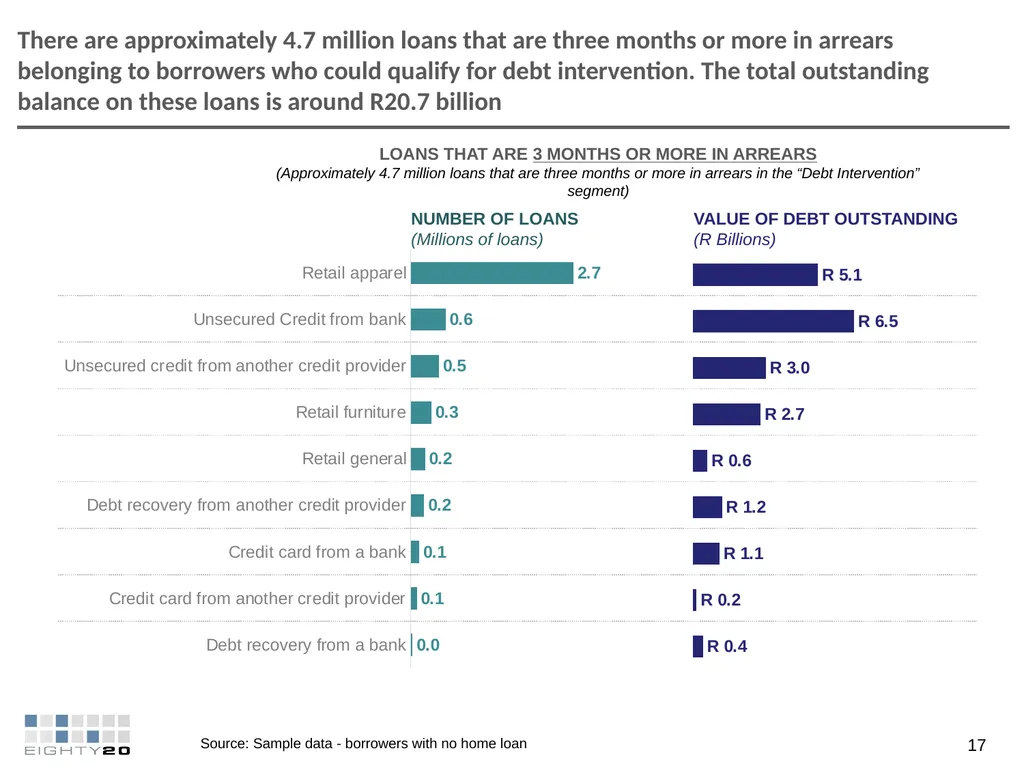
slide17. There are approximately 4.7 million loans that are three months or more in arrears belonging to borrowers who could qualify for debt intervention. The total outstanding balance on these loans is around R20.7 billion 17 LOANS THAT ARE 3 MONTHS OR MORE IN ARREARS
(Approximately 4.7 million loans that are three months or more in arrears in the “Debt Intervention” segment) Source: Sample data - borrowers with no home loan NUMBER OF LOANS
(Millions of loans) VALUE OF DEBT OUTSTANDING
(R Billions)<br>
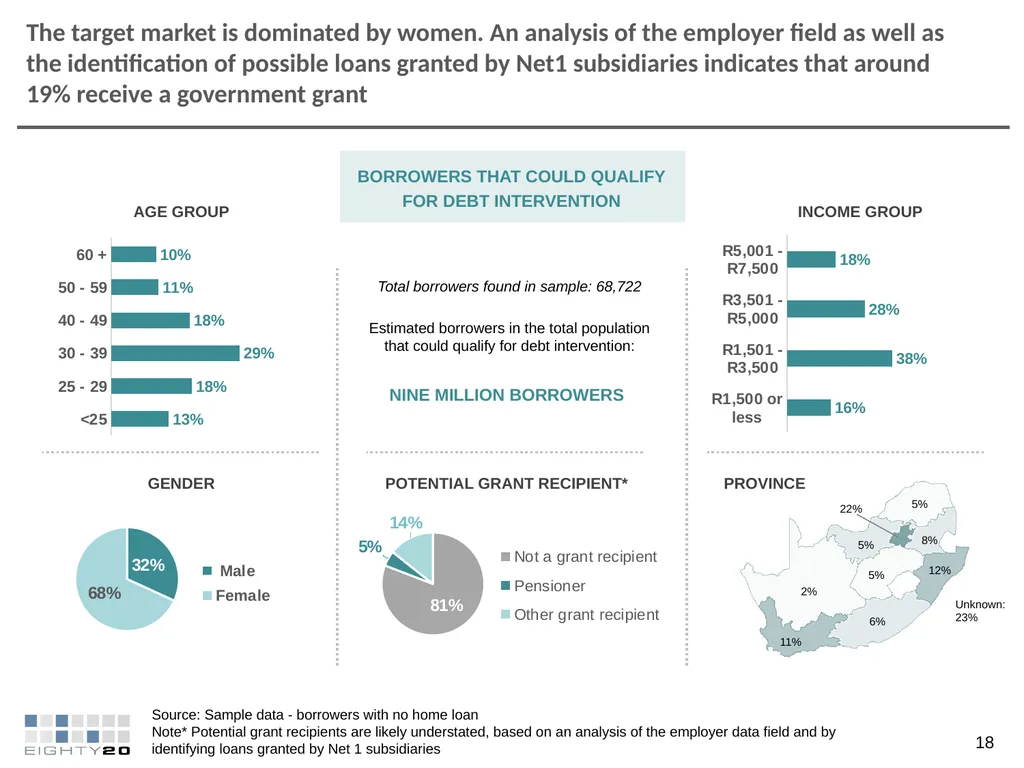
slide18. The target market is dominated by women. An analysis of the employer field as well as the identification of possible loans granted by Net1 subsidiaries indicates that around 19% receive a government grant 18 AGE GROUP PROVINCE GENDER INCOME GROUP Source: Sample data - borrowers with no home loan Note* Potential grant recipients are likely understated, based on an analysis of the employer data field and by identifying loans granted by Net 1 subsidiaries BORROWERS THAT COULD QUALIFY FOR DEBT INTERVENTION 22% 11% 12% 8% 6% 5% 5% 5% 2% Unknown:
23% Total borrowers found in sample: 68,722 Estimated borrowers in the total population that could qualify for debt intervention: POTENTIAL GRANT RECIPIENT* NINE MILLION BORROWERS<br>
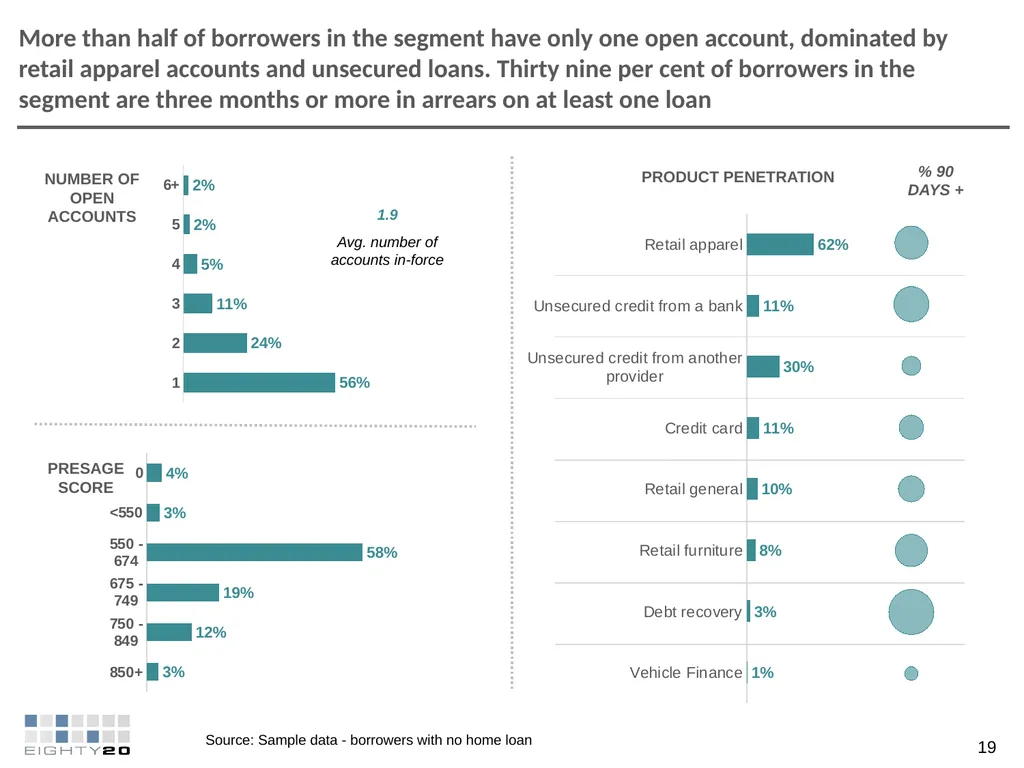
slide19. More than half of borrowers in the segment have only one open account, dominated by retail apparel accounts and unsecured loans. Thirty nine per cent of borrowers in the segment are three months or more in arrears on at least one loan 19 NUMBER OF OPEN ACCOUNTS PRODUCT PENETRATION % 90 DAYS + Avg. number of accounts in-force 1.9 PRESAGE SCORE Source: Sample data - borrowers with no home loan<br>
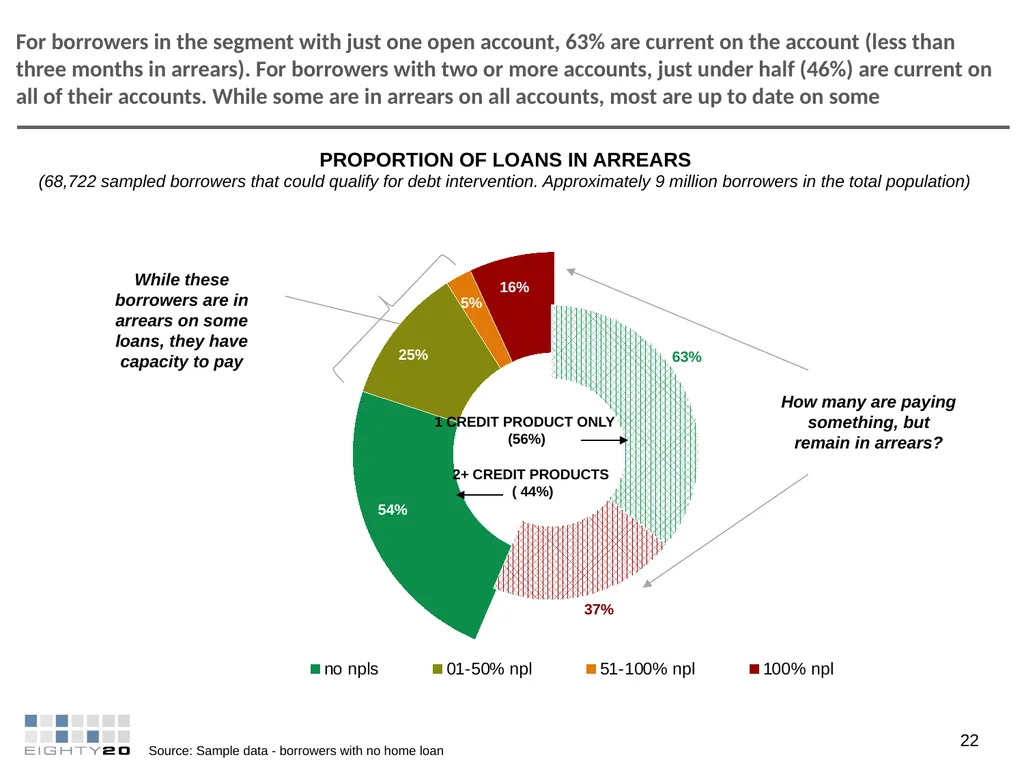
slide20. For borrowers in the segment with just one open account, 63% are current on the account (less than three months in arrears). For borrowers with two or more accounts, just under half (46%) are current on all of their accounts. While some are in arrears on all accounts, most are up to date on some 1 CREDIT PRODUCT ONLY
(56%) 2+ CREDIT PRODUCTS
( 44%) 37% 63% 54% 25% 5% 16% PROPORTION OF LOANS IN ARREARS
(68,722 sampled borrowers that could qualify for debt intervention. Approximately 9 million borrowers in the total population) Source: Sample data - borrowers with no home loan While these borrowers are in arrears on some loans, they have capacity to pay 22 How many are paying something, but remain in arrears?<br>
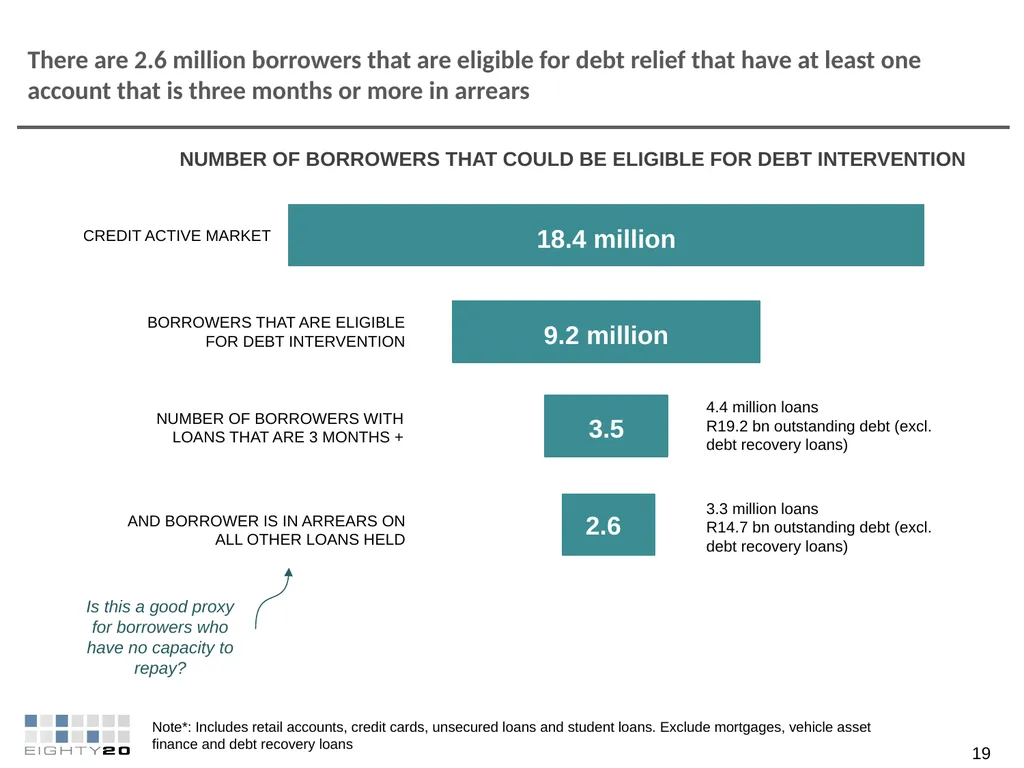
slide21. Note*: Includes retail accounts, credit cards, unsecured loans and student loans. Exclude mortgages, vehicle asset finance and debt recovery loans BORROWERS THAT ARE ELIGIBLE FOR DEBT INTERVENTION There are 2.6 million borrowers that are eligible for debt relief that have at least one account that is three months or more in arrears CREDIT ACTIVE MARKET 19 NUMBER OF BORROWERS WITH LOANS THAT ARE 3 MONTHS + AND BORROWER IS IN ARREARS ON ALL OTHER LOANS HELD 3.5 2.6 3.3 million loans
R14.7 bn outstanding debt (excl. debt recovery loans) 4.4 million loans
R19.2 bn outstanding debt (excl. debt recovery loans) Is this a good proxy for borrowers who have no capacity to repay? NUMBER OF BORROWERS THAT COULD BE ELIGIBLE FOR DEBT INTERVENTION<br>
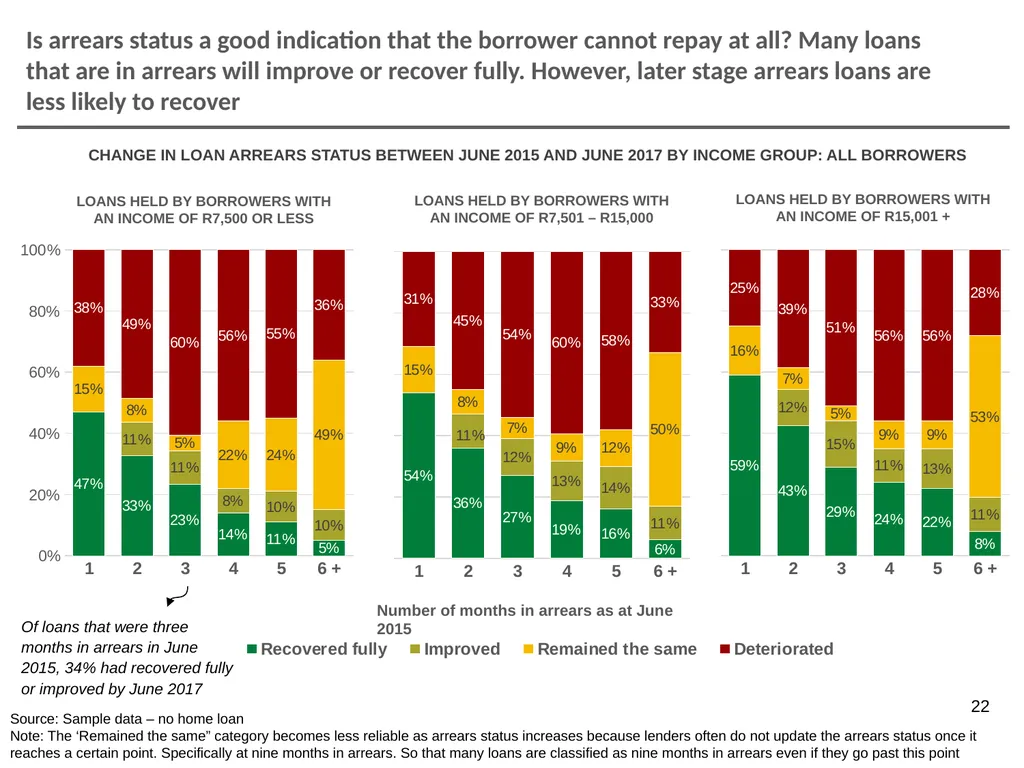
slide22. Of loans that were three months in arrears in June 2015, 34% had recovered fully or improved by June 2017 Is arrears status a good indication that the borrower cannot repay at all? Many loans that are in arrears will improve or recover fully. However, later stage arrears loans are less likely to recover 22 CHANGE IN LOAN ARREARS STATUS BETWEEN JUNE 2015 AND JUNE 2017 BY INCOME GROUP: ALL BORROWERS Source: Sample data – no home loan
Note: The ‘Remained the same” category becomes less reliable as arrears status increases because lenders often do not update the arrears status once it reaches a certain point. Specifically at nine months in arrears. So that many loans are classified as nine months in arrears even if they go past this point LOANS HELD BY BORROWERS WITH AN INCOME OF R7,500 OR LESS LOANS HELD BY BORROWERS WITH AN INCOME OF R7,501 – R15,000 LOANS HELD BY BORROWERS WITH AN INCOME OF R15,001 + Number of months in arrears as at June 2015<br>
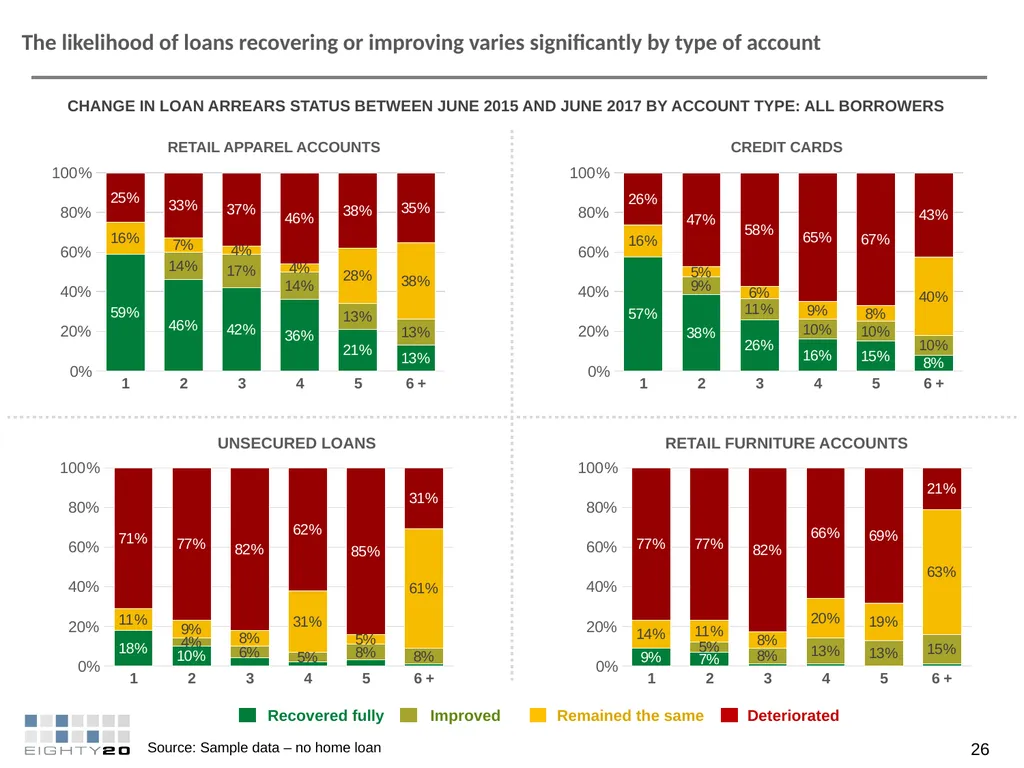
slide23. The likelihood of loans recovering or improving varies significantly by type of account RETAIL APPAREL ACCOUNTS CREDIT CARDS UNSECURED LOANS RETAIL FURNITURE ACCOUNTS Recovered fully Improved Remained the same Deteriorated CHANGE IN LOAN ARREARS STATUS BETWEEN JUNE 2015 AND JUNE 2017 BY ACCOUNT TYPE: ALL BORROWERS Source: Sample data – no home loan 26<br>
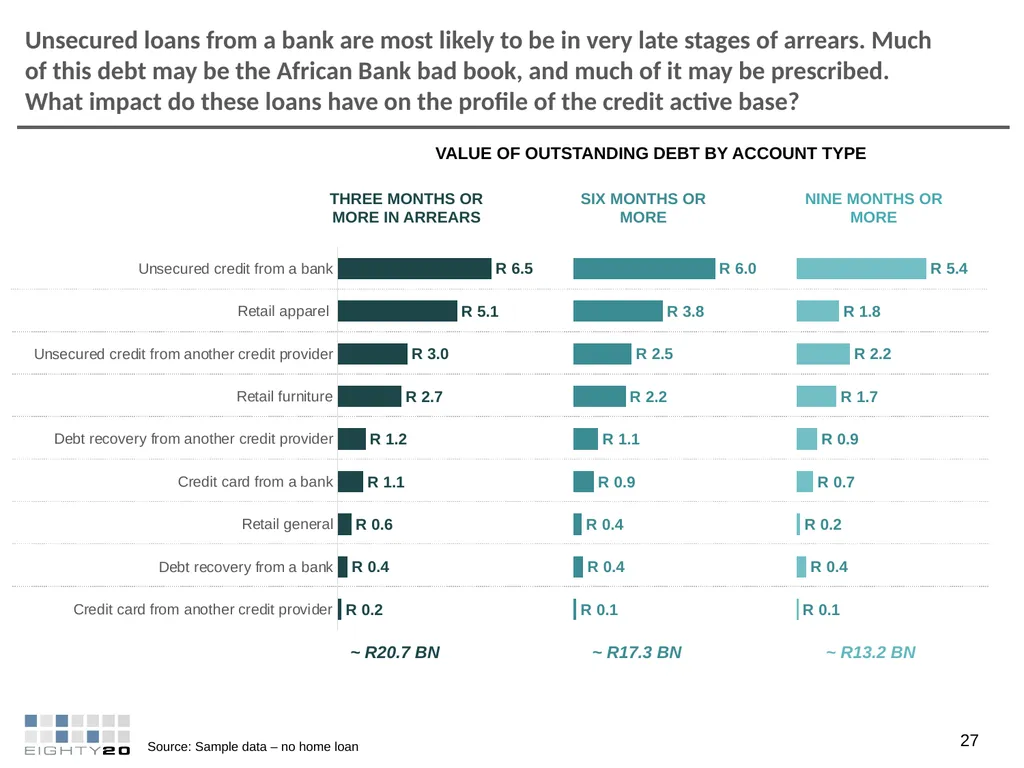
slide24. Unsecured loans from a bank are most likely to be in very late stages of arrears. Much of this debt may be the African Bank bad book, and much of it may be prescribed. What impact do these loans have on the profile of the credit active base? VALUE OF OUTSTANDING DEBT BY ACCOUNT TYPE THREE MONTHS OR MORE IN ARREARS SIX MONTHS OR MORE NINE MONTHS OR MORE ~ R20.7 BN ~ R17.3 BN ~ R13.2 BN 27 Source: Sample data – no home loan<br>
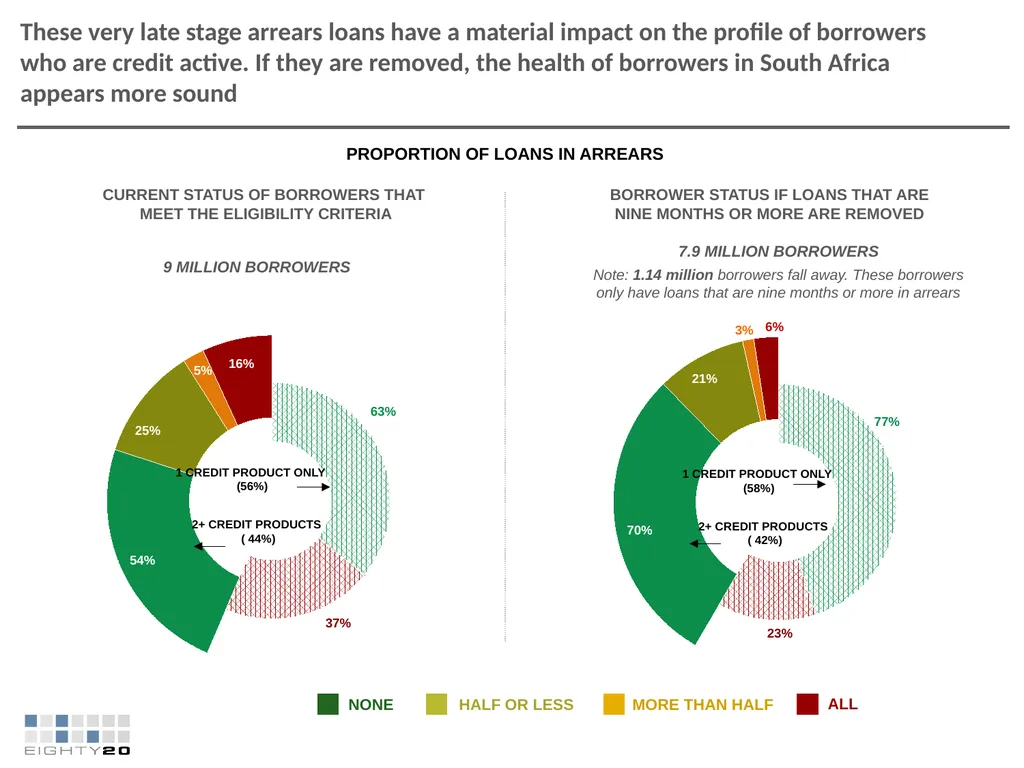
slide25. These very late stage arrears loans have a material impact on the profile of borrowers who are credit active. If they are removed, the health of borrowers in South Africa appears more sound NONE HALF OR LESS MORE THAN HALF ALL 1 CREDIT PRODUCT ONLY
(56%) 2+ CREDIT PRODUCTS
( 44%) 1 CREDIT PRODUCT ONLY
(58%) 2+ CREDIT PRODUCTS
( 42%) 37% 63% 54% 25% 5% 16% 23% 77% 70% 21% 3% 6% CURRENT STATUS OF BORROWERS THAT MEET THE ELIGIBILITY CRITERIA 9 MILLION BORROWERS BORROWER STATUS IF LOANS THAT ARE NINE MONTHS OR MORE ARE REMOVED 7.9 MILLION BORROWERS
Note: 1.14 million borrowers fall away. These borrowers only have loans that are nine months or more in arrears PROPORTION OF LOANS IN ARREARS<br>
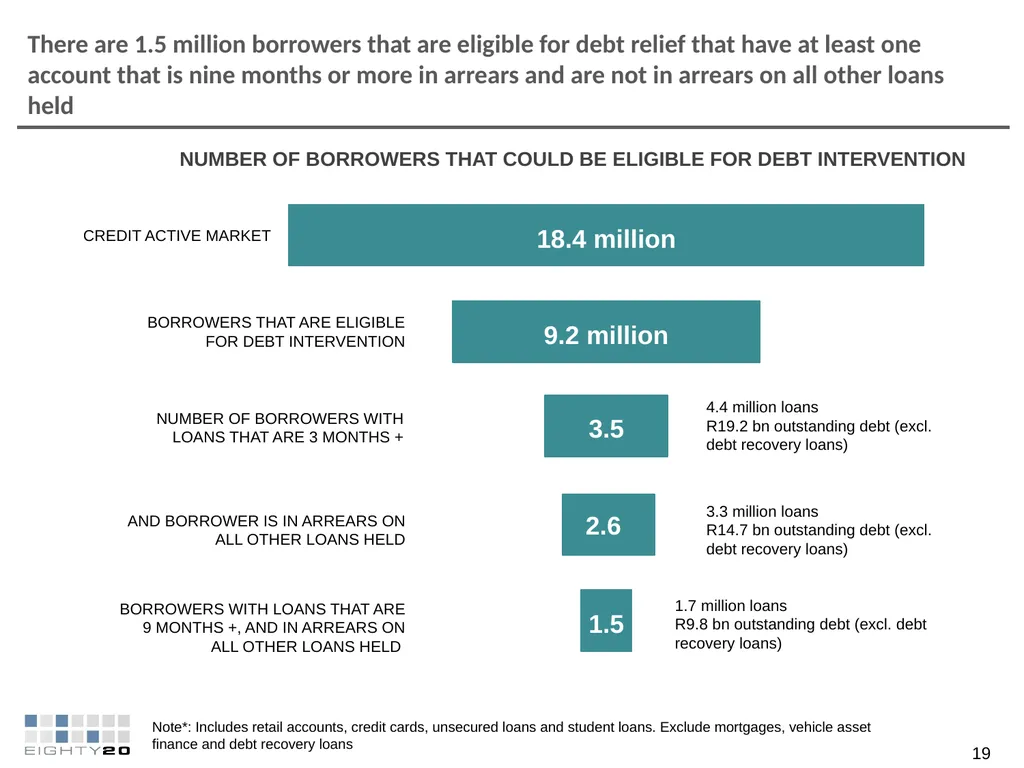
slide26. Note*: Includes retail accounts, credit cards, unsecured loans and student loans. Exclude mortgages, vehicle asset finance and debt recovery loans BORROWERS THAT ARE ELIGIBLE FOR DEBT INTERVENTION There are 1.5 million borrowers that are eligible for debt relief that have at least one account that is nine months or more in arrears and are not in arrears on all other loans held NUMBER OF BORROWERS THAT COULD BE ELIGIBLE FOR DEBT INTERVENTION CREDIT ACTIVE MARKET 19 NUMBER OF BORROWERS WITH LOANS THAT ARE 3 MONTHS + AND BORROWER IS IN ARREARS ON ALL OTHER LOANS HELD 3.5 2.6 3.3 million loans
R14.7 bn outstanding debt (excl. debt recovery loans) 4.4 million loans
R19.2 bn outstanding debt (excl. debt recovery loans) BORROWERS WITH LOANS THAT ARE 9 MONTHS +, AND IN ARREARS ON ALL OTHER LOANS HELD 1.5 1.7 million loans
R9.8 bn outstanding debt (excl. debt recovery loans)<br>
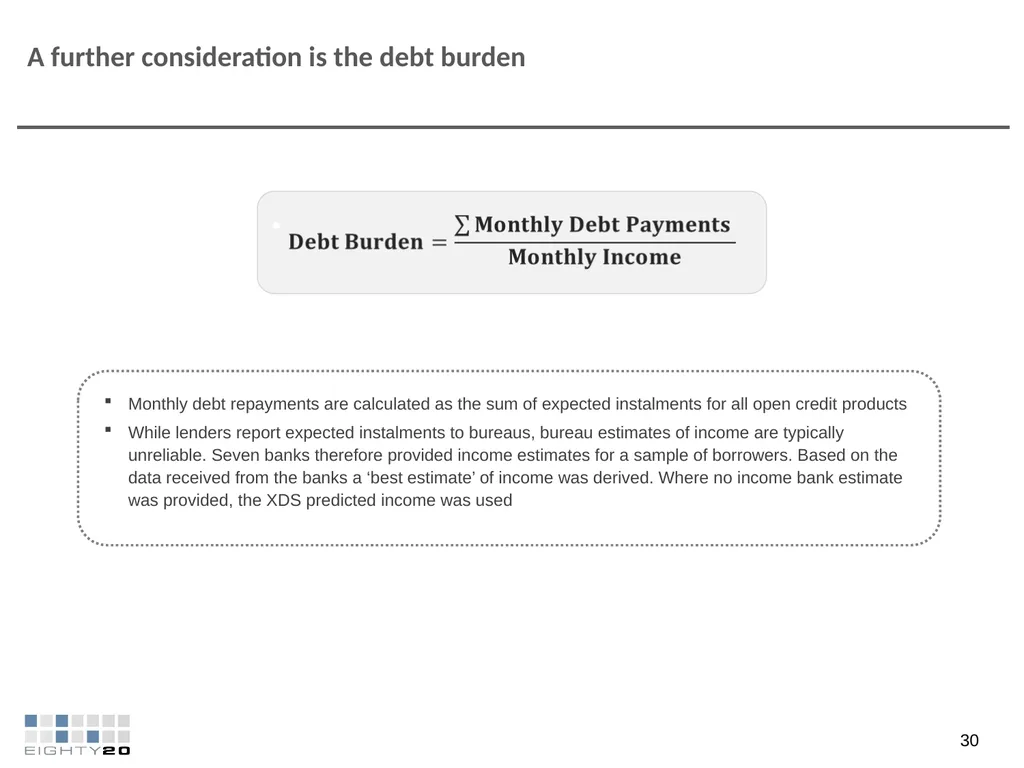
slide27. A further consideration is the debt burden Monthly debt repayments are calculated as the sum of expected instalments for all open credit products
While lenders report expected instalments to bureaus, bureau estimates of income are typically unreliable. Seven banks therefore provided income estimates for a sample of borrowers. Based on the data received from the banks a ‘best estimate’ of income was derived. Where no income bank estimate was provided, the XDS predicted income was used 30<br>
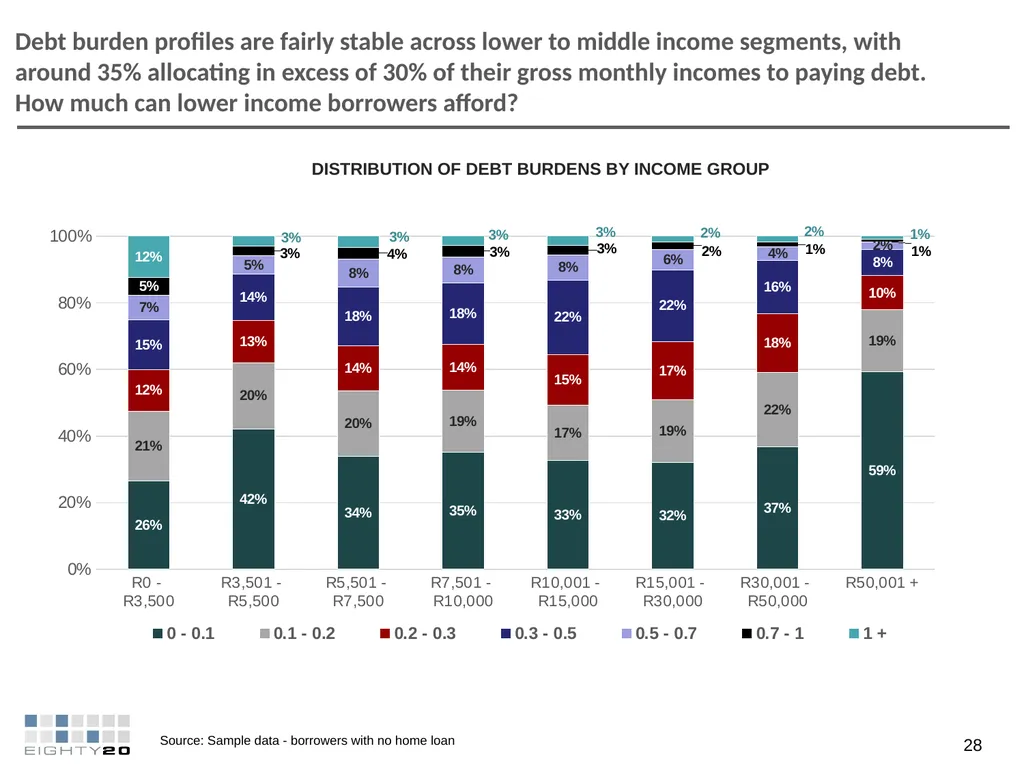
slide28. Debt burden profiles are fairly stable across lower to middle income segments, with around 35% allocating in excess of 30% of their gross monthly incomes to paying debt. How much can lower income borrowers afford? 28 DISTRIBUTION OF DEBT BURDENS BY INCOME GROUP Source: Sample data - borrowers with no home loan<br>
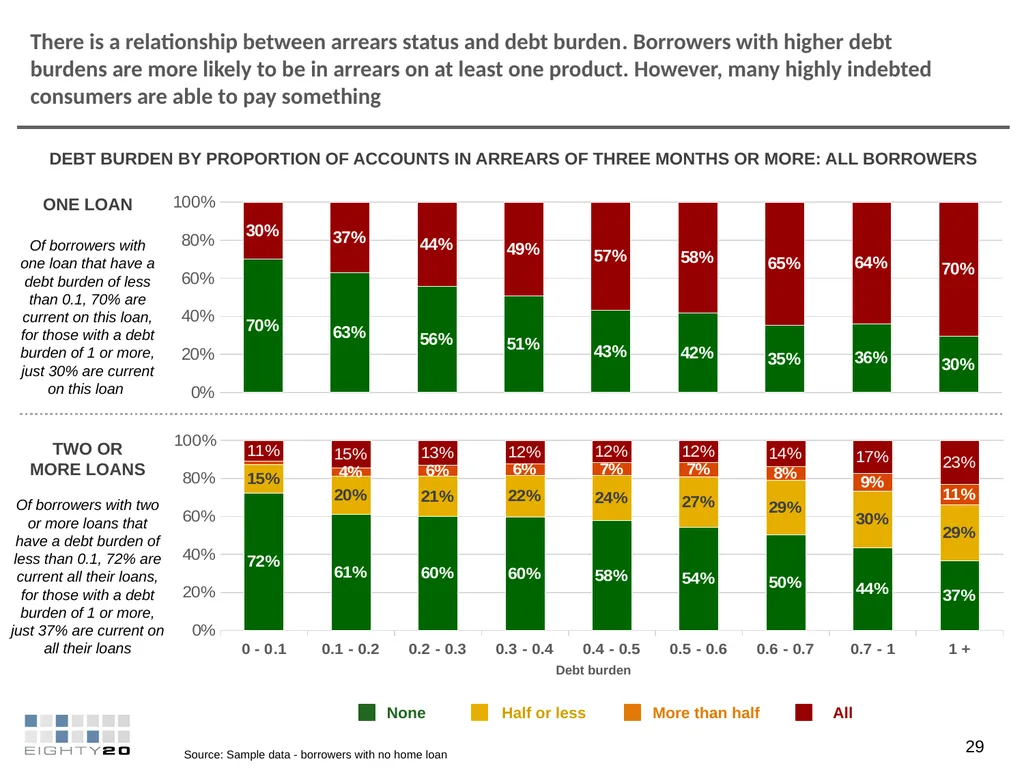
slide29. There is a relationship between arrears status and debt burden. Borrowers with higher debt burdens are more likely to be in arrears on at least one product. However, many highly indebted consumers are able to pay something 29 DEBT BURDEN BY PROPORTION OF ACCOUNTS IN ARREARS OF THREE MONTHS OR MORE: ALL BORROWERS Source: Sample data - borrowers with no home loan ONE LOAN TWO OR MORE LOANS Debt burden None Half or less More than half All Of borrowers with one loan that have a debt burden of less than 0.1, 70% are current on this loan, for those with a debt burden of 1 or more, just 30% are current on this loan Of borrowers with two or more loans that have a debt burden of less than 0.1, 72% are current all their loans, for those with a debt burden of 1 or more, just 37% are current on all their loans<br>
slide30. In summary: It is critical to understand borrower incomes – we have some indications but these need to be verified
It is critical to understand collectable debt – we have some indications but these need to be engaged with
It is critical to understand ability (as opposed to willingness) to pay, and to identify those who cannot pay – we have some indication that many borrowers who are in arrears have capacity to pay something. What process exists for these borrowers?
It is also useful to think carefully about how this intervention will be assessed going forward. What are the key indicators we hope will shift?<br>
slide2. AGENDA 2 CREDIT MARKET OVERVIEW INTRODUCTION TO RESEARCH AND METHODOLOGY BORROWERS ELIGIBLE FOR DEBT INTERVENTION<br>
slide3. South Africa is unique in that the NCR publishes data for the entire consumer credit sector. This data includes data on the gross debtors book, arrears levels, new loans granted and active borrowers 3 GROSS DEBTORS BOOK: 2017 Q3
R BILLIONS CREDIT
FACILITIES MORTGAGES UNSECURED
CREDIT SECURED
CREDIT SHORT-TERM
CREDIT 895 398 224 166 3 ACCOUNTS (000’S) 5 278 1 730 3 640 25 403 953 Source: NCR Consumer credit report. Developmental credit is provided by lenders registered as developmental credit providers and includes educational loans; small business loans; loans for the acquisition, rehabilitation, building or expansion of low income housing 42 DEVELOPMENTAL
CREDIT 1 167 % 90 days or more in arrears 3% 14% 14% 18% 3% 12% 3% 17% 4% 9% 4% 13% 91 DAYS + OTHER<br>
slide4. There has been a significant increase in access to credit in South Africa. According to the NCR, the number of credit active consumers increased from 17.1 million in the first quarter of 2008 to 25.1 million in the third quarter of 2017. What exactly does it mean to be credit active? CREDIT ACTIVE CONSUMERS 2008 Q1 2017 Q3 17.1 MILLION 25.1 MILLION Total population 18+:
29.9 million
57% credit active Total population 18+:
37.5 million
67% credit active Source: NCR, Stats SA LFS 2008 Q1, 2017 Q3<br>
slide5. According to the NCR less than half of those who are credit active are current on all their accounts. What exactly does it mean to be in arrears? CREDIT ACTIVE CONSUMERS 2008 Q1 2017 Q3 17.1 MILLION 7.9 M
45% 2.6 M
15% 2.8 M
16% 2.1 M
12% 2.2 M
13% 12.4 M
49% 2.9 M
11% 5.6 M
22% 2.9 M
11% 1.5 M
6% CURRENT 1 - 2 MONTHS ARREARS 3+ MONTHS ARREARS ADVERSE LISTINGS JUDGEMENTS AND ADMIN ORDERS 25.1 MILLION<br>
slide6. The NCR also publishes data on new loans granted by income. There has been a noticeable shift in unsecured lending patterns – although we need to remember that income bands are fixed in nominal terms CREDIT FACILITIES GRANTED
(Number of loans, millions) UNSECURED AND SHORT TERM CREDIT GRANTED
(Number of loans, millions) R7,500 or less R7,501 – R15,000 R15,001+ Source: NCR Consumer credit market report Taking inflation into account, in today’s Rands, the income brackets in 2008 would be <R12,150; R12,151 – R24,300 and R24,301 +<br>
slide7. Bureau data can facilitate a more refined understanding of credit activity, and facilitate more flexible analysis. Using data from XDS, we can refine the definition of ‘credit active’ consumers to include those with at least one open account which has seen some kind of activity in the past two years 7 Source: XDS data (2017, Q3)
Note: An open account is one that has not been closed or has been written off, handed over, lapsed, revoked, repossessed, surrendered, disputed in the last two years Ave number of accounts per borrower: 1.7 1.7 1.5 1.2 1.2 18.4 MILLION CREDIT CONSUMERS WITH OPEN ACCOUNTS
(September 2017, Millions) on average credit active people have 2.7 open credit products<br>
slide8. Unsurprisingly, borrower level performance differs noticeably by product type. Those with mortgages and vehicle finance perform way better than other borrowers 8 Source: XDS data (2017, Q3) % in arrears
(90+ days) on worst performing account in the category 41% 41% 23% 23% 46% 5% 4% 18.4 MILLION CREDIT CONSUMERS WITH OPEN ACCOUNTS
(September 2017, Millions)<br>
slide9. AGENDA 9 CREDIT MARKET OVERVIEW INTRODUCTION TO RESEARCH AND METHODOLOGY BORROWERS ELIGIBLE FOR DEBT INTERVENTION<br>
slide10. The focus of this research is on the target market for the proposed debt intervention. We hope the analysis will help the committee refine its questions, and deepen its understanding of the data that could be helpful. We are not presenting solutions, but framing the issues
Credit bureau data provided by XDS has been used. This includes snapshot data of all credit active borrowers as well as a random sample of 300,000 borrowers (150,000 with a mortgage and 150,000 without a mortgage) drawn from the population of borrowers who are currently credit active. For these borrowers a full five year payment history with monthly payment data was obtained
A key challenge is to assess borrower incomes accurately. Seven banks assisted by providing their best estimate of borrower incomes for sampled borrowers (see detail below) 10<br>
slide11. XDS generated a random sample of credit active consumers. Best estimates of income for these consumers were obtained from banks who were able to match 74% of the sample. For the balance, XDS’s income estimates were used 11 Banks provided data on incomes and whether a customer is under debt review or not for a sample of 300,000 hashed ID numbers
Banks were required to match their hashed customer ID’s to the sample of hashed ID’s provided
The data requested included:
Net incomes as at June, trended (where possible) from June 2013 to June 2017
Latest available estimate of gross income
An indicator of whether the customer is under debt review
Data was received from ABSA, African Bank, Capitec, FNB, Nedbank, Standard Bank and Ubank INCOME ESTIMATES All banks based the gross income estimates on actual data received from the customer on credit application
These estimates can be considered very reliable as they are validated, usually by checking payslips GROSS ESTIMATES Four of the seven created net income estimates based on incomes flowing through the customers bank account
For this reason where sampled borrowers occurred in more than one of these banks, the net incomes were ADDED to create a total net income
The remaining three banks used information collected directly from the customer on application to populate the net incomes NET ESTIMATES BRIEF OVERVIEW OF THE PROCESS This process generated best available income estimates
– but not perfect data<br>
slide12. Based on our estimates around 56% of the credit active population has an income of R7,500 or less INCOME DISTRIBUTION FOR ALL BORROWERS Millions of borrowers R7,500 or less
10.37 million R15,001+
4.8 million R7,501 – R15,000
3.3 million 16<br>
slide13. Income estimates are notoriously difficult to verify. How can we assess if our income distributions are accurate? When compared to estimates of individual tax payers, our estimates indicate more individuals in higher income categories TREASURY ESTIMATE OF INDIVIDUAL TAX PAYERS 2017/18
(Millions of people) Source: http://www.treasury.gov.za/documents/national%20budget/2017/review/Chapter%204.pdf 17 ESTIMATED INCOMES OF CREDIT ACTIVE CONSUMERS
(Millions of borrowers) 9.2m 7.4m Implied number of credit active consumers below R5,833 11 MILLION 9.2 MILLION<br>
slide14. AGENDA 14 CREDIT MARKET OVERVIEW INTRODUCTION TO RESEARCH AND METHODOLOGY BORROWERS ELIGIBLE FOR DEBT INTERVENTION<br>
slide15. ALL BORROWERS WITH OPEN UNSECURED CREDIT* AND GROSS MONTHLY INCOME IS R7,500 OR LESS AND OUTSTANDING UNSECURED DEBT IS LESS THAN R50,000 AND BORROWER IS NOT UNDER DEBT REVIEW AND NO JUDGEMENT CREDIT ACTIVE MARKET 19 Note*: Includes retail accounts, credit cards, unsecured loans and student loans. Exclude mortgages, vehicle asset finance and debt recovery loans. Note**: The analysis focuses on the sample of borrowers with no home loan because only 1% of those eligible for debt intervention have a mortgage NUMBER OF BORROWERS THAT COULD BE ELIGIBLE FOR DEBT INTERVENTION Based on the income estimates, approximately 9 million borrowers could potentially meet the eligibility criteria for debt intervention as per the draft bill<br>
slide16. In total borrowers that could qualify for debt review hold over 16 million loans. Twenty nine per cent of these loans (4.7 million) are three months or more in arrears 16 LOANS HELD BY BORROWERS THAT COULD QUALIFY FOR DEBT INTERVENTION Approximately 4.7 million loans are three months or more in arrears Source: Sample data - borrowers with no home loan<br>
slide17. There are approximately 4.7 million loans that are three months or more in arrears belonging to borrowers who could qualify for debt intervention. The total outstanding balance on these loans is around R20.7 billion 17 LOANS THAT ARE 3 MONTHS OR MORE IN ARREARS
(Approximately 4.7 million loans that are three months or more in arrears in the “Debt Intervention” segment) Source: Sample data - borrowers with no home loan NUMBER OF LOANS
(Millions of loans) VALUE OF DEBT OUTSTANDING
(R Billions)<br>
slide18. The target market is dominated by women. An analysis of the employer field as well as the identification of possible loans granted by Net1 subsidiaries indicates that around 19% receive a government grant 18 AGE GROUP PROVINCE GENDER INCOME GROUP Source: Sample data - borrowers with no home loan Note* Potential grant recipients are likely understated, based on an analysis of the employer data field and by identifying loans granted by Net 1 subsidiaries BORROWERS THAT COULD QUALIFY FOR DEBT INTERVENTION 22% 11% 12% 8% 6% 5% 5% 5% 2% Unknown:
23% Total borrowers found in sample: 68,722 Estimated borrowers in the total population that could qualify for debt intervention: POTENTIAL GRANT RECIPIENT* NINE MILLION BORROWERS<br>
slide19. More than half of borrowers in the segment have only one open account, dominated by retail apparel accounts and unsecured loans. Thirty nine per cent of borrowers in the segment are three months or more in arrears on at least one loan 19 NUMBER OF OPEN ACCOUNTS PRODUCT PENETRATION % 90 DAYS + Avg. number of accounts in-force 1.9 PRESAGE SCORE Source: Sample data - borrowers with no home loan<br>
slide20. For borrowers in the segment with just one open account, 63% are current on the account (less than three months in arrears). For borrowers with two or more accounts, just under half (46%) are current on all of their accounts. While some are in arrears on all accounts, most are up to date on some 1 CREDIT PRODUCT ONLY
(56%) 2+ CREDIT PRODUCTS
( 44%) 37% 63% 54% 25% 5% 16% PROPORTION OF LOANS IN ARREARS
(68,722 sampled borrowers that could qualify for debt intervention. Approximately 9 million borrowers in the total population) Source: Sample data - borrowers with no home loan While these borrowers are in arrears on some loans, they have capacity to pay 22 How many are paying something, but remain in arrears?<br>
slide21. Note*: Includes retail accounts, credit cards, unsecured loans and student loans. Exclude mortgages, vehicle asset finance and debt recovery loans BORROWERS THAT ARE ELIGIBLE FOR DEBT INTERVENTION There are 2.6 million borrowers that are eligible for debt relief that have at least one account that is three months or more in arrears CREDIT ACTIVE MARKET 19 NUMBER OF BORROWERS WITH LOANS THAT ARE 3 MONTHS + AND BORROWER IS IN ARREARS ON ALL OTHER LOANS HELD 3.5 2.6 3.3 million loans
R14.7 bn outstanding debt (excl. debt recovery loans) 4.4 million loans
R19.2 bn outstanding debt (excl. debt recovery loans) Is this a good proxy for borrowers who have no capacity to repay? NUMBER OF BORROWERS THAT COULD BE ELIGIBLE FOR DEBT INTERVENTION<br>
slide22. Of loans that were three months in arrears in June 2015, 34% had recovered fully or improved by June 2017 Is arrears status a good indication that the borrower cannot repay at all? Many loans that are in arrears will improve or recover fully. However, later stage arrears loans are less likely to recover 22 CHANGE IN LOAN ARREARS STATUS BETWEEN JUNE 2015 AND JUNE 2017 BY INCOME GROUP: ALL BORROWERS Source: Sample data – no home loan
Note: The ‘Remained the same” category becomes less reliable as arrears status increases because lenders often do not update the arrears status once it reaches a certain point. Specifically at nine months in arrears. So that many loans are classified as nine months in arrears even if they go past this point LOANS HELD BY BORROWERS WITH AN INCOME OF R7,500 OR LESS LOANS HELD BY BORROWERS WITH AN INCOME OF R7,501 – R15,000 LOANS HELD BY BORROWERS WITH AN INCOME OF R15,001 + Number of months in arrears as at June 2015<br>
slide23. The likelihood of loans recovering or improving varies significantly by type of account RETAIL APPAREL ACCOUNTS CREDIT CARDS UNSECURED LOANS RETAIL FURNITURE ACCOUNTS Recovered fully Improved Remained the same Deteriorated CHANGE IN LOAN ARREARS STATUS BETWEEN JUNE 2015 AND JUNE 2017 BY ACCOUNT TYPE: ALL BORROWERS Source: Sample data – no home loan 26<br>
slide24. Unsecured loans from a bank are most likely to be in very late stages of arrears. Much of this debt may be the African Bank bad book, and much of it may be prescribed. What impact do these loans have on the profile of the credit active base? VALUE OF OUTSTANDING DEBT BY ACCOUNT TYPE THREE MONTHS OR MORE IN ARREARS SIX MONTHS OR MORE NINE MONTHS OR MORE ~ R20.7 BN ~ R17.3 BN ~ R13.2 BN 27 Source: Sample data – no home loan<br>
slide25. These very late stage arrears loans have a material impact on the profile of borrowers who are credit active. If they are removed, the health of borrowers in South Africa appears more sound NONE HALF OR LESS MORE THAN HALF ALL 1 CREDIT PRODUCT ONLY
(56%) 2+ CREDIT PRODUCTS
( 44%) 1 CREDIT PRODUCT ONLY
(58%) 2+ CREDIT PRODUCTS
( 42%) 37% 63% 54% 25% 5% 16% 23% 77% 70% 21% 3% 6% CURRENT STATUS OF BORROWERS THAT MEET THE ELIGIBILITY CRITERIA 9 MILLION BORROWERS BORROWER STATUS IF LOANS THAT ARE NINE MONTHS OR MORE ARE REMOVED 7.9 MILLION BORROWERS
Note: 1.14 million borrowers fall away. These borrowers only have loans that are nine months or more in arrears PROPORTION OF LOANS IN ARREARS<br>
slide26. Note*: Includes retail accounts, credit cards, unsecured loans and student loans. Exclude mortgages, vehicle asset finance and debt recovery loans BORROWERS THAT ARE ELIGIBLE FOR DEBT INTERVENTION There are 1.5 million borrowers that are eligible for debt relief that have at least one account that is nine months or more in arrears and are not in arrears on all other loans held NUMBER OF BORROWERS THAT COULD BE ELIGIBLE FOR DEBT INTERVENTION CREDIT ACTIVE MARKET 19 NUMBER OF BORROWERS WITH LOANS THAT ARE 3 MONTHS + AND BORROWER IS IN ARREARS ON ALL OTHER LOANS HELD 3.5 2.6 3.3 million loans
R14.7 bn outstanding debt (excl. debt recovery loans) 4.4 million loans
R19.2 bn outstanding debt (excl. debt recovery loans) BORROWERS WITH LOANS THAT ARE 9 MONTHS +, AND IN ARREARS ON ALL OTHER LOANS HELD 1.5 1.7 million loans
R9.8 bn outstanding debt (excl. debt recovery loans)<br>
slide27. A further consideration is the debt burden Monthly debt repayments are calculated as the sum of expected instalments for all open credit products
While lenders report expected instalments to bureaus, bureau estimates of income are typically unreliable. Seven banks therefore provided income estimates for a sample of borrowers. Based on the data received from the banks a ‘best estimate’ of income was derived. Where no income bank estimate was provided, the XDS predicted income was used 30<br>
slide28. Debt burden profiles are fairly stable across lower to middle income segments, with around 35% allocating in excess of 30% of their gross monthly incomes to paying debt. How much can lower income borrowers afford? 28 DISTRIBUTION OF DEBT BURDENS BY INCOME GROUP Source: Sample data - borrowers with no home loan<br>
slide29. There is a relationship between arrears status and debt burden. Borrowers with higher debt burdens are more likely to be in arrears on at least one product. However, many highly indebted consumers are able to pay something 29 DEBT BURDEN BY PROPORTION OF ACCOUNTS IN ARREARS OF THREE MONTHS OR MORE: ALL BORROWERS Source: Sample data - borrowers with no home loan ONE LOAN TWO OR MORE LOANS Debt burden None Half or less More than half All Of borrowers with one loan that have a debt burden of less than 0.1, 70% are current on this loan, for those with a debt burden of 1 or more, just 30% are current on this loan Of borrowers with two or more loans that have a debt burden of less than 0.1, 72% are current all their loans, for those with a debt burden of 1 or more, just 37% are current on all their loans<br>
slide30. In summary: It is critical to understand borrower incomes – we have some indications but these need to be verified
It is critical to understand collectable debt – we have some indications but these need to be engaged with
It is critical to understand ability (as opposed to willingness) to pay, and to identify those who cannot pay – we have some indication that many borrowers who are in arrears have capacity to pay something. What process exists for these borrowers?
It is also useful to think carefully about how this intervention will be assessed going forward. What are the key indicators we hope will shift?<br>