
Financial Analysis What is Financial Analysis?
Description: Financial Analysis What is Financial Analysis? Using financial tools: Enterprise budgets Balance sheets Income statements To identify a business strengths and weaknesses Helps the manager improve the business Why is it Necessary? Financial
Related Topics
Download Presentation
"Financial Analysis What is Financial Analysis?" is the property of its rightful owner. Permission is granted to download and print the materials on this website for personal, non-commercial use only, and to display it on your personal computer provided you do not modify the materials and that you retain all copyright notices contained in the materials. By downloading content from our website, you accept the terms of this agreement.
Presentation Transcript
slide1. Financial Analysis<br>
slide2. What is Financial Analysis? Using financial tools:
Enterprise budgets
Balance sheets
Income statements
To identify a business’ strengths and weaknesses
Helps the manager improve the business<br>
slide3. Why is it Necessary? Financial Analysis:
Helps a manager take actions to improve the business
Identifies potential problems before they occur
Helps lenders analyze loan applications for strengths, weaknesses, and risks
Helps the manager understand the business more fully<br>
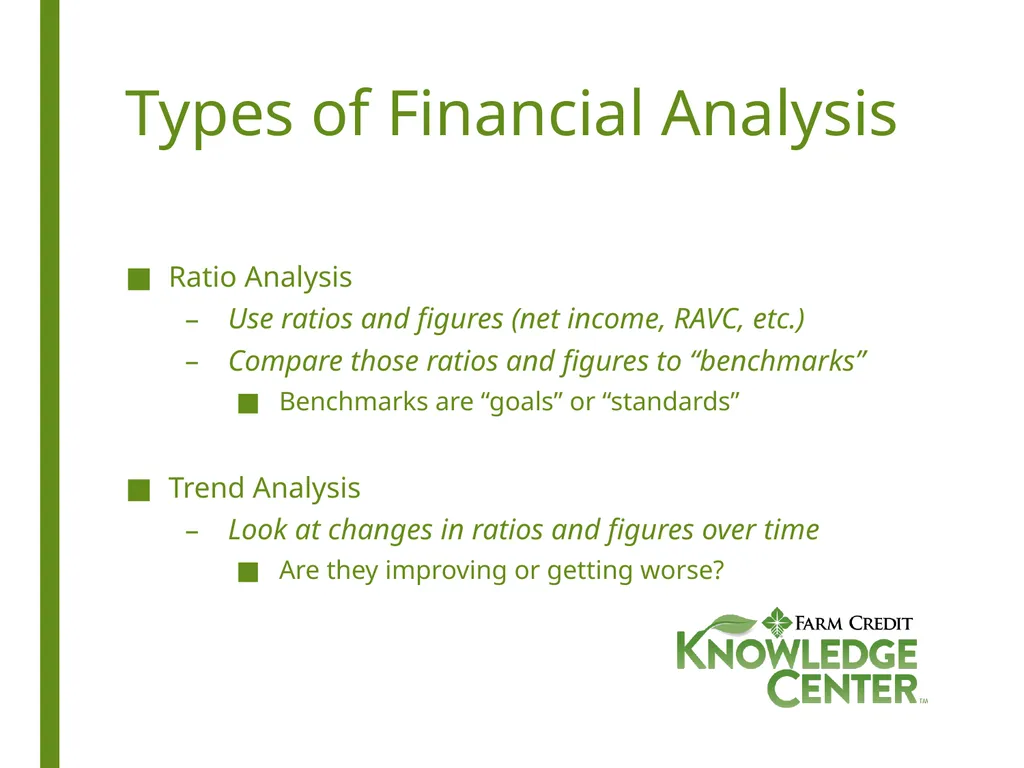
slide4. Types of Financial Analysis Ratio Analysis
Use ratios and figures (net income, RAVC, etc.)
Compare those ratios and figures to “benchmarks”
Benchmarks are “goals” or “standards”
Trend Analysis
Look at changes in ratios and figures over time
Are they improving or getting worse?<br>
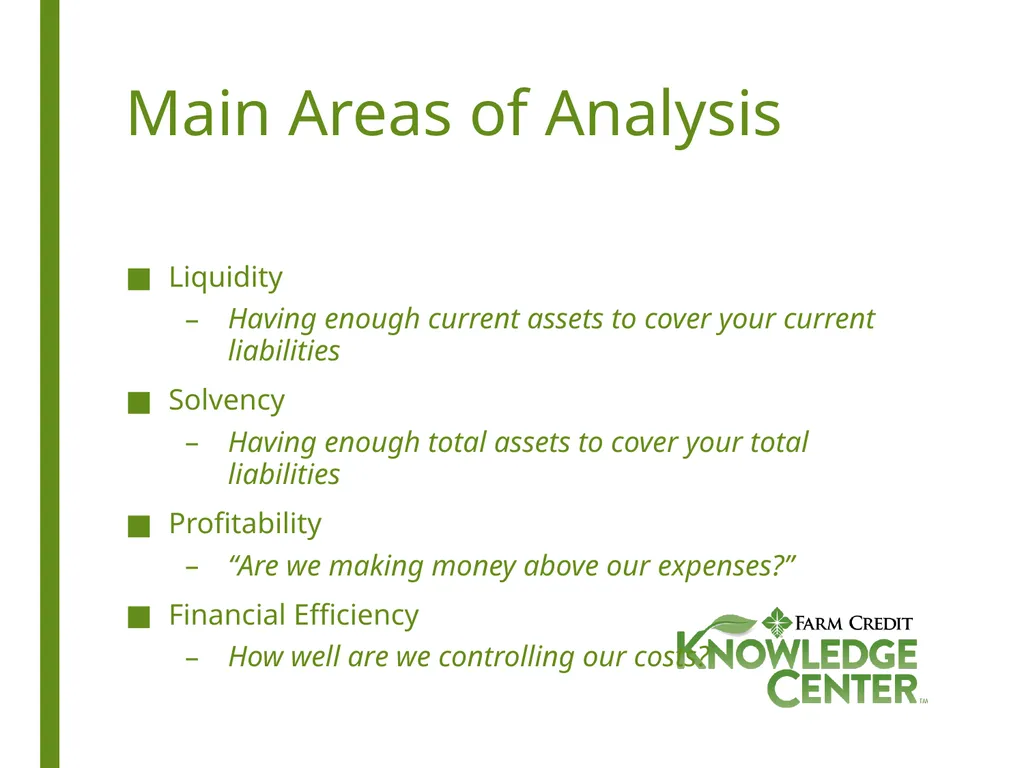
slide5. Main Areas of Analysis Liquidity
Having enough current assets to cover your current liabilities
Solvency
Having enough total assets to cover your total liabilities
Profitability
“Are we making money above our expenses?”
Financial Efficiency
How well are we controlling our costs?<br>
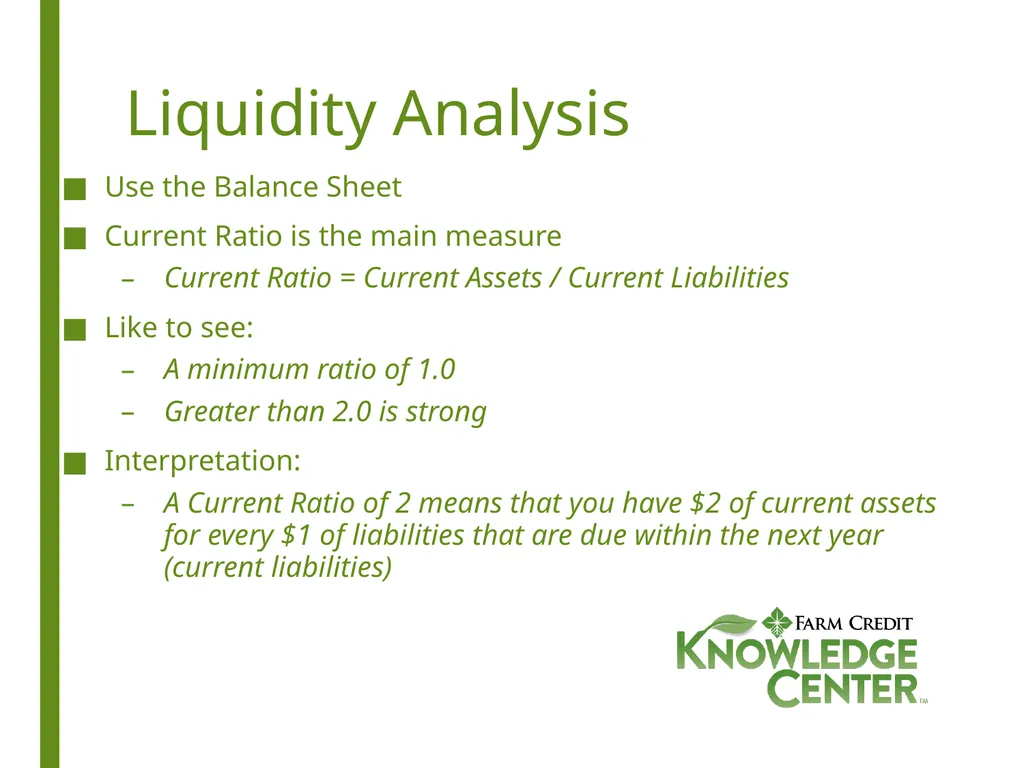
slide6. Liquidity Analysis Use the Balance Sheet
Current Ratio is the main measure
Current Ratio = Current Assets / Current Liabilities
Like to see:
A minimum ratio of 1.0
Greater than 2.0 is strong
Interpretation:
A Current Ratio of 2 means that you have $2 of current assets for every $1 of liabilities that are due within the next year (current liabilities)<br>
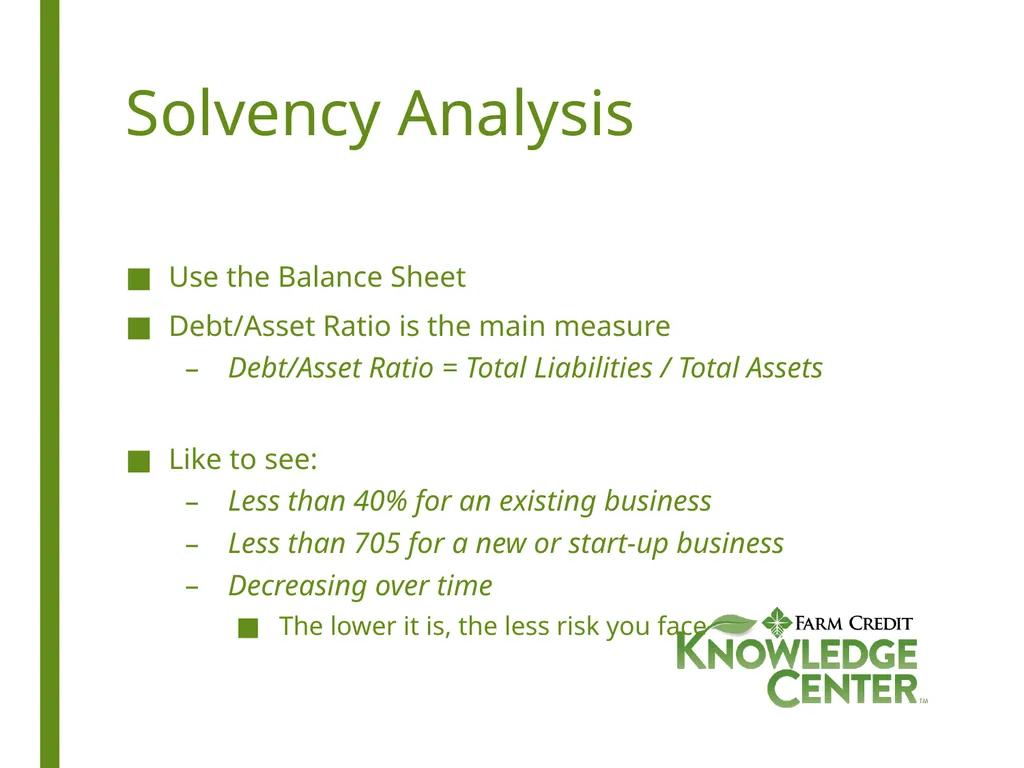
slide7. Solvency Analysis Use the Balance Sheet
Debt/Asset Ratio is the main measure
Debt/Asset Ratio = Total Liabilities / Total Assets
Like to see:
Less than 40% for an existing business
Less than 705 for a new or start-up business
Decreasing over time
The lower it is, the less risk you face<br>
slide8. Solvency Analysis Interpretation:
A Debt/Asset Ratio of 40% shows that you owe your lenders 40% of the value of your assets
Or – that you have paid for 60% of your assets
Another way to look at it:
Your lenders “own” 40% of your assets
You own 60% of your assets<br>
slide9. Profitability Analysis Use the Income Statement or Enterprise Budget
Gross Margin or Return Above Variable Costs
Net income or Return Above Total Costs
Also need the Balance Sheet
Main ratio is Rate of Return on Assets (ROA)
ROA = (Net Income + Interest) / Total Assets<br>
slide10. Profitability Analysis Like to see:
ROA > 0% at a minimum
ROA > interest rate (APR) on your loans
ROA > 8% is strong
Growing over time
The higher, the more profitable your business
Interpretation:
An ROA of 10% means that you earned $0.10 of profit for every $1 of asset used in your business.<br>
slide11. Financial Efficiency Analysis We’re just focusing on cost control here
Use the Income Statement
Operating Expense/Receipt Ratio
Op. Exp/Rec = (Total Exp. – Int. – Dep.) / Total Revenue
Like to see:
Less than 75%
Interpretation:
A ratio of 75% means that the business spends $0.75 in expenses to generate $1 of revenue<br>
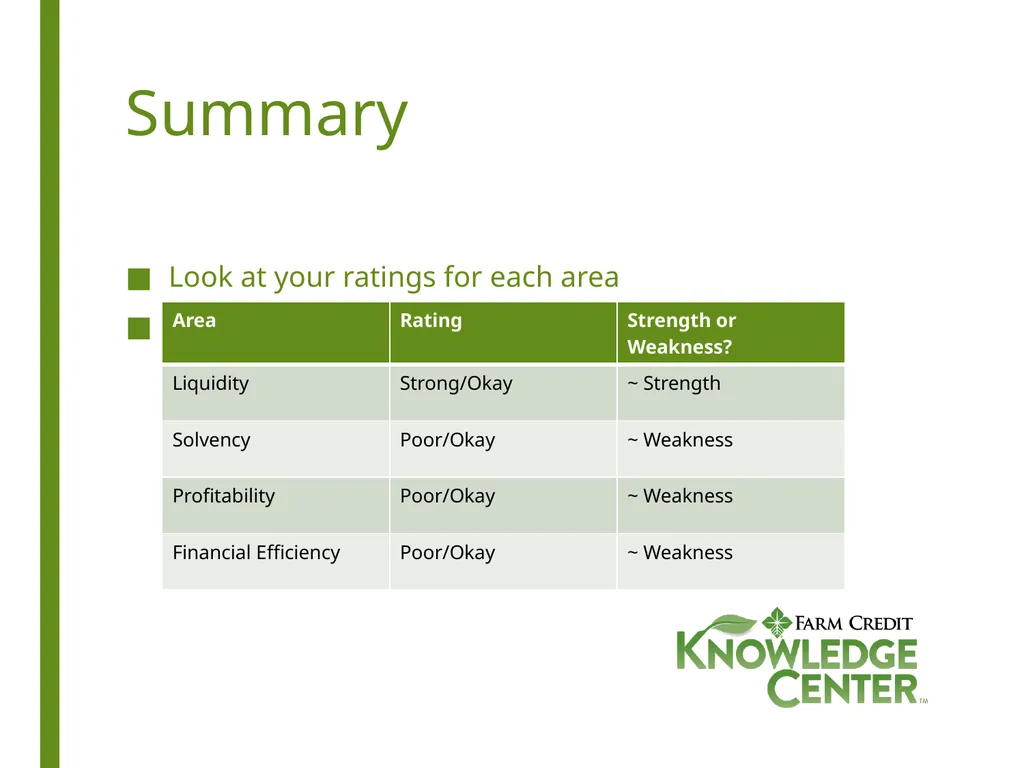
slide12. Summary Look at your ratings for each area
For the Floral Shop example:<br>
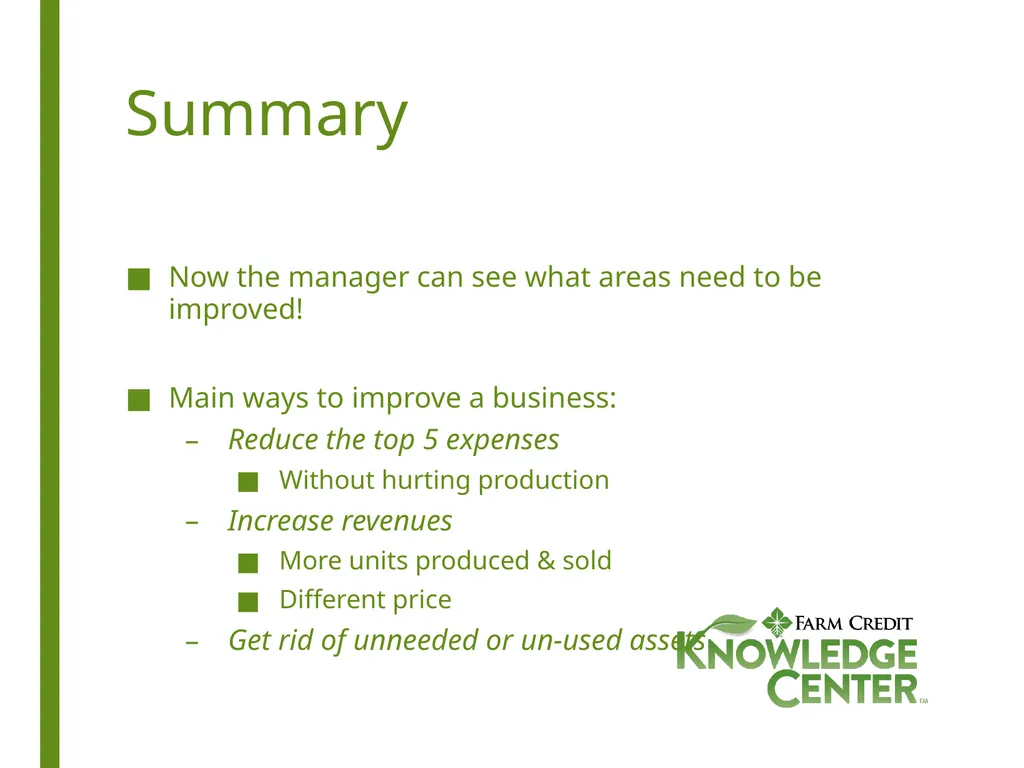
slide13. Summary Now the manager can see what areas need to be improved!
Main ways to improve a business:
Reduce the top 5 expenses
Without hurting production
Increase revenues
More units produced & sold
Different price
Get rid of unneeded or un-used assets<br>
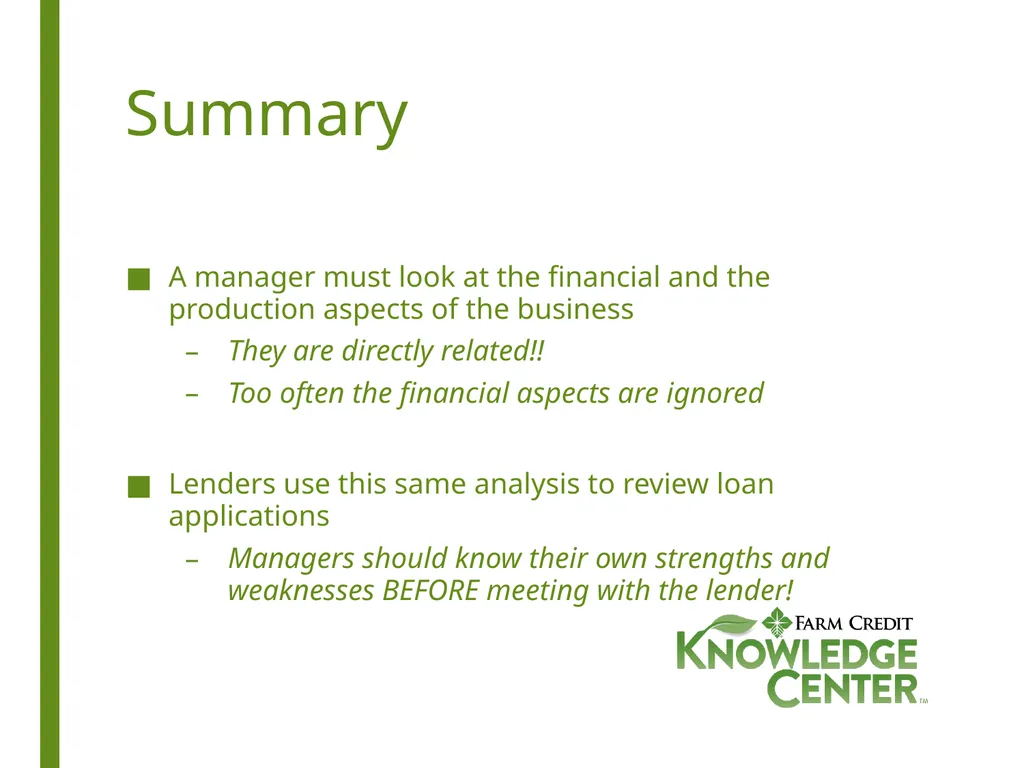
slide14. Summary A manager must look at the financial and the production aspects of the business
They are directly related!!
Too often the financial aspects are ignored
Lenders use this same analysis to review loan applications
Managers should know their own strengths and weaknesses BEFORE meeting with the lender!<br>
slide2. What is Financial Analysis? Using financial tools:
Enterprise budgets
Balance sheets
Income statements
To identify a business’ strengths and weaknesses
Helps the manager improve the business<br>
slide3. Why is it Necessary? Financial Analysis:
Helps a manager take actions to improve the business
Identifies potential problems before they occur
Helps lenders analyze loan applications for strengths, weaknesses, and risks
Helps the manager understand the business more fully<br>
slide4. Types of Financial Analysis Ratio Analysis
Use ratios and figures (net income, RAVC, etc.)
Compare those ratios and figures to “benchmarks”
Benchmarks are “goals” or “standards”
Trend Analysis
Look at changes in ratios and figures over time
Are they improving or getting worse?<br>
slide5. Main Areas of Analysis Liquidity
Having enough current assets to cover your current liabilities
Solvency
Having enough total assets to cover your total liabilities
Profitability
“Are we making money above our expenses?”
Financial Efficiency
How well are we controlling our costs?<br>
slide6. Liquidity Analysis Use the Balance Sheet
Current Ratio is the main measure
Current Ratio = Current Assets / Current Liabilities
Like to see:
A minimum ratio of 1.0
Greater than 2.0 is strong
Interpretation:
A Current Ratio of 2 means that you have $2 of current assets for every $1 of liabilities that are due within the next year (current liabilities)<br>
slide7. Solvency Analysis Use the Balance Sheet
Debt/Asset Ratio is the main measure
Debt/Asset Ratio = Total Liabilities / Total Assets
Like to see:
Less than 40% for an existing business
Less than 705 for a new or start-up business
Decreasing over time
The lower it is, the less risk you face<br>
slide8. Solvency Analysis Interpretation:
A Debt/Asset Ratio of 40% shows that you owe your lenders 40% of the value of your assets
Or – that you have paid for 60% of your assets
Another way to look at it:
Your lenders “own” 40% of your assets
You own 60% of your assets<br>
slide9. Profitability Analysis Use the Income Statement or Enterprise Budget
Gross Margin or Return Above Variable Costs
Net income or Return Above Total Costs
Also need the Balance Sheet
Main ratio is Rate of Return on Assets (ROA)
ROA = (Net Income + Interest) / Total Assets<br>
slide10. Profitability Analysis Like to see:
ROA > 0% at a minimum
ROA > interest rate (APR) on your loans
ROA > 8% is strong
Growing over time
The higher, the more profitable your business
Interpretation:
An ROA of 10% means that you earned $0.10 of profit for every $1 of asset used in your business.<br>
slide11. Financial Efficiency Analysis We’re just focusing on cost control here
Use the Income Statement
Operating Expense/Receipt Ratio
Op. Exp/Rec = (Total Exp. – Int. – Dep.) / Total Revenue
Like to see:
Less than 75%
Interpretation:
A ratio of 75% means that the business spends $0.75 in expenses to generate $1 of revenue<br>
slide12. Summary Look at your ratings for each area
For the Floral Shop example:<br>
slide13. Summary Now the manager can see what areas need to be improved!
Main ways to improve a business:
Reduce the top 5 expenses
Without hurting production
Increase revenues
More units produced & sold
Different price
Get rid of unneeded or un-used assets<br>
slide14. Summary A manager must look at the financial and the production aspects of the business
They are directly related!!
Too often the financial aspects are ignored
Lenders use this same analysis to review loan applications
Managers should know their own strengths and weaknesses BEFORE meeting with the lender!<br>